Appendix B contains discussions of ana
l
ytical
procedures used
in
our
engineering analyses. Appendix C
contains a positioning
report
by
Fugro
Chance,
I
nc.,
of
Lafayette, Louisiana
.
•
For the purposes
of discussion and presentation, "driven pipe
pile"
is
used
in
this report
to represent
foundation piles,
caissons and conductors,
unless otherwise
specified.
2.2 FIELD AND LABORATORY
INVESTIGATIONS
The field investigation
was
performed
on Ju
l
y
4
through 6, 2008,
from the
RN
Seaprobe.
The
soil
cond
itio
ns were
determined
by performing
four exploratory borings
,
two at each
SPM location with
one
boring
at
a
selected
anchor
l
eg location, and one
boring
at
the
proposed
PLET location. Enterprise
Field
Services selected
the
boring
locations. These
borings were
drilled to
a penetration of 131-ft
below
mudline.
The water
depths
at
the boring locations ranged from 123 to 125
ft. A chronological summary
of
field
operations
is
presented
in
Appendix
A.
2.2.1
Exploratory Borings
FMMG
personnel
drilled
the
so
il
borings with a
OMX
drill
rig
positioned over
the
centerwell of
the
RN
Seaprobe.
The
vesse
l
was anchored at
the
boring
location by
a 4-point mooring system.
Soil
conditions at
the
site were
exp
lored
by
drilling
a group
of four soil borings
to 131-ft
penetration below the
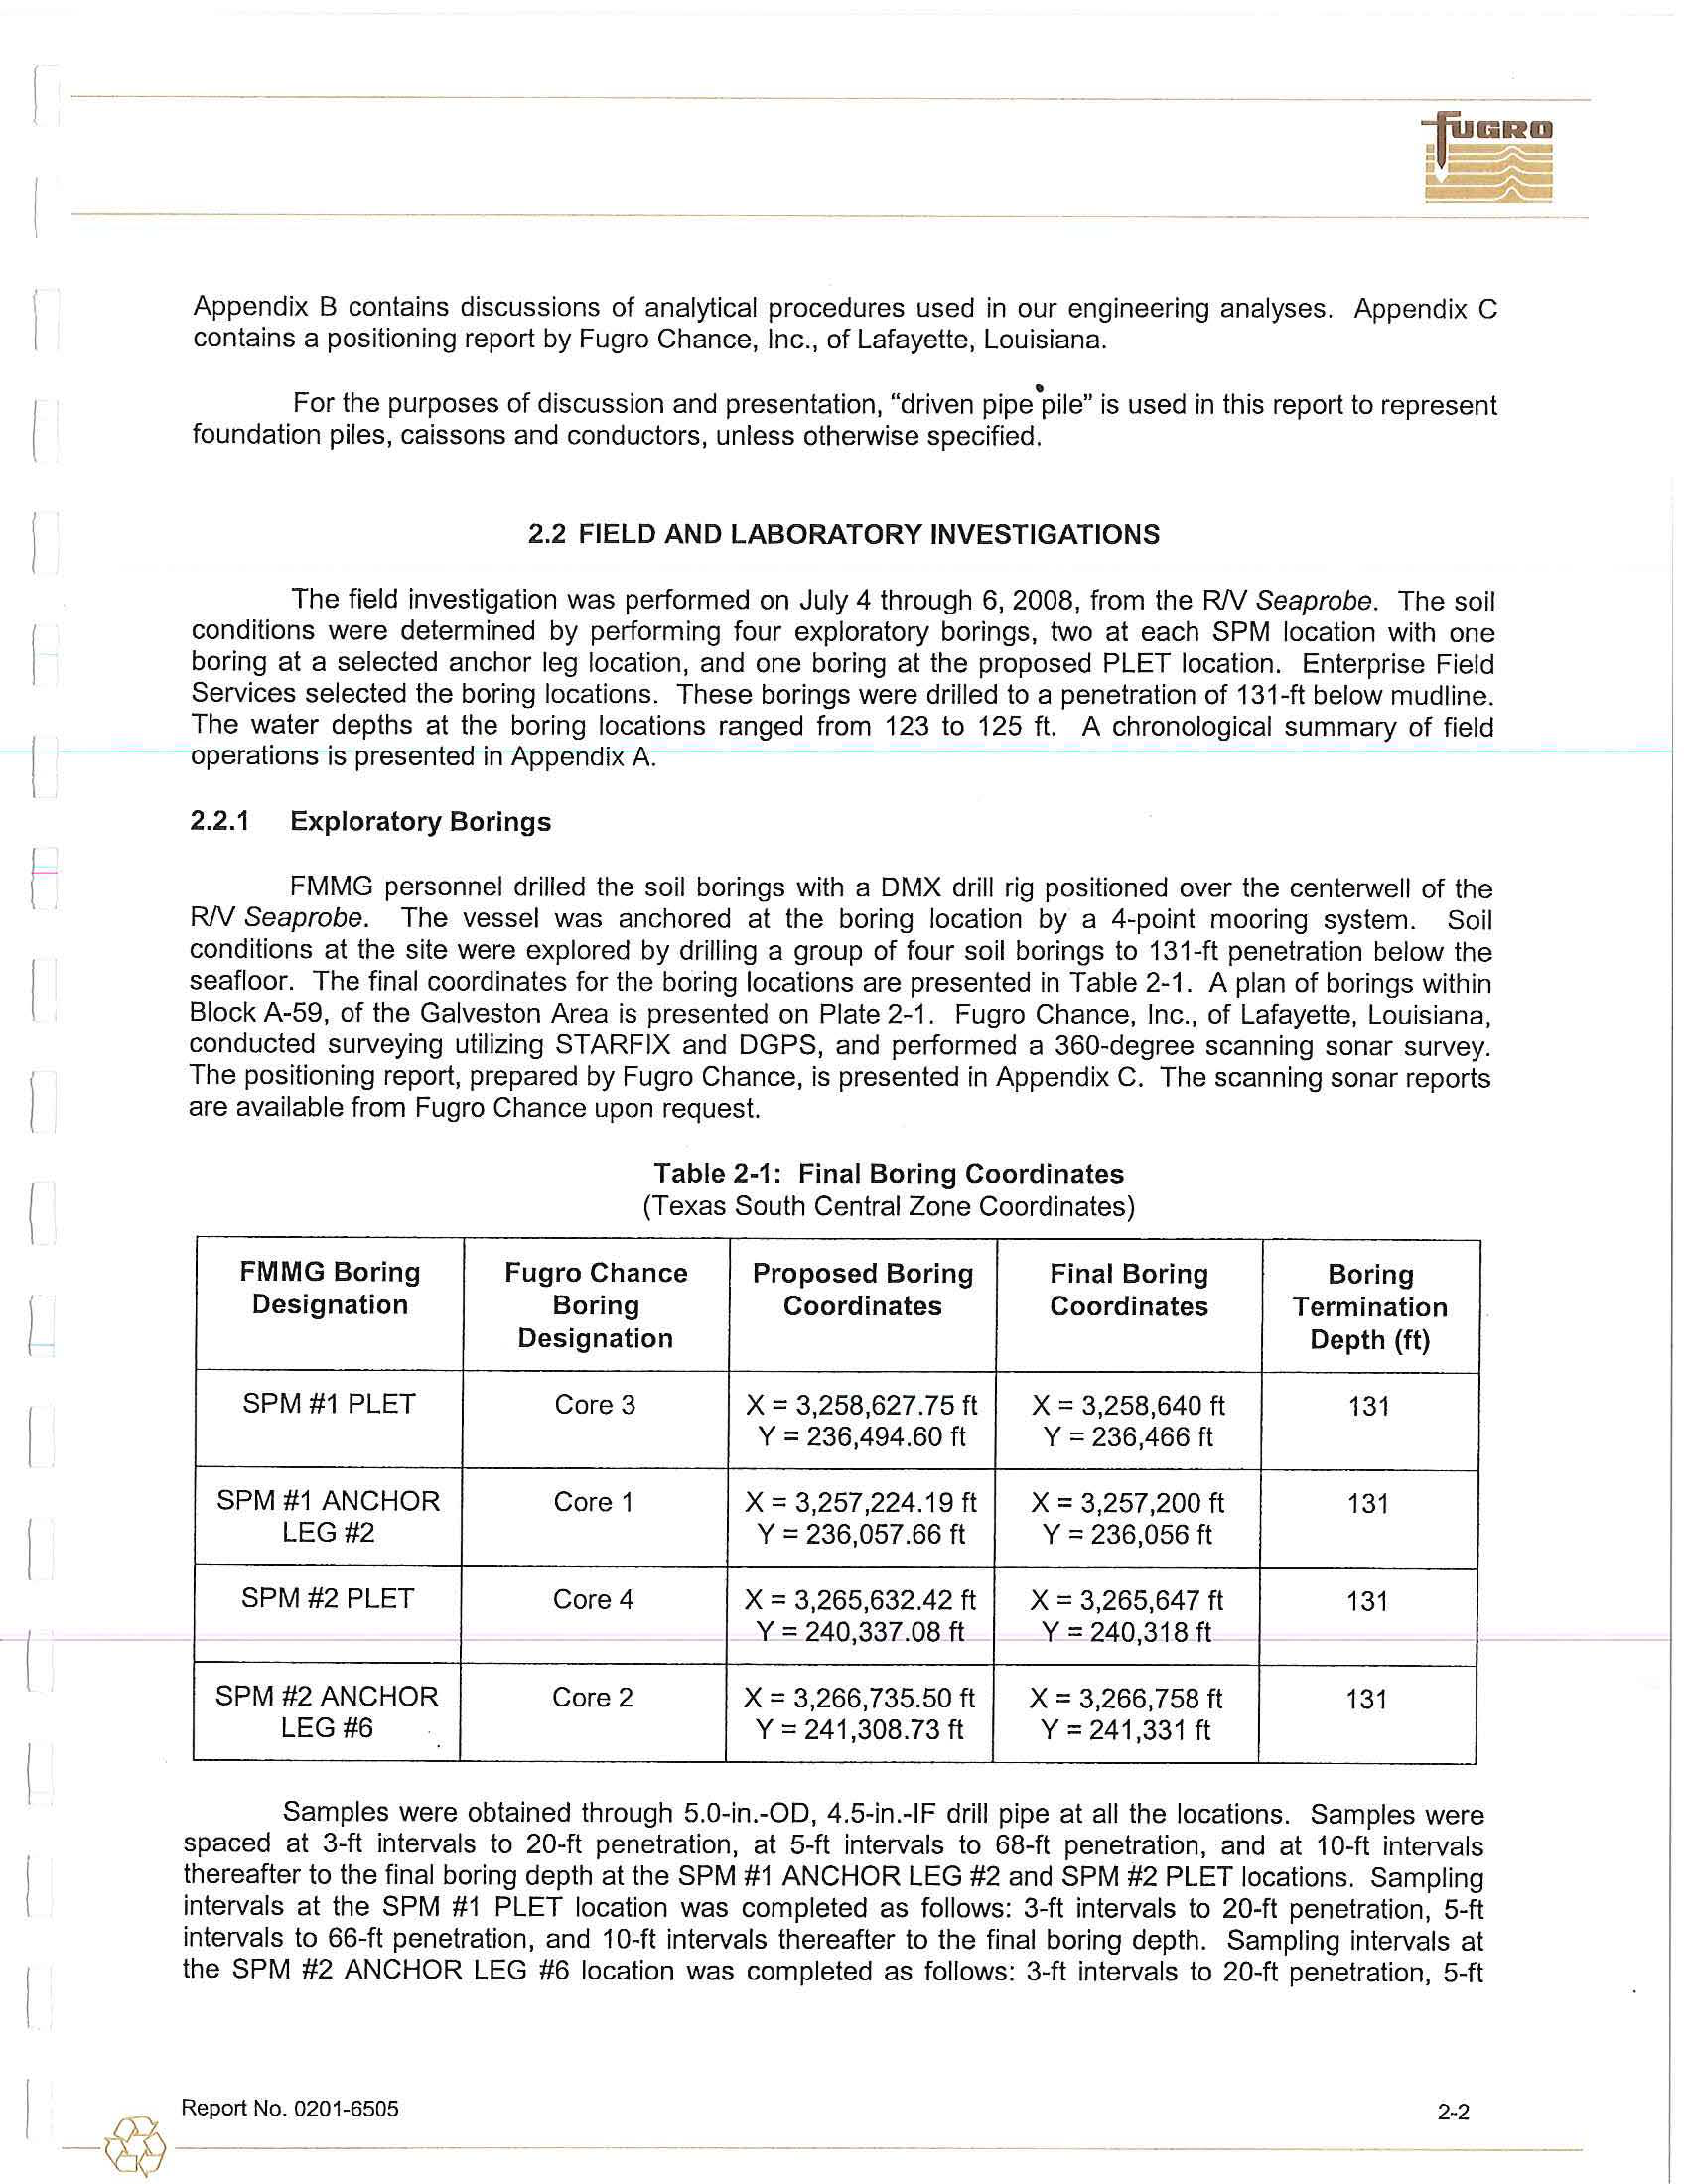
seafloor. The
final
coordinates for the boring
locations
are presented
in
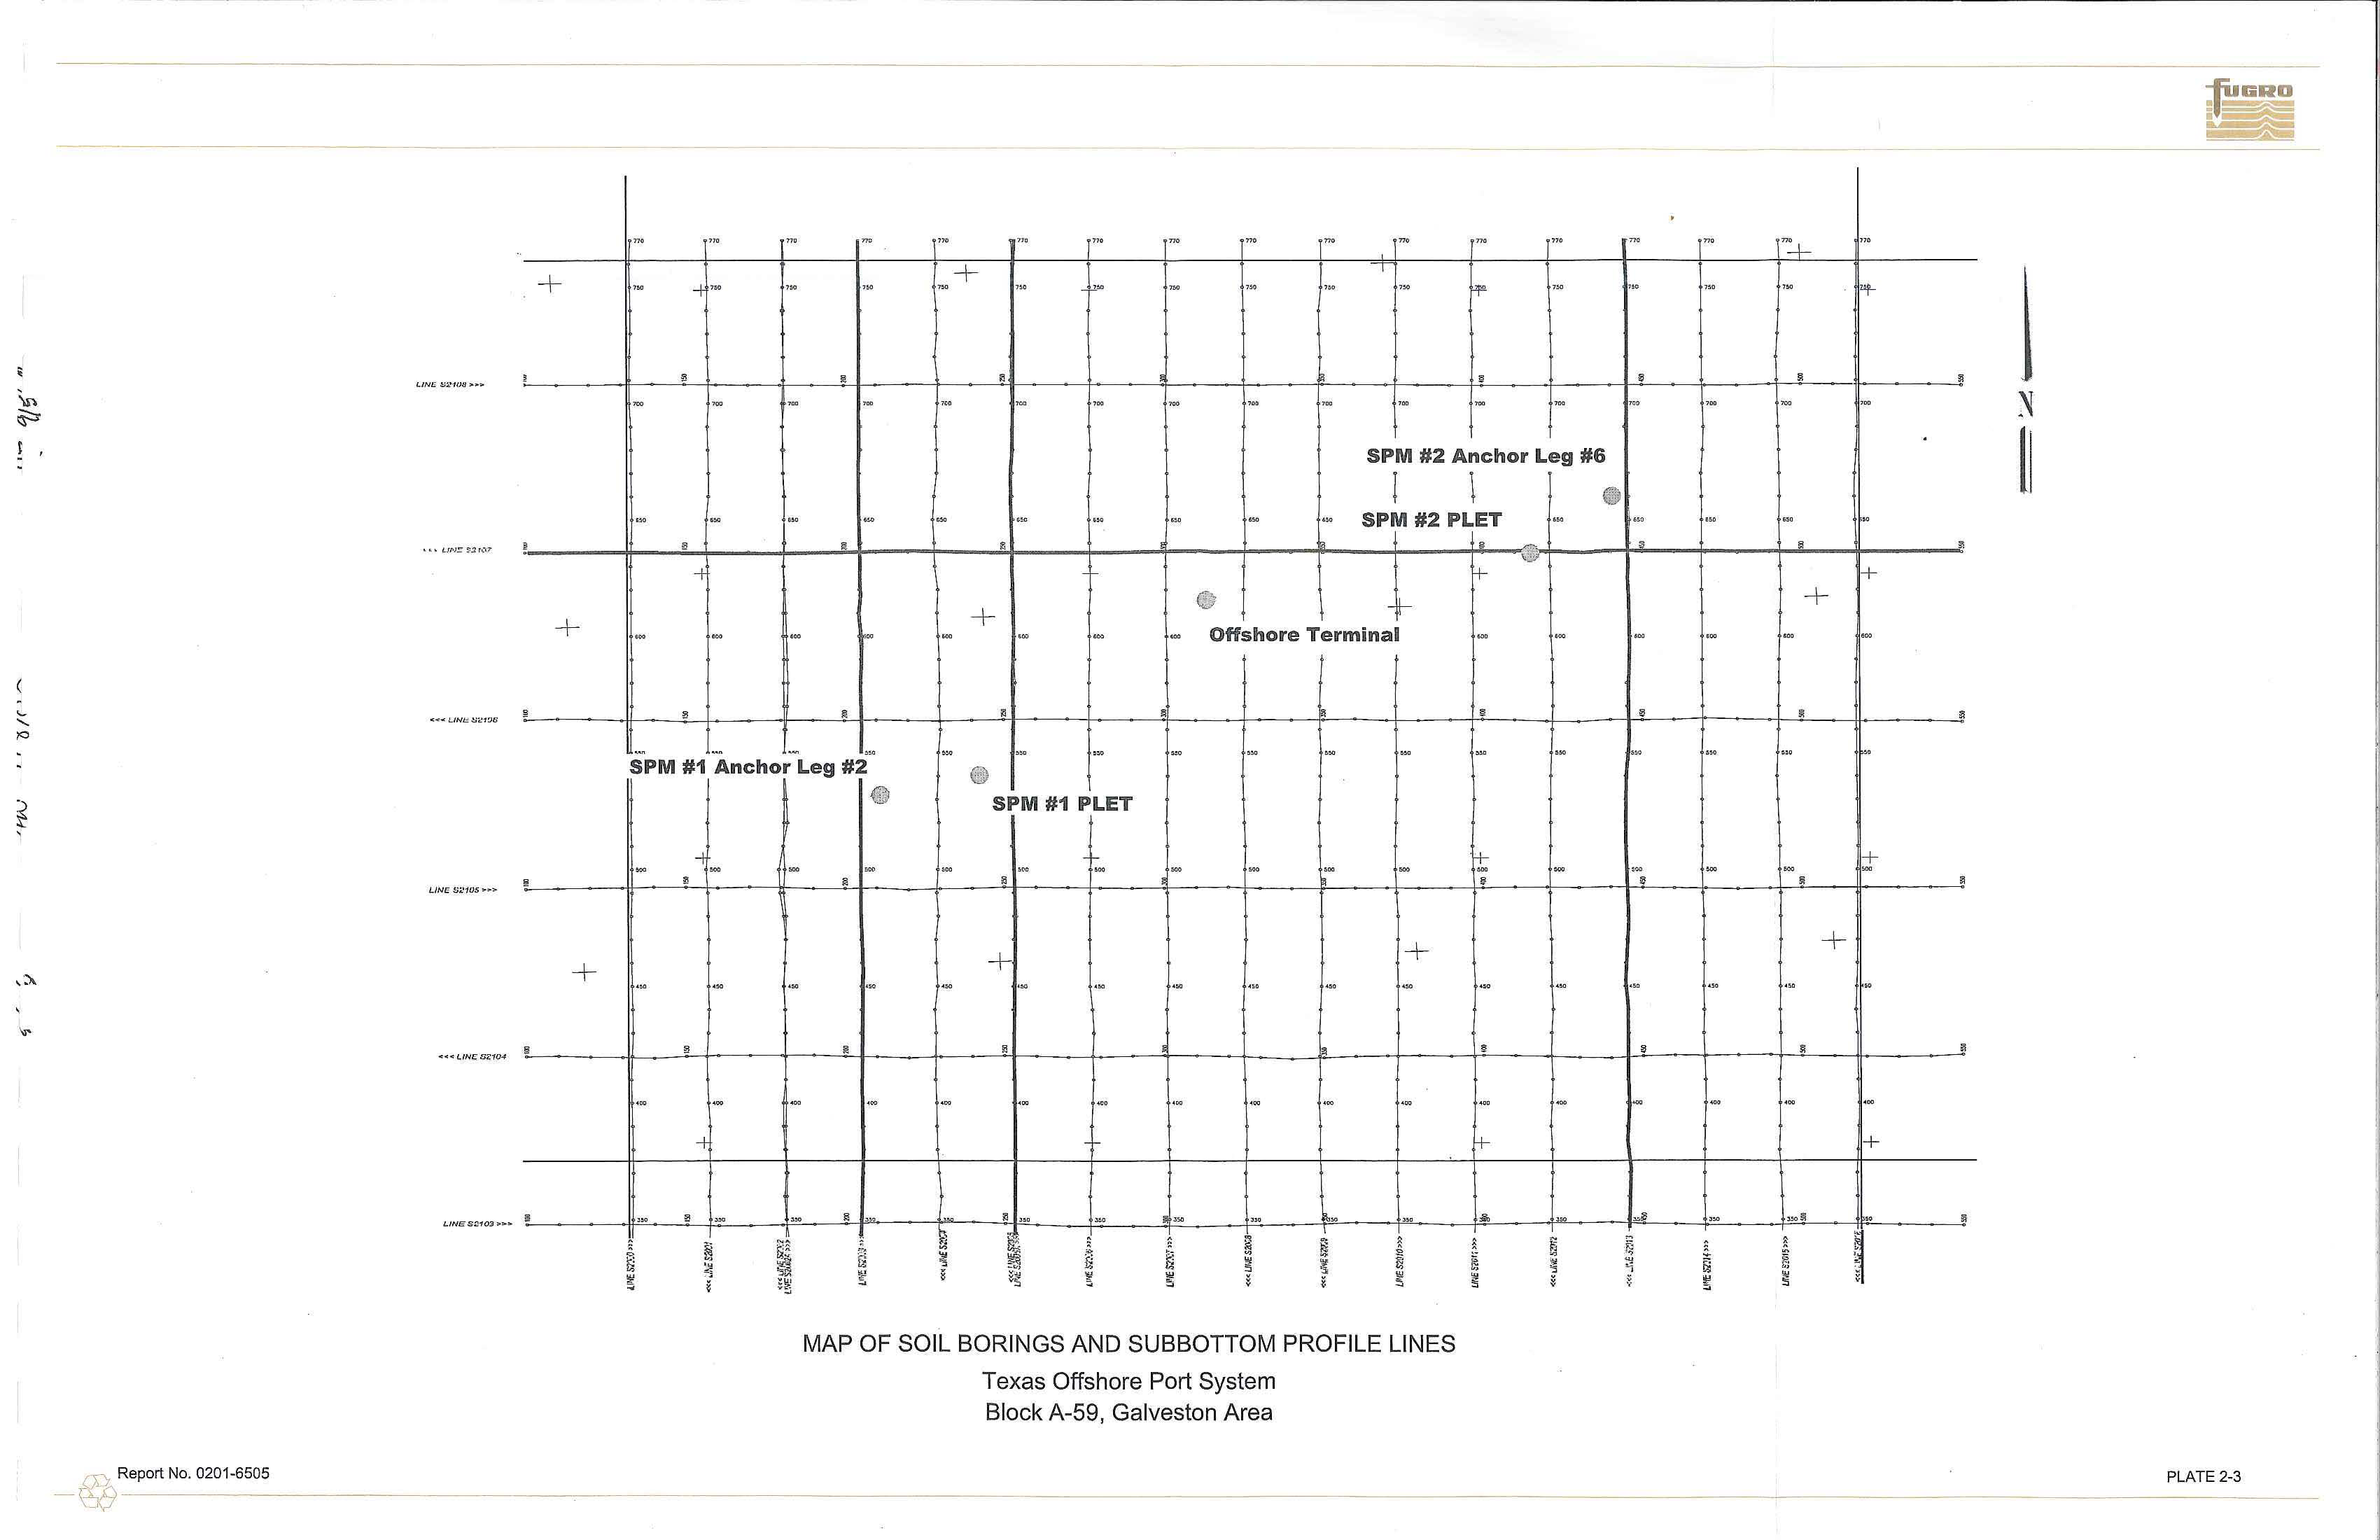
Table 2-1. A plan of borings within
Block A-59,
of
the
Galveston Area is presented on
Plate
2-1.
Fugro
Chance,
Inc.,
of
Lafayette, Louisiana
,
conducted surveying utilizing STARFIX and
DGPS,
and
performed
a 360-degree scanning sonar survey.
The
positioning report, prepared by
Fugro
Chance,
is
presented
in Appendix C.
The
scanning sonar
reports
are available from
Fugro
Chance
upon
request.
FMMG
Boring
Designation
SPM
#1 PLET
SPM #1 ANCHOR
LEG#2
SPM
#2 PLET
SPM #2
ANCHOR
LEG
#6
Table 2-1:
Final
Boring Coordinates
(Texas South Central Zone Coordinates)
Fugro
Chance
Proposed
Boring
Final Boring
Boring
Coordinates
Coordinates
Designation
Core 3
X
=
3,258,627
.
75
ft
X = 3,258,640
ft
Y =
236,494.60 ft
Y = 236,466
ft
Core
1
X = 3,257,224.19 ft
X = 3,257,200
ft
Y = 236,057.66
ft
Y
=
236,056 ft
Core4
X
=
3,265,632.42
ft
X
=
3,265,647
ft
Y
=
240,337.08 ft
Y = 240,318
ft
Core
2
X = 3,266,735.50
ft
X
=
3,266,
758 ft
Y
=
241,308.73
ft
Y
=
241,331
ft
Boring
Termination
Depth (ft)
131
131
131
131
Samples were
obtained through 5.0-in.-OD, 4.5-in.-lF drill pipe at all
the locations. Samples
were
spaced at 3-ft
intervals
to 20-ft
penetration,
at 5-ft
intervals
to
68-ft
penetration,
and at 10-ft intervals
thereafter to the final boring
depth at the
SPM
#1
ANCHOR LEG #2
and SPM #2
PLET locations
.
Sampling
intervals
at
the
SPM
#1 PLET location
was completed as follows: 3-ft
intervals to
20-ft penetration, 5-ft
intervals to
66-ft
penetration,
and 10-ft
intervals thereafter to the final
boring
depth
.
Sampling intervals
at
the SPM #2 ANCHOR
LEG
#6
l
ocation
was
completed as
follows
:
3-ft intervals
to
20-ft
penetration,
5-ft
I
-
@
-
R
-
e
-
po
_
rt
_
N
_
o
_
. 02
_ _
0
_
1-
-
6
-
50
-
5
2-2
------
intervals to 65-ft penetration, and 10-ft intervals thereafter
to
the final boring depth.
The drilling and
sampling techniques used to complete this boring are
exp
lain
ed
in
detail in Appendix
A.
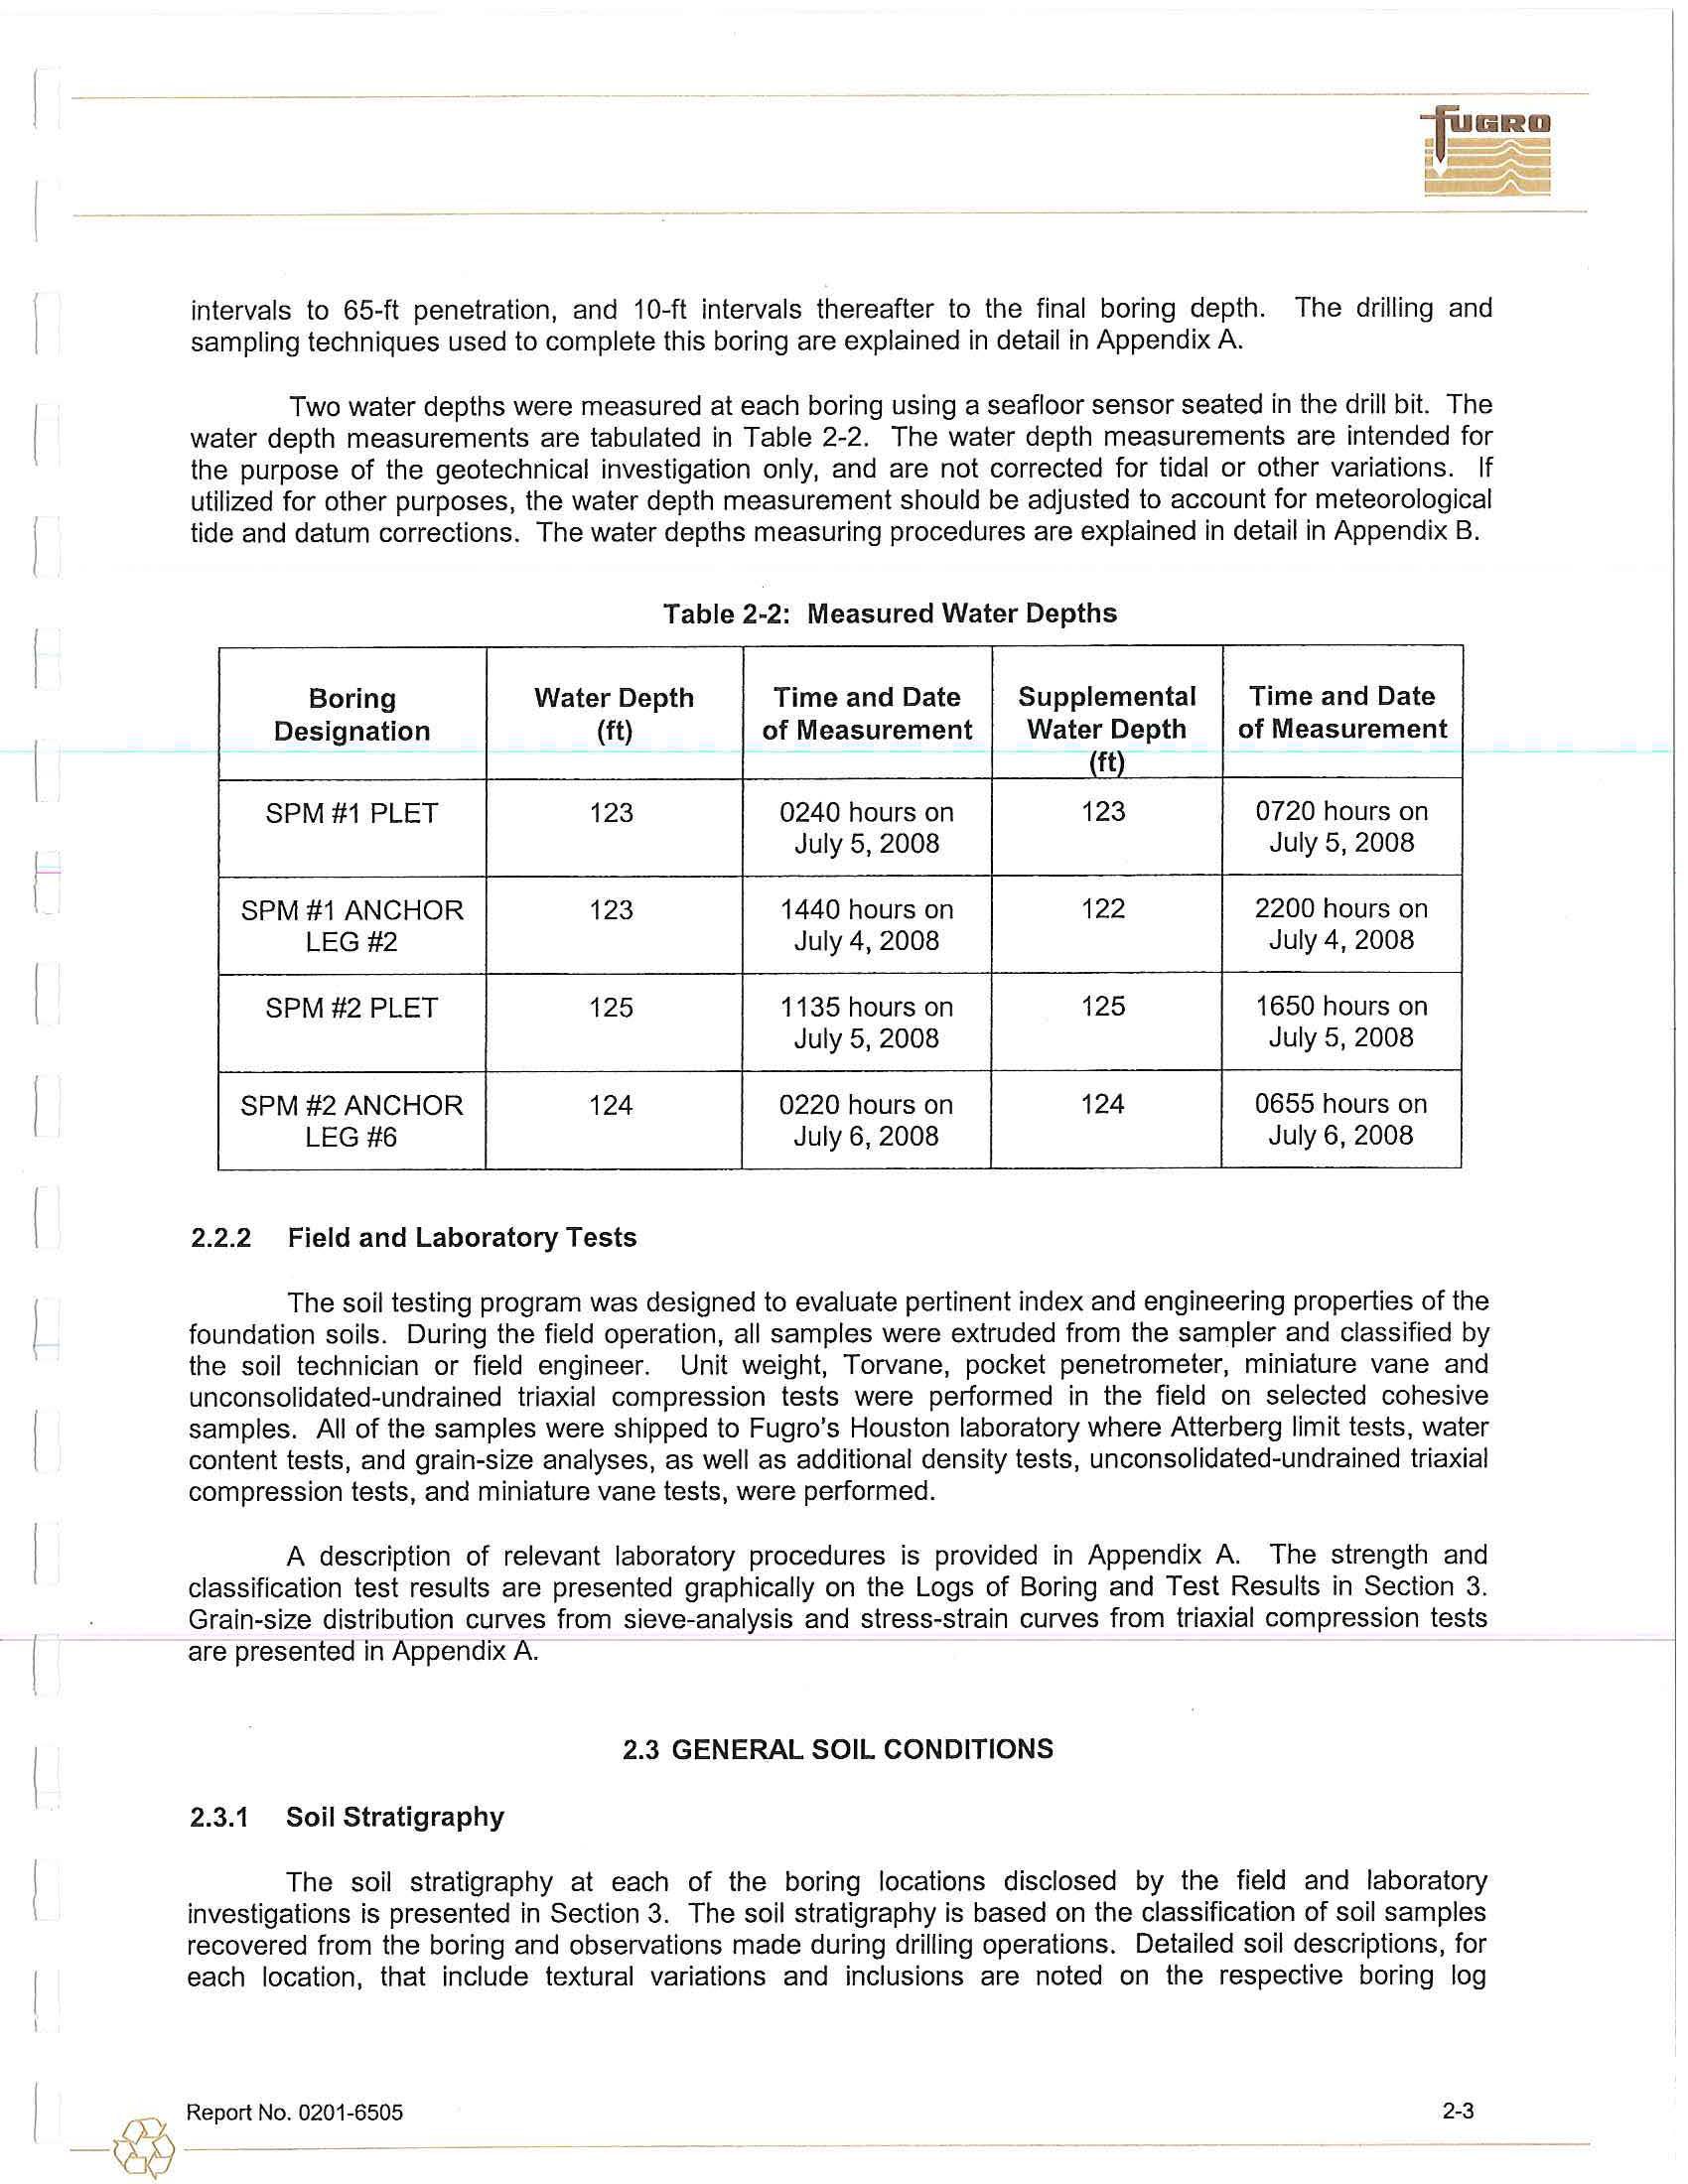
Two
wa
ter
depths were measured at each boring using a seafloor sensor seated in the drill
bit.
The
water depth measurements are
tabul
ated
in Table 2-2. The water depth measurements are intended for
the purpose of the geotechnical
in
vestigation
only, and are not corrected for tidal or other
va
riati
ons
. If
utilized for other purposes, the
water depth
measurement
should
be adjusted
to
account for meteorological
tide and datum corrections. The
water
depths measuring procedures are explained
in detail in Appendix B.
Table 2
-
2: Measured Water Depths
Boring
Water Depth
Time and Date
Supplemental
Time and Date
Designation
(ft)
of Measurement
Water Depth
of Measurement
(ft)
SPM #1 PLET
123
0240 hours
on
123
0720 hours on
July
5,
2008
July
5, 2008
SPM
#1 ANCHOR
123
1440 hours
on
122
2200
hours on
LEG #2
July
4, 2008
July 4, 2008
SPM
#2 PLET
125
1135 hours
on
125
1650 hours on
July
5,
2008
July
5, 2008
SPM #2 ANCHOR
124
0220 hours
on
124
0655 hours on
LEG
#6
July 6, 2008
July
6, 2008
2.2.2
Field and Laboratory Tests
The soil testing program was designed to evaluate pertinent index and engineering properties
of
the
foundation soils
.
During the field operation,
all samples were extruded from the sampler and classified
by
th
e soil
technician or field
eng
ineer
.
Unit weight, Torvane, pocket penetrometer, miniature vane and
unconsolidated-undrained triaxial compression tests
were
performed
in the field on selected cohesive
samples. All
of the samples were
shipped
to Fugro's Houston laboratory where Atterberg limit tests, water
content tests, and grain-size analyses, as well
as
additional density tests, unconsolidated-undrained triaxial
comp
ression
tests, and miniature
vane
tests, were performed.
A description of relevant
lab
ora
tory
procedures
i
s
provided in Appendix A.
The strength
and
classification test results are presented graphically
on the Logs of Boring and Test Results in Section
3.
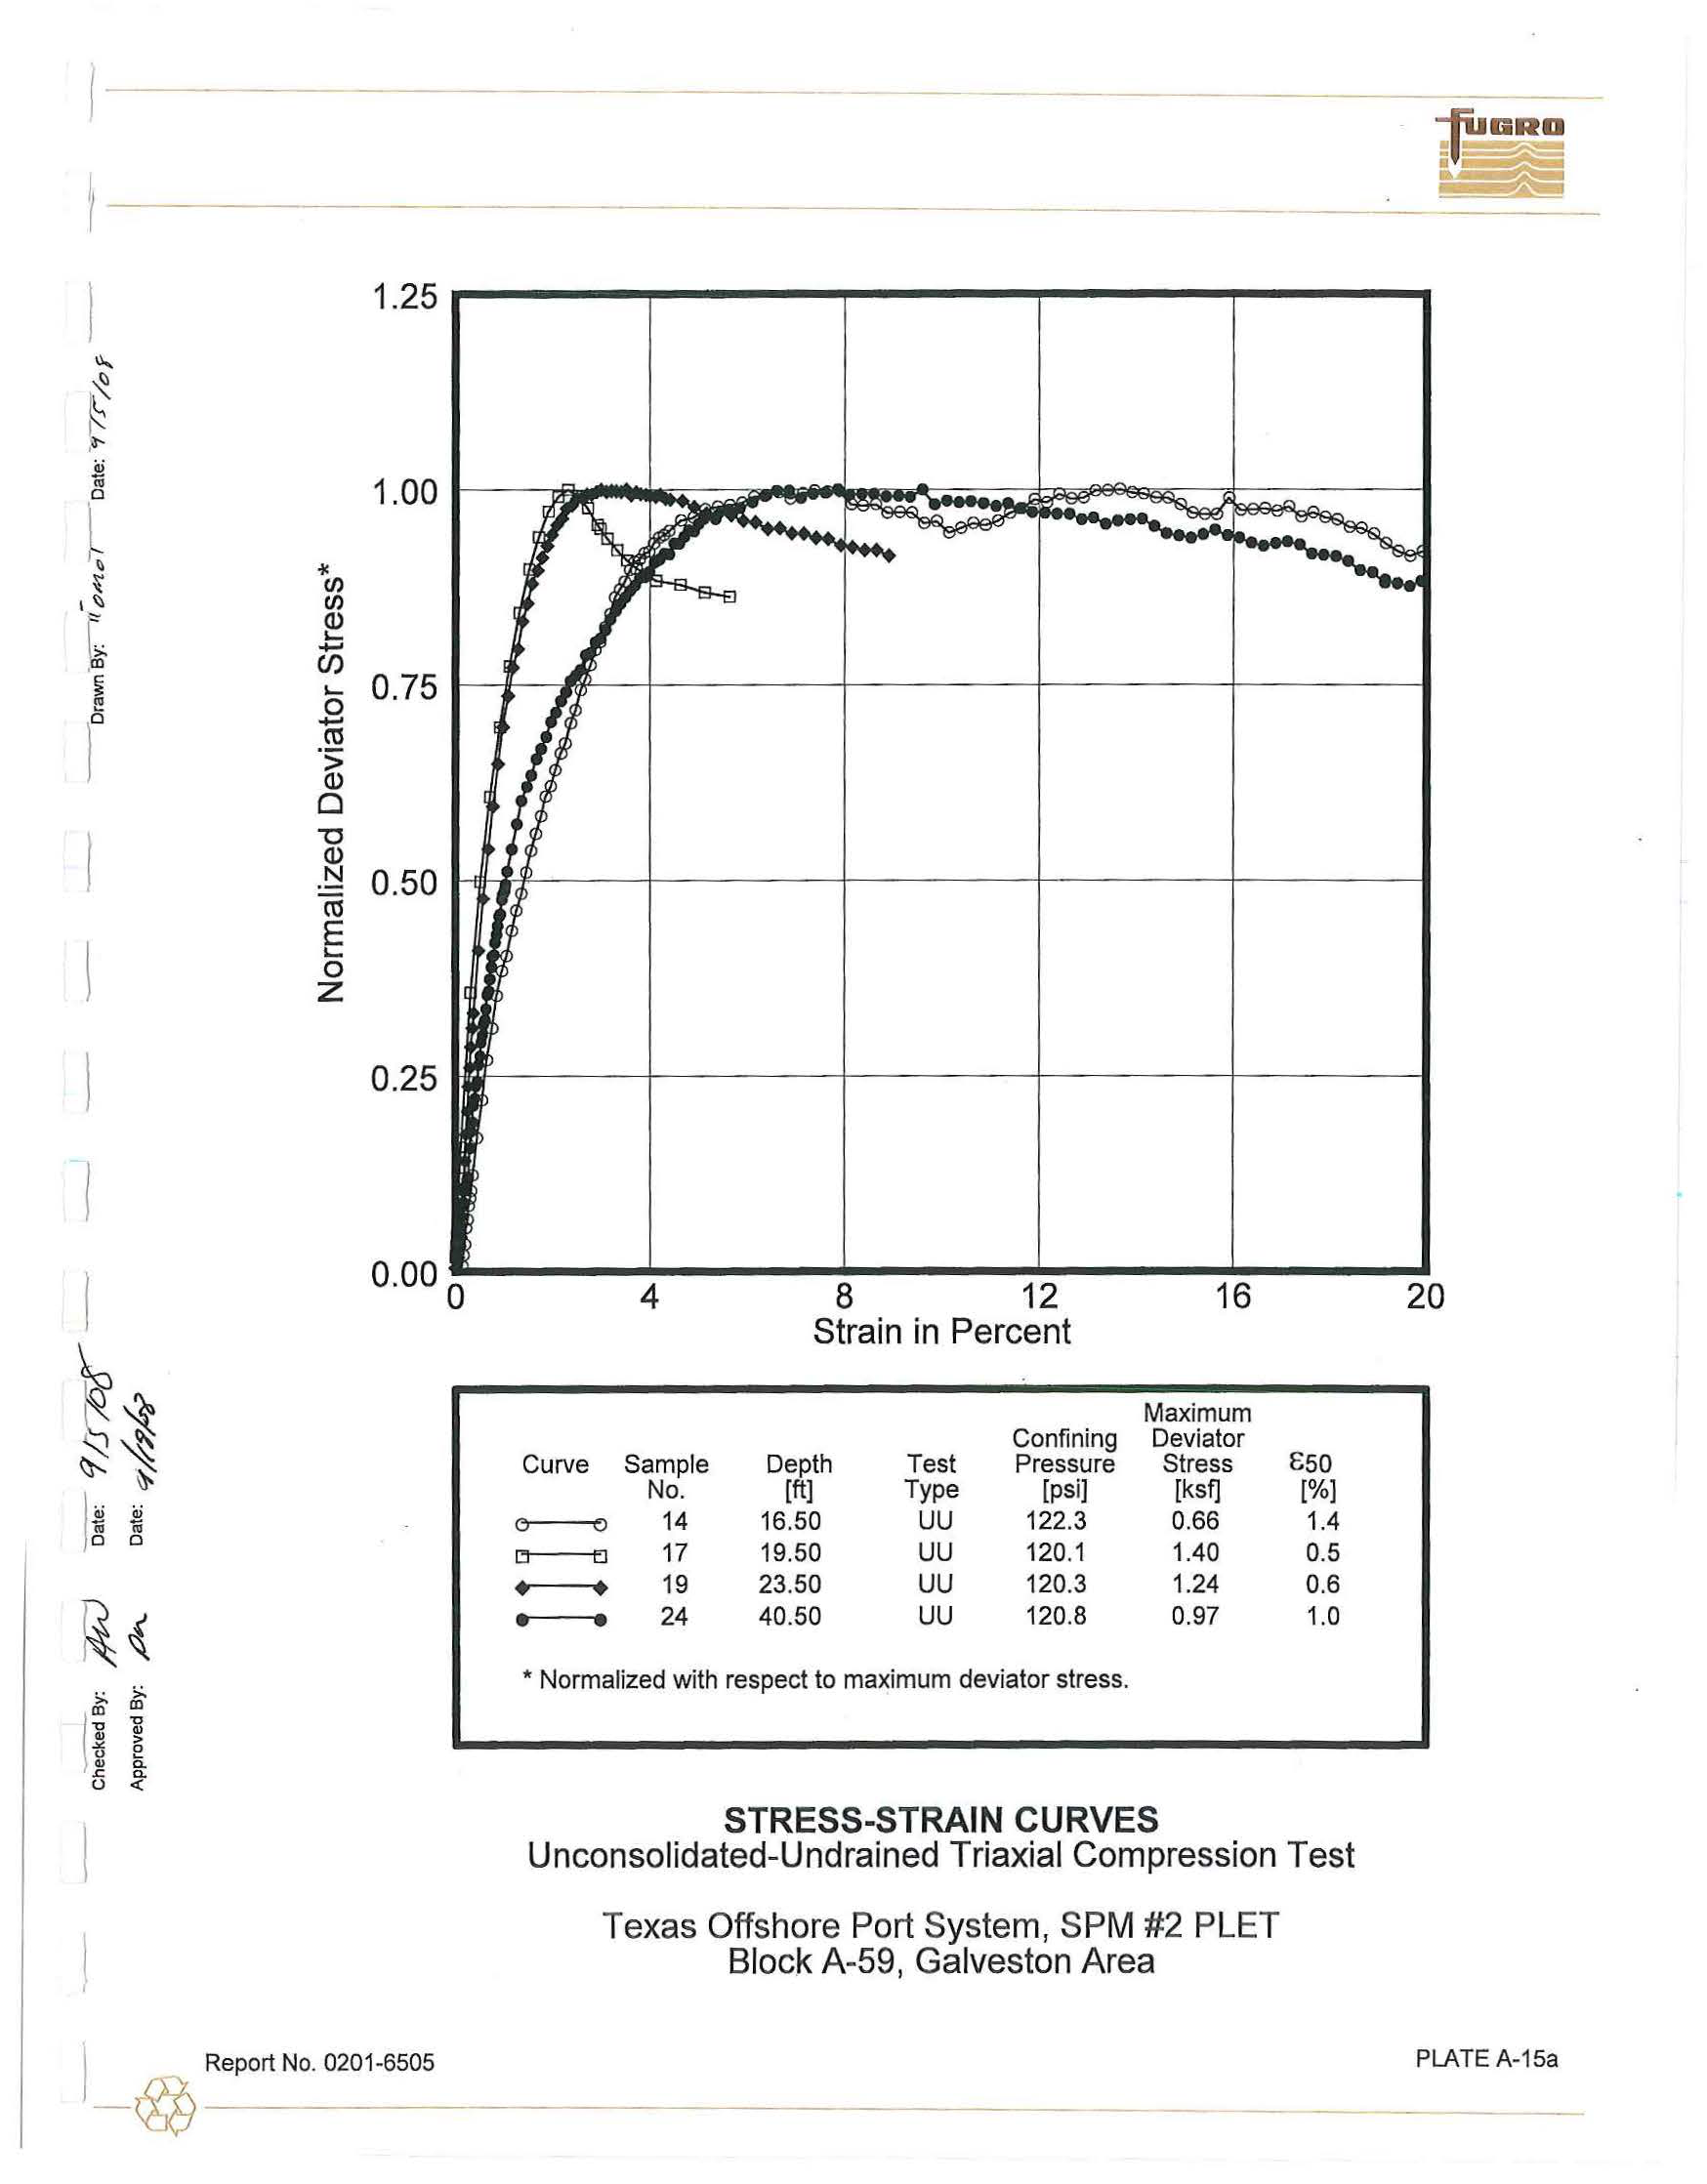
Grain-size distribution curves from sieve-analysis and stress-strain curves from triaxial compression tests
are presented
in Appendix
A.
2.3
GENERAL SOIL CONDITIONS
2.3.1
Soil Stratigraphy
The soil
strat
i
graphy
at each of the boring locations
disclosed
by the field and
laborat
ory
investigations
is
presented
in Section 3. The soil stratigraphy is based on the classification of soil
samples
recovered from
the
boring and observations
m
ade
during drilling operations. Detailed soil descriptions, for
each location, that include
t
extural
variations and inclusions are noted
on the respective
boring
log
I
-
@
Report No. 0201-6505
2-3
.s
....
~
Cl Cl
~
~
'O
'O
Q)
Q)
~
e
Q)
a.
,; a.
'-' <t
X
=
3,2
56,40
0
ft
X
=
3,261,400ft
X
=
3,266,400ft
Y
=
247,000 ft
N
Block
A
-5
9
Back to top
Galveston
Area
~
Y
=
242,000 ft
.,,.,.
........
Offshore Terminal
•
/
'
y
=
237,000
ft
I
SPM
#1
PLET \
I
\
SPM
#1
Anch
1
Leg
#2
1
I
\
1,470 ft/
'
/
.....
-
Y
=
232,000 ft
Projection:
Texas
South Central
Zone
Coordinates
PLAN OF
BORINGS
SPM~Anchor Leg #6
.,,.,.
........
/
I
\
I
SPM
#2
PLET \
\
~
I
\
1,470ft~
'
/
.....
__
Texas Offshore Port System
Block
A-59,
Galveston Area
i,i
1ii
0
-
v
\
II
\"::'
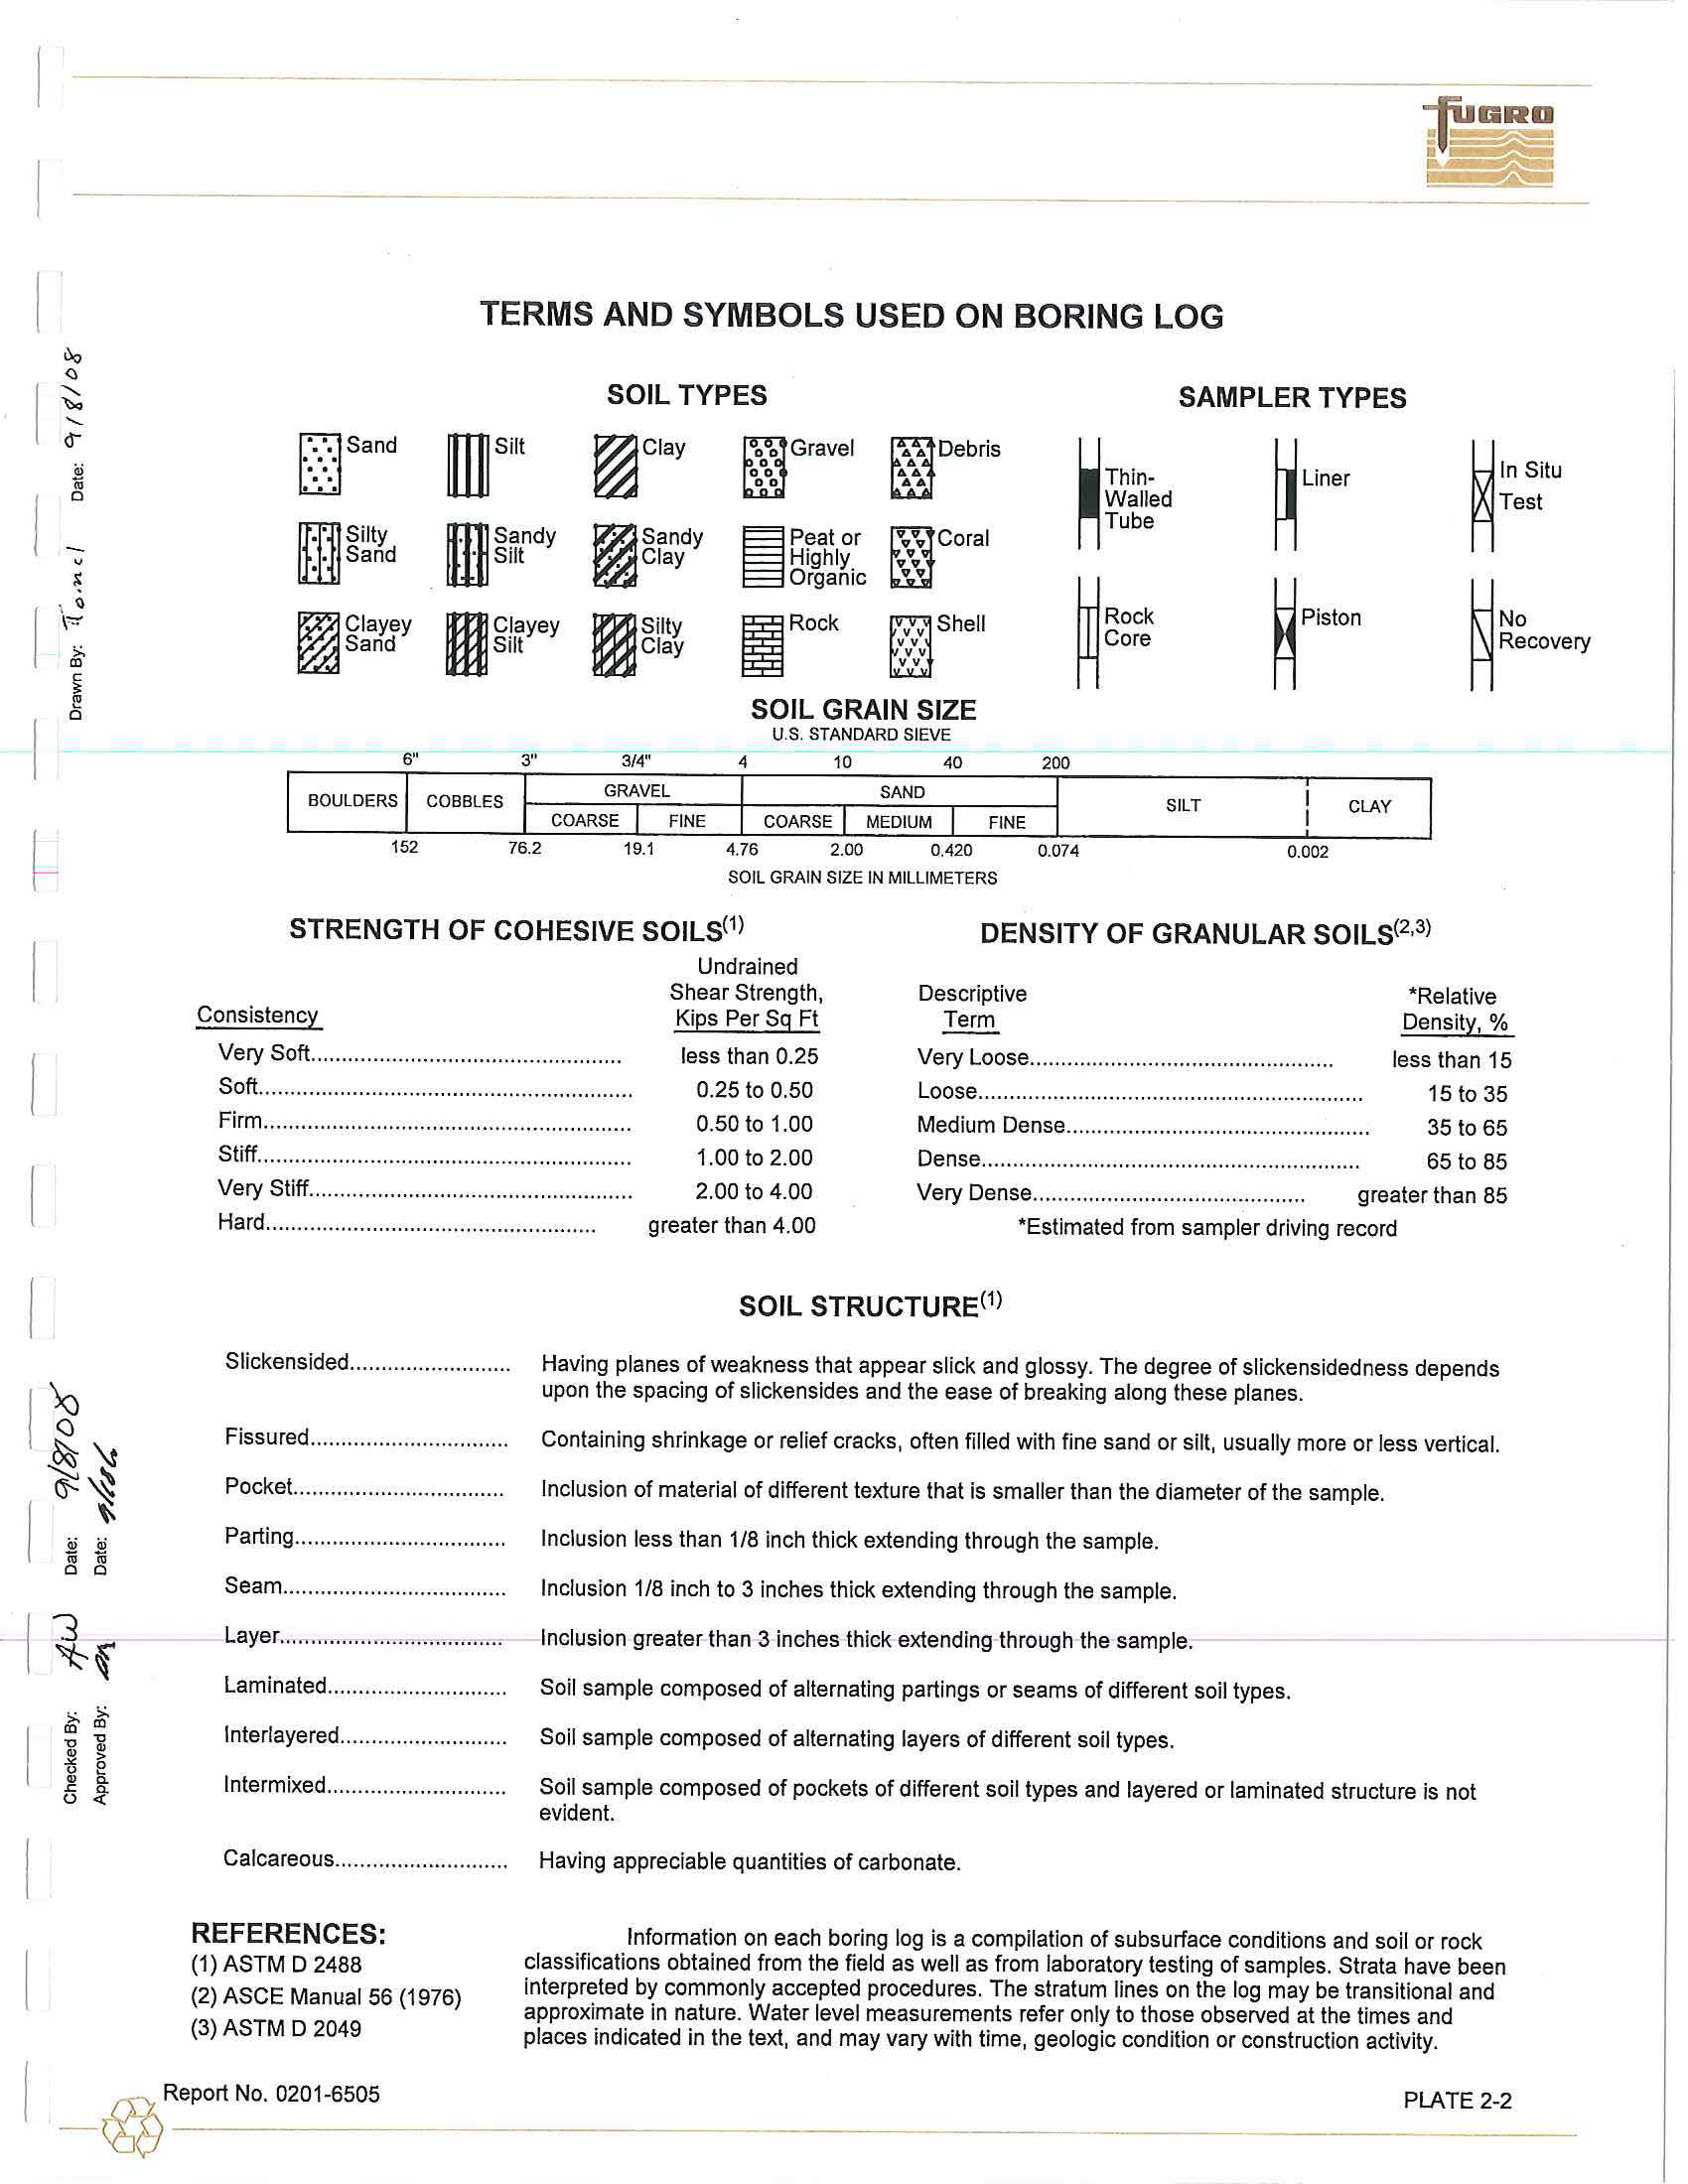
TERMS AND
SYMBOLS
USED ON
BORING
LOG
SOIL TYPES
SAMPLER TYPES
[!Sand
mSilt
~Clay
~Gravel
~Debr
i
s
~Liae,
0
..
~Th;,.
~'" su,
0
...
Walled
Test
Tube
!ill
Silty
msandy
I
Sandy
~Peat or
VI,
Coral
Sand
Silt
C
l
ay
High
l
y
"
Organic
9
v
9
v
~Clayey
mClayey
mSilty
~p;,100
I
Rock
iShell
~Rock
~No
Sand
Silt
Clay
v
Core
Recovery
v
v
SOIL GRAIN SIZE
U.S
.
STANDARD SIEVE
6"
3"
3/4"
4
10
40
200
B
OULDERS
COBBLES
GRAVEL
SAND
SILT
CLAY
COARSE
FINE
COARSE
MEDIUM
FINE
152
76.2
19
.
1
4.76
2.00
0.420
0.074
0.002
SOIL GRAIN SIZE IN
MILLIMETERS
DENSITY OF GRANULAR SOILS(
2,3
l
STRENGTH OF COHESIVE SOILS(
1
l
Undrained
Shear Strength,
Consistency
Kips Per Sg
Ft
Descriptive
*Relative
T
erm
Density,%
Very
Soft....
..............................................
less than
0.25
Very
L
oose..
...............................................
less than
15
Soft...
.........................................................
0.25
to
0.50
Loose...
...........................................................
15
to 35
Firm.
..........................................................
0.50
to
1.00
Medium Dense.
................................................
35
to
65
Stiff........
....................................................
1.00
to
2.00
Dense..
...........................................................
65
to
85
Very Stiff...
.................................................
2.00
to
4
.0
0
Very Dense
............................................
greater than
85
*Estimated from sampler driving record
Hard.
....................................................
greater than
4.00
SOIL STRUCTURE(
1
l
Slickensided..
........................
Having planes of weakness that
appear
slick and glossy. The degree
of slickensidedness
depends
upon the
spacing
of slickensides and the ease of breaking along these planes.
Fissured.............
...................
Containing shrinkage
or relief
cracks,
often filled with fine sand
or silt,
usually more or
less
vertical.
Pocket....
..............................
Inclusion of material
of
different texture
t
hat is smaller than
the
diameter of the
sample.
Parting.
.................................
Inclusion less than 1/8 inch thick extending through the sample.
Seam.......
.............................
Inclusion 1/8 inch to
3 inches
thick extending through the sample.
L
ayer.
...................................
Inclusion
g
r
eater than
3
i
n
ches thick extending through the sample.
Laminated.........
....................
Soi
l
sample composed
of alternating partings
or
seams
of
different soil types
.
l
nterlayered......
.....................
Soil sample composed of alternating layers
of
different
soil
types
.
Intermixed....
.........................
Soil
sample
composed
of
pockets of different so
i
l types and layered or laminated
structure
is not
evident.
Calcareous
............................
REFERENCES:
(1)
ASTM D
2488
(2)
ASCE
Manual
56 (1976)
(3)
ASTM D
2049
Having appreciable quantities
of
carbonate.
I
nformation
on each boring
log
is a compi
l
ation of subsurface conditions and soil or rock
classifications obtained from the field as
well
as from
laboratory
testing of samp
l
es.
Strata
have been
i
n
te
r
preted
by
commonly accepted
procedures.
The stratum lines on the log may
be t
r
ansitiona
l
and
approximate in
nature.
Water level measurements
refer
on
l
y
to those observed
at
the times and
p
l
aces indicated in
the
text, and may
vary
with time, geologic
condition
or construction activ
i
ty.
I
-
@
Report No.
0201-6505
PLATE
2-2
+
l
!
+
~
~
+
•
•
•
C.INC. Si:
1
04
§
LI
NE
S::!103
>,.,._
§
0
,,
Report
No. 0201-6505
-
\~
--
----
"'
"'
"'
no
"'
"'
'"
no
no
no
no
no
'"
+
I
,
..
-+
"'
,
..
""
,
..
"'
-eLM
,
..
"'
"
'
""
"F
,
..
~
!!
~
!
~
§
-
-
-
'
"'
'"'
=
"'
'"'
"'
"'
'
"'
-
'"'
SPM #2
Anchor Leg #6
i
1
(J)
.
.....
'
"
"
"
...
,,.
"'
...
"'
"
'
SPM#2
PLET
...
~
l!
~
'
"
~
0
-+
--
f+
+
e
-i---
=
'"'
'"'
=
.,.,
,
..
..,
-
Offshore
Terminal
=
'"'
ll
l!
~
~
~
§
""
"
"
-
'"
""
""
..
""
..
"
"
........
SPM#1 Anchor Leg #2
@
-t
""
""'
""'
~
.........
ll
...
'"'
-
+
'
"
~
""
'"
.
--
~~
@
SPM #1 PLET
-
""
'"'
...
'
"'
""'
..,
'"'
..,
l!
ij
l
I
+
+
..
"'
........
"'
"'
...
l!
~
!
~
'"'
'"'
'"'
~.
'"'
'
"'
'
"'
'
"'
--
!!
"
'--
~
"'
"'
~
""
"'
11,
,.
'"
;
~
~;
•
•
"'
•
MAP OF
SOIL BORINGS
AND SUBBOTTOM
PROFILE LINES
Texas Offshore Port System
Block
A
-
59, Galveston Area
t
""'
!I
....
§
-
=
f+
A
"'
.
no
no
"'+
'"
7!
1)
'"
,
..
'+
ll
!!
~
"'
'"'
""
""
'
"
.......
~
~
~
+
+
"'
'
"'
"'
..,
ll
~
~
'
"
,
..
""
..
+
'"'
..,
..,
""'
ll
~
~
+
.........
ll
!!
~
-
-
'"'
'
"'
+
..ll
'
"
""~
..
~
•
"'
PLATE
2-3
Checkta
c
y.
Dcuc.
LJ1avv1l
By:
1 -
.
,.
:.-,
"
/
u"'".
'irl
.i
r
10
:r
App
r
oved By:
Date:
X
=
3
,2
65,647'
IDENTIFICATION TE
S
TS,[%]
Y
=
240
,
318'
BLOW
20
40
60
80
UNDRAINED
SHEAR STRENGTH
COUNT
{ksf)
Texas South Central
Zone
Coord
i
nates
SUBMERGED UNIT WEIGHT,
[kcf)
0
SEAFLOOR A
T
EL. - 125'
0
.
03
0
.
04
0
.
05
0.06
0
.
5
1
.
0
1
.
5
2
.
0
I
n,
I
SOFT OLIVE GRAY SANDY S
IL
TY CLAYl2.0'l
WOH
.J.
- -
-
D
~
..
0
LOOSE
GRAY SANDY S
IL
T TO S
IL
TY F
INE
SAND
5
•
1•
D
II
..
10
1!1
...
•
-
..
D
10
(12
.
0')
NP
...
u
<>+
10
10
I
SO
FT T
O S
TIFF
OLIVE
GRAY CLAY
1
0
+-
----+
••
D
•
~-
I
10
+-.__ ____
~
.D+
0
.&
.
~
~
-
I
PUSH
Jh
n
--
.
-
h
A
....
~
~
~
20
..
20
•
I
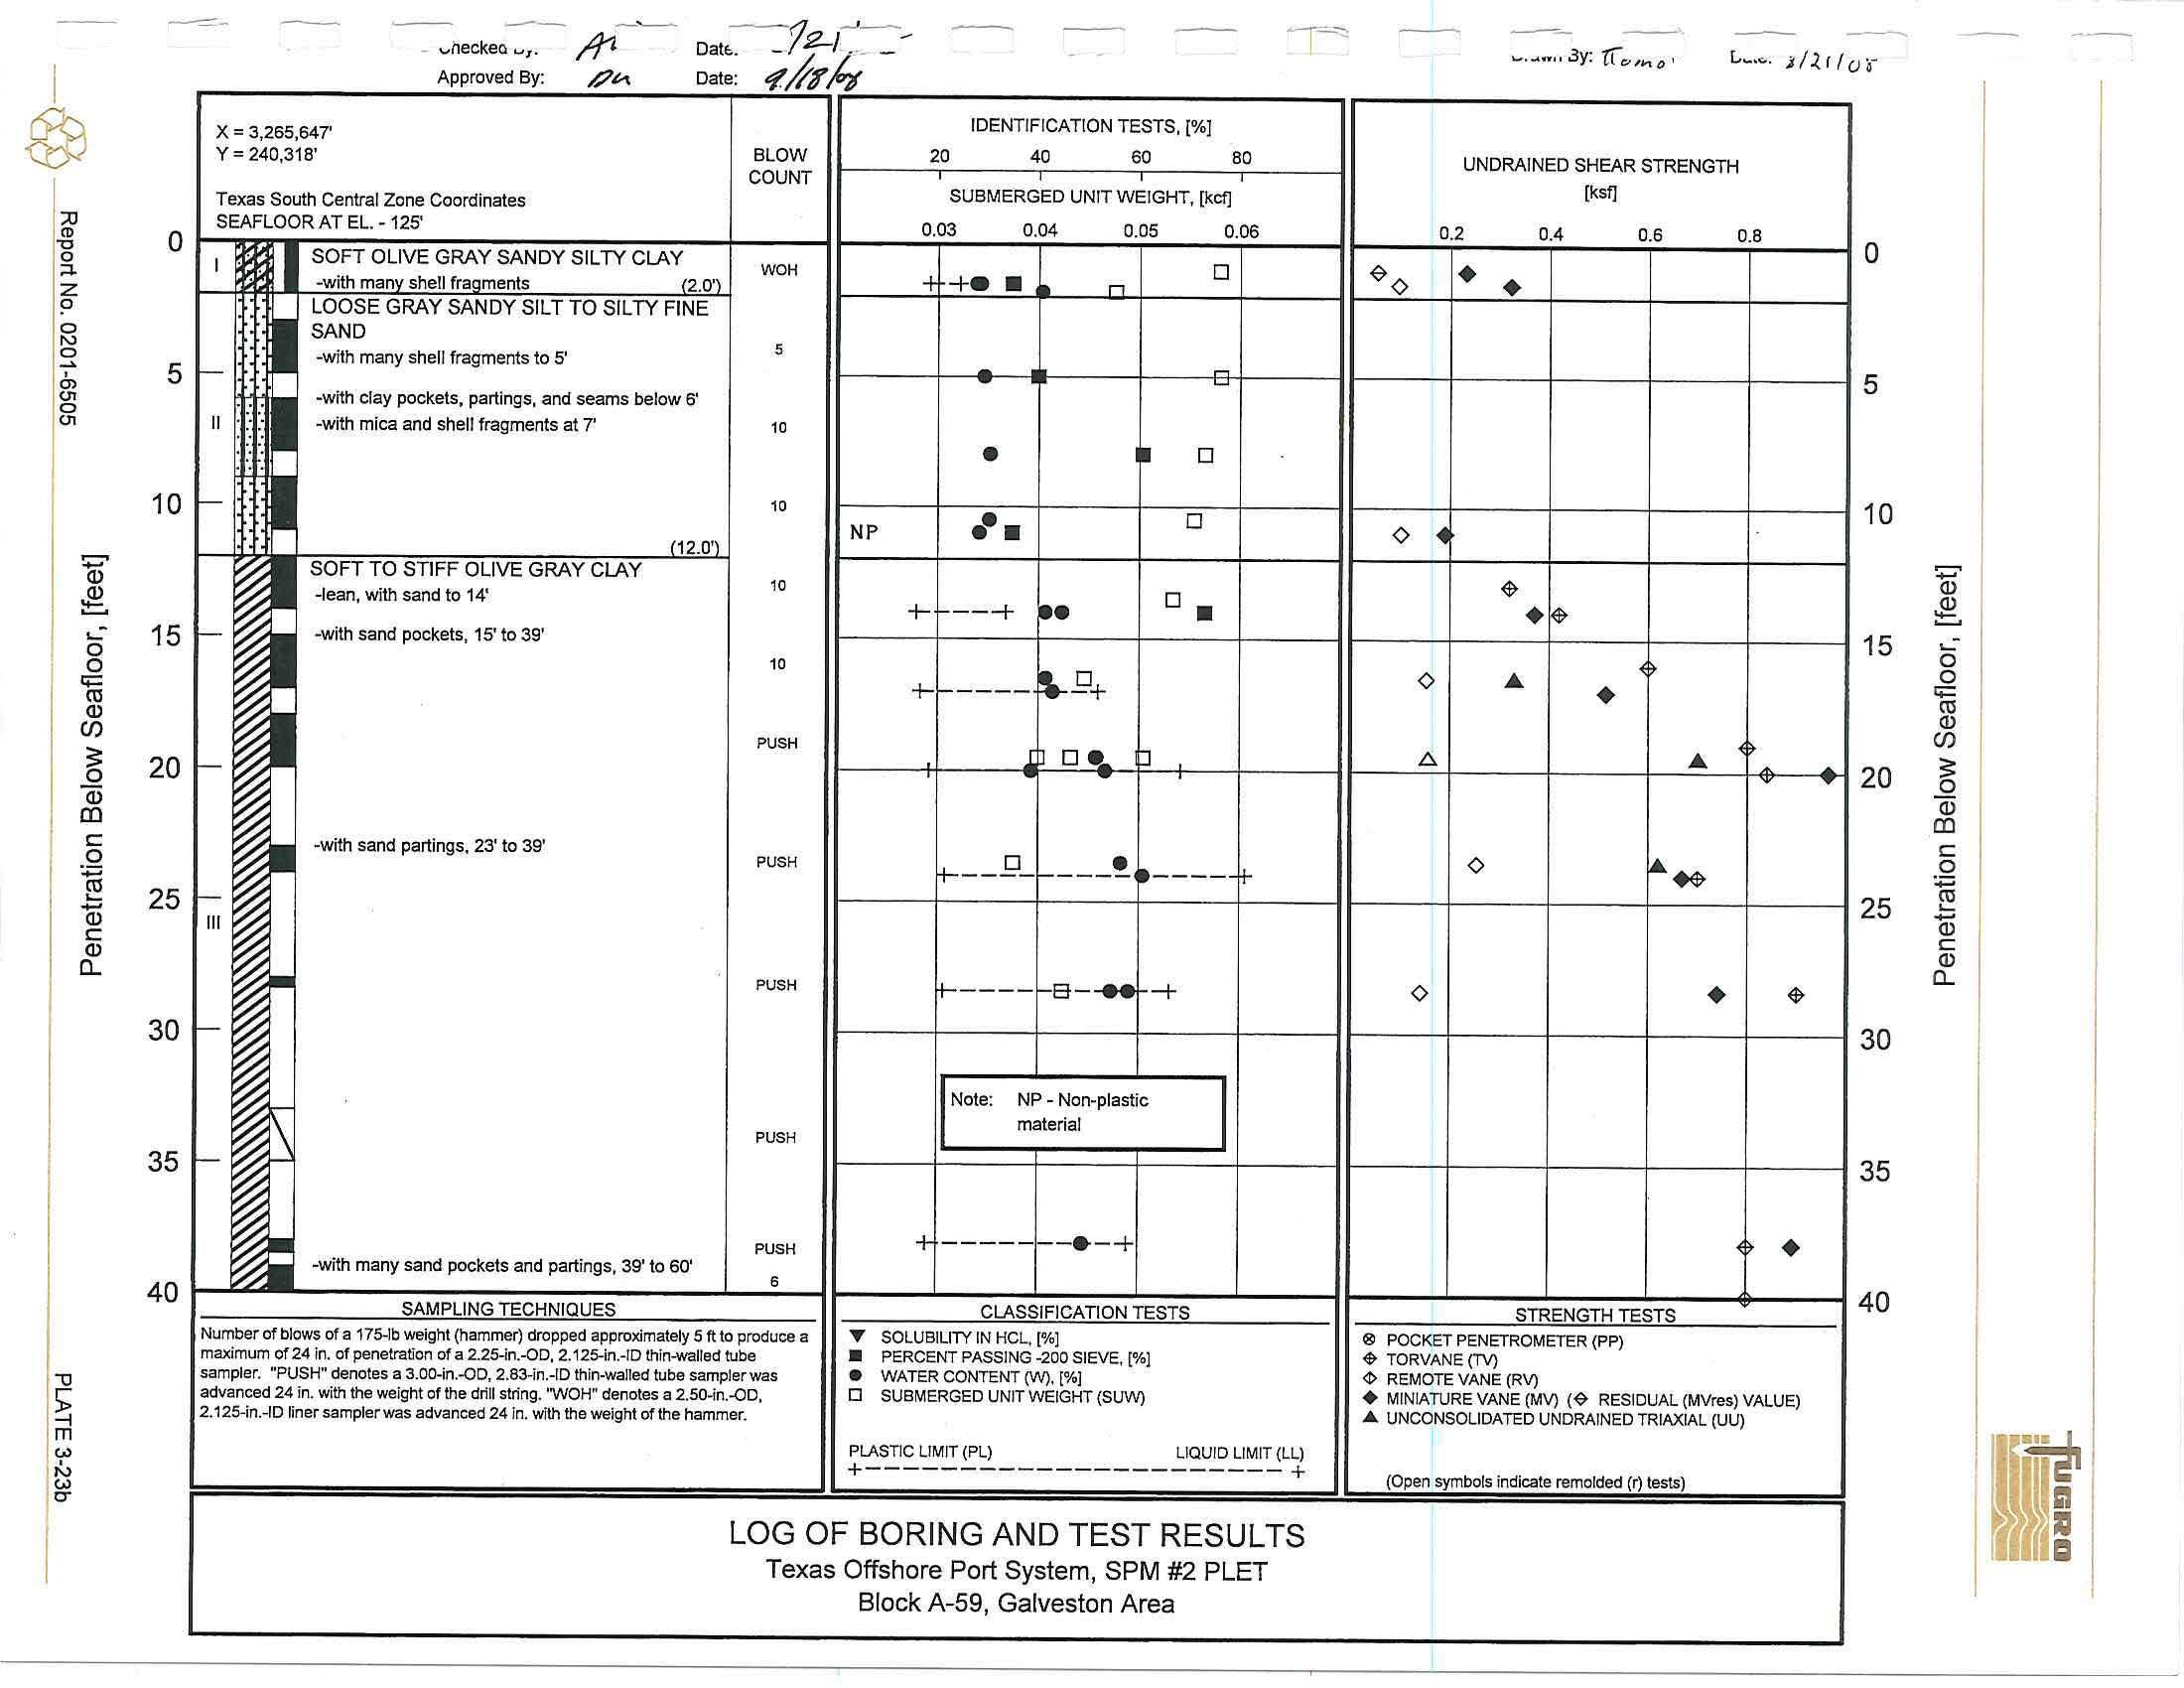
Note:
See
PLATE
3-23b for
detailed
soi
l
I
P
U
SH
rt--
-.o_
~
---
•
.
---- +-
0
~
stra
tigraph
y
to
40-ft
penetration.
-
P
U
SH
+---
---
-8-
....
-+
0
.
~
30
,...__
30
ts
PU
S
H
I
Note
:
NP
-
Non-plastic
i
mater
i
al
i
PUSH
-+
-----
--
•
-+
~
.
-
-with a
few
s
h
ell fragments at 40'
6
-+
"'
-----
-
.
LI-+
v
40
~~
~-
40
I
4
+~
--
--
-
~
-
-
-
+
A
,
ii.
i
~
.
P
U
SH
•
~
.
~
I--
12
"'
+~----
t-e----J-..l
v
I
A
~
~
50
50
•
7
-+--:.._
___
1-11!9-
G!jJJ
A
.&
~
•
I
-lean
,
with a
few
shell
fragmen
t
s at
59'
12
-
n
()
IA
,~~
-
-
,~
60
60
•
-
w
i
th many
silt
pockets, partings,
a
n
d seams at 63'
P
U
SH
---
-.
'-----,hJ
A
•
.&
~
•
-w
i
th
si
lt
pockets
and
partings
at 66'
PUSH
-+ ----
~
19-
__Q_Q
A
•
•
70
-
Ill
70
80
.ii
P
U
SH
12
•
D
-
~
•
80
~
Q)
~
..:
0
90
0
i:;::
Q)
ro
(f)
$
100
0
•
12
+
---
4't-
~---+
D
A
.&
®
~
i.
$
I--
•
-with a few
sa
n
d
pockets
a
nd partings
at 97'
1
2
•
-
D
~
~
p
Q)
g
90
,.__-
0
0
~
Q)
ro
(f)
100
$
0
Q)
m
m
(!)
c
0
:.;:::::
(U
110
,.__
-
Q)
c
Q)
Q..
I
-with a few
silt pockets at
108'
PUSH
I
DD
~
$A,
1
-
®
c
0
'.P
11
0
,.__
ro
Q)
c
Q)
0...
120
I
-lean
at 118'
P
U
S
H
D
•
d)
+-
--
--
+
-
120
I
-expansive,
w
ith
gas blisters
and a few
~
-
I--
si
l
t
pockets
at
130'
____
__Ll:u.fil
PUS
H
~
_.__
,._
~
UL~
+-§.--
.....----
-
,___
__
-
---
,___
__
---
130
130
140
I----
1
40
150
-
150
160
-
160
170
-
1
70
180
-
180
190
I----
190
SAMPLING
TECHNIQUES
CLASSIFICATION
T
ESTS
STRENGTH TESTS
200
200
Number of b
l
ows of a
175
-
lb we
i
ght {hammer) dr
o
p
p
ed a
p
p
rox
i
mately 5 ft to produce a
T
SOLUBILITY
IN
HC
L
,
1
%
]
®
PO
CKET
PENETROM
ET
ER (PP
)
maximum of
24
in.
o
f
penet
rati
on of
a
2.25-in
.-OD
. 2
.
125-in
.
-
lD
th
i
n-walled
tube
•
PERCENT PASS
I
NG
-20
0 S
I
EVE,
[
%]
~
TORV
A
NE (TV)
sampler
.
"P
U
SH
"
denotes a
3
.
00-
i
n.-OD
,
2.83-ln
.
-lD
thin-walled
tube sample
r
was
•
WATER
C
ONTENT
(
W)
,
[%]
<!>
REM
O
TE VANE (RV)
ad
v
anced 24
in
.
with the weight of
the drill
s
tri
ng.
''WOH"
denotes
a 2.50-
i
n.-OD
,
D
SUBMER
G
E
D
UNI
T W
EIGHT (SUW)
+
MINIATURE VA
NE (M
V) (~
R
ES
I
DUA
L (
MVres) VAL
U
E)
2
.
1
2
5-
l
n
.
-
lD liner samplerwas advanced 24
i
n
.
with the
we
i
gh
t
of the hammer
.
.._ U
NCm,
S
O
LIDA
TED UNDRA
I
NED
T
RIA
X
IAL {UU)
PLASTIC
LI
MIT (PL)
LI
QU
I
D LIM
I
T
{
L
L
)
+
------------
------
----
+
(Open s
y
mbols
i
ndicate
r
emolded (r
)
tests)
LOG OF BORING
AND TEST
RESULTS
Texas Offshore Port System, SPM
#2
PLET
Block A-59, Galveston Area
I
@
:;o
CD
"C
0
;:i.
z
~
0
N
....
0
6,
01
0
01
p
Q)
~
..:
0
0
i.:::
Q)
ro
Cl)
3
0
Q)
Cl'.)
c::
.
-
cu
....
Q
Q)
c::
a..
Q)
-=-
-
o
_,
_
Da
te.
-.tJ-
1
..
_
_
-
Dat
e
:
"-
//J'
h
-
-.,heckec. "'.
/9"2
Approved By:
;?~
X
=
3,265,64
7'
I
DE
NT
IF
I
CATION TESTS,
[%J
Y
=
240,318'
BLOW
20
4
0
60
80
COUNT
l
Texas Sout
h
Central
Z
o
n
e Coord
in
a
t
es
S
UBMERG
E
D UNI
T
WEIG
H
T,
[
kcf]
0
S
EA
FLOOR
AT
E
L.
-
125'
0.
0
3
0.04
0.05
0.06
I
.1,;o
SOFT O
LI
V
E
GRAY SA
N
DY S
IL
TY CLAY
WOH
~
-
-
D
w
it
h m
a
n
v she
ll fr
a
nm
e
nt
s
12.0
'
)
+
+
•
•
..
~
L
OOS
E
G
RA
Y SAN
D
Y S
ILT TO
S
IL
TY F
I
NE
SA
N
D
5
-
wi
t
h
many
s
h
ell fragments
to
5
'
5
._
-
-
Lo.a
-
with clay
p
ocke
t
s,
p
a
rtin
gs, an
d
seams below
6'
II
-
w
i
t
h m
ic
a
a
nd she
ll fr
a
g
m
ents at
7'
1
0
•
•
D
10
._
10
N
P
•••
D
~
I
1
1
2.0'l
S
OFT T
O S
TIFF
OLIV
E G
RAY CLAY
-l
ean, with sand t
o
14
'
10
D
+
~
---+
••
•
15
._
I
-w
i
t
h
sa
n
d
p
oc
k
e
t
s,
15
'
to
39
'
1
0
+-
~
----
~
.9+
20
I
PUS
H
._
J
o
o
•
tJ
-
I
-w
i
t
h
sa
nd partin
gs
,
23'
to
39'
PUSH
f+-.--_g-
•
L...- _
_
__
25
.
----
fl-
._
Ill
..
PUSH
ft--
--
-
'-
8-
....
'--+
30
-
35
~
!No
t
e:
NP -
N
o
n
-
pl
astic
I
m
a
ter
i
al
PUSH
._
•
PUSH
+
-----
--
•
-+
•
-
wit
h m
a
n
y sand pocke
t
s a
nd
pa
rt
in
g
s,
39
'
t
o
60
'
6
SAM
PLI
NG
TE
CH
NI
Q
UE
S
CLASS
IF
ICA
T
IO
N T
ES
T
S
40
Number o
f b
lows of a 175-lb we
i
ght
(ham
m
e
r
)
dr
opped appro
xi
mate
l
y
5
ft to
pro
d
uce a
...
SOLUBI
LI
TY IN HC
L,
[
%
]
maxim
u
m
of
24
i
n. of
pe
n
etration of a 2
.
25-in.-OD, 2.
1
25-i
n
.-lD
thin-walled tube
•
PERCENT PASSING -200 S
IE
VE,[%]
sam
pl
e
r
.
"PUSH
" d
enotes a
3.00-in.-OD,
2.83-in.-lD
thin
-
walled
tube sampler was
•
WA
T
ER
CONTENT (W), [%]
advanced 24
in.
with the weig
h
t o
f
the drill string. 'WOH"
d
e
n
otes a 2.50-in.-OD
,
D
SUBMER
G
ED UNIT WEIGHT (SUW)
2
.12
5
-in.-lD
liner samp
l
er was adva
n
ce
d
24
in.
with the weight ofthe hammer
.
PLASTIC LIMIT
(PL)
LIQUID
LIMIT
(LL)
+-----
-
--
-
-------------
+
LOG OF BOR
I
NG A
N
D
T
EST RESULTS
Te
x
as Off
s
hore Port
S
ystem
,
SPM #2 PLET
Bloc
k
A-59
,
Gal
v
e
s
ton Are
a
"-', ....
n
il
.3y: rrc,
,
"1;()'
UNDRAIN
E
D SH
E
AR STR
E
NGT
H
[
ksf]
0.
2
0.4
0.6
0.8
0
~<>
•
•
5
10
<>
~
p
Q)
~
~
.~
15
.....:-
0
0
<>
....
~
t;:::
ro
•
Q)
Cl)
2
0
3
0
.~
/::,.
...
~
-
...
Q)
al
c::
0
:.::.
<>
IA~
25
ro
-
....
Q)
c::
Q)
<>
•
a..
~
3
0
35
.
~
•
S
TR
ENG
T
H TES
T
S
40
®
P
OCKET PENETROMETER (PP)
+ TORVANE
(iV)
~
REMOTE
VANE (RV)
+ MINIATURE VANE
(MV) (~
RESIDUAL
(MVres)
VALU
E
)
.& UNCONSOLIDATE
D
UNDRAINE
D
TRIAXIAL
(UU)
(Open symbols ind
i
cate
r
emolded [r) tests)
Oifset:
0.09
0
.
11
w
l
.rt
1
p
.
MSEC
-
25
FEEl'
.
\
i.
.
,,
~
•
j
C
L
A
SS
IFICATION
TE
S
T
S
..,
SOLUBILITY IN
HC
t
, ['!.]
•
FERCENT
PASSING
:200 SIEVE, ('.
~!
e
WA
i
ER
CONTENT
(I'l
l,
r.
.
\
]
O
SUSME
R
GEO Utm WE1eH
T
(
S
UW)
1•
.
PLASTIC UI.II
T
(
P
l
)
LI
Q
UID
LIM
IT
(LL)
:
----------------------+
-@--
R
_
e
_
p
_
o
_
rt
_
N
_
o
_
.
0
_
2
_
0
_
1
_
-6
_
5
_
o
_
s
__
~
1
2500
::
.
'
'
'
STRENGTH TESTS
®
POCKET PENETROMET:R !P?)
<!> "i"ORVAN:
(TV
)
¢,
R:MOTE VANE
{
RV)
'
.'.
:1,
.
(
:
;
..
!
i
.''
.
+
t,IINIATURE
VANE (MV) l~
R:SIDUAL
(MV,.,
l
VALUE
)
A
UNCONSO
ll
DATa:O UNDR
le
N:O
TfCA)QAL (UU
)
180
_
_;
fo
a
.,.._
..._~
,
.i
~
ll'Nl1
rrw
~
~--~1
...
1
,M
l
l
W
'
iDl
5HQR
$
l
~
TH
...,
..
.
..
GEOPHYSICAL
AND GEOTECHNICAL
INTEGRATION
Texas
Offshore
Port
System, SPM #2
PLET
Block
A-59,Galveston Area
1
•
r
.
-
.
'
.
.
'
;
..
~
.
-
..
---
~
125
M
ETERS
410
FT
Portion of Subbottorn
Profiler
Line
2107
1~500
E
.050
.060
.070
.080
.090
.100
.110
.1
20
PLATE 3-24
rl
~
k
I
~
\
~
;,.:.
[I)
~
0
Shear Strength Profile, [ksf]
0.5
1.0
1.5
N
ot
e: Rom
a
n nu
m
eral
s
re
f
er to t
h
e s
tr
a
ti
gra
p
h
y
as
des
c
ribed in the te
xt
and on the b
o
ring l
o
g
.
2.0
2
.
5
Ill
140
._______.......________________________........________.
(
Report No
.
0201
-
6
5
0
5
-
@
--
DESIGN STRENGTH PARAMETERS
Texas Offshore Port System, SPM #2 PLET
Block A
-
59, Galveston Area
PLATE
3
-25
I
~
I
~
1
{
I
~
>,
I
m
"O
Q)
""'
'
Q)
u
.c
(.}
!
l
>,
m
"O
Q)
e
>
a.
<t;
~
Q)
~
L..-
0
0
----
-
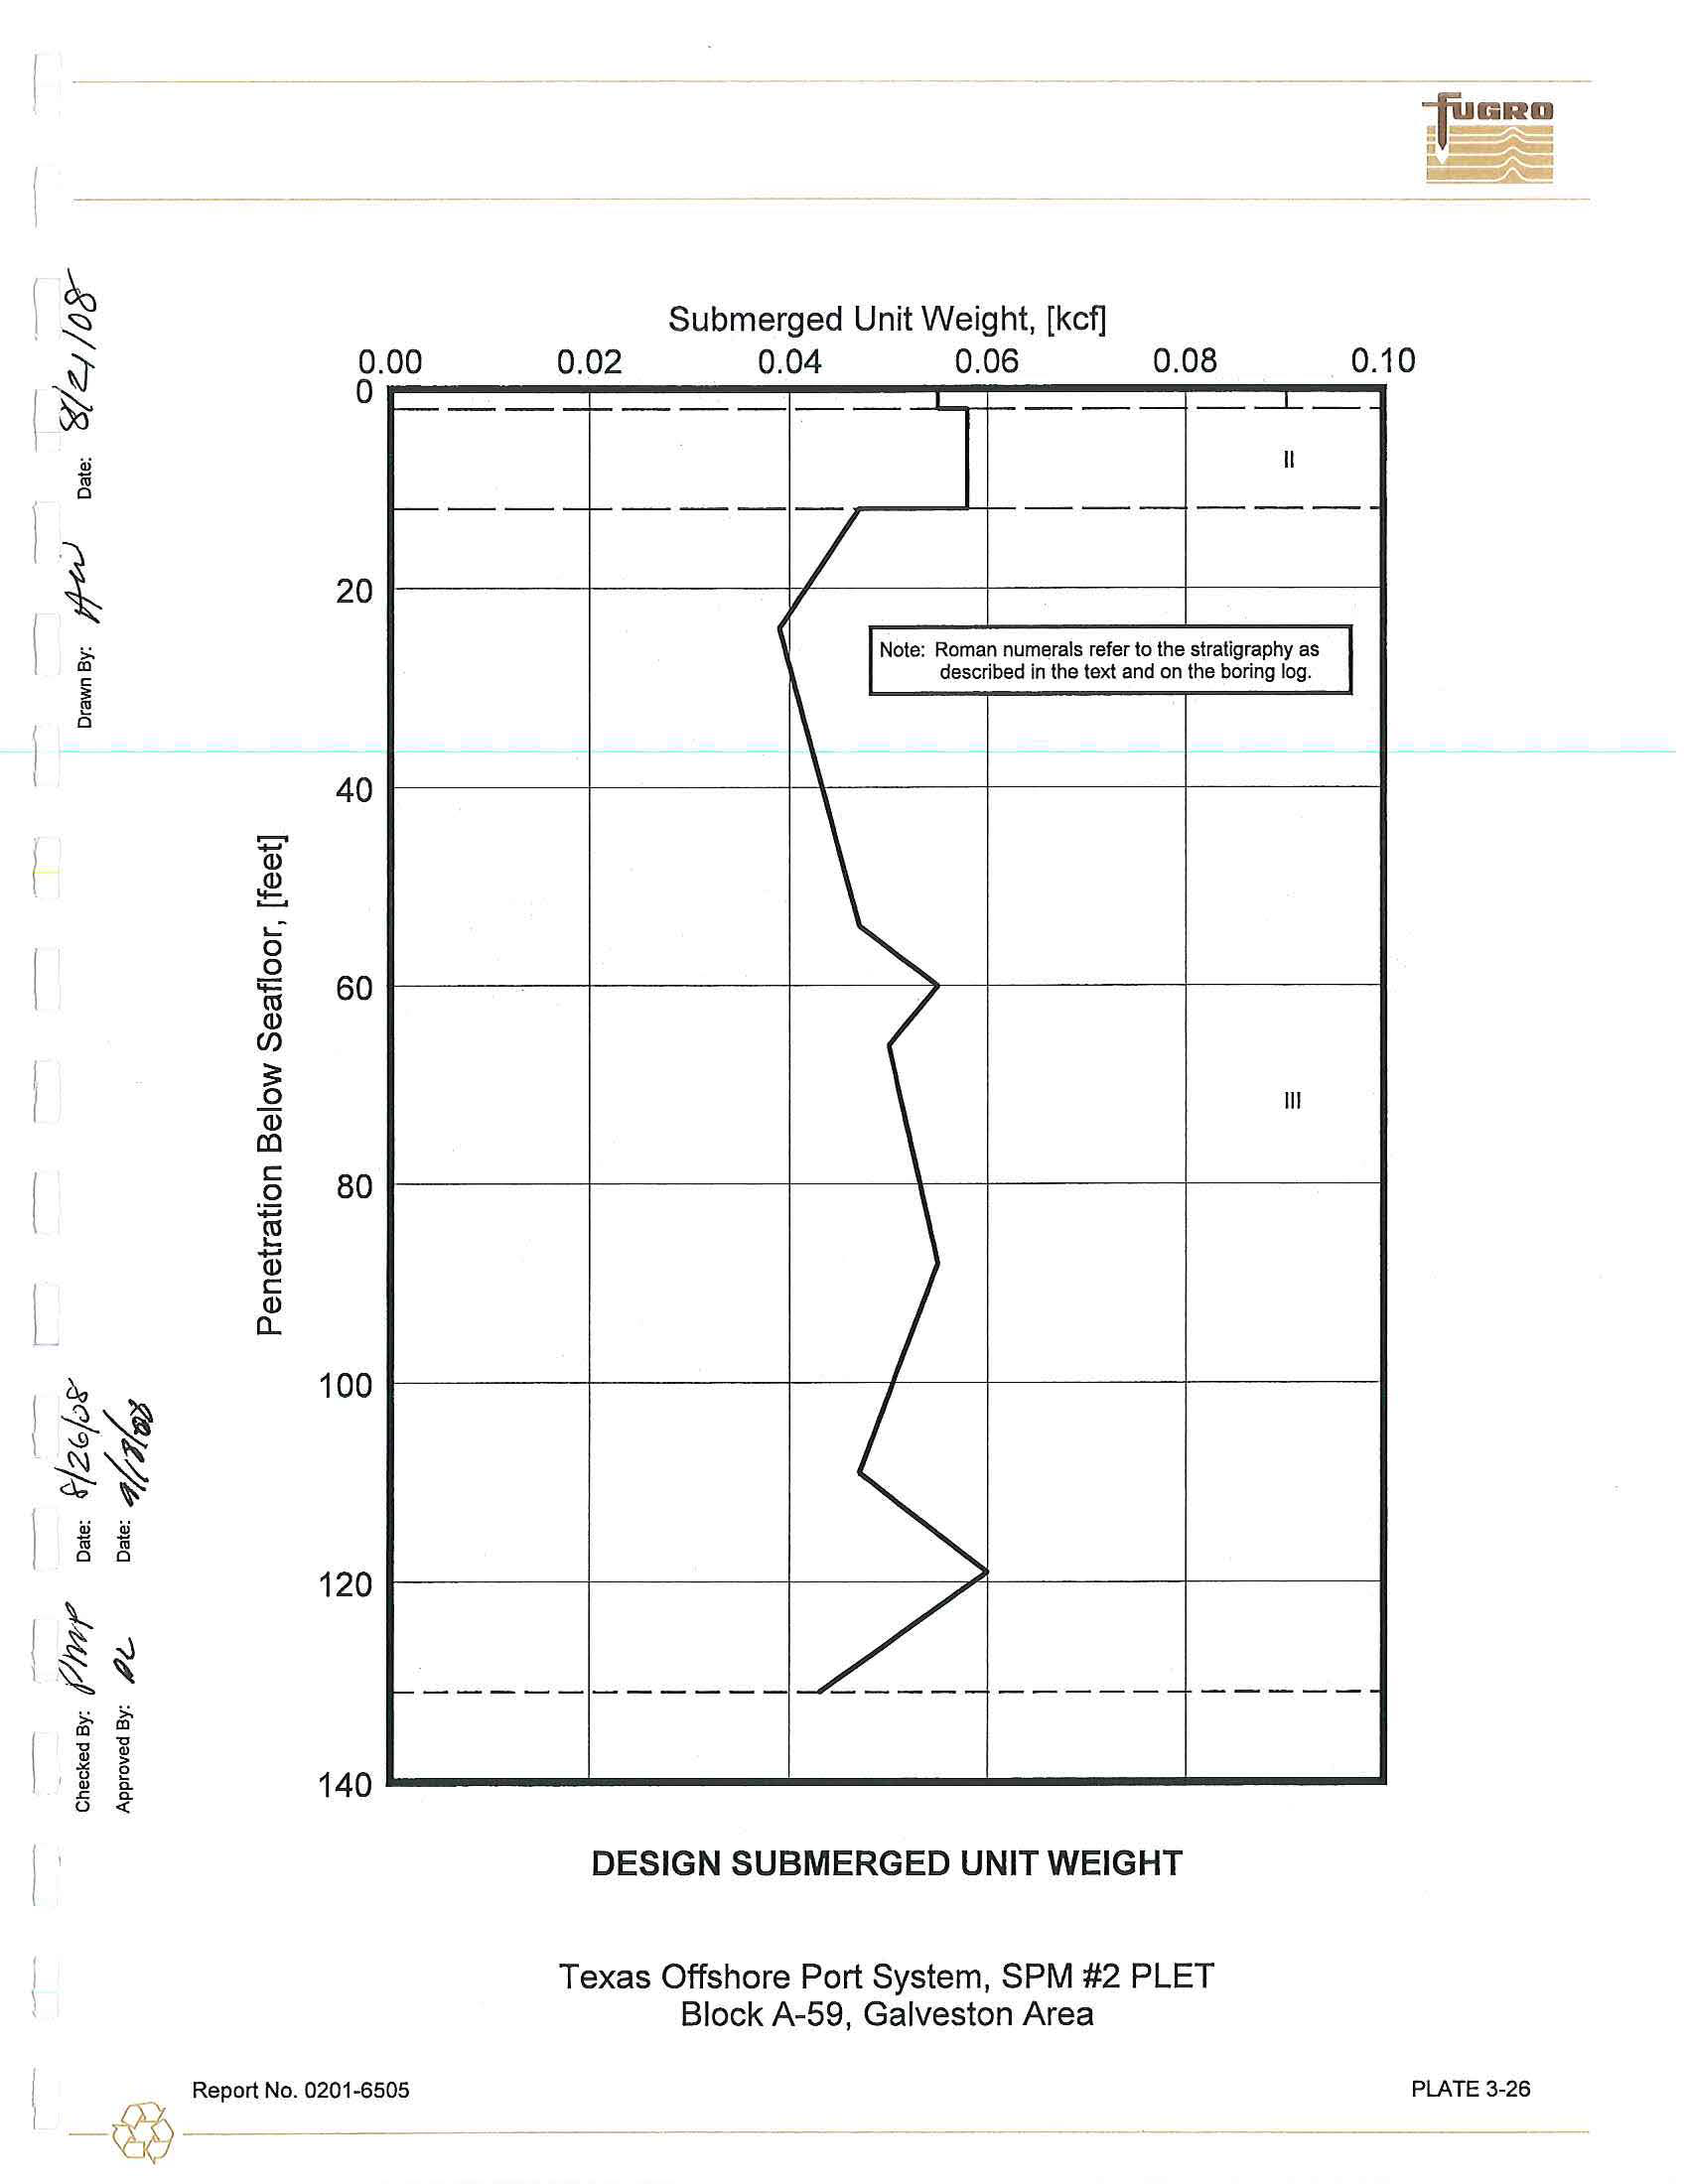
Submerged Unit Weight
,
[kcf]
0
.
00
0.02
0.04
0.06
0
.
08
0.10
0
--------------------------------------------------
_____
_....--+-----
II
---
-+----
Note
:
Roman
numerals refer to the
stratigraphy as
described
i
n the te
xt
and on
the
boring
l
og.
401-------+---
--f--\----+-
--
--+--~--1
cu
60
Q)
CJ)
3:
0
Q)
m
Ill
§
80
----
--+--~~~~
+--~~
--
-
+-----
~+--~~~____.
~
ro
L..
-
Q)
c
Q)
a..
140
..._________________________________________...
DESIGN SUBMERGED
UNIT WEIGHT
Texas Offshore
Port
System, SPM
#2
PLET
Block
A
-
59, Galveston Area
\
Report
No
.
0201
-65
05
-
@
-
PLATE
3-26
-
-------------
-
--
-
- - - -------
(
'
l
~
~
>,
[D
'O
0)
.><
~
;.:.
[D
,:,
0)
>
Un
i
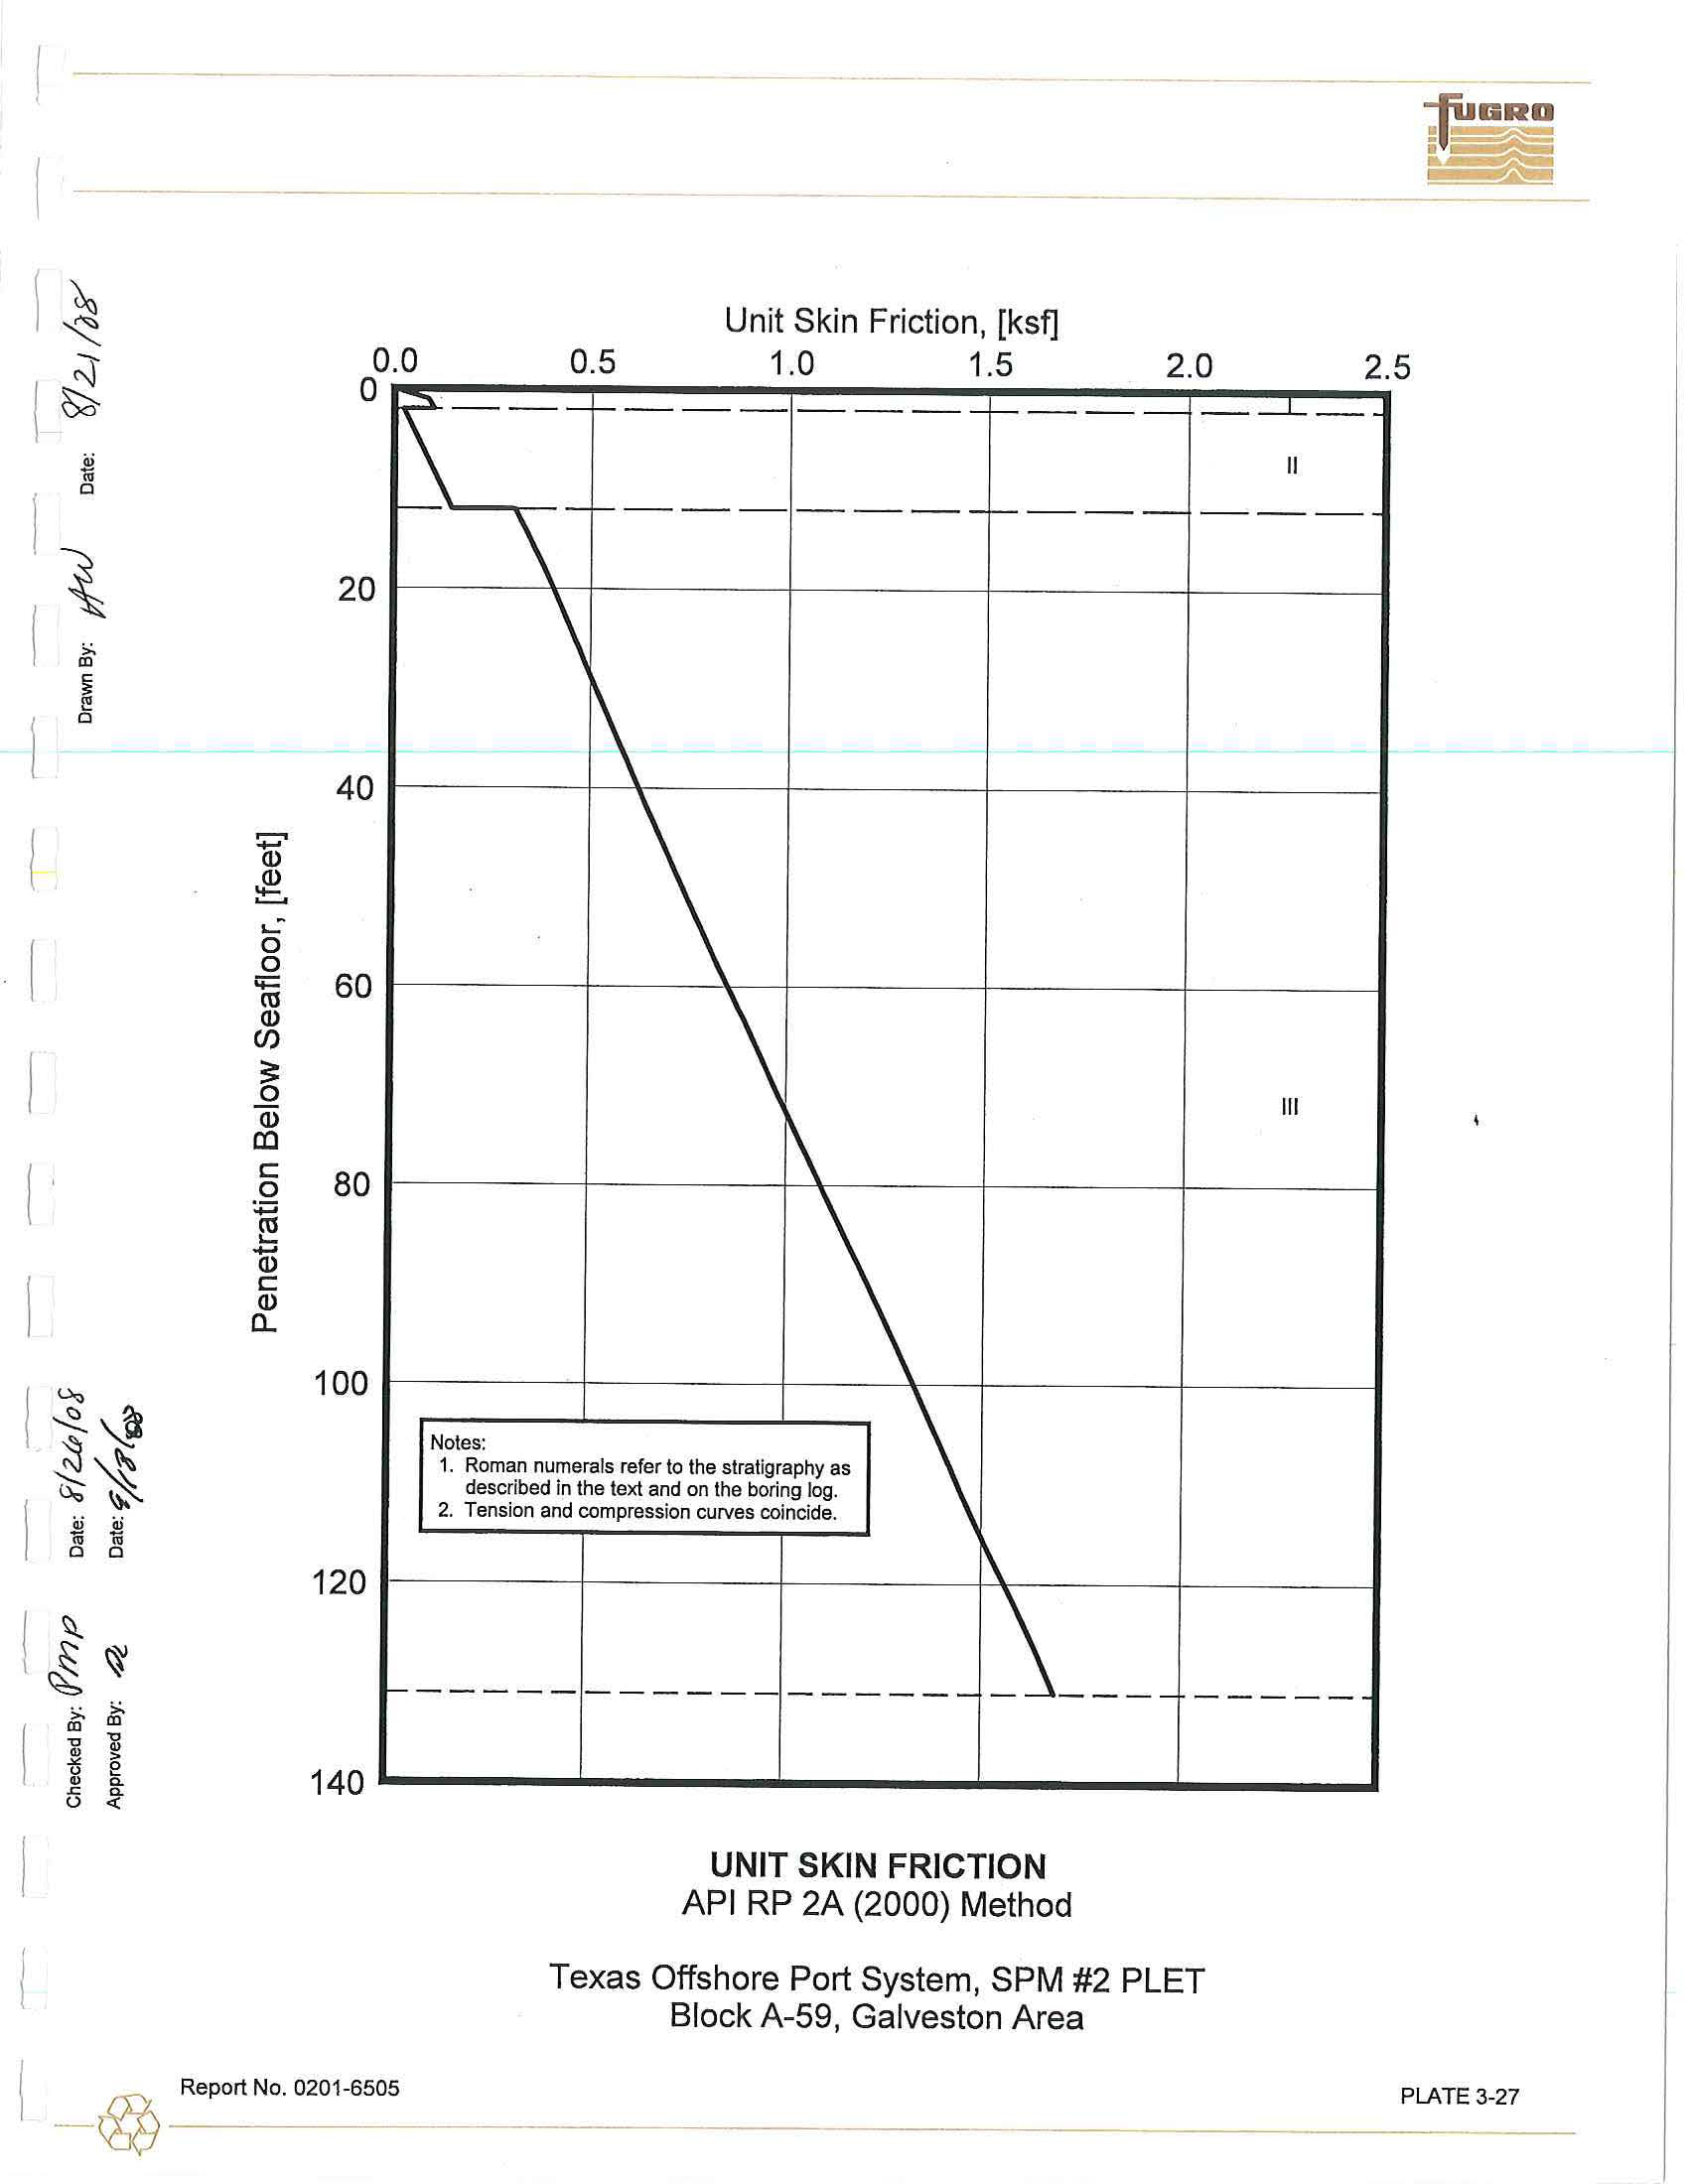
t Skin
Friction,
[ksf]
0.5
1.0
1.5
Notes:
1. Roman
numerals
refer
to
the stratigraphy
as
described in the text and on the
boring
log
.
2. Tension and compression
curves coincide.
2
.
0
2.5
II
Ill
e
0
0)
Q.
.c
Q.
140._
______________....,________________________...
(.)
<(
i
Report No. 0201-6505
-
@
~~
UNIT SKIN FRICTION
API RP
2A (2000) Method
Texas Offshore Port System, SPM #2 PLET
Block A-59, Galveston
Area
PLATE3-27
~
Q)
~
..__-
0
0
ti=
ca
Q)
U)
3:
0
co
Q)
c
0
:..::::;
-
~
Q)
c
Q)
a..
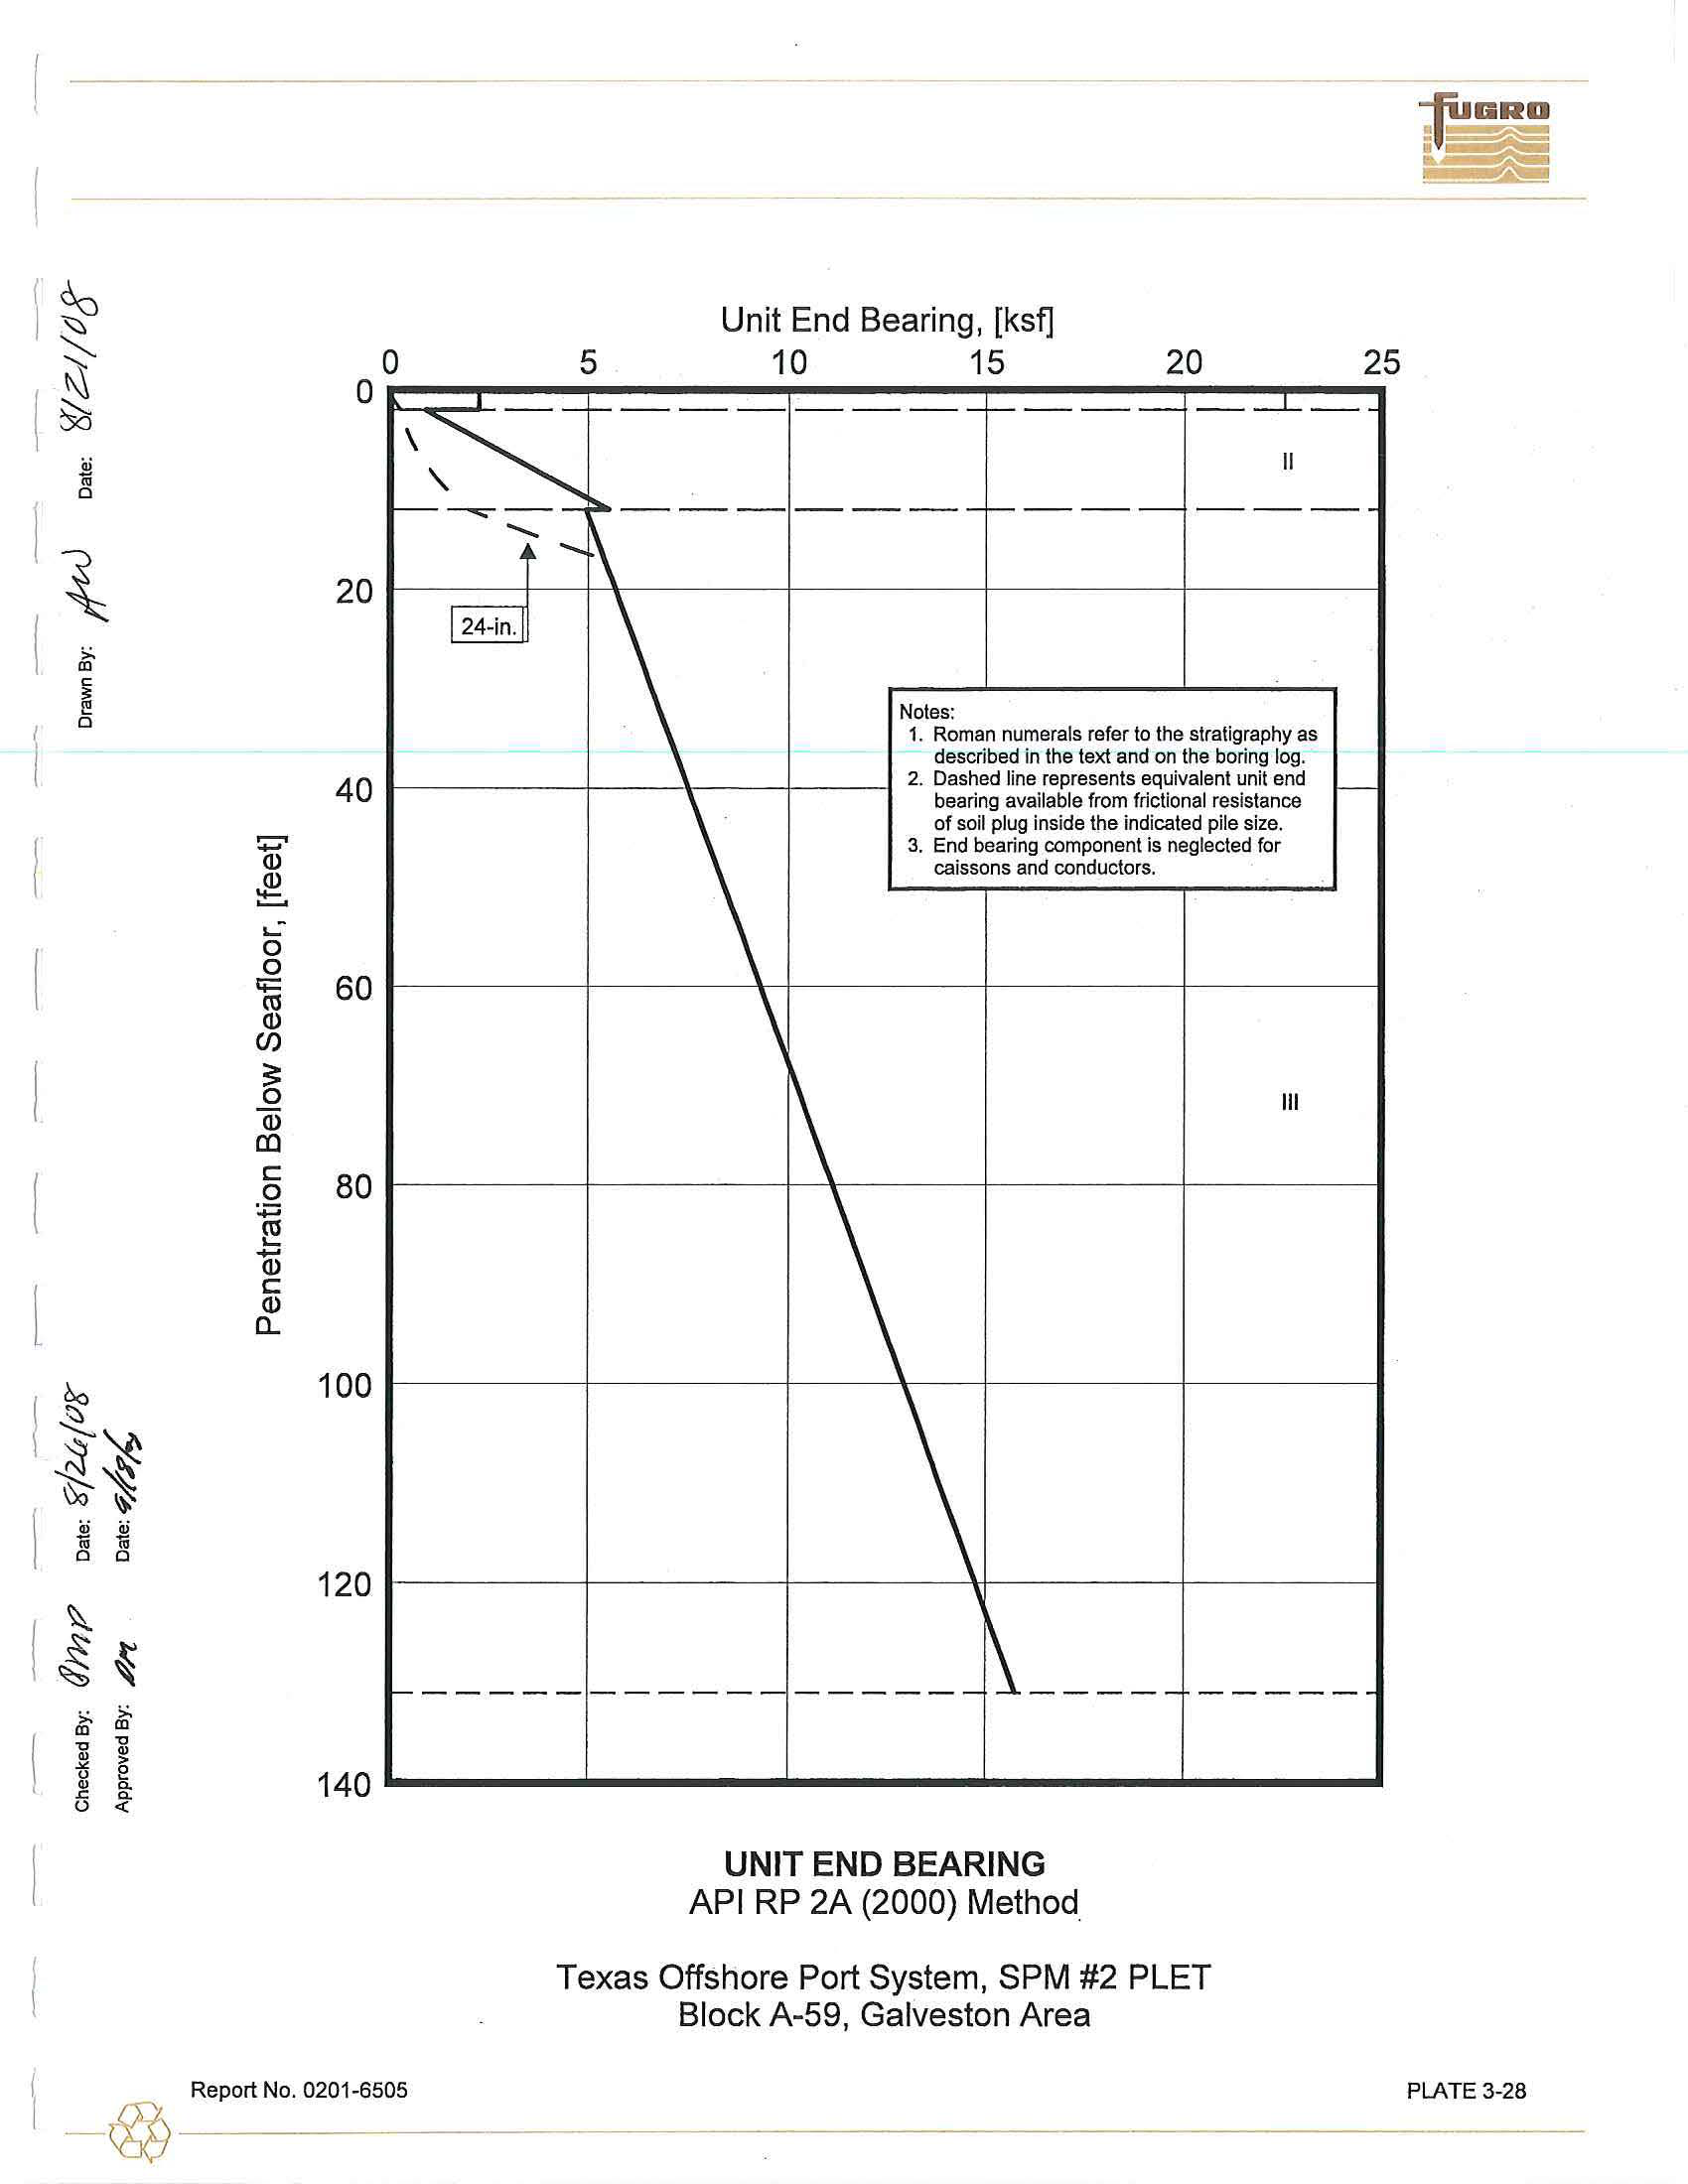
Unit
E
nd
Bearing,
[ksf]
0
5
10
15
20
25
0
.---..---......--------------------------------.....-----
II
Not
es:
1
.
Roman numerals
re
fer
to the
stratigra
p
hy
as
des
cribe
d in
the
text and
on
the boring
log
.
40
---
-
-
---+----.
___
_,__-.,
2.
Dashed
line
represents equivalent unit end
bearing available from
f
riction
al
resistance
of soil
plug inside
the
ind
icate
d pile
size.
3.
End
bearing component is
neglected
for
caissons and conductors.
Ill
140
.._______...______.....,.__________________________.
UNIT
END BEARING
API RP 2A (2000) Method
.
Texas Offshore Port System,
SPM #2 PLET
Block A-59, Galveston Area
Report No.
0201-6505
-@---
PLATE
3-28
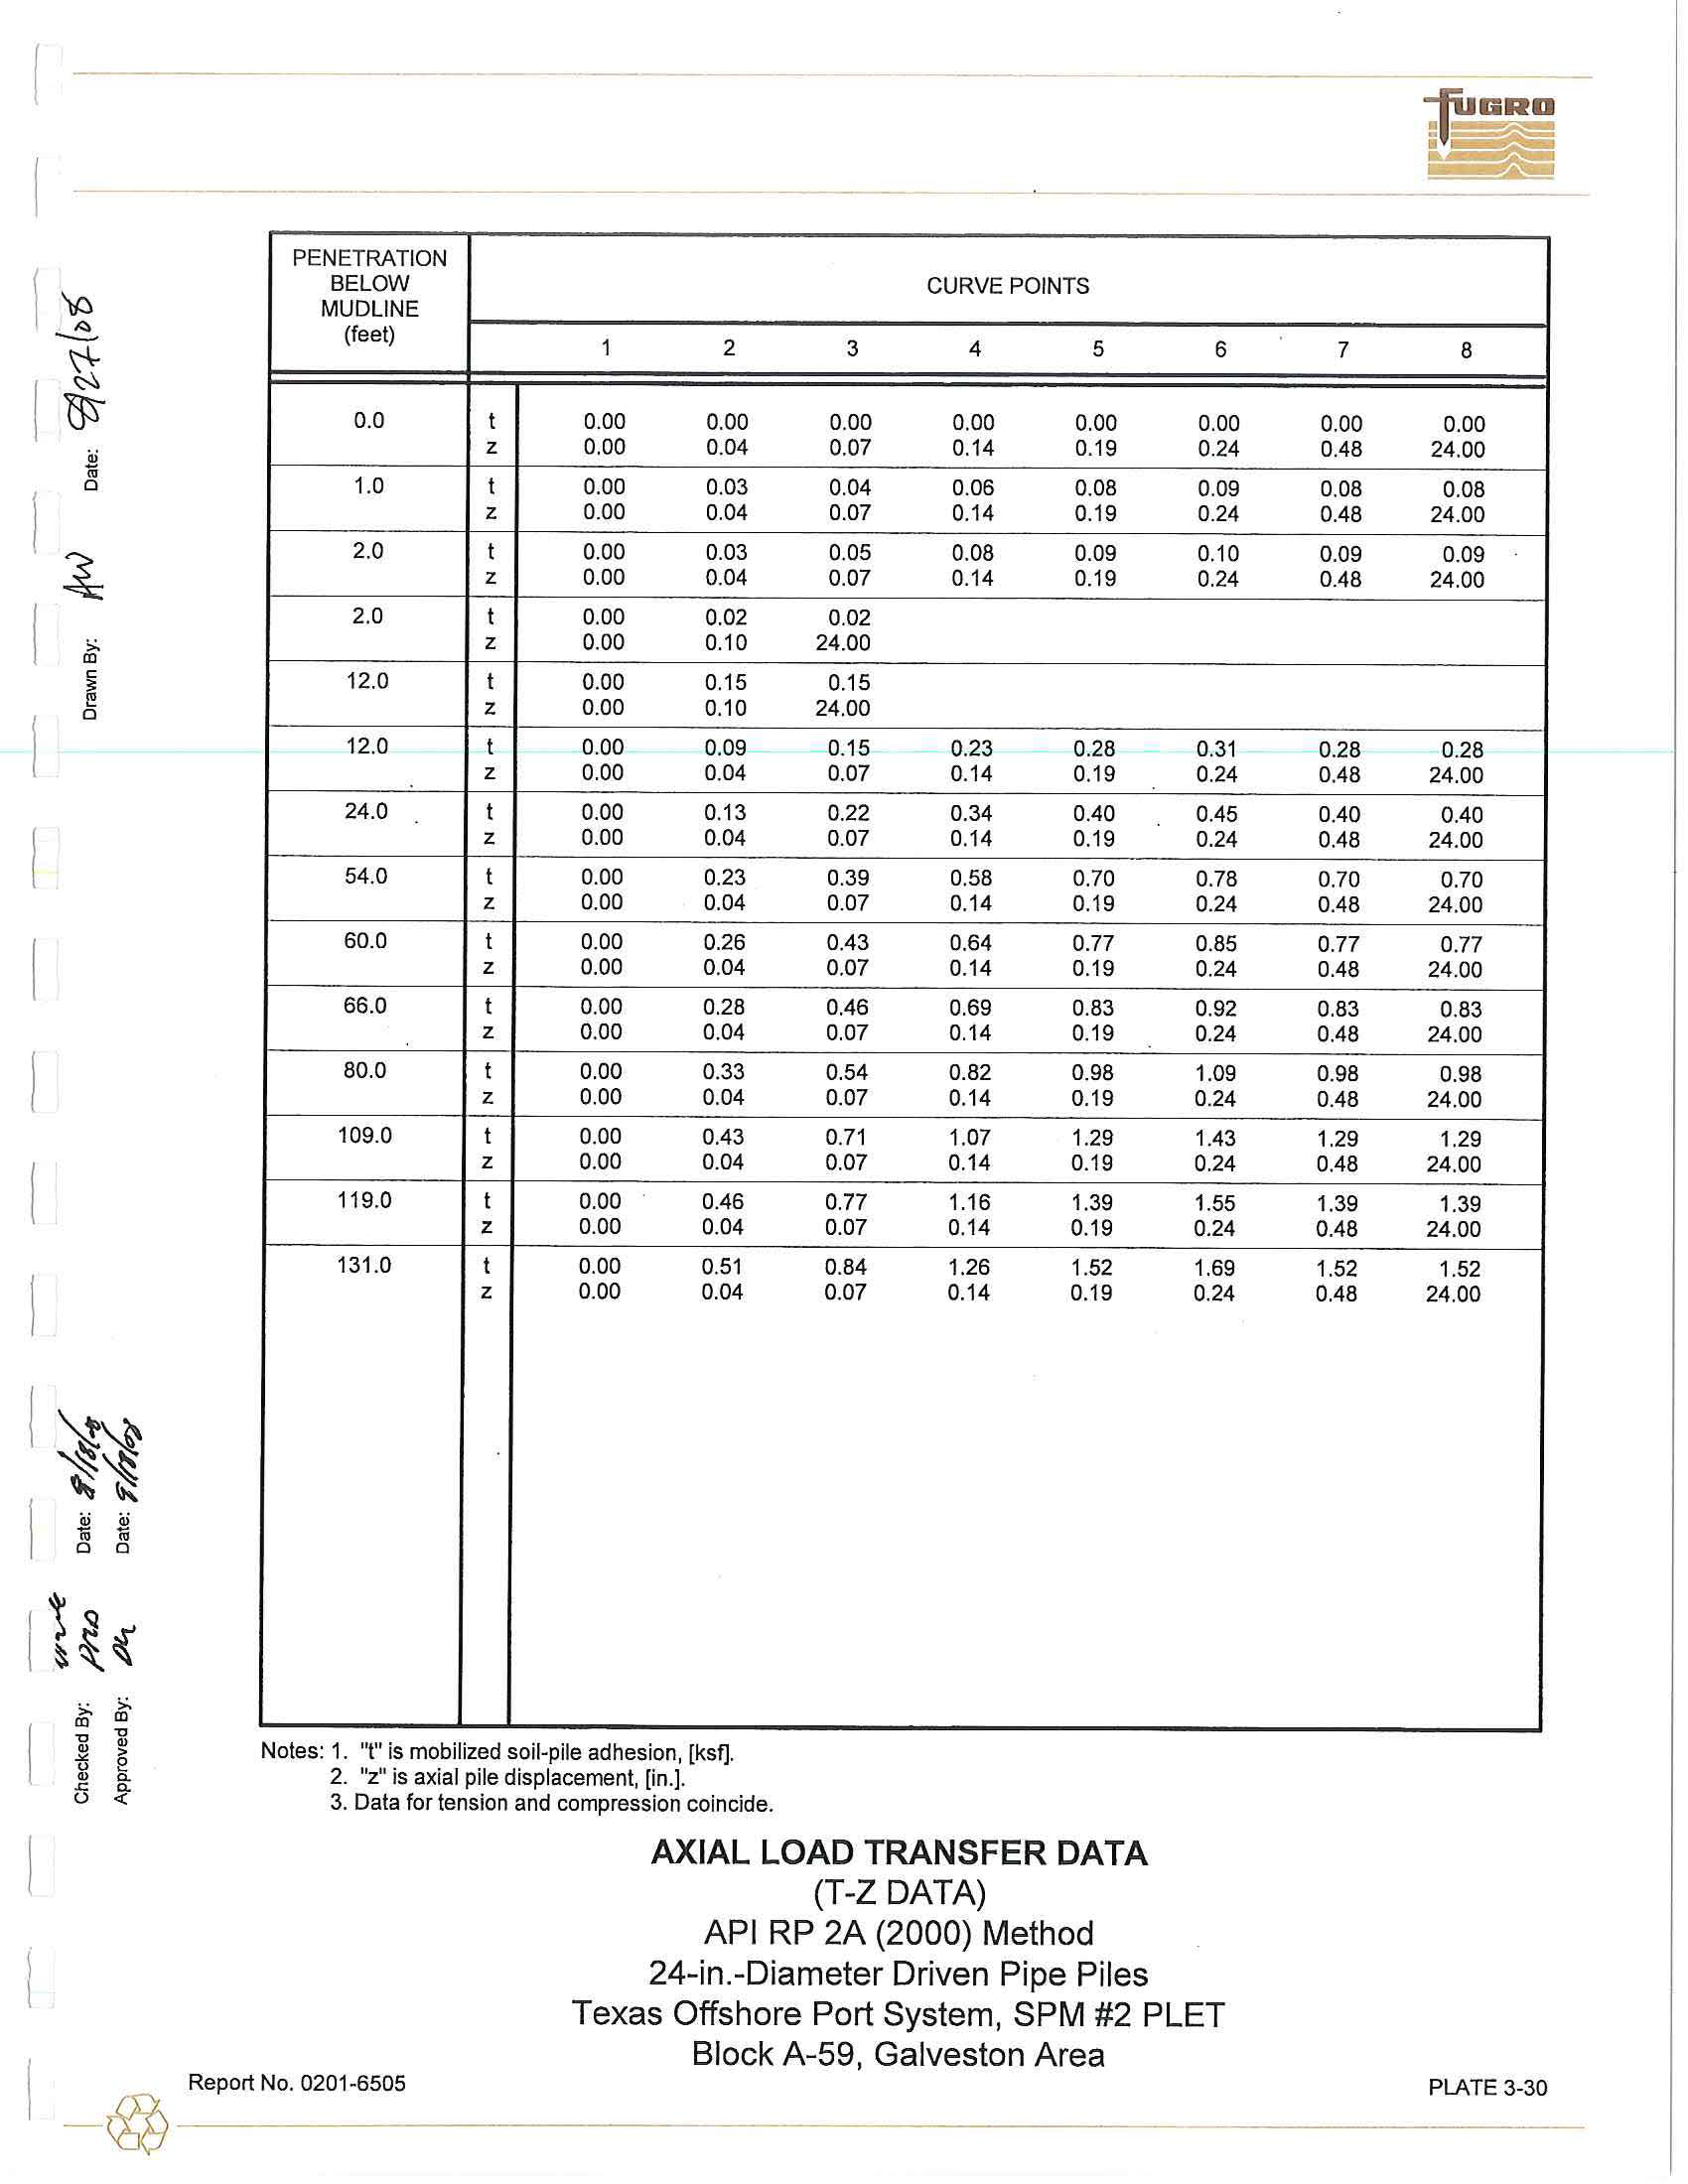
PENETRATION
BELOW
CURVE POINTS
MUDLINE
(feet)
1
2
3
4
5
6
0
.
0
t
0.00
0
.
00
0
.
00
0.00
0.00
0.00
z
0.00
0
.
04
0.0
7
0
.
14
0.
19
0.24
1
.0
t
0.00
0.03
0.04
0.06
0
.
08
0
.
09
z
0.00
0.04
0.07
0.14
0
.19
0
.24
2.0
t
0.00
0.03
0.05
0
.08
0
.
09
0.10
z
0
.
00
0
.
04
0
.
07
0
.14
0
.19
0.24
2.0
t
0
.00
0.02
0
.
02
z
0
.0
0
0.10
24.00
12.0
t
0
.
00
0.15
0.15
z
0
.00
0.10
24.00
12.0
t
0.00
0
.
09
0
.
15
0.23
0.28
0.31
z
0.00
0
.
04
0
.
07
0
.1
4
0
.
1
9
0
.2
4
24.0
t
0.00
0
.
13
0.22
0
.
34
0.40
0.45
z
0.00
0.04
0.07
0
.
14
0.19
0.24
54.
0
t
0.00
0.2
3
0.39
0.58
0.70
0
.78
z
0.00
0
.0
4
0.07
0.14
0.19
0
.24
60.0
t
0.00
0
.26
0.43
0
.
64
0.77
0.85
z
0.00
0
.
04
0
.07
0
.14
0.19
0
.2
4
66.0
t
0
.
00
0.28
0.46
0.69
0.83
0
.92
z
0
.
00
0
.
04
0.07
0.14
0.19
0
.
24
80.0
t
0.00
0
.3
3
0.54
0.82
0.98
1.09
z
0.00
0
.
04
0.07
0.14
0.19
0
.2
4
109
.0
t
0.00
0.43
0.7
1
1.07
1.29
1.4
3
z
0
.0
0
0.04
0.07
0.14
0.19
0.24
119
.
0
t
0.00
0.46
0.77
1.16
1.39
1
.5
5
z
0.00
0
.
04
0
.07
0.14
0
.19
0.24
131.0
t
0.
00
0
.
51
0.84
1
.26
1.52
1.69
z
0
.
00
0.04
0
.07
0.14
0.
19
0.24
(()
>.
(()
>.
'C
"C
.,
~
N
otes:
1
.
"
t
"
is
mobilized
so
il
-pile
adhesion, [ksf].
"".,u
ec.
.c
c.
2. "
z
" i
s
axial
pile
displacement,
[in
.
]
.
u
<i:
3.
Data
for t
ens
ion
and
com
pres
sion
coinc
id
e
.
AXIAL LOAD
TRANSFER DATA
(T-Z DATA)
API RP
2A (2000) Method
24-in
.-
Diameter
Driven Pipe Piles
Texas
Offshore
Port
System
,
SPM #2 PLET
Block
A-59, Galveston
Area
I
R
e
port
No
.
0201-6505
-
@
---
7
8
0.00
0.00
0.48
2
4
.
00
0
.
08
0
.
08
0.48
24
.
00
0.09
0.09
0.48
24.00
0
.28
0.28
0.48
24
.00
0.40
0
.40
0.48
24.00
0.70
0.70
0.48
24
.0
0
0.77
0.77
0.48
24.00
0.83
0.83
0.48
2
4
.00
0.98
0.98
0.48
2
4
.
00
1.29
1
.
29
0.48
24.00
1
.
39
1
.39
0.48
24.00
1.52
1.52
0.48
24.00
PLA
TE
3-30
I
1
g
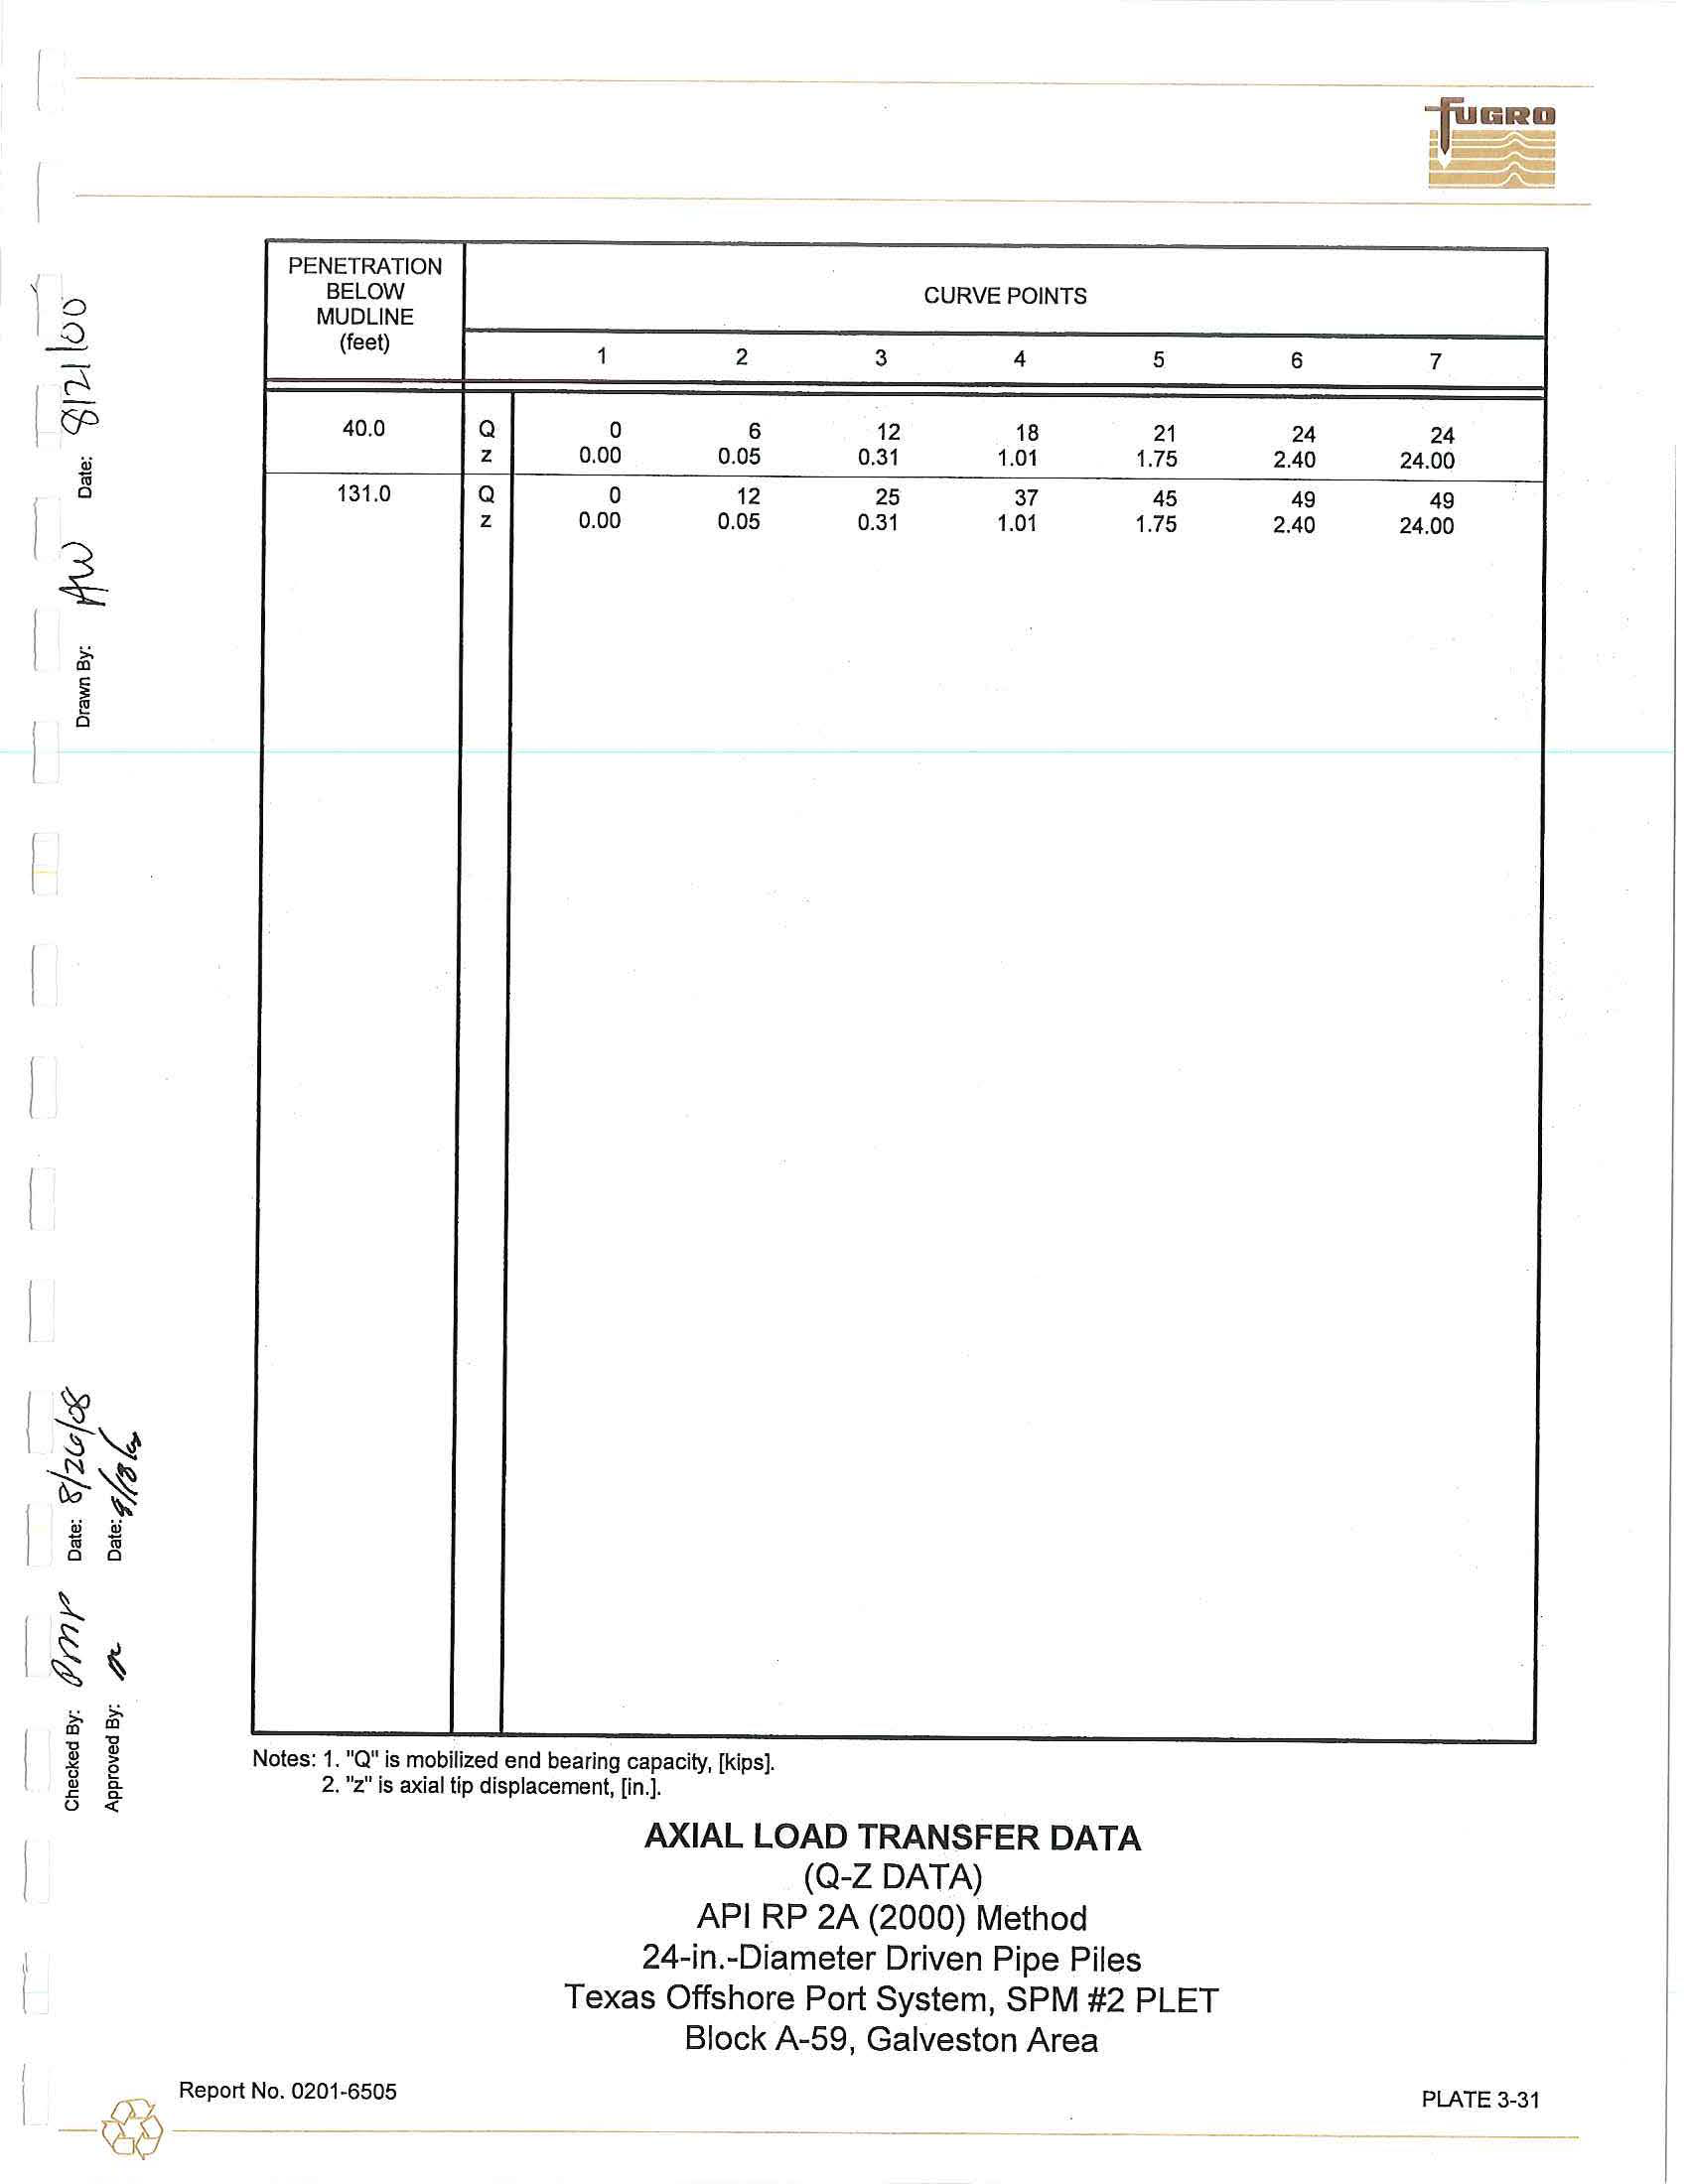
PENETRAT
I
ON
BELOW
CURVE
POINTS
MUDLINE
(feet)
1
2
3
4
5
40.0
Q
0
6
12
18
21
z
0
.
00
0
.
05
0
.3
1
1.01
1.75
131
.
0
Q
0
12
25
37
45
z
0.00
0
.0
5
0.31
1.01
1
.75
Notes:
1. "Q" is
mobilized e
nd
bearing capacity,
[kips].
2.
"z"
is
axial
tip displacement, [in.].
AXIAL
LOAD TRANSFER
DATA
(Q
-Z
DATA)
API RP
2A (2000) Method
24
-
in
.
-Diameter Driven
Pipe
Piles
Texas Offshore
Port
System, SPM #2 PLET
Block
A
-
59, Galveston Area
-
@
Rep
ort
No.
0201-6505
6
7
24
24
2.40
2
4.00
49
49
2.40
24.00
PLATE
3-31
(
I
""
~
(
t
'fP
I
i
~
[
6i'
0
~
I
-
@
eport No
.
0201-6505
~
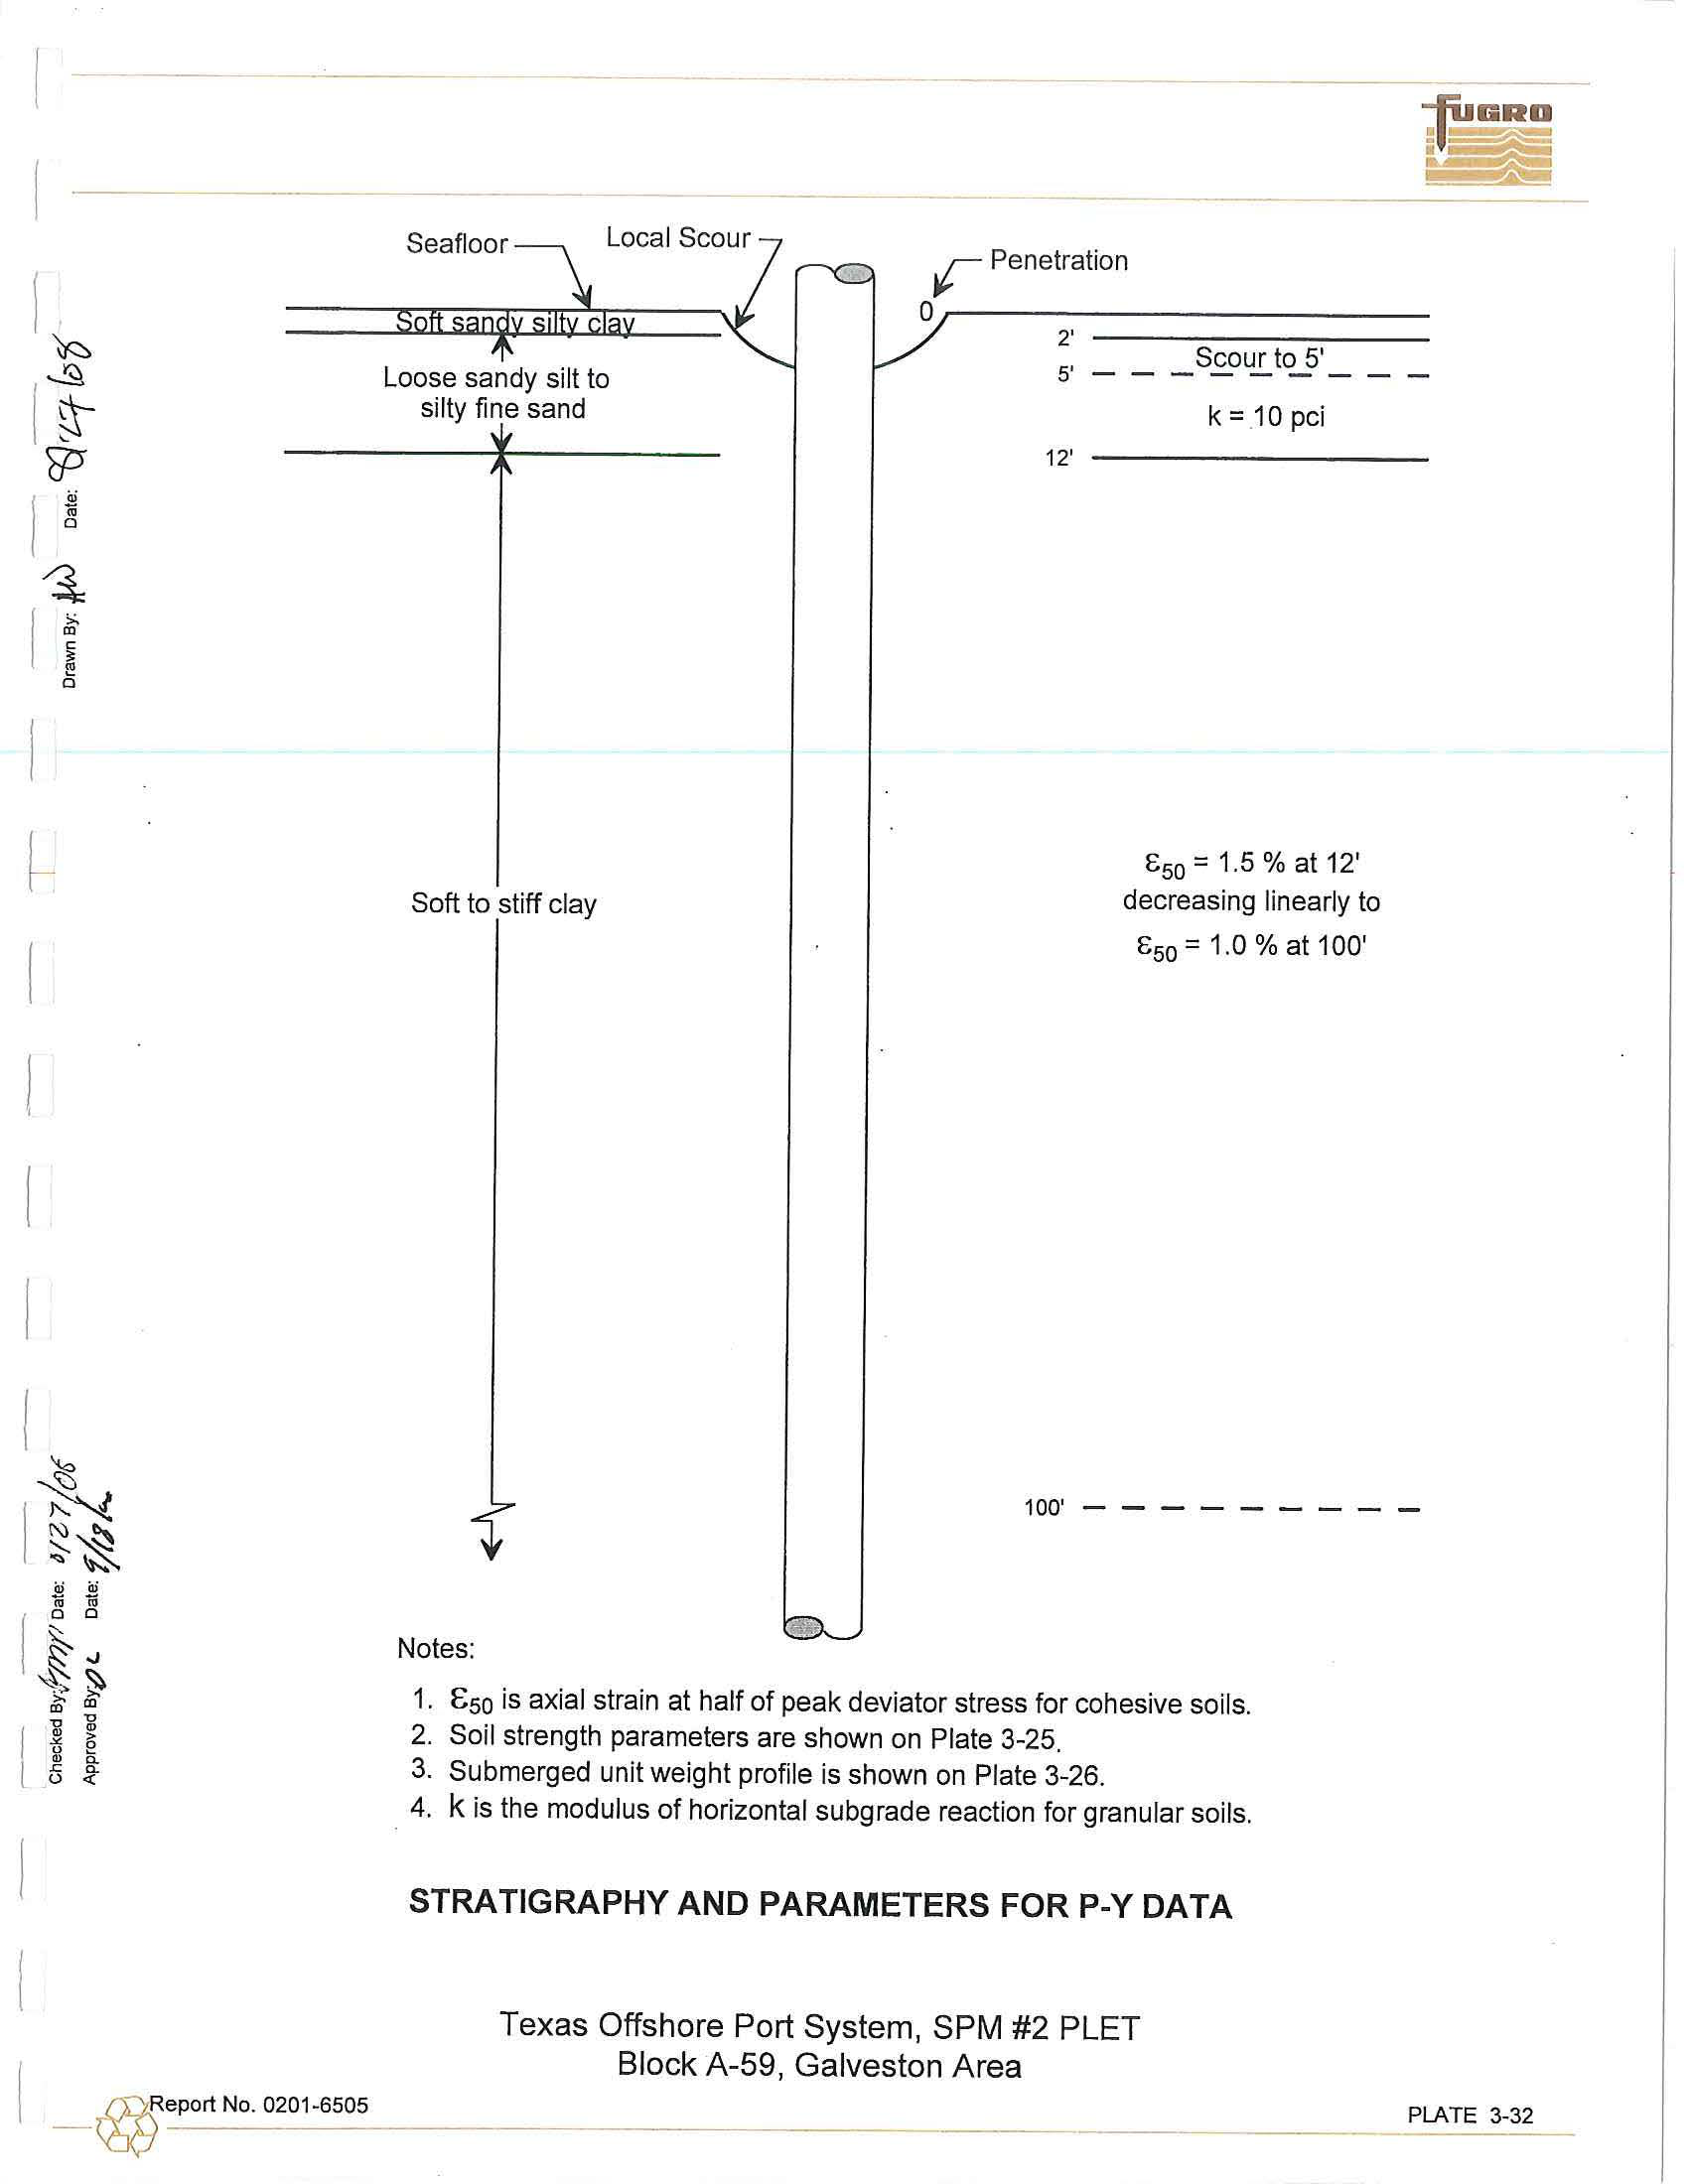
Penetration
0
,-------------
2'
~-
--
----~
Loose sandy silt to
silty
fine sand
Scour to
5'
5'
-
-
-
-
-
-
-
-
-
k
=
.
10 pci
12'
---------
Soft
to
stiff
clay
E
50
=
1
.
5
%
at
12'
decreasing linearly to
E50 =
1
.
0
%
at 100
'
100'
-
-
-
-
-
-
-
-
-
Notes:
1
.
Eso is a
x
ial strain at half of peak deviator
stress
for
cohesive soils.
2
.
Soil strength parameters are shown on Plate
3-25
.
3.
Submerged unit weight profile is shown on Plate 3-26
.
4.
k
is the modulus of horizontal subgrade reaction for granular
soils.
STRATIGRAPHY
AND
PARAMETERS FOR
P-Y
DATA
Texas Offshore Port System,
SPM
#2 PLET
Block A
-
59, Galveston Area
PLATE
3-32
!?
t1J
I
~
I
~
!
I
t
~
"C
"C
Q)
Q)
t5
e
.,
0..
.c
0..
(.)
~
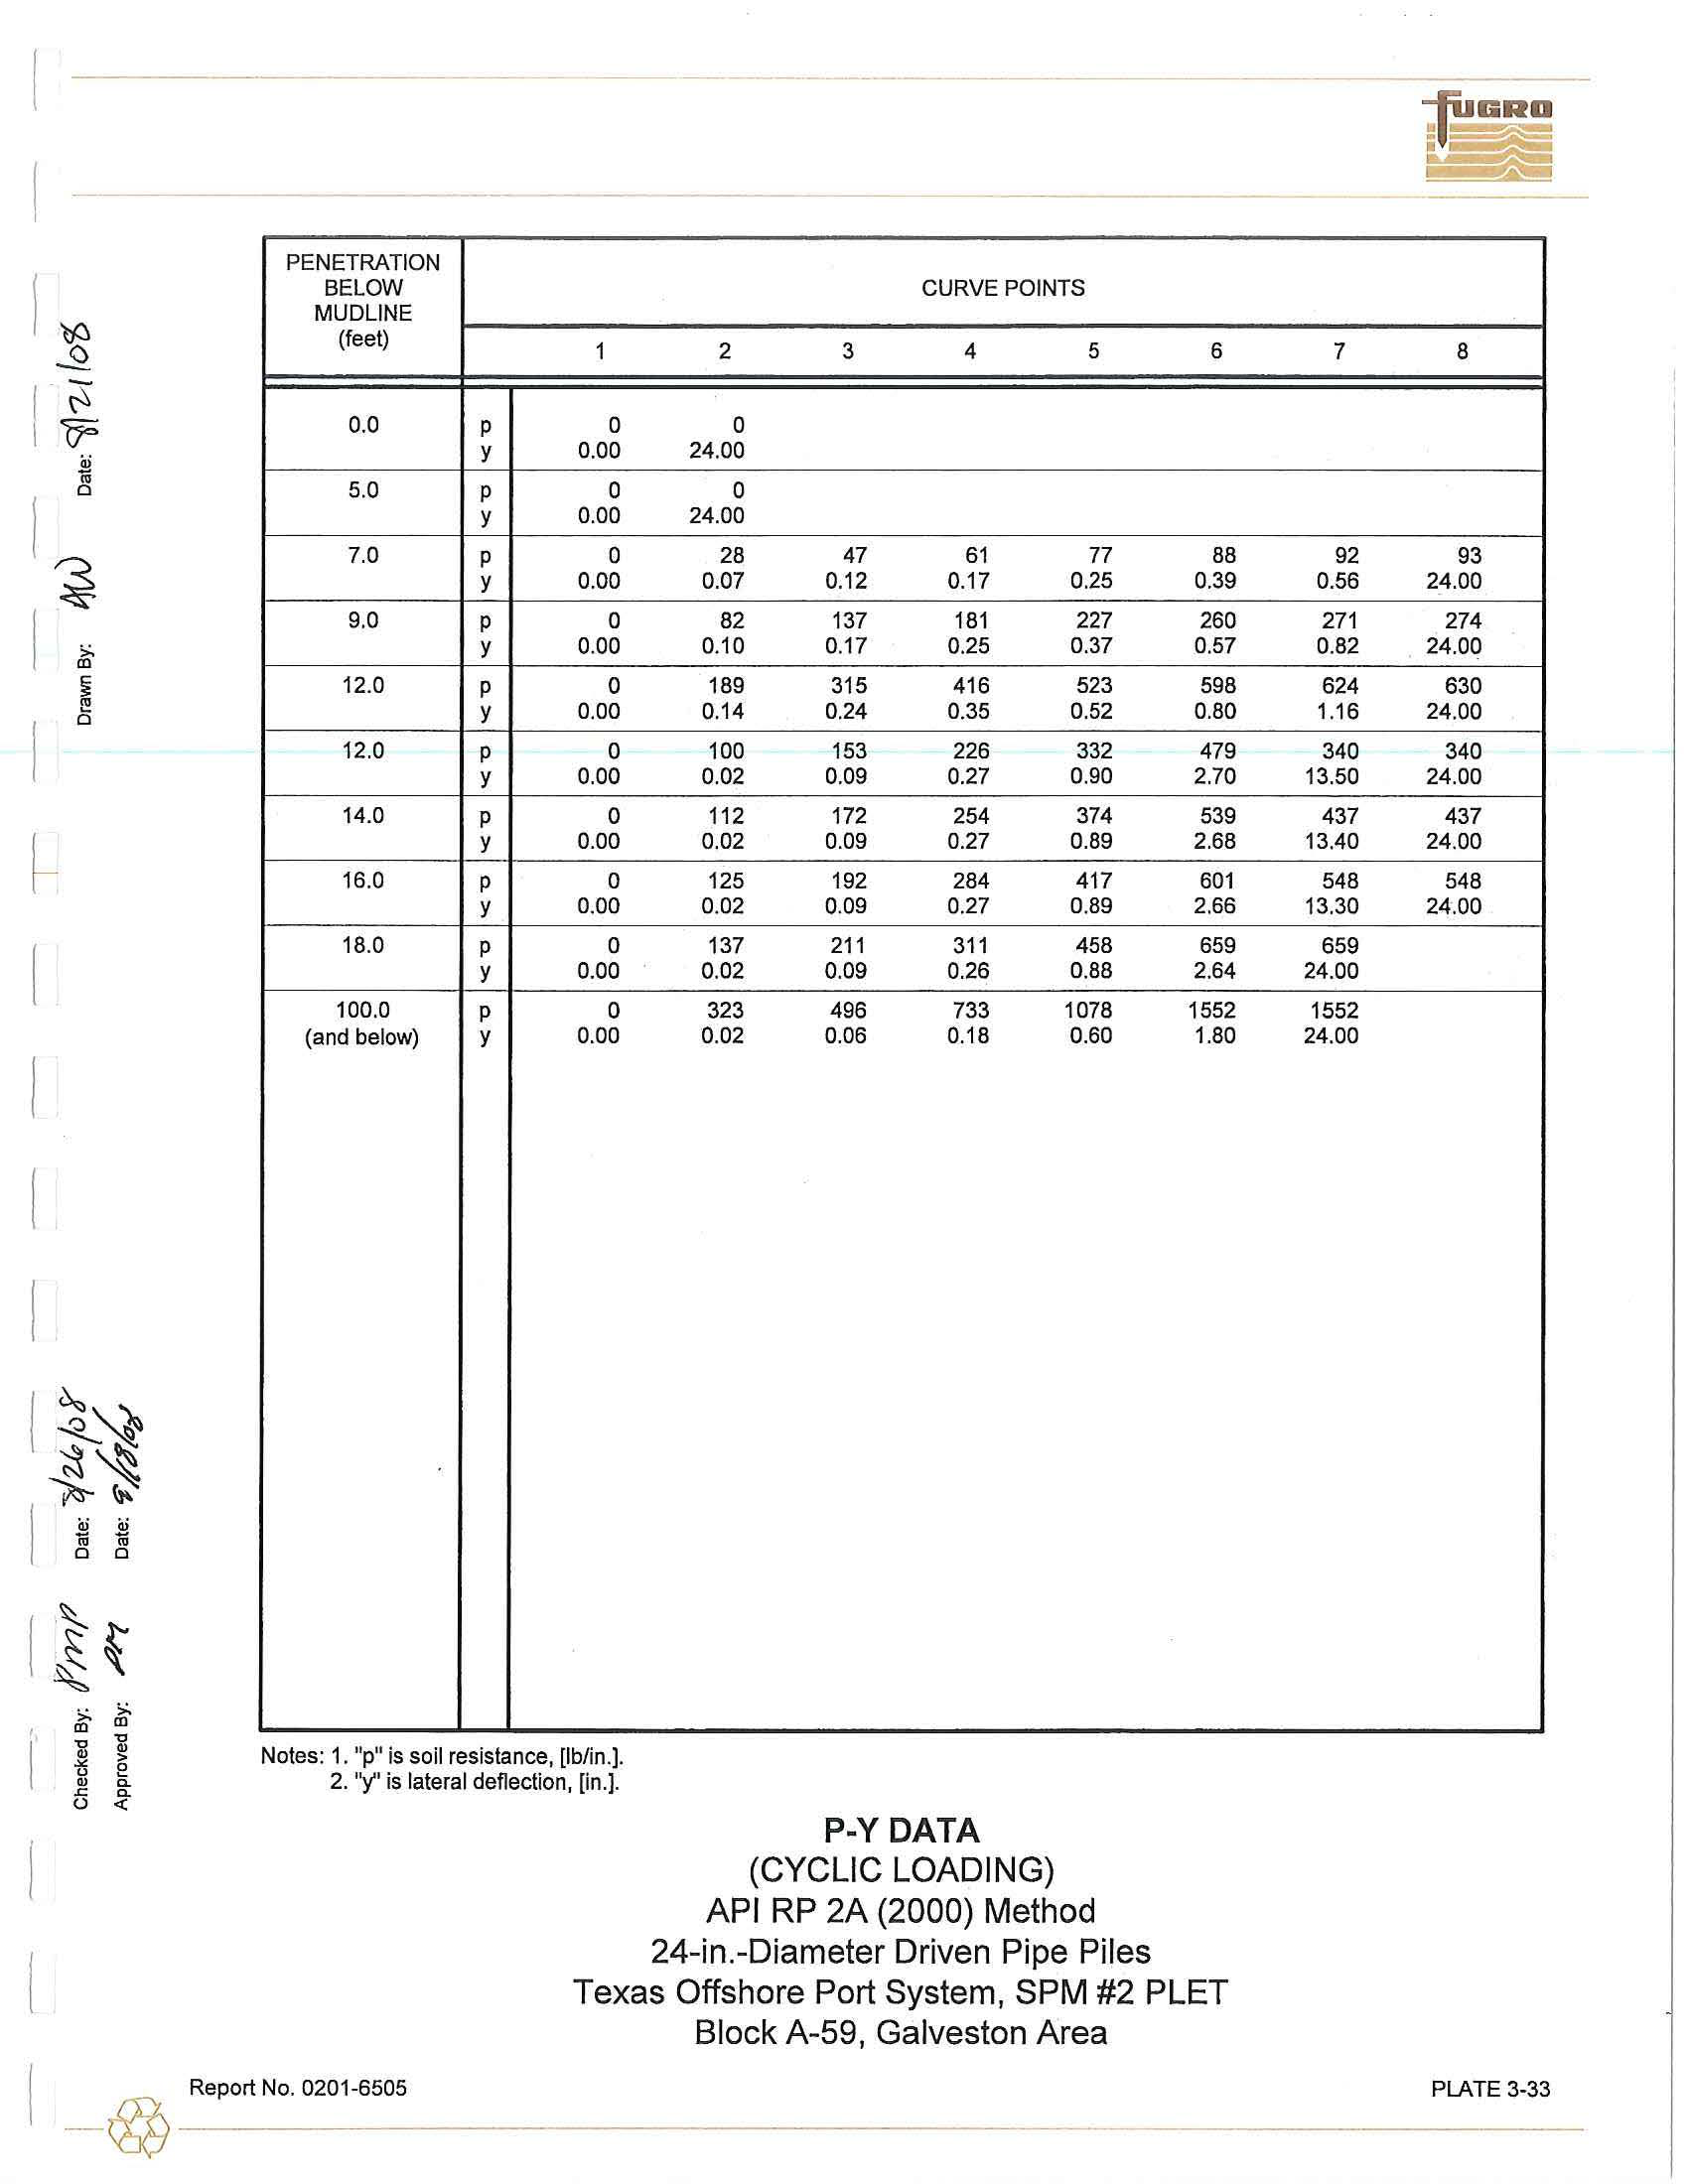
PENETRATI
O
N
BELOW
CURVE POINTS
MUDLINE
(
feet)
1
2
3
4
5
6
0.0
p
0
0
y
0
.
00
24
.
00
5
.
0
p
0
0
y
0.00
24
.
00
7
.
0
p
0
28
47
61
77
88
y
0.00
0.07
0.12
0
.
17
0.25
0
.
39
9
.
0
p
0
82
1
3
7
181
227
260
y
0.00
0
.
10
0
.
17
0
.
25
0.37
0
.
57
12
.
0
p
0
189
315
416
523
598
y
0
.
00
0
.
14
0
.
24
0
.
35
0.52
0
.
80
12
.
0
p
0
100
153
226
332
479
y
0.00
0.02
0
.
09
0.27
0.90
2.70
14
.
0
p
0
112
172
254
374
539
y
0
.
00
0.02
0
.
09
0
.
27
0.89
2.68
16
.
0
p
0
125
192
284
417
601
y
0
.
00
0
.
02
0
.
09
0
.
27
0
.
89
2.66
18.0
p
0
137
211
311
458
659
y
0.00
0
.
02
0.09
0.
2
6
0
.
88
2.64
100
.
0
p
0
323
496
733
1078
1552
(
and
below)
y
0.00
0
.
02
0.06
0.18
0.60
1.80
Notes:
1
. "
p"
i
s
soil
resistance, [lb/in
.
].
2.
"y''
is lateral
deflection,
[in.]
.
P
-
Y DATA
(CYCLIC LOADING)
API RP
2A
(2000) Method
24-in
.
-Diameter
Driven
Pipe Piles
Texas Offshore Port System, SPM
#2 PLET
B
lock
A
-
59, Galveston Area
I
Report No. 0201-6505
-
@
------
7
8
92
93
0.56
24.00
271
274
0
.
82
24.00
624
630
1
.
16
24
.
00
340
340
13.50
24.00
437
437
13
.
40
24.00
548
548
13.30
24
.
00
659
24
.
00
1552
24
.
00
PLATE 3-33
Date
j .
<l,'
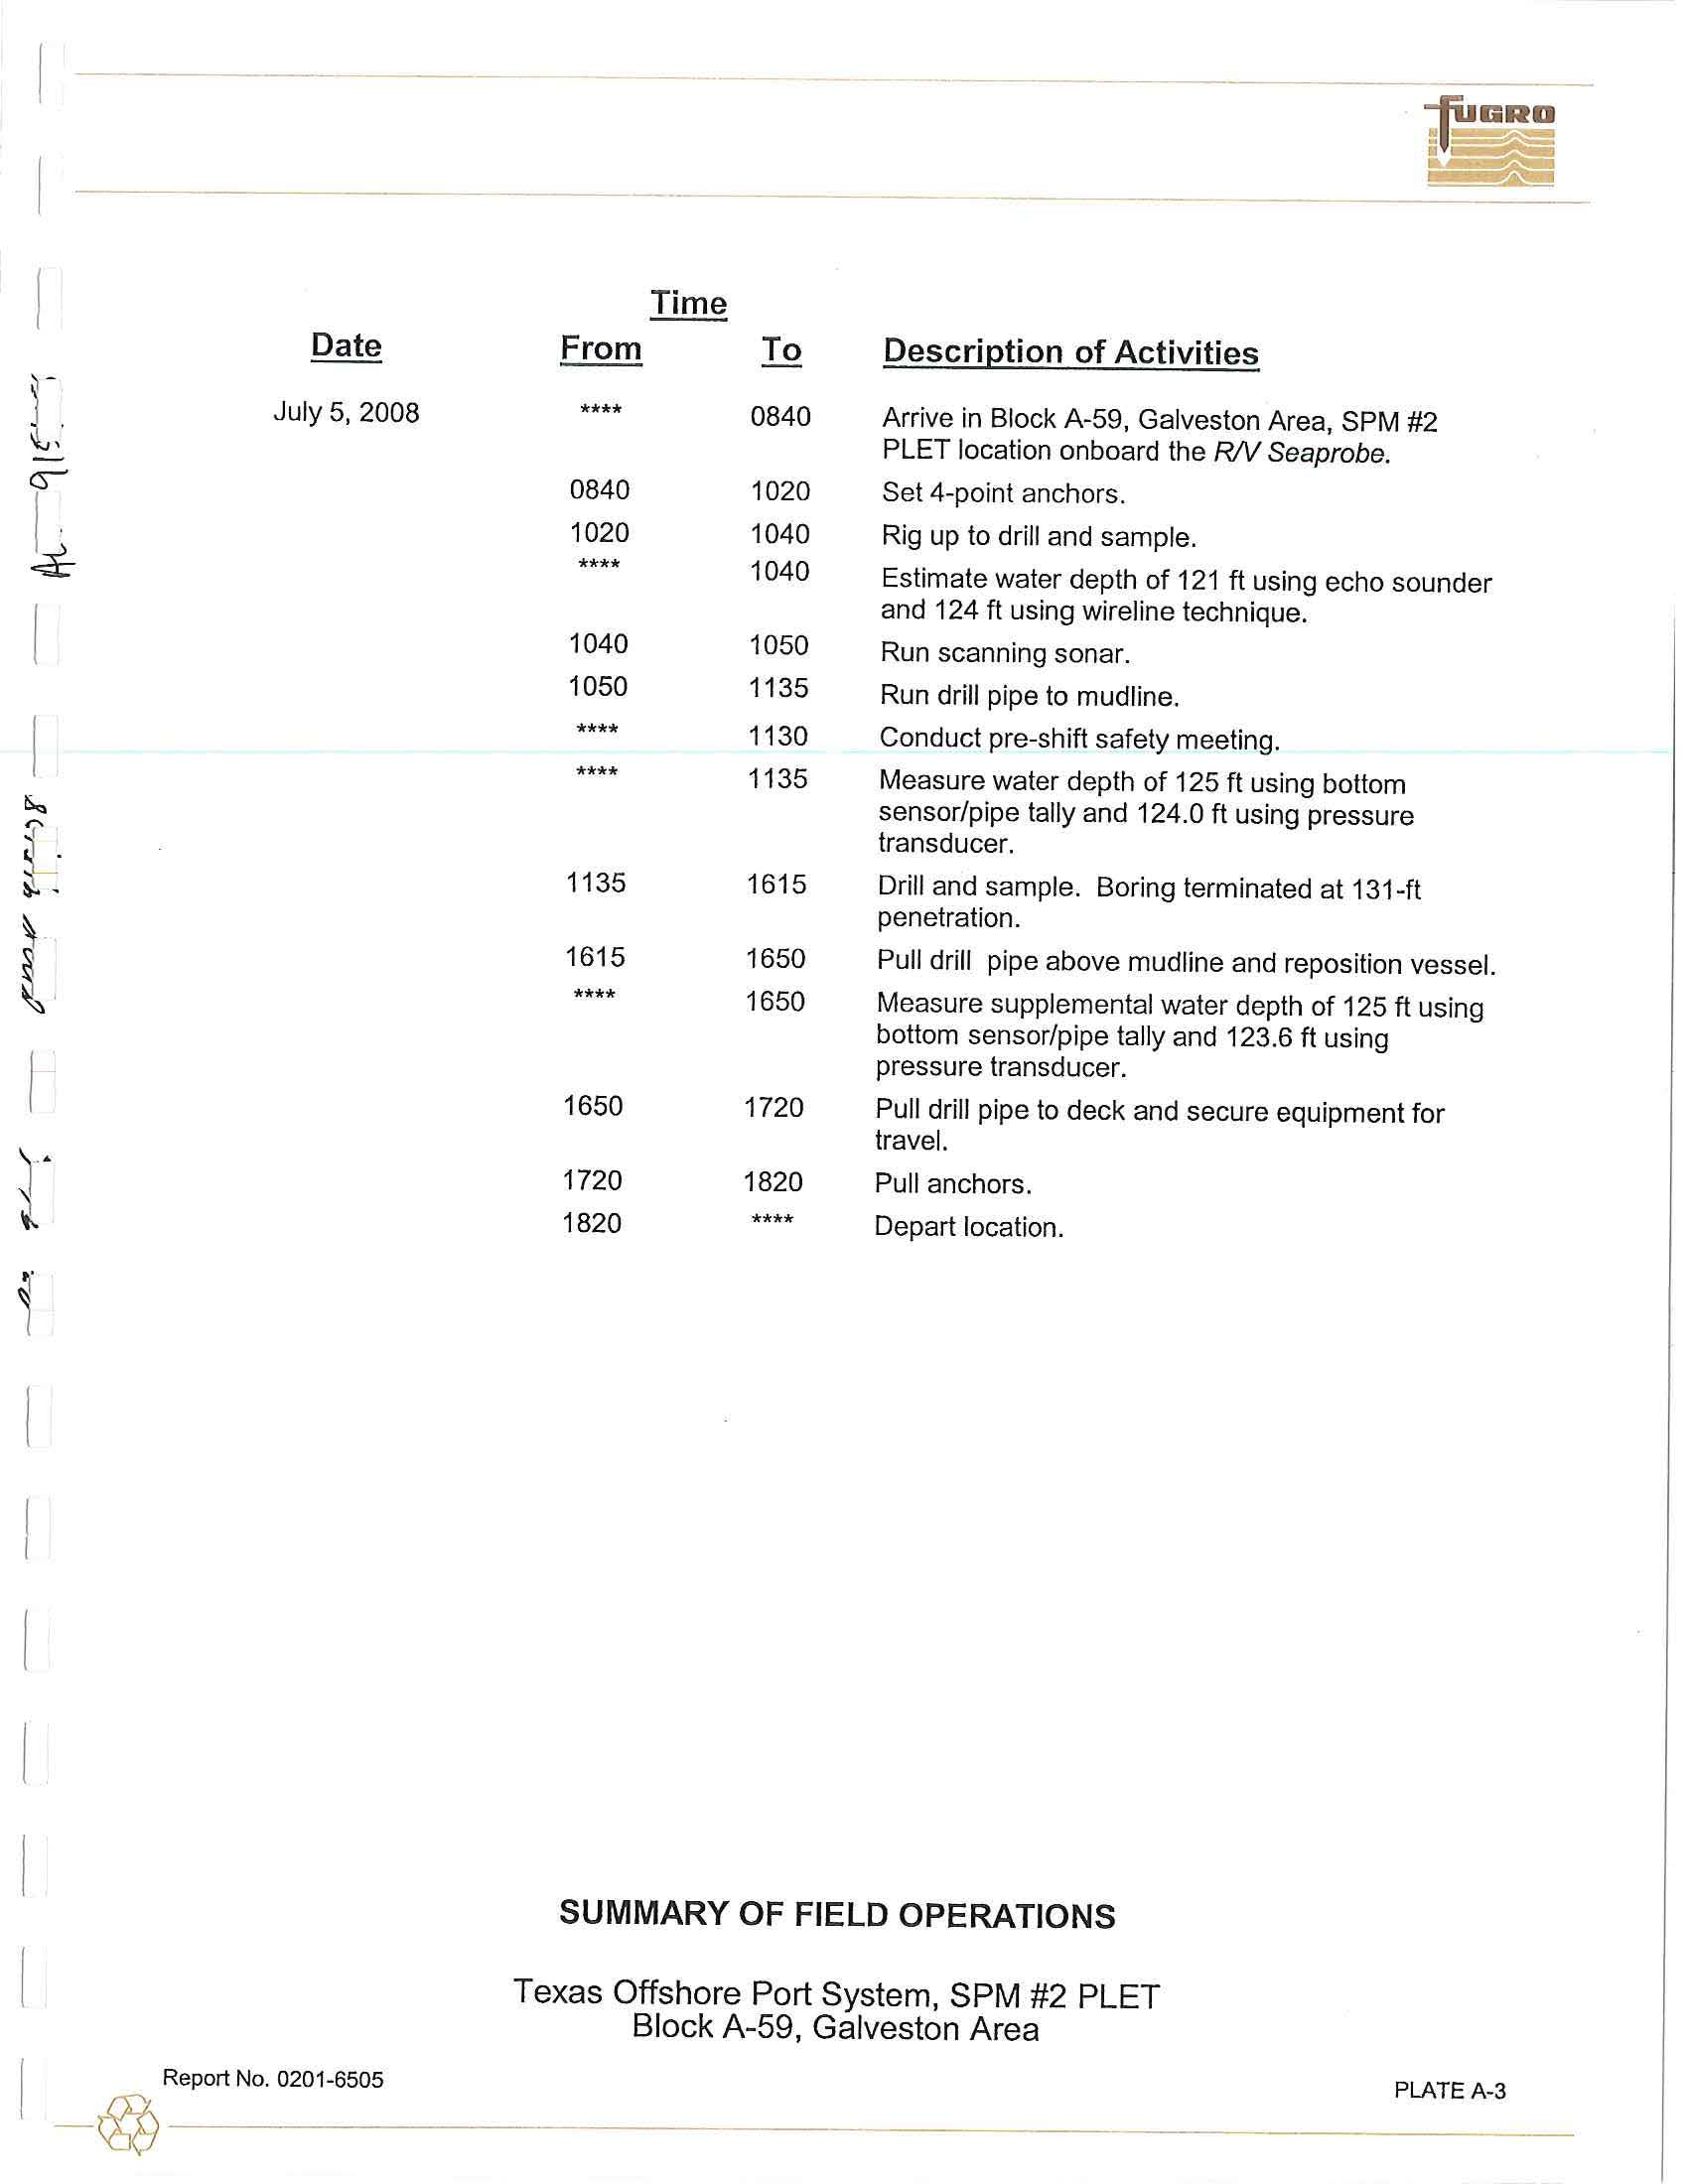
July 5
,
2008
cs-
I
.
~
I
I
ts...
'i'
f-
.
~
.
~
,'...
~
.
,
Time
From
To
Descri~tion of Activities
****
0840
Arrive
in Block A-59, Ga
l
vesto
n
Area, SPM #2
PLET location onboard the
RIV Seaprobe.
0840
1020
Set 4-point
anchors
.
1020
1040
Rig
u
p to d
r
ill and
sample
.
****
1040
E
stimate water depth
of 121 ft us
i
ng echo
so
u
nder
and
124 ft using wire
li
ne techn
i
que.
1040
1050
Run
scan
ni
ng sonar.
1050
1135
Run dri
ll
p
i
pe
t
o mud
lin
e.
****
1
1
30
Conduct pre-shift
safety
meet
i
ng.
****
1135
Measure wa
t
er
depth
of 125 ft using bottom
senso
r
/pipe tally and 124.0 ft usi
n
g pressure
t
r
ansd
u
ce
r
.
1135
16
1
5
Drill
and samp
l
e
.
Boring te
r
minated at
131-ft
penetration.
1615
1650
Pu
ll
dri
ll
pipe
above
mudl
i
ne and repos
i
tion vessel.
****
1
650
Measure
supplemental water
depth
of 125 ft using
bottom
sensor/pipe
tally and 123
.
6 ft
u
sing
pressure
t
ransd
u
cer
.
1650
1720
P
ull drill pipe to
deck and secure equipme
n
t for
tr
avel.
1
720
1820
Pull a
n
c
h
o
r
s.
1820
****
Depa
rt l
ocation
.
SUMMARY OF FIELD OPERAT
I
ONS
Texas Offs
h
o
r
e Port System, SPM #2
P
LET
Block A
-
59, G
a
lvesto
n
Area
r
Report No.
0201-6505
-
@
---
PLATE
A-3
I
@
::0
(1)
"O
0
;cl.
!=)
z
0
"-l
~
a,
CJ!
0
(.n
Checked
B
y
:
}f-W
Approved By:
~
Da
te
:
Date:
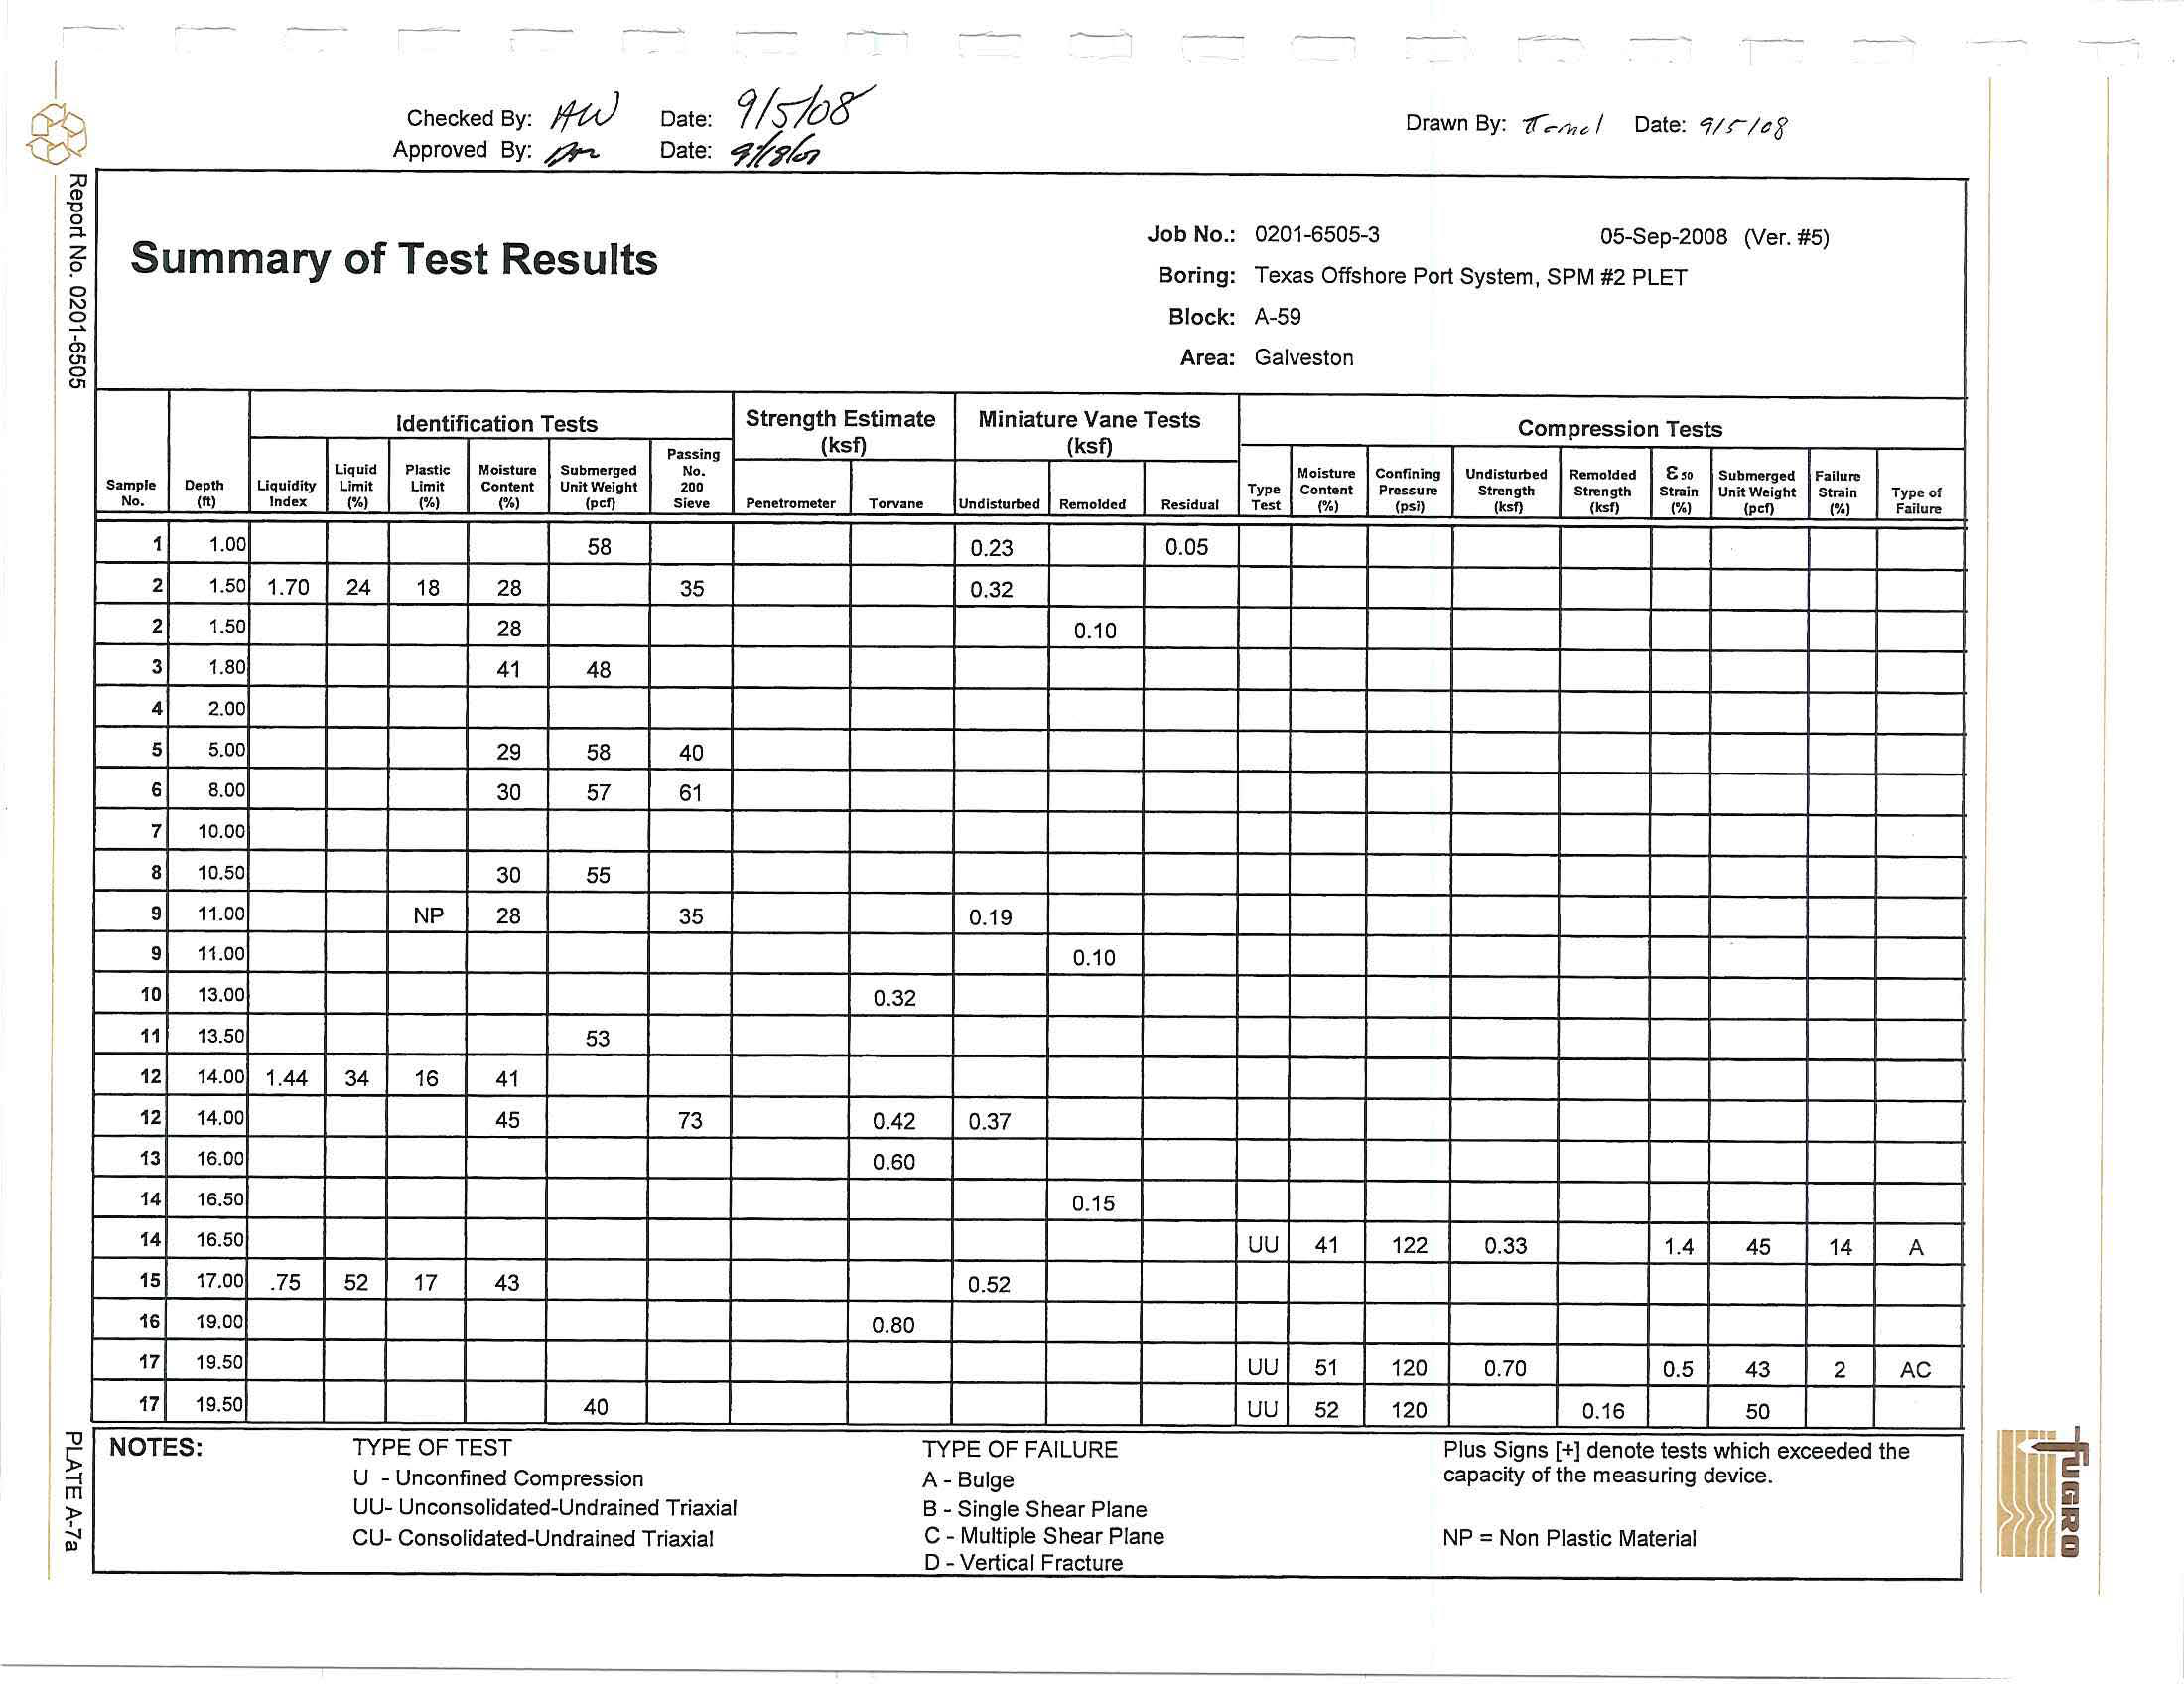
Summary of Test Results
Identificat
i
on Tests
P
assi
n
g
Li
quid
P
la
stic
Moisture
Sub
merged
No.
Sa
mpl
e
D
e
pth
Liquidity
Limit
Li
mi
t
Content
Unit Weight
200
No
,
cnJ
In
dex
(%)
(%)
r1
,
1
(pol)
Sf
eve
1
1
.
00
58
2
1
.
50
1
.70
24
18
28
35
2
1.
50
28
3
1.80
41
48
4
2.00
5
5.00
29
58
40
6
8.00
30
57
61
7
10.00
8
10
.50
30
55
9
11
.00
NP
28
35
9
11.00
1
0
13.00
11
13.50
53
12
14.
00
1
.
44
34
16
41
12
14.00
45
73
13
16
.
00
14
16.50
14
16
.
50
15
17.00
.75
52
17
43
16
19
.00
17
19
.
50
17
19
.
50
40
N
O
TES:
TYPE OFTEST
U -
Unconfined
Com
pres
sio
n
UU- Unconsolidated-Undrained Triaxial
CU
-
Consolidated-Undrained
Tri
axial
Draw
n
By
:
tr.-/he,
I
Date:
1/.s/'73
Jo
b
No.
:
0201-6505-3
05-Sep-2008
(Ve
r
.
#5)
Boring:
Texas
Offsho
re
Port
System, SPM
#2 PLET
Block: A-59
Area: Galveston
S
trength
Estimate
Miniature Vane
Tests
Compress
ion
Tests
(ksf)
(ksf)
Moistun!
Confining
Undisturbed
Re
m
olded
&,o
Subm
e
rg
e
d
Failure
T
ype
Content
P
r
essure
Stn!!ngth
Stfflngt
h
Strain
Unit Weight
Strain
T
ype of
Penetrometer
Torvane
Undisturbed
Remolded
Residual
Test
('/,
)
(psi)
(
ks!)
(ksl)
(%)
{p<I)
('/,)
Failure
0.23
0.05
0.32
0
.
10
0
.
19
0.10
0
.32
0.42
0
.
37
0
.
60
0.15
uu
41
122
0.33
1
.
4
45
14
A
0.52
0.80
uu
51
120
0.70
0.5
43
2
AC
uu
52
120
0
.1
6
50
TYPE
O
F F
AI
LURE
Plus Signs
[+]
denote tests which exceeded the
A
- Bulge
capac
i
ty
of the
measur
i
ng
device.
B
-
Single
Shear
Plane
C
-
Multip
l
e
Shear
Plane
NP
=
Non
Plastic Material
D -
Ve
rtica
l
Fra
cture
I
@
;;o
(I)
-0
0
::+
z
!=>
0
N
~
Cl)
0,
0
0,
Che
c
ke
d
By
:
A
p
proved By:
4?.A.
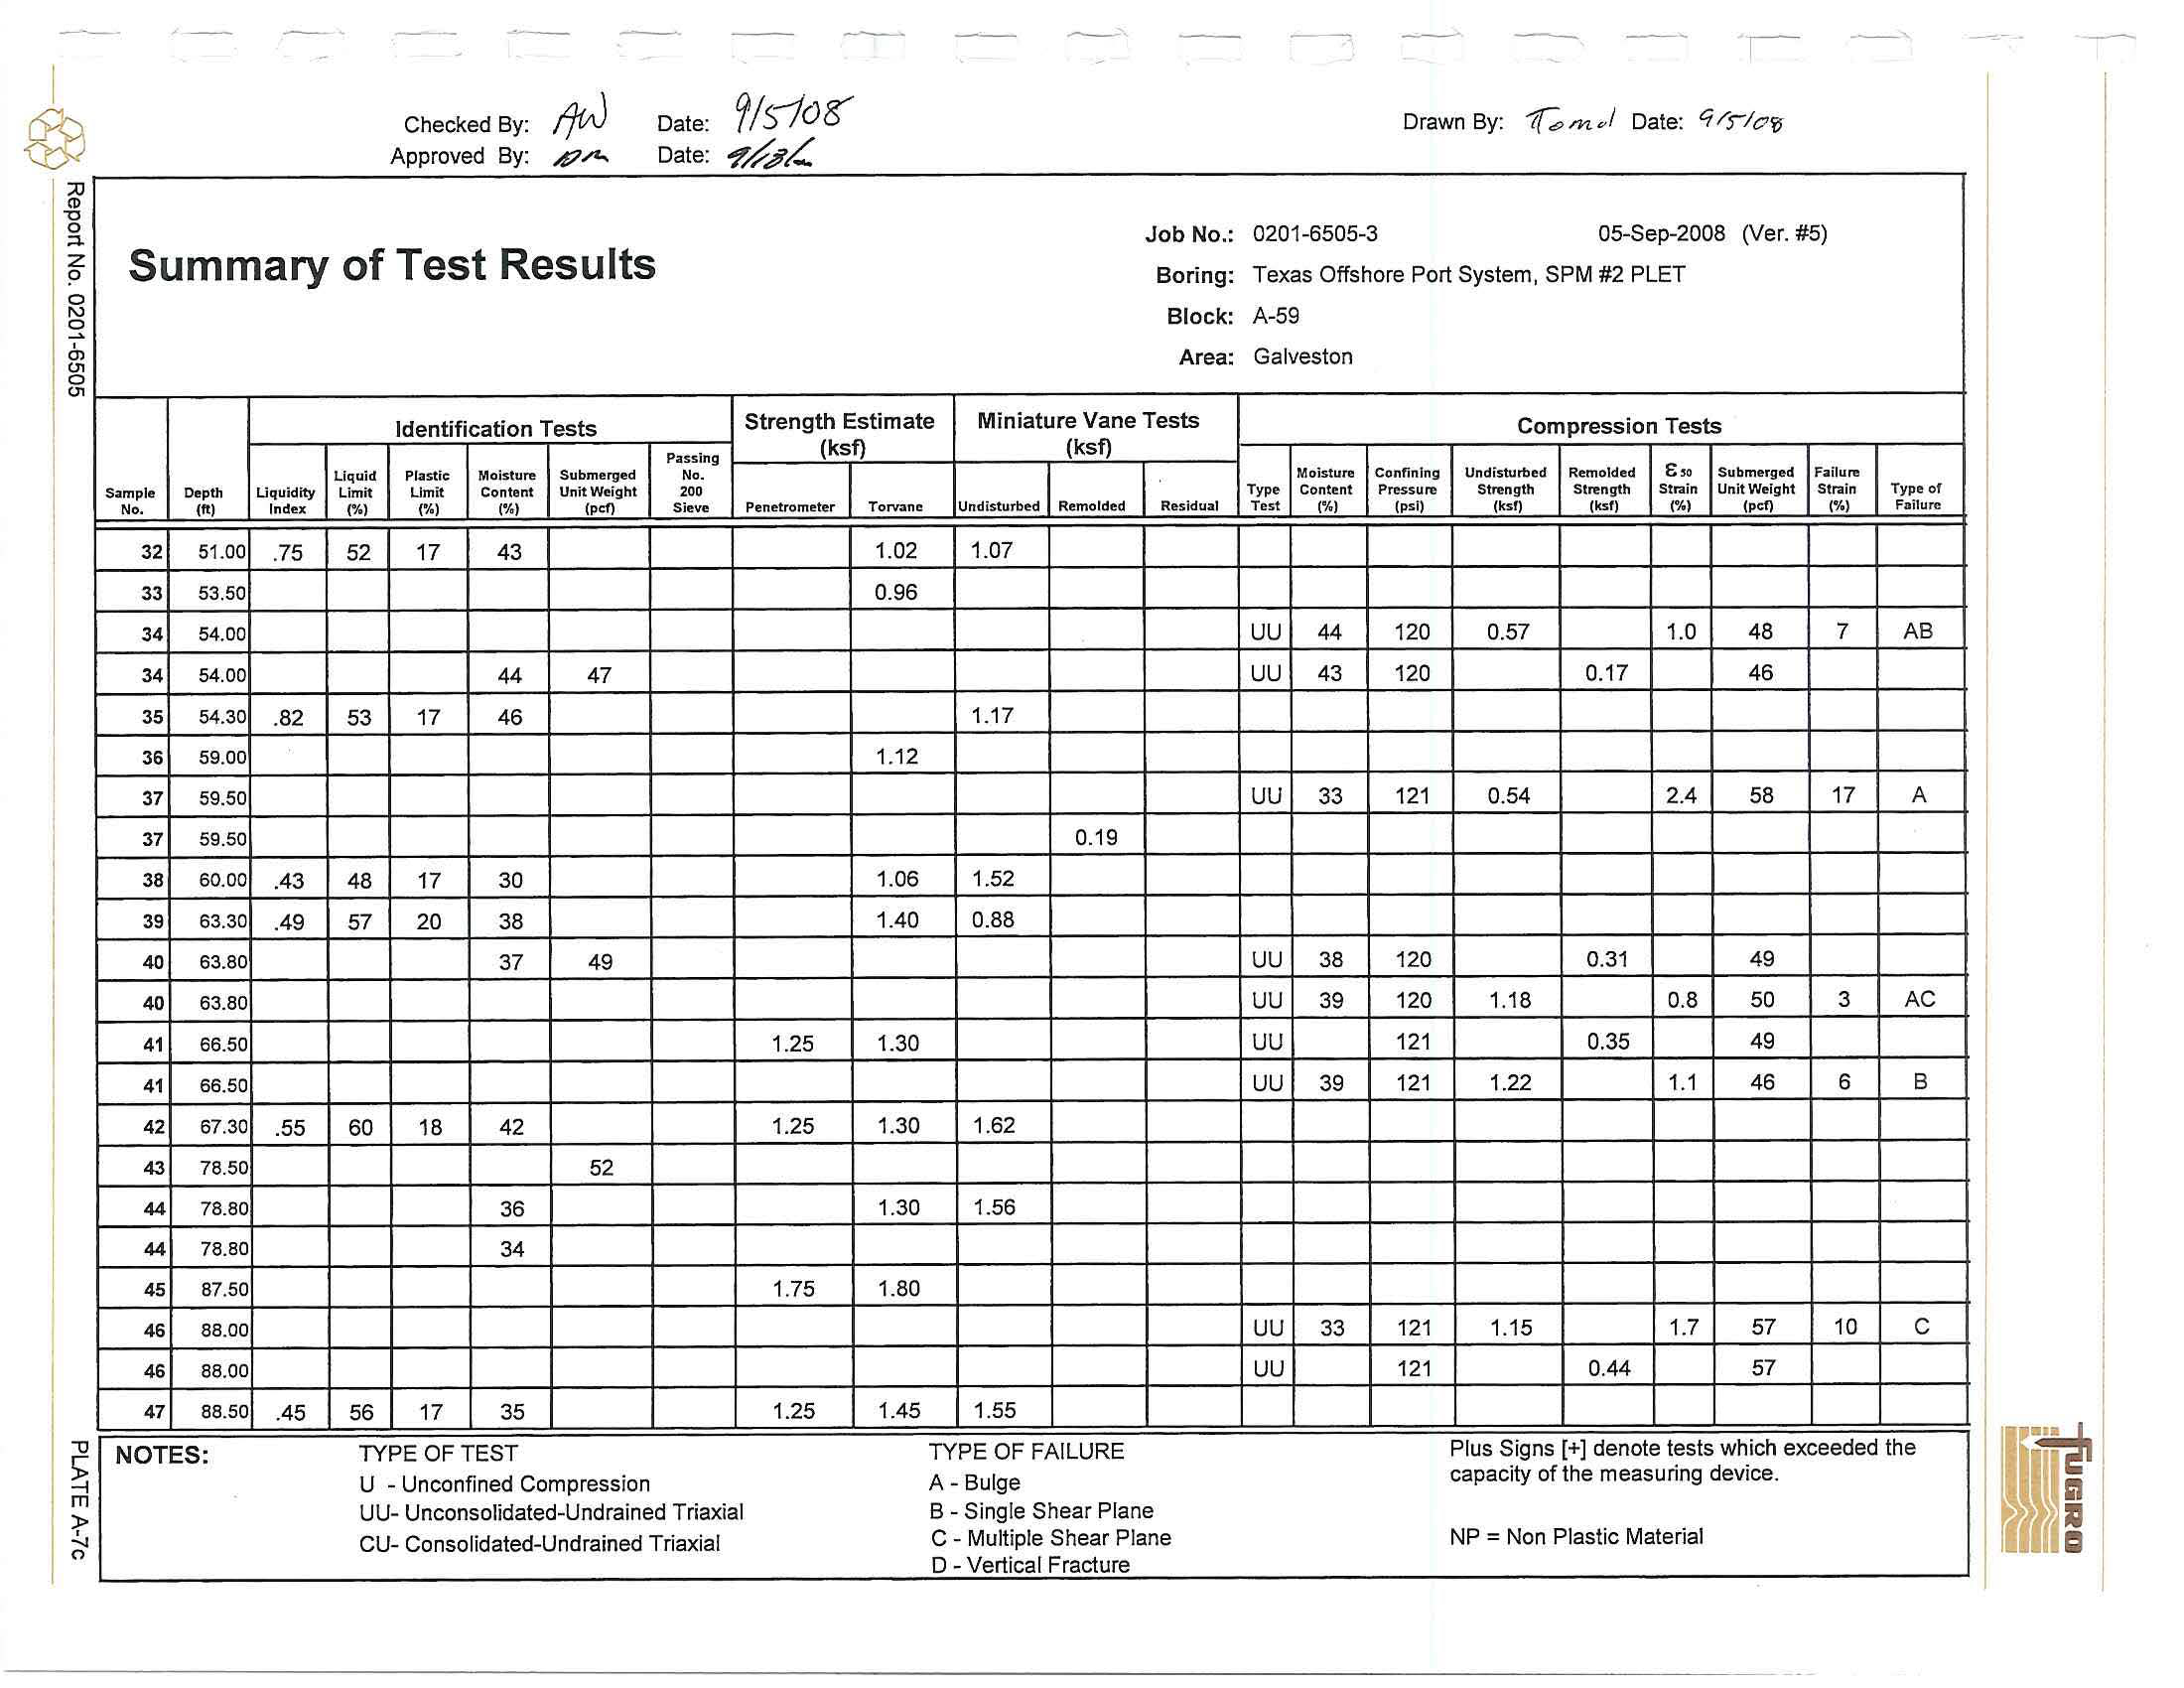
Summary of Test Results
Date:
Vs-Jog
Date:
?'~..,;-/-
Jo
b N
o
.:
B
o
rin
g:
B
lo
c
k:
A
r
ea:
Identifi
c
ati
o
n Tests
S
tre
n
gth Estimate
Minia
t
u
re
Vane
Te
sts
Passing
(k
s
f)
(ksf)
Li
quid
P
l
asti
c
Moi
st
ure
S
u
b
m
erged
No
.
Sam
p
le
Dept
h
Liqui
d
ity
L
i
mit
Umit
Content
Un
it Weight
200
No.
(It)
I
ndex
(%)
(
'h)
(
%
)
(pcf}
Sie
v
e
Pene
t
rom
e
ter
Torvanc
Undisturbed Remolded
Residual
32
51
.
00
.
75
52
17
4
3
1.02
1.07
33
53
.
50
0.96
34
54
.
0
0
34
54
.
00
44
47
35
54
.3
0
.
82
53
17
46
1.17
36
59.00
1
.
12
37
59.50
37
59.50
0.
1
9
38
60.00
.43
48
17
30
1.06
1.52
39
63.30
.49
57
20
38
1.40
0
.
88
4
0
63
.
80
37
49
40
63.80
41
66.50
1
.25
1
.
30
41
66.50
42
67
.
30
.
55
60
18
4
2
1.25
1.30
1.62
43
78
.
50
52
44
78.80
36
1.30
1.56
44
78.80
34
45
87
.
50
1
.
75
1
.
80
46
88.00
46
88
.
00
47
88
.
50
.45
56
17
35
1.25
1.45
1
.
55
N
O
TE
S
:
TY
P
E OFTEST
TY
PE
OF FAILURE
U - U
n
confi
n
e
d
Comp
r
ession
A - B
u
lge
UU- U
n
c
o
n
so
li
date
d
-Undrai
n
ed Tr
i
axial
B
-
Single
Shear P
l
ane
CU- Consolida
te
d
-U
ndra
i
ned Triaxial
C - Multi
p
le
Shear
P
l
ane
D - Vertical
Fr
act
u
re
0201-6505-3
05-Sep-2008
(Ve
r
.
#5)
Texas Offshore Port System, SPM
#2
P
L
ET
A-59
Galveston
Compression T
e
sts
Moisture Confining
Undisturbed
Remolded
i;,,
Sub
m
e
r
ged
Fai
l
u~
T
ype
Conte
n
t
Pressure
St~
n
gth
Stn,ngth
Strain
Unit Weight
Strain
Type of
Test
(
'
!.
)
(psi)
(ksO
(ks!)
rM
(pcO
(
¥,)
Failure
uu
44
120
0.57
1.0
48
7
AB
uu
43
120
0.17
46
uu
33
121
0
.
54
2.4
58
1
7
A
uu
38
120
0
.
31
49
uu
39
120
1
.
18
0.8
50
3
AC
uu
121
0.35
49
uu
39
121
1.
22
1
.
1
46
6
B
uu
33
121
1
.
1
5
1.7
57
10
c
uu
121
0.44
57
Plus Signs
[
+
]
deno
t
e tes
t
s
which
exceeded the
capacity
of the measu
ri
ng dev
i
ce.
N
P
=
No
n
Plastic Mate
r
ial
I
@
~
"
0
;:::i.
z
?
0
N
0
...
a,
(.11
0
(.11
Checke
d
By:
~
App
r
ove
d
By:
,v7
...
Sum
m
ary of Test Results
D
a
t
e
: 9
j)
-
/
0
3'
Date
:
"1"%;0
Job No
.
:
Bor
ing:
Block:
Ar
ea:
Identification Tests
Str
ength
E
stimate
Miniature Vane
Tests
Sampl
e
Dep
t
h
Ll
qu
l
d
ity
N
o.
(
It
)
In
dex
48
9
7.50
49
9
8.00
50
98
.50
51
1
08
.0
0
52
10
8.50
52
1
0
8
.
5
0
53
1
09.00
54
118
.00
55 118
.50
56 1
1
9
.
00
.
45
56
1
1
9
.0
0
57 130
.0
0
58
130.5
0
58
130
.
50
59
1
31
.
0
0
NOTE
S
:
Pas
sin
g
Liqu
i
d
Plastic
M
ois
tur
e
Subm
e
rged
No
.
Lim
i
t
Limit
Cont
e
nt
Unit
We
i
ght
200
(%)
(%)
(%
)
(pcl
)
Si
e
ve
39
51
38
45
56
43
15
28
29
52
TYPE O
FTE
ST
U
-
Unconfined Compress
i
on
UU- Unconsolidated
-
U
ndr
ained
Triaxial
CU- Consol
i
dated-Undrained
Triaxial
(ksf)
Penetrom
e
ter
Torvane
1.25
1.10
2.25
2.00
2
.
00
1
.
80
1.
50
1
.
35
2
.
25
1.95
2
.
25
1.80
(ksf)
Undi
stu
rbed
R
e
mo
ldad
1
.
18
1
.
99
1.32
2
.
10
TYPE O
F
F
AIL
URE
A- Bu
l
ge
Res
f
duat
B
- S
i
ng
l
e Shea
r
P
lane
C -
Mu
lti
p
l
e S
h
ear Plane
D
- Vert
ic
a
l
Frac
t
ure
Dra
w
n B
y:
11
0,.,.
of
Da
t
e:
t:/
I
f'"
!of
0
2
0
1
-
6505-3
05-Sep
-
2008
0/
er.
#5)
Te
x
as
Offshore Port Sys
t
em
,
SPM #2 P
L
ET
A
-59
Ga
lv
es
t
o
n
M
oi
sture
C
onfini
n
g
Type
Con
t
e
n
t
P
r
e.ssu
~
Tes
t
(%
)
(
p
s
i
)
uu
44
121
uu
12
0
uu
73
12
1
uu
12
1
C
ompression
Tests
U
ndist
u
rb
e
d
Re
mo
l
d
e
d
6
,o
S
u
bmerged
Fa
ll
ure
St
ren
gth
Sm
n
g1
h
St
ra
i
n
Un
i
t W
ei
ght
Stra
i
n
Typ
e
of
(
ks
!)
(
ksl
)
(
'
/,
)
(
pcl)
r.,,
,
F
a
il
ure
1
.
88
0
.
6
45
3
c
0
.5
5
47
1
.
60
1
.
1
4
3
4
c
0.
4
5
47
Plu
s
S
i
gns
[+]
denote tes
t
s which exceeded
th
e
capaci
ty
o
f
the meas
u
ring dev
i
ce.
NP
=
Non P
l
as
tic
Ma
t
erial
\
I
l
I
I
I
@
1
~
;o
0
::i.
z
?
0
I\)
~
(J)
0,
0
0,
I-
I
Cl
iii
~
>-
ca
(!)
~
Cl)
Cl)
<(
c..
I-
z
w
0
c..
0.::
w
100
90
80
70
60
5
0
40
30
20
10
0
1
00
I
'
-aie
c
k
ed by:
~
--
Date:
-
,r
/
f
/t=o
-
Approved by:
~-
Date
:
'Y;/,;
t
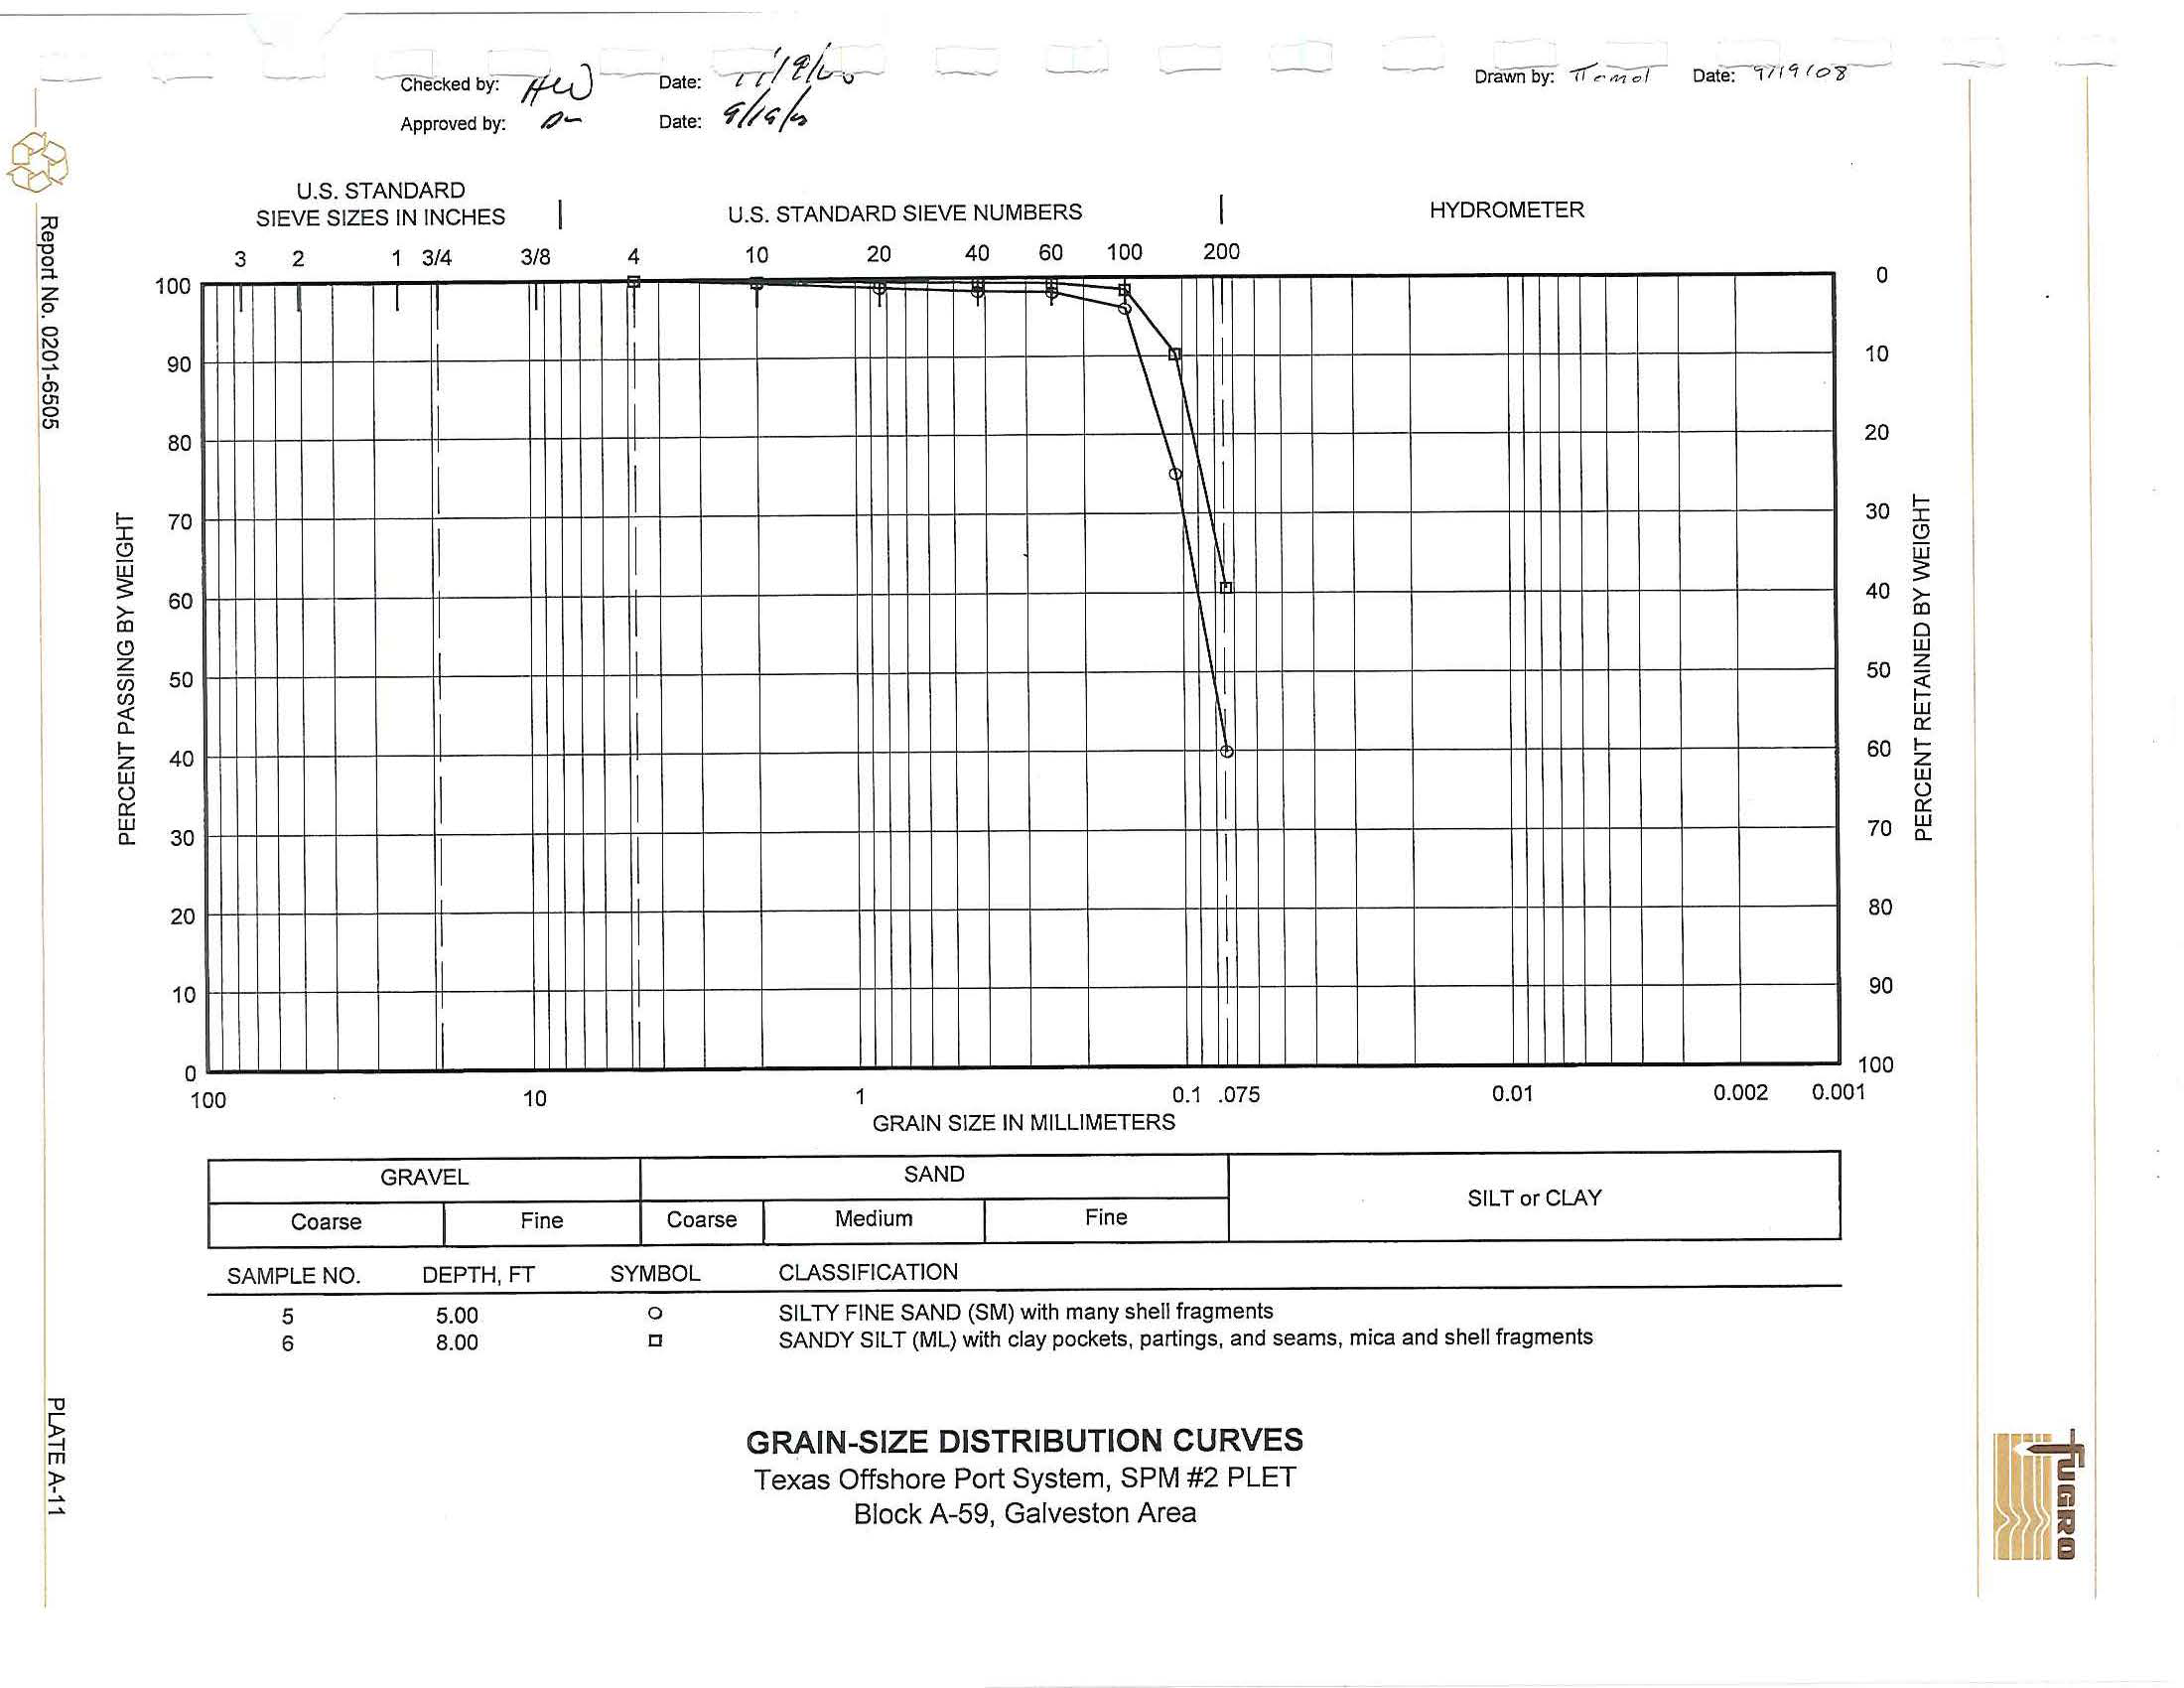
U.S. STANDARD
SI
EVE SIZES
IN
I
NCHES
3
2
1 3/4
3
/
8
I
I
'
I
I
I
I
I
I
I
~
I
10
GRAVEL
Coarse
I
Fine
S
AM
PLE NO
.
DEPTH
.
FT
U.S
.
STANDARD SIEVE NUMBERS
4
10
20
40
60
100
200
'1
l
T
~
'
I
\
I
I
I
\
'
I
I
I
I
I
I
I
'
I
l.
I
I
I
I
I
I
I
1
1
I
11
I
II
I
1
0.
1 .
075
GRAIN SIZE
IN
MILLIMETERS
SAND
Coarse
j
Medium
I
Fine
SYMBOL
CLASSIFICATION
SILTY F
I
NE SAND (SM) with
many
shell
fragments
HYDROMETER
0.01
SILT or CLAY
5
6
5.00
8
.
00
0
c
SANDY SILT (ML
)
with clay pockets, partings, and seams, mica and shell
fr
a
gments
GRA
I
N-SIZE DISTRIBUTION
CURVES
Texas
Offshore Port
System,
SPM
#2
PLET
Block A-59, Galveston Area
0
10
20
30
I-
I
(!)
40
>-
~
ca
0
UJ
50
z
w
~
0:::
60
I-
z
w
0
0.::
70
UJ
c..
80
90
100
0.002
0.001
-
--~--
---
--
-
u..
l;
~
!
~
~
1.00
Cl
~
-!<
t
Cl)
I~
Cl)
a.>
I-
;.:.
......
,
m
en
~
I-
0.75
~
0
r
......
m
'>
a.>
0
"O
a.>