Appendix B contains discussions of ana
l
ytical
procedures used
in
our
engineering analyses. Appendix C
contains a positioning
report
by
Fugro
Chance,
I
nc.,
of
Lafayette, Louisiana
.
•
For the purposes
of discussion and presentation, "driven pipe
pile"
is
used
in
this report
to represent
foundation piles,
caissons and conductors,
unless otherwise
specified.
2.2 FIELD AND LABORATORY
INVESTIGATIONS
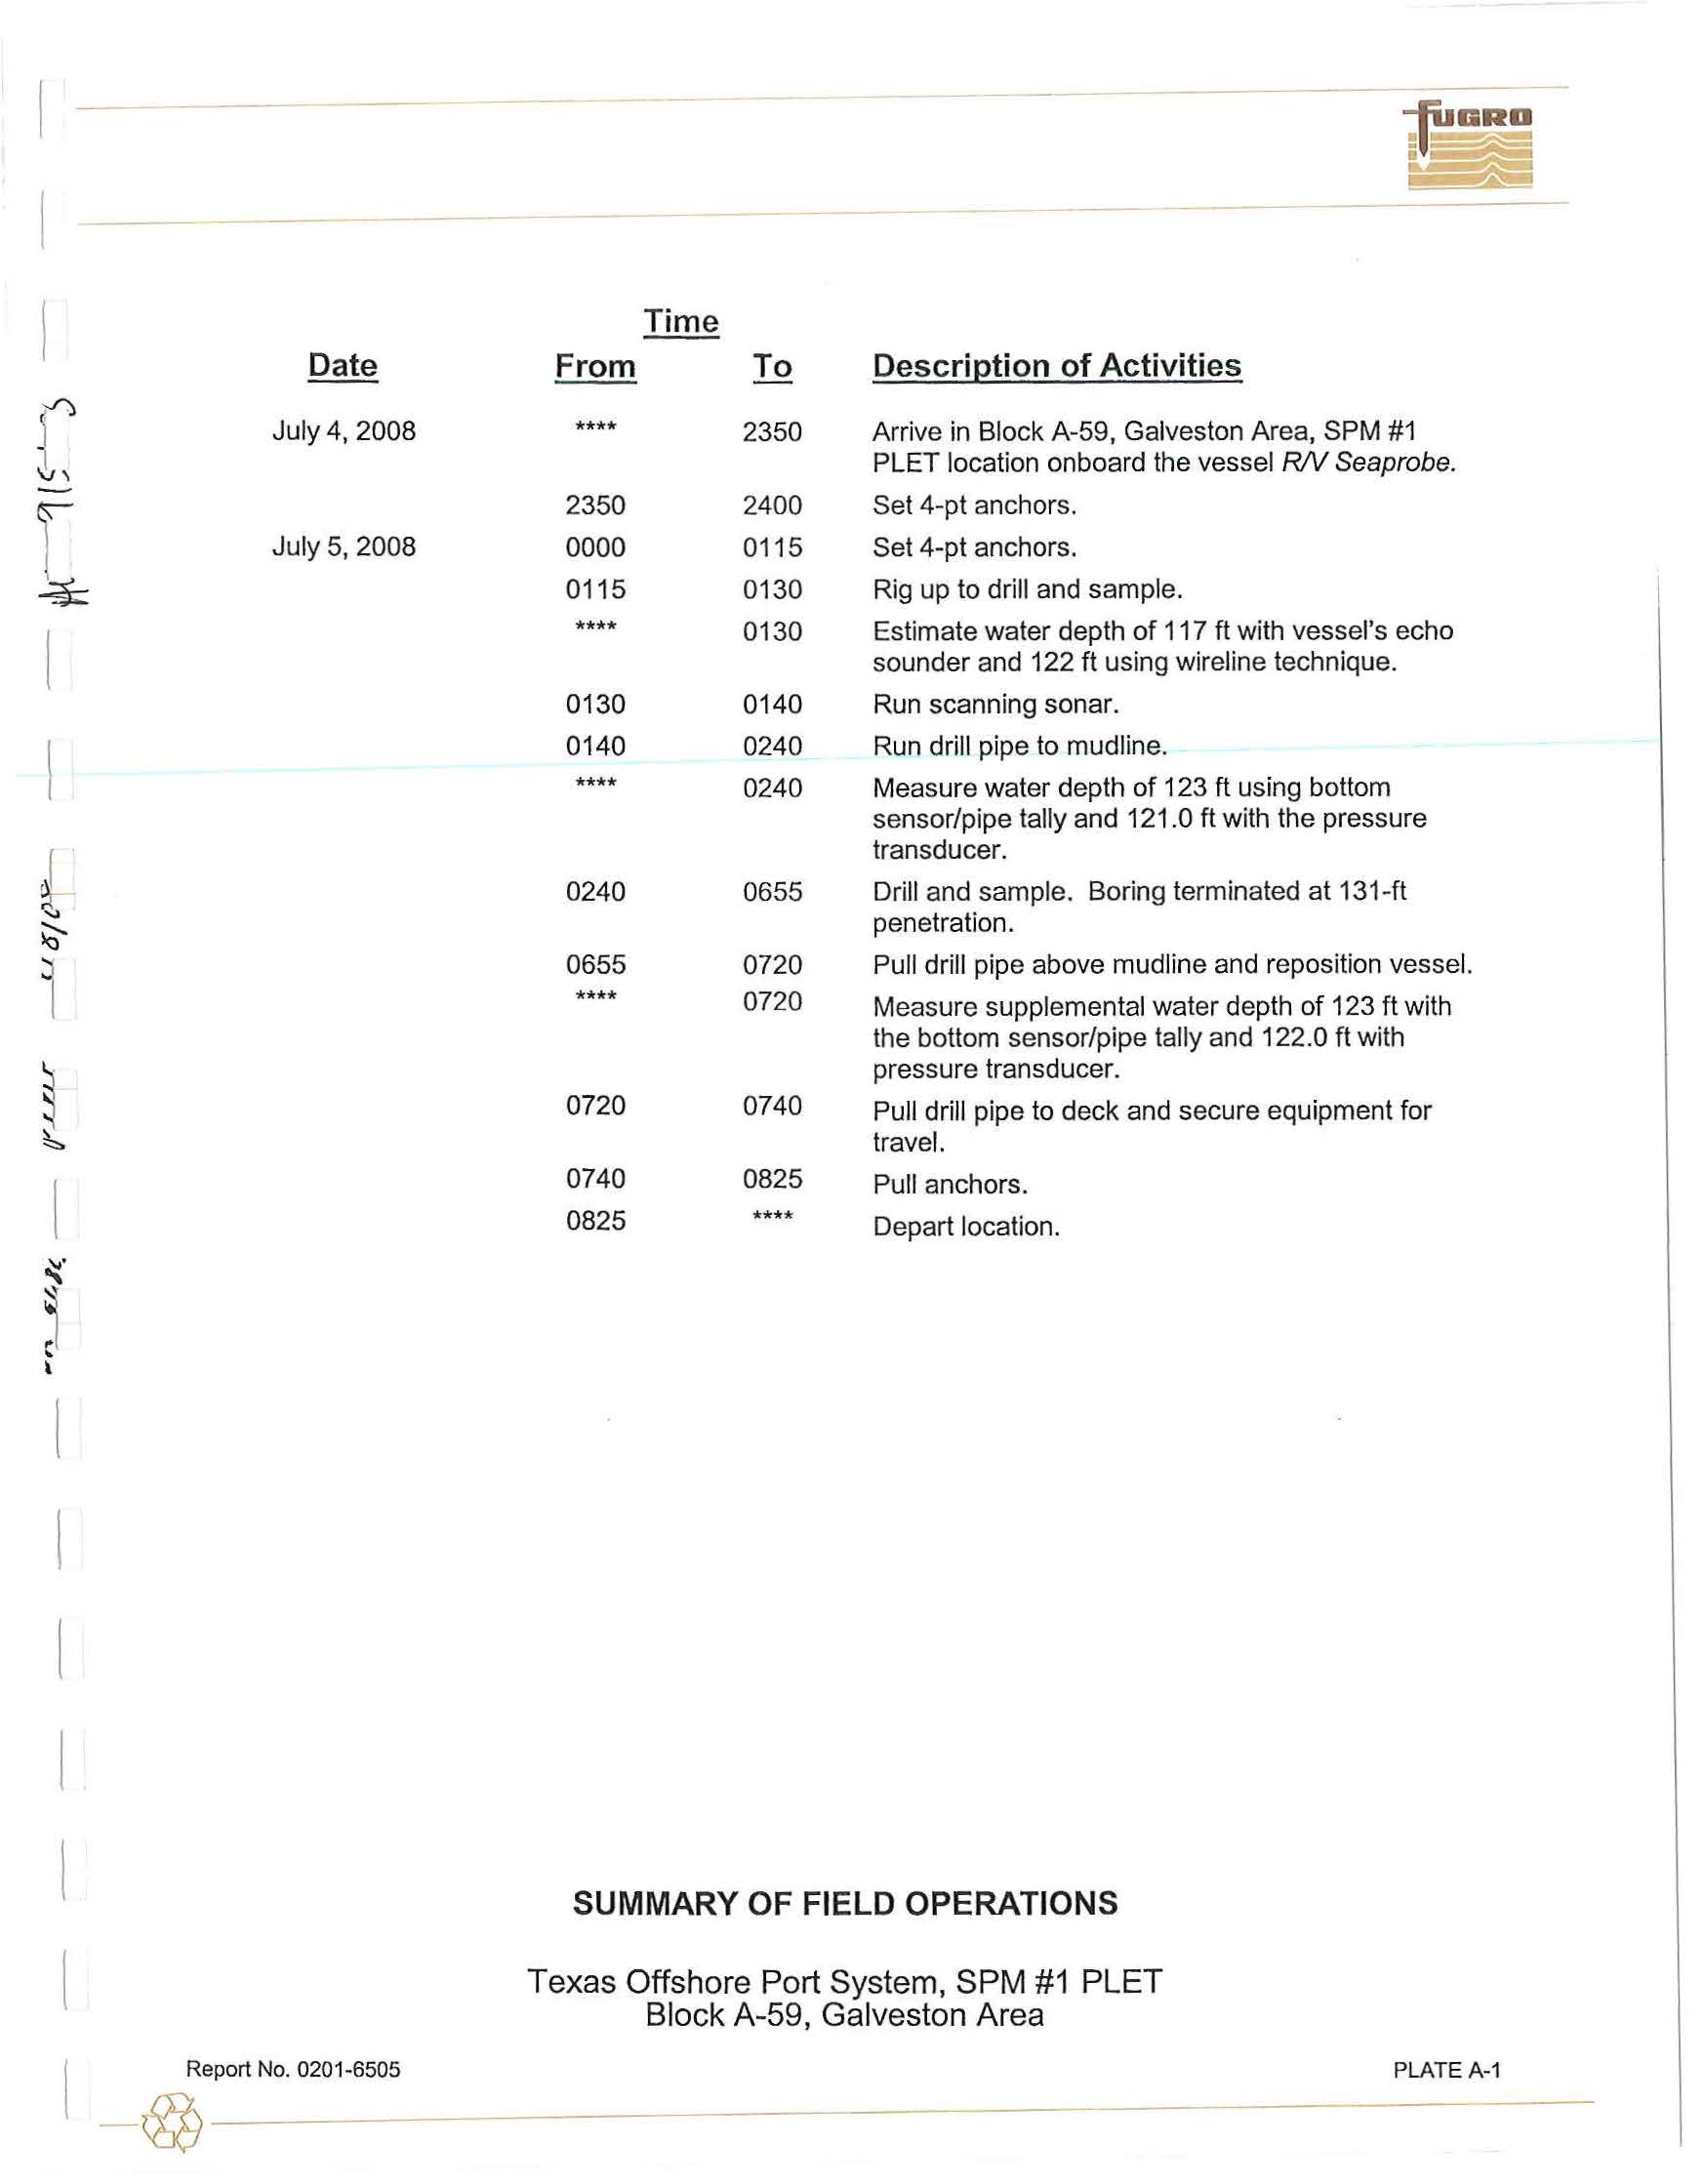
The field investigation
was
performed
on Ju
l
y
4
through 6, 2008,
from the
RN
Seaprobe.
The
soil
cond
itio
ns were
determined
by performing
four exploratory borings
,
two at each
SPM location with
one
boring
at
a
selected
anchor
l
eg location, and one
boring
at
the
proposed
PLET location. Enterprise
Field
Services selected
the
boring
locations. These
borings were
drilled to
a penetration of 131-ft
below
mudline.
The water
depths
at
the boring locations ranged from 123 to 125
ft. A chronological summary
of
field
operations
is
presented
in
Appendix
A.
2.2.1
Exploratory Borings
FMMG
personnel
drilled
the
so
il
borings with a
OMX
drill
rig
positioned over
the
centerwell of
the
RN
Seaprobe.
The
vesse
l
was anchored at
the
boring
location by
a 4-point mooring system.
Soil
conditions at
the
site were
exp
lored
by
drilling
a group
of four soil borings
to 131-ft
penetration below the
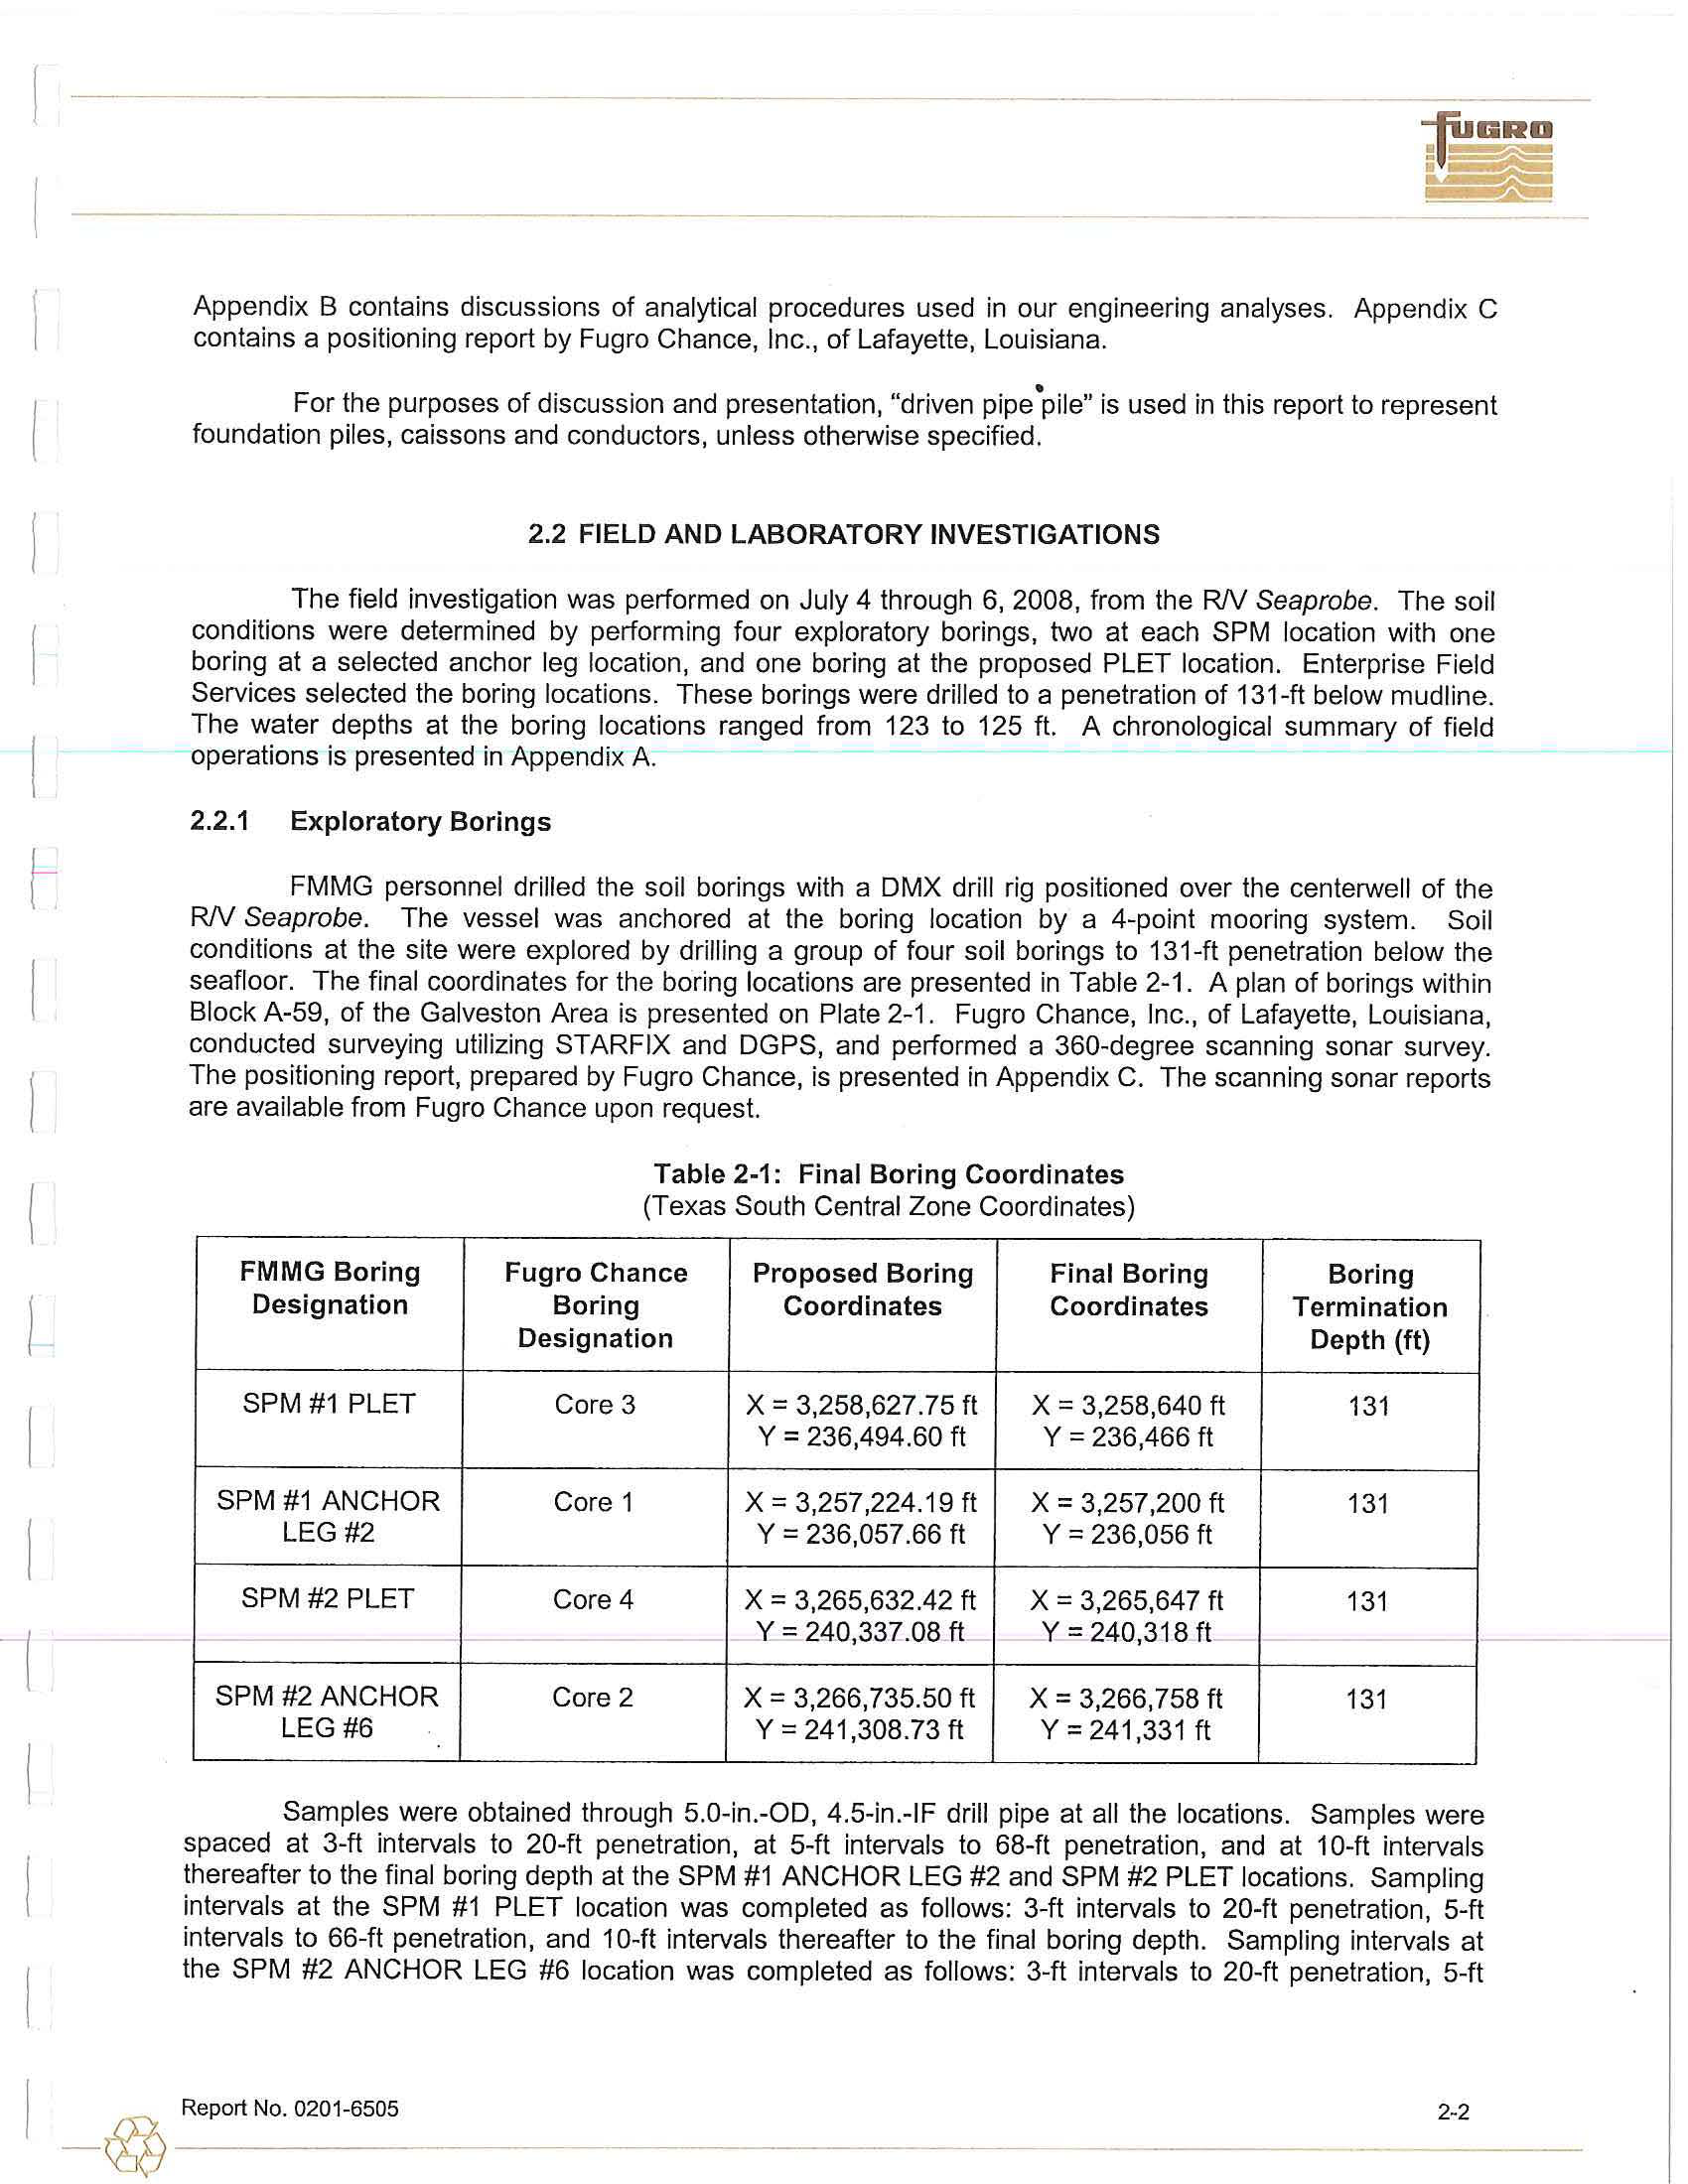
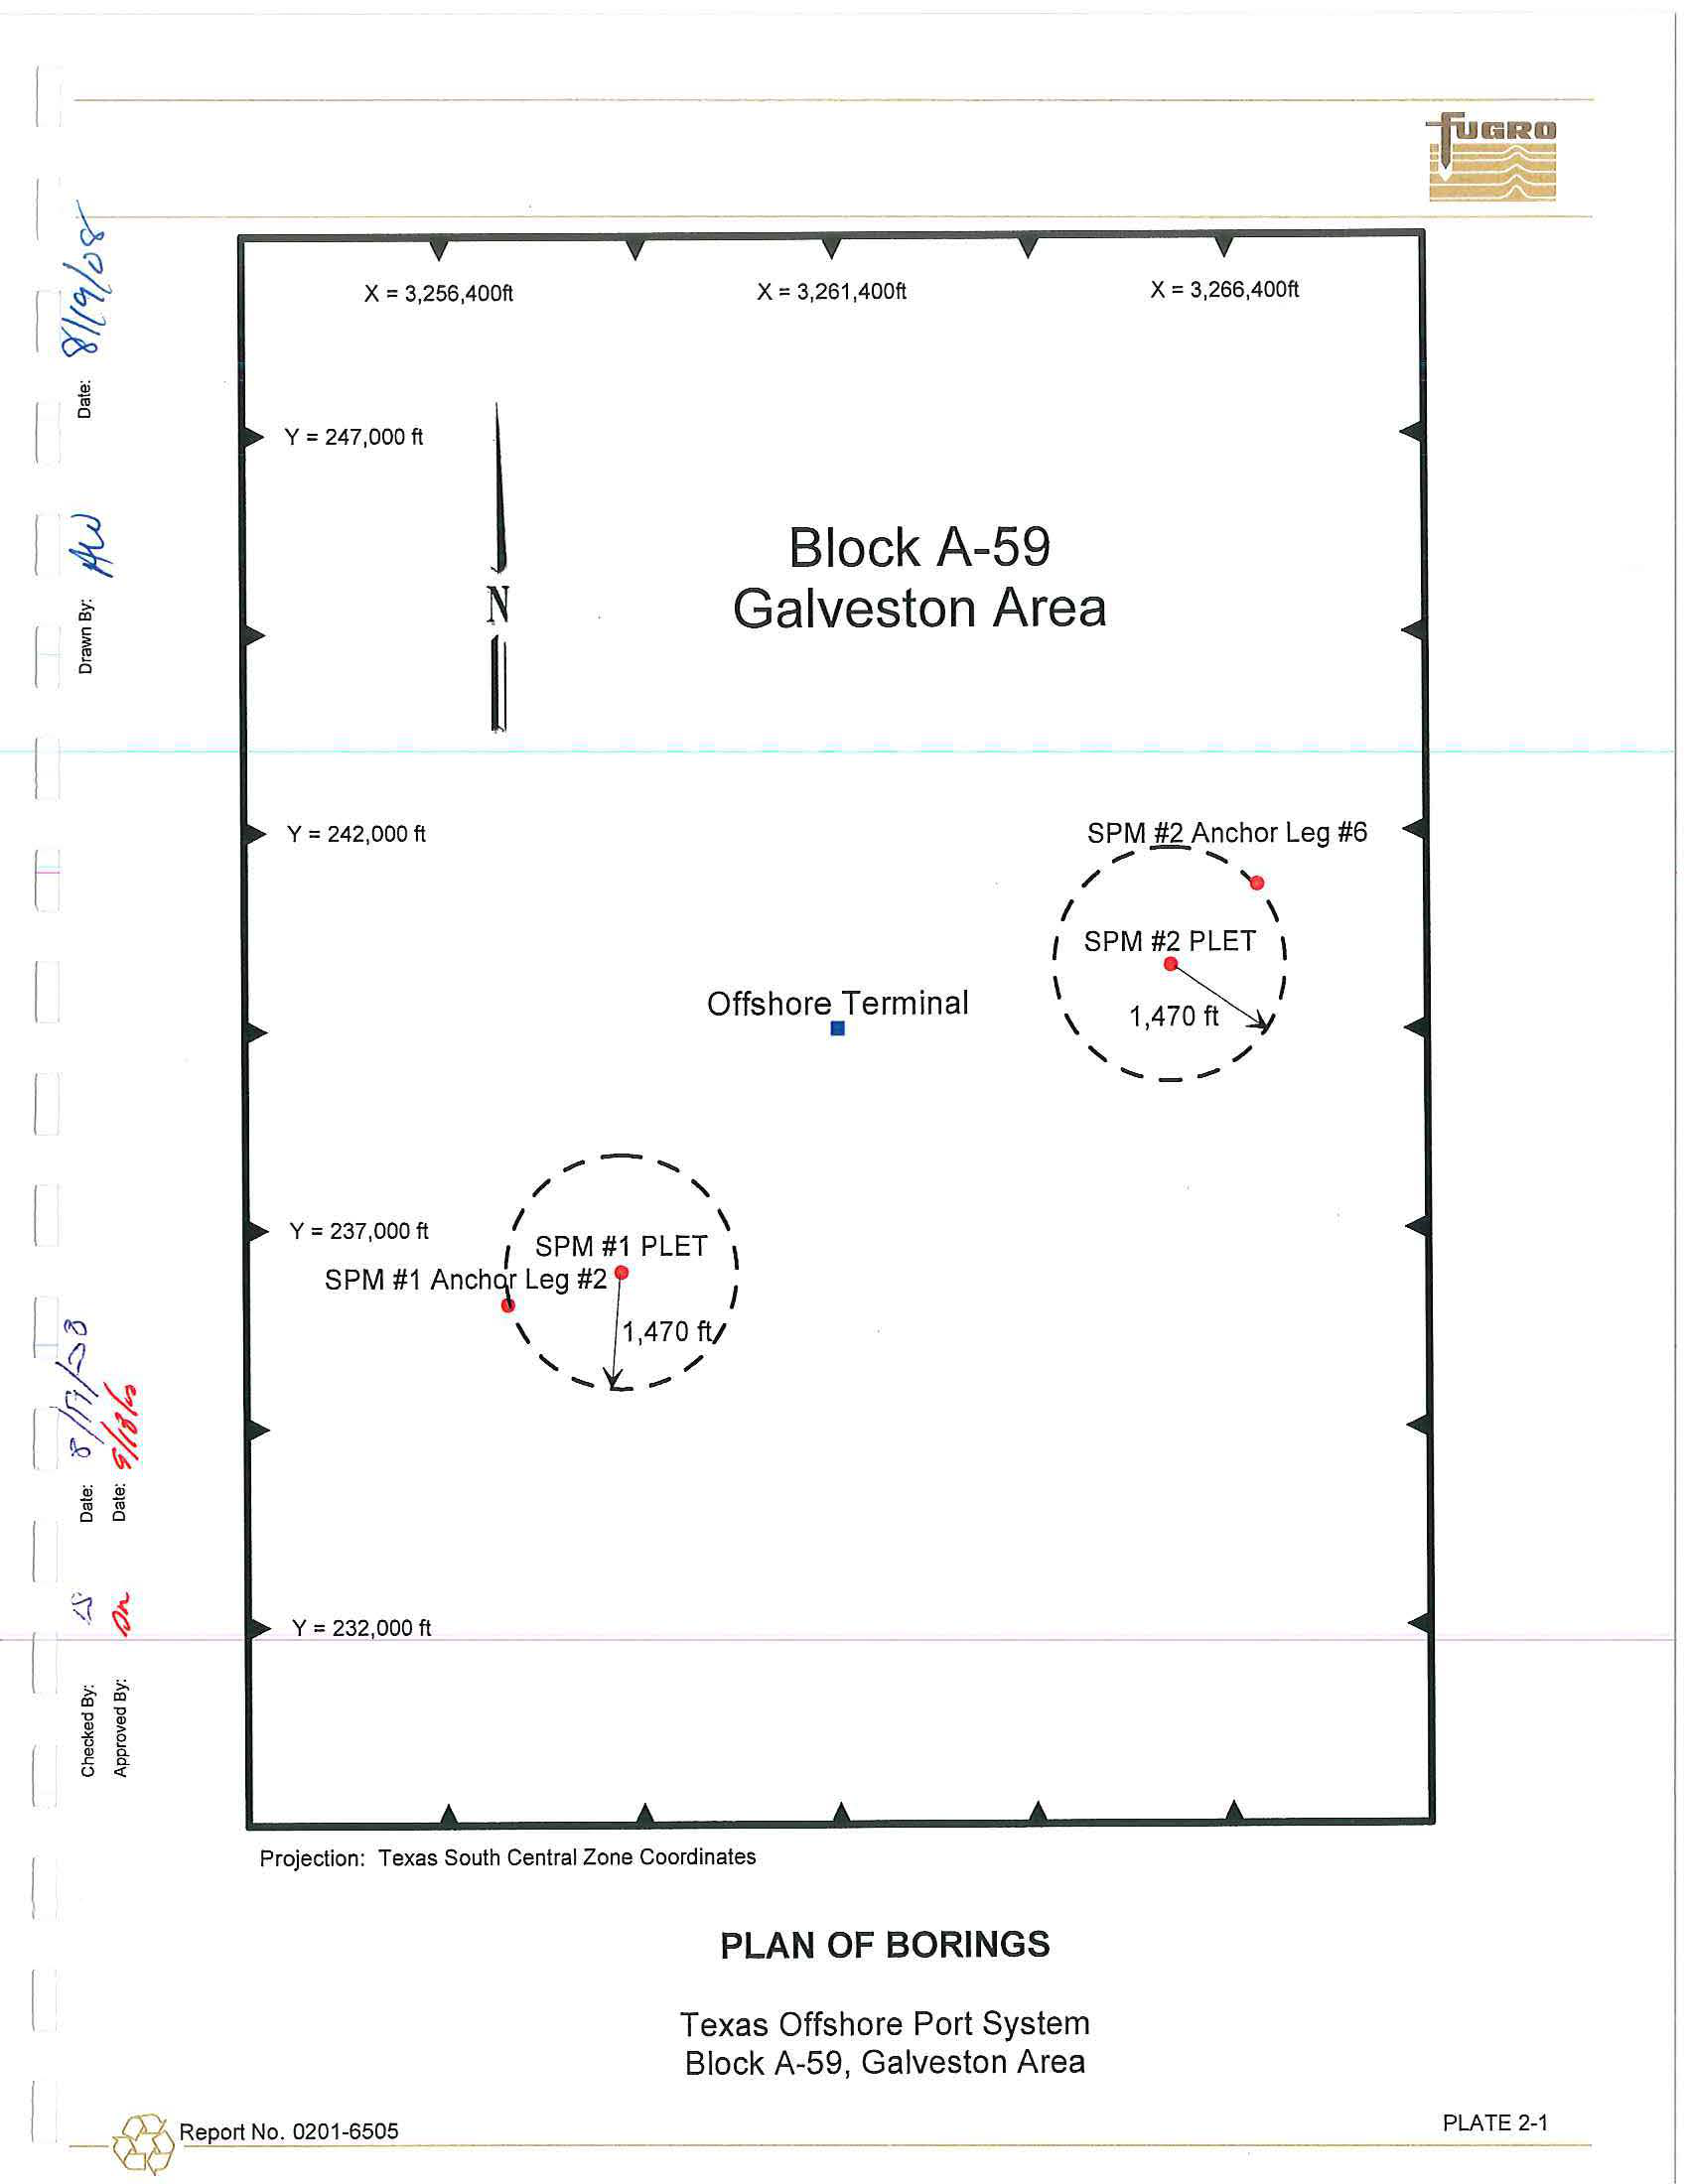
seafloor. The
final
coordinates for the boring
locations
are presented
in
Table 2-1. A plan of borings within
Block A-59,
of
the
Galveston Area is presented on
Plate
2-1.
Fugro
Chance,
Inc.,
of
Lafayette, Louisiana
,
conducted surveying utilizing STARFIX and
DGPS,
and
performed
a 360-degree scanning sonar survey.
The
positioning report, prepared by
Fugro
Chance,
is
presented
in Appendix C.
The
scanning sonar
reports
are available from
Fugro
Chance
upon
request.
FMMG
Boring
Designation
SPM
#1 PLET
SPM #1 ANCHOR
LEG#2
SPM
#2 PLET
SPM #2
ANCHOR
LEG
#6
Table 2-1:
Final
Boring Coordinates
(Texas South Central Zone Coordinates)
Fugro
Chance
Proposed
Boring
Final Boring
Boring
Coordinates
Coordinates
Designation
Core 3
X
=
3,258,627
.
75
ft
X = 3,258,640
ft
Y =
236,494.60 ft
Y = 236,466
ft
Core
1
X = 3,257,224.19 ft
X = 3,257,200
ft
Y = 236,057.66
ft
Y
=
236,056 ft
Core4
X
=
3,265,632.42
ft
X
=
3,265,647
ft
Y
=
240,337.08 ft
Y = 240,318
ft
Core
2
X = 3,266,735.50
ft
X
=
3,266,
758 ft
Y
=
241,308.73
ft
Y
=
241,331
ft
Boring
Termination
Depth (ft)
131
131
131
131
Samples were
obtained through 5.0-in.-OD, 4.5-in.-lF drill pipe at all
the locations. Samples
were
spaced at 3-ft
intervals
to 20-ft
penetration,
at 5-ft
intervals
to
68-ft
penetration,
and at 10-ft intervals
thereafter to the final boring
depth at the
SPM
#1
ANCHOR LEG #2
and SPM #2
PLET locations
.
Sampling
intervals
at
the
SPM
#1 PLET location
was completed as follows: 3-ft
intervals to
20-ft penetration, 5-ft
intervals to
66-ft
penetration,
and 10-ft
intervals thereafter to the final
boring
depth
.
Sampling intervals
at
the SPM #2 ANCHOR
LEG
#6
l
ocation
was
completed as
follows
:
3-ft intervals
to
20-ft
penetration,
5-ft
I
-
@
-
R
-
e
-
po
_
rt
_
N
_
o
_
. 02
_ _
0
_
1-
-
6
-
50
-
5
2-2
------
intervals to 65-ft penetration, and 10-ft intervals thereafter
to
the final boring depth.
The drilling and
sampling techniques used to complete this boring are
exp
lain
ed
in
detail in Appendix
A.
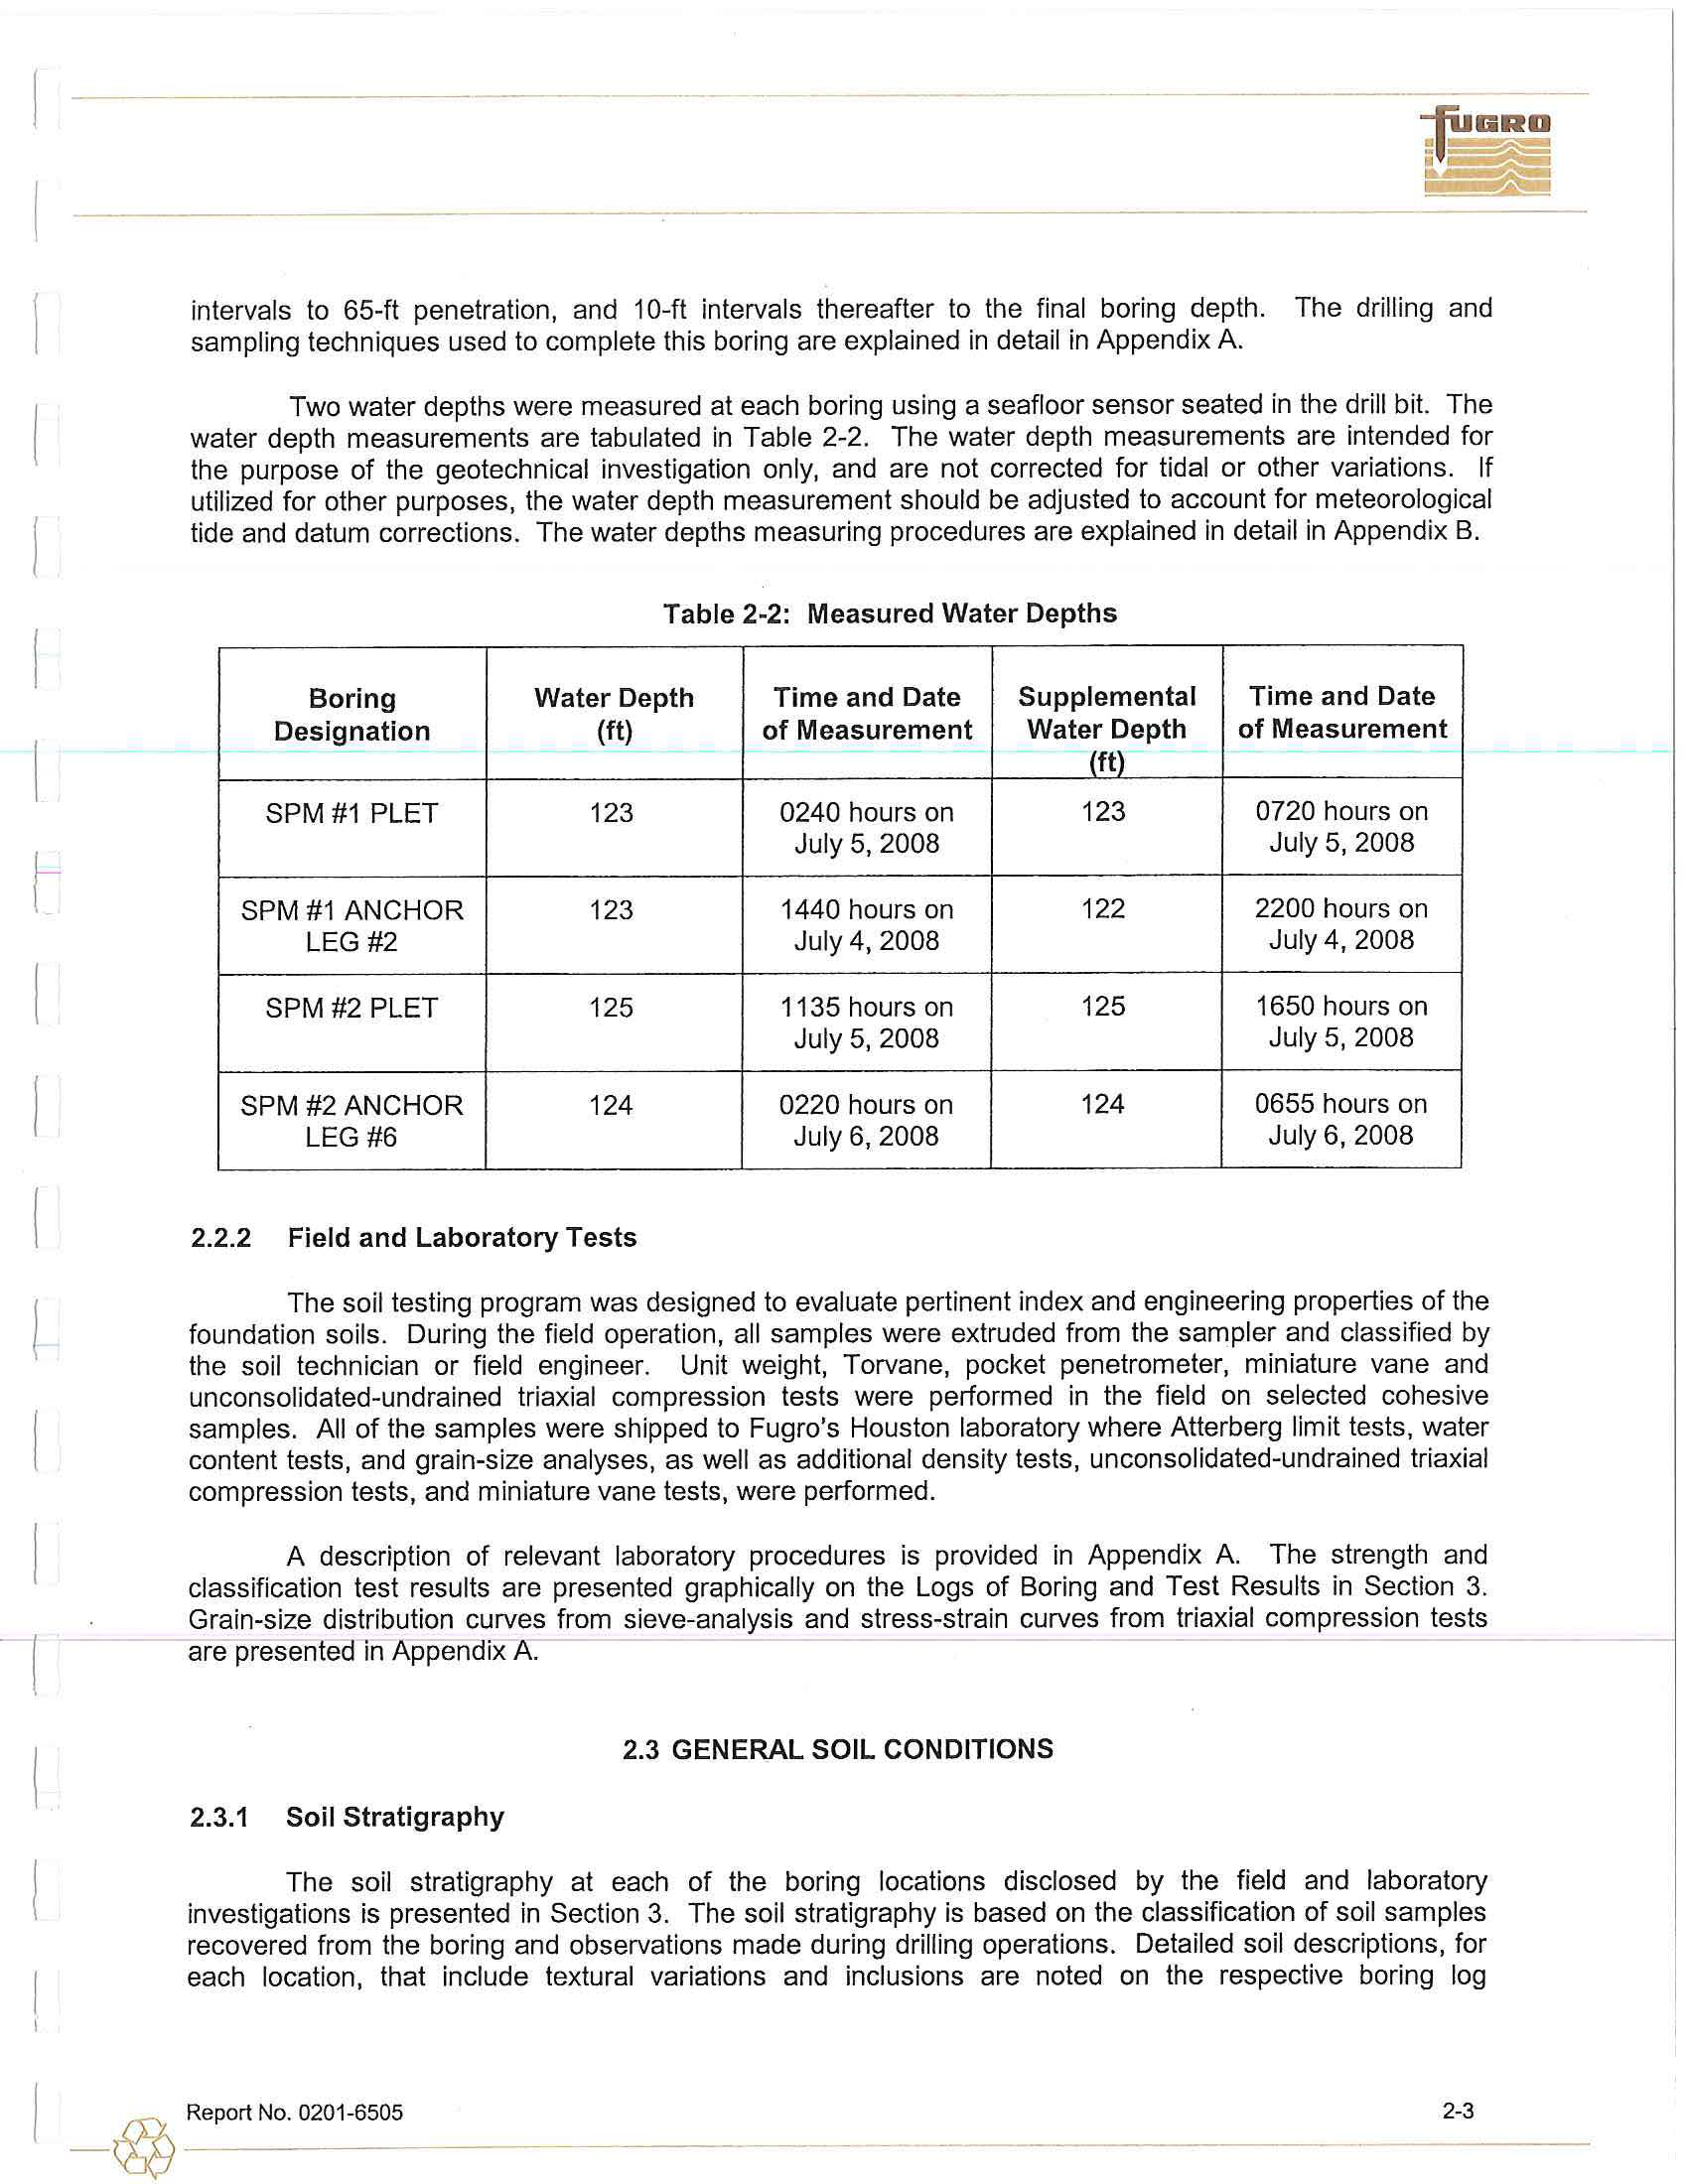
Two
wa
ter
depths were measured at each boring using a seafloor sensor seated in the drill
bit.
The
water depth measurements are
tabul
ated
in Table 2-2. The water depth measurements are intended for
the purpose of the geotechnical
in
vestigation
only, and are not corrected for tidal or other
va
riati
ons
. If
utilized for other purposes, the
water depth
measurement
should
be adjusted
to
account for meteorological
tide and datum corrections. The
water
depths measuring procedures are explained
in detail in Appendix B.
Table 2
-
2: Measured Water Depths
Boring
Water Depth
Time and Date
Supplemental
Time and Date
Designation
(ft)
of Measurement
Water Depth
of Measurement
(ft)
SPM #1 PLET
123
0240 hours
on
123
0720 hours on
July
5,
2008
July
5, 2008
SPM
#1 ANCHOR
123
1440 hours
on
122
2200
hours on
LEG #2
July
4, 2008
July 4, 2008
SPM
#2 PLET
125
1135 hours
on
125
1650 hours on
July
5,
2008
July
5, 2008
SPM #2 ANCHOR
124
0220 hours
on
124
0655 hours on
LEG
#6
July 6, 2008
July
6, 2008
2.2.2
Field and Laboratory Tests
The soil testing program was designed to evaluate pertinent index and engineering properties
of
the
foundation soils
.
During the field operation,
all samples were extruded from the sampler and classified
by
th
e soil
technician or field
eng
ineer
.
Unit weight, Torvane, pocket penetrometer, miniature vane and
unconsolidated-undrained triaxial compression tests
were
performed
in the field on selected cohesive
samples. All
of the samples were
shipped
to Fugro's Houston laboratory where Atterberg limit tests, water
content tests, and grain-size analyses, as well
as
additional density tests, unconsolidated-undrained triaxial
comp
ression
tests, and miniature
vane
tests, were performed.
A description of relevant
lab
ora
tory
procedures
i
s
provided in Appendix A.
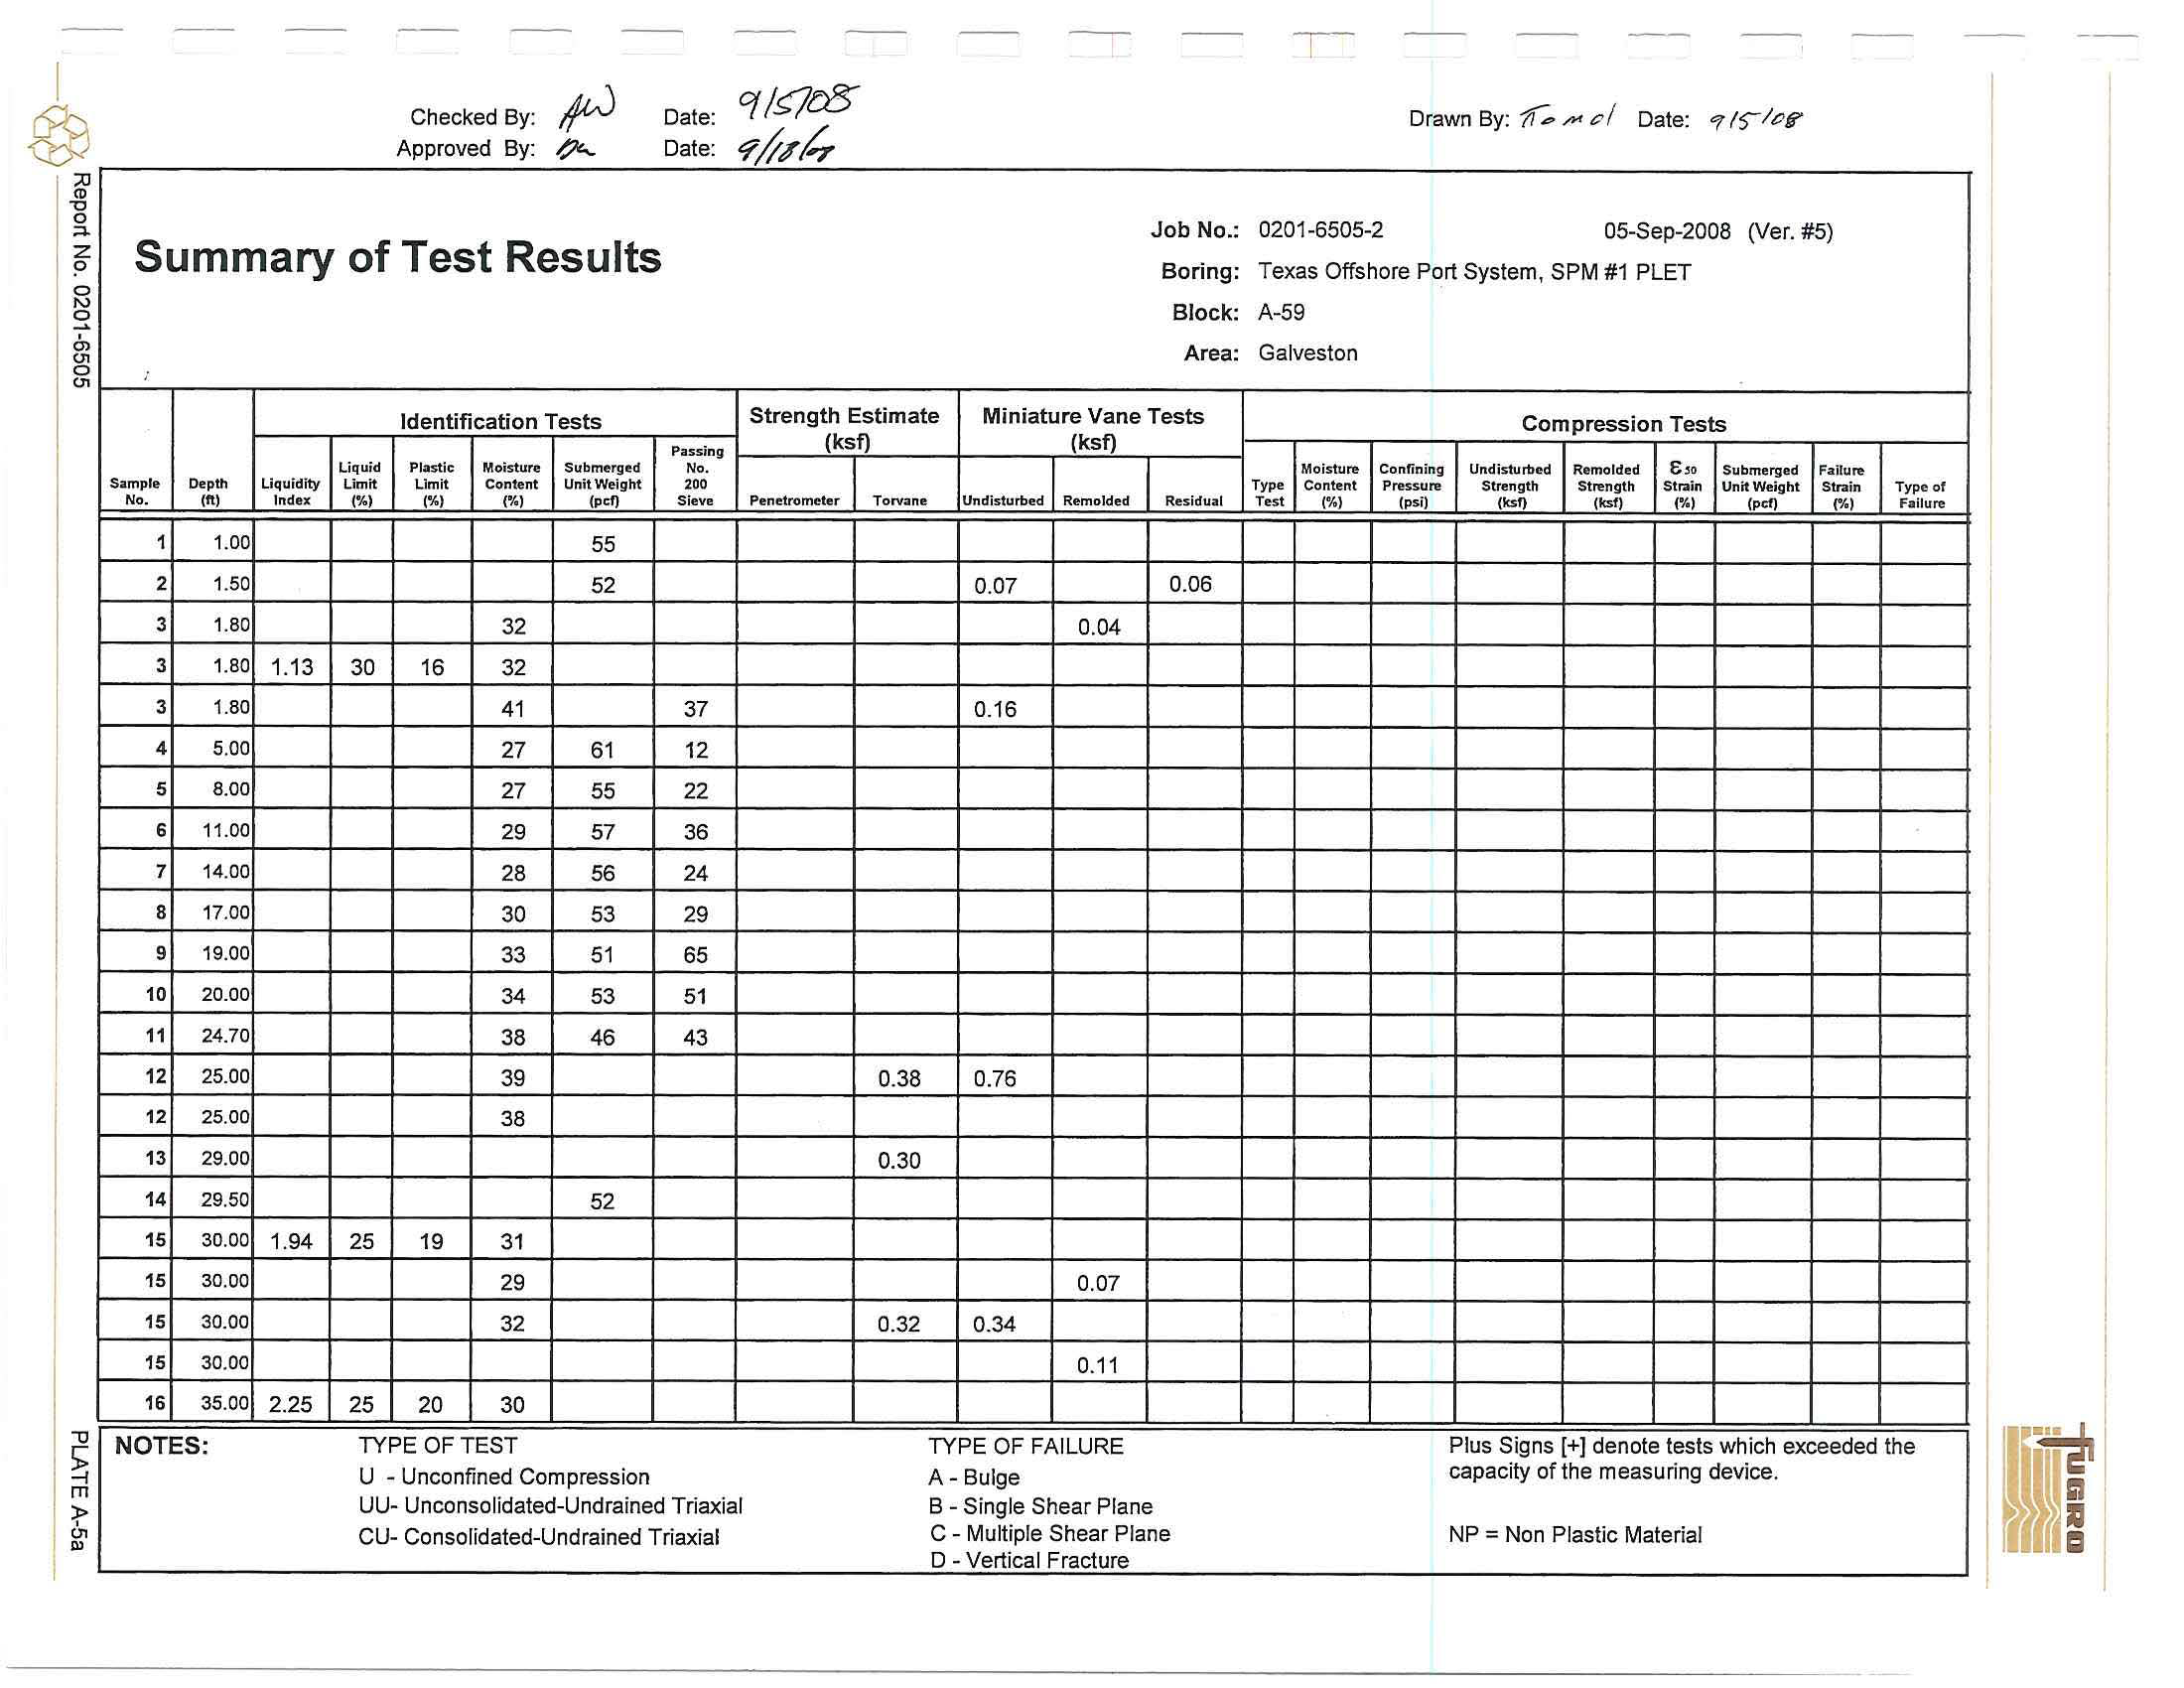
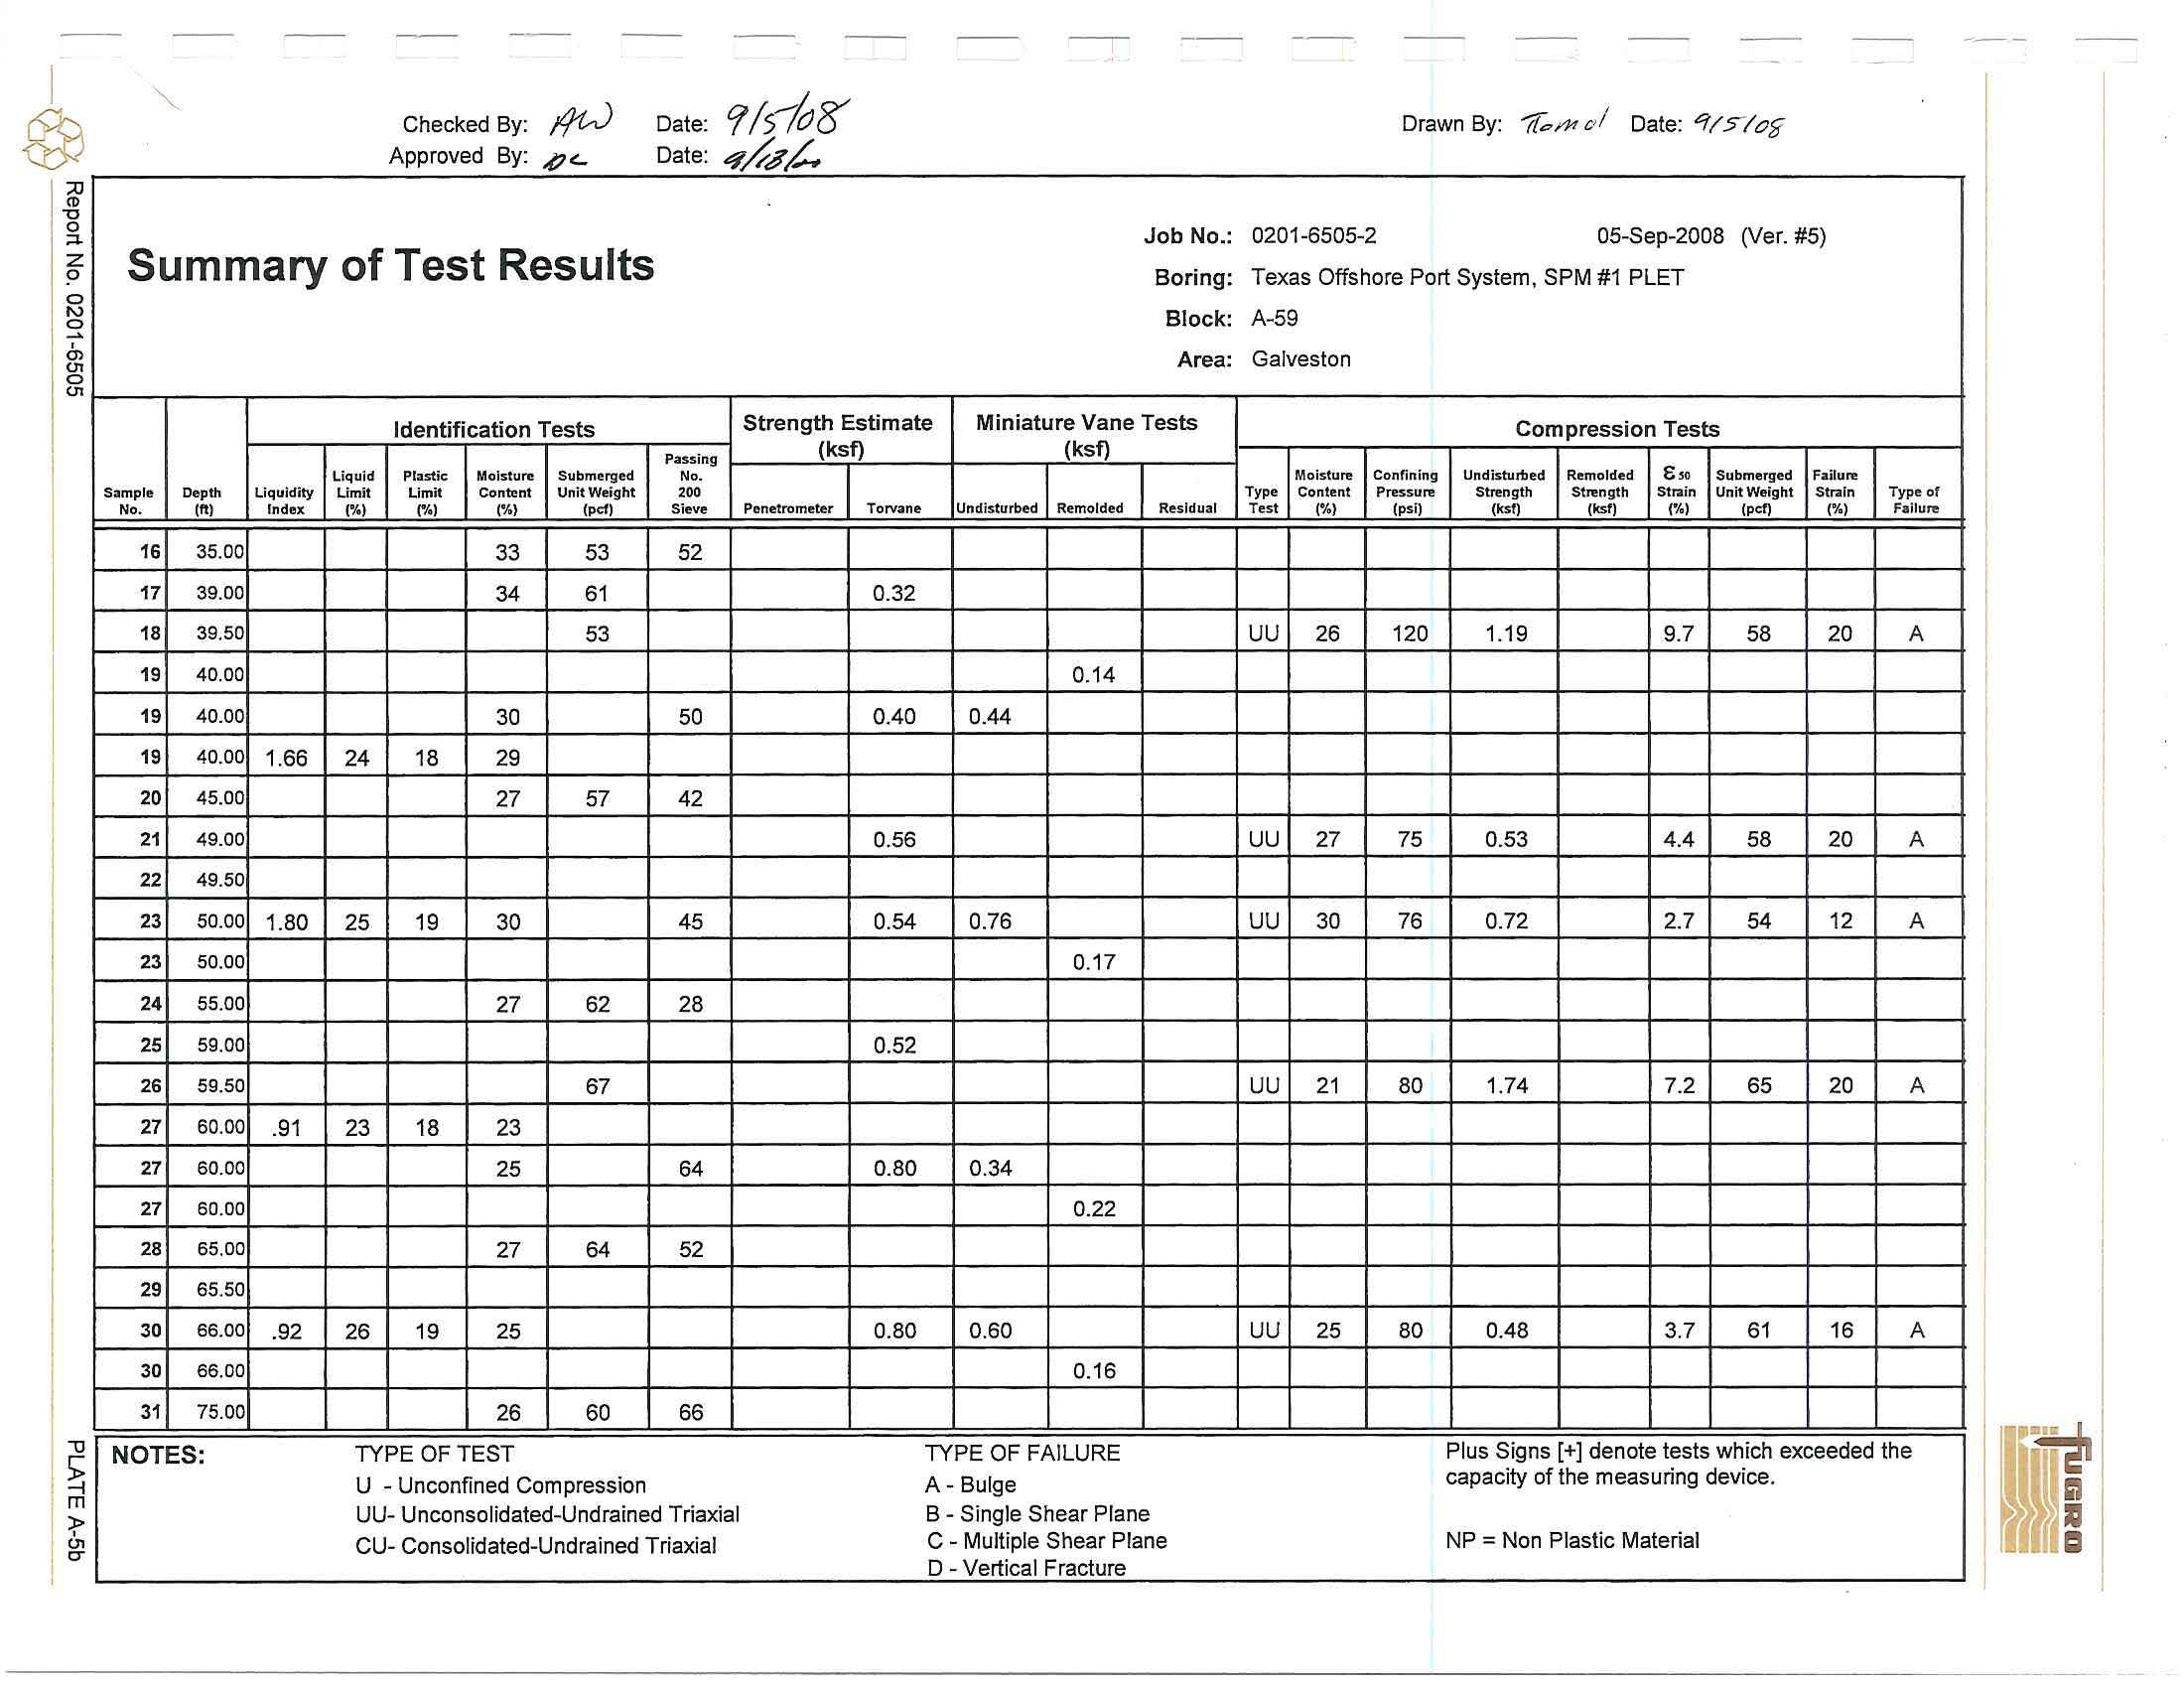
The strength
and
classification test results are presented graphically
on the Logs of Boring and Test Results in Section
3.
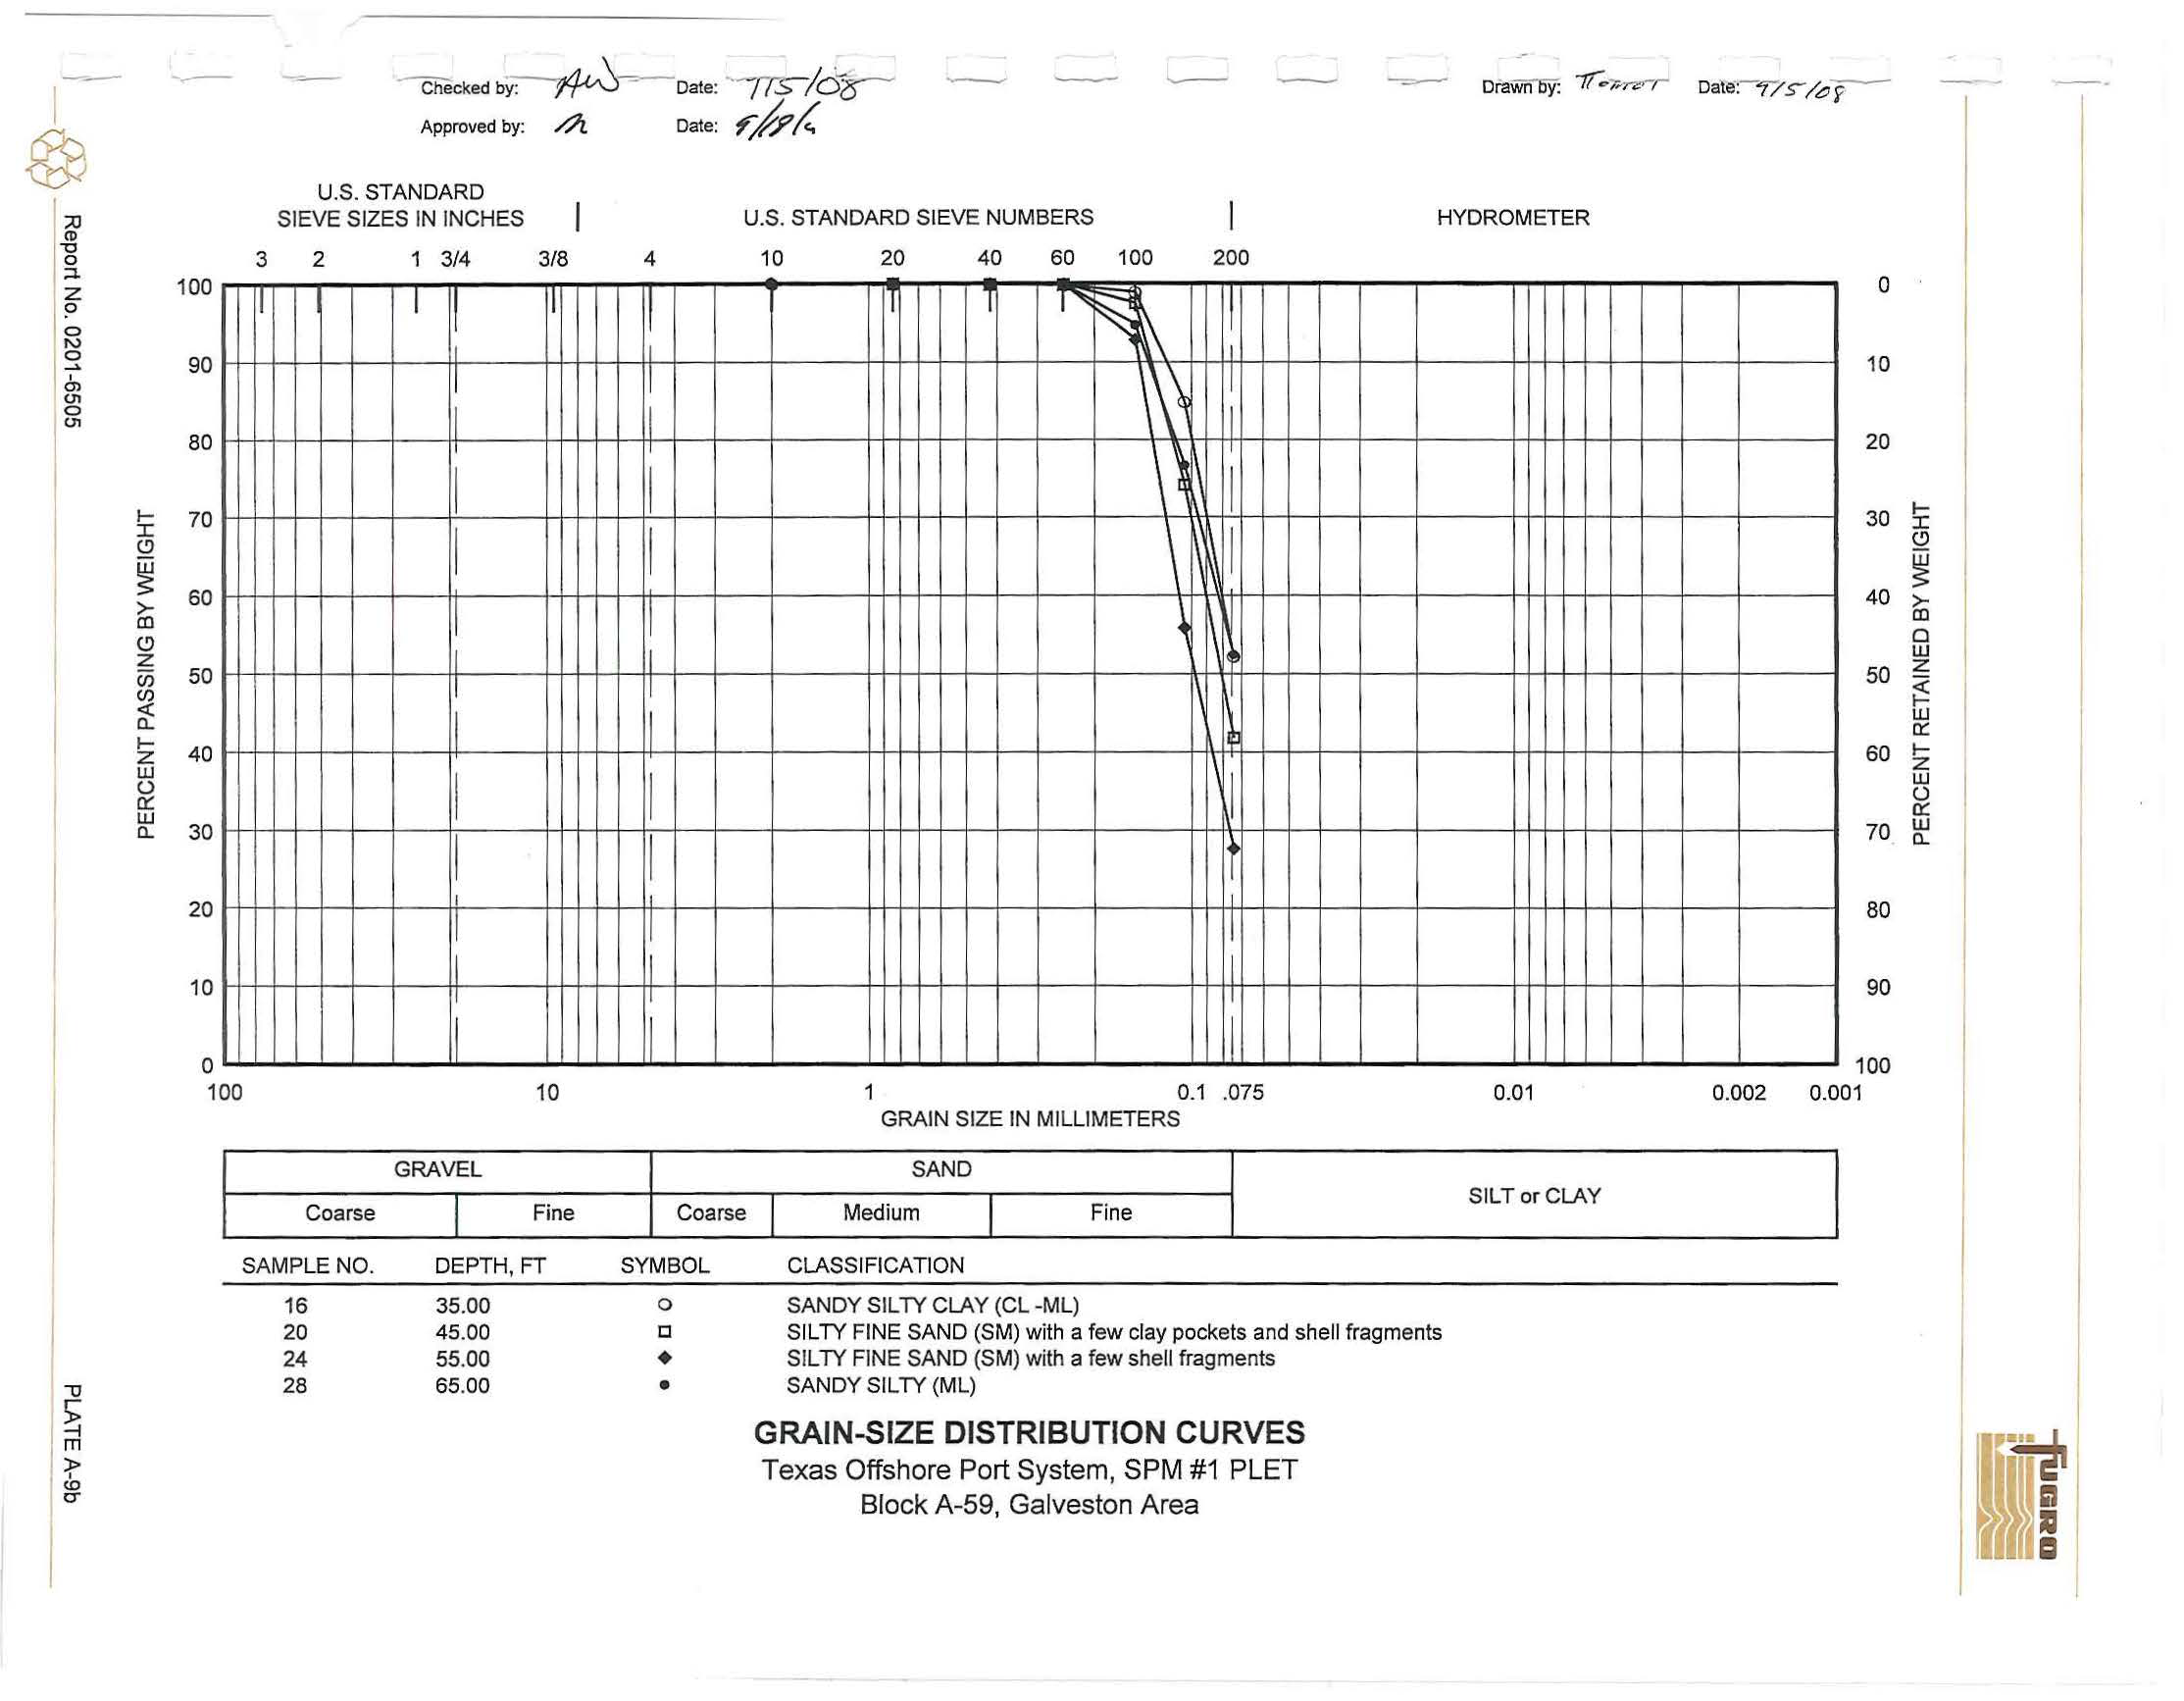
Grain-size distribution curves from sieve-analysis and stress-strain curves from triaxial compression tests
are presented
in Appendix
A.
2.3
GENERAL SOIL CONDITIONS
2.3.1
Soil Stratigraphy
The soil
strat
i
graphy
at each of the boring locations
disclosed
by the field and
laborat
ory
investigations
is
presented
in Section 3. The soil stratigraphy is based on the classification of soil
samples
recovered from
the
boring and observations
m
ade
during drilling operations. Detailed soil descriptions, for
each location, that include
t
extural
variations and inclusions are noted
on the respective
boring
log
I
-
@
Report No. 0201-6505
2-3
.s
....
~
Cl Cl
~
~
'O
'O
Q)
Q)
~
e
Q)
a.
,; a.
'-' <t
X
=
3,2
56,40
0
ft
X
=
3,261,400ft
X
=
3,266,400ft
Y
=
247,000 ft
N
Block
A
-5
9
Back to top
Galveston
Area
~
Y
=
242,000 ft
.,,.,.
........
Offshore Terminal
•
/
'
y
=
237,000
ft
I
SPM
#1
PLET \
I
\
SPM
#1
Anch
1
Leg
#2
1
I
\
1,470 ft/
'
/
.....
-
Y
=
232,000 ft
Projection:
Texas
South Central
Zone
Coordinates
PLAN OF
BORINGS
SPM~Anchor Leg #6
.,,.,.
........
/
I
\
I
SPM
#2
PLET \
\
~
I
\
1,470ft~
'
/
.....
__
Texas Offshore Port System
Block
A-59,
Galveston Area
i,i
1ii
0
-
v
\
II
\"::'
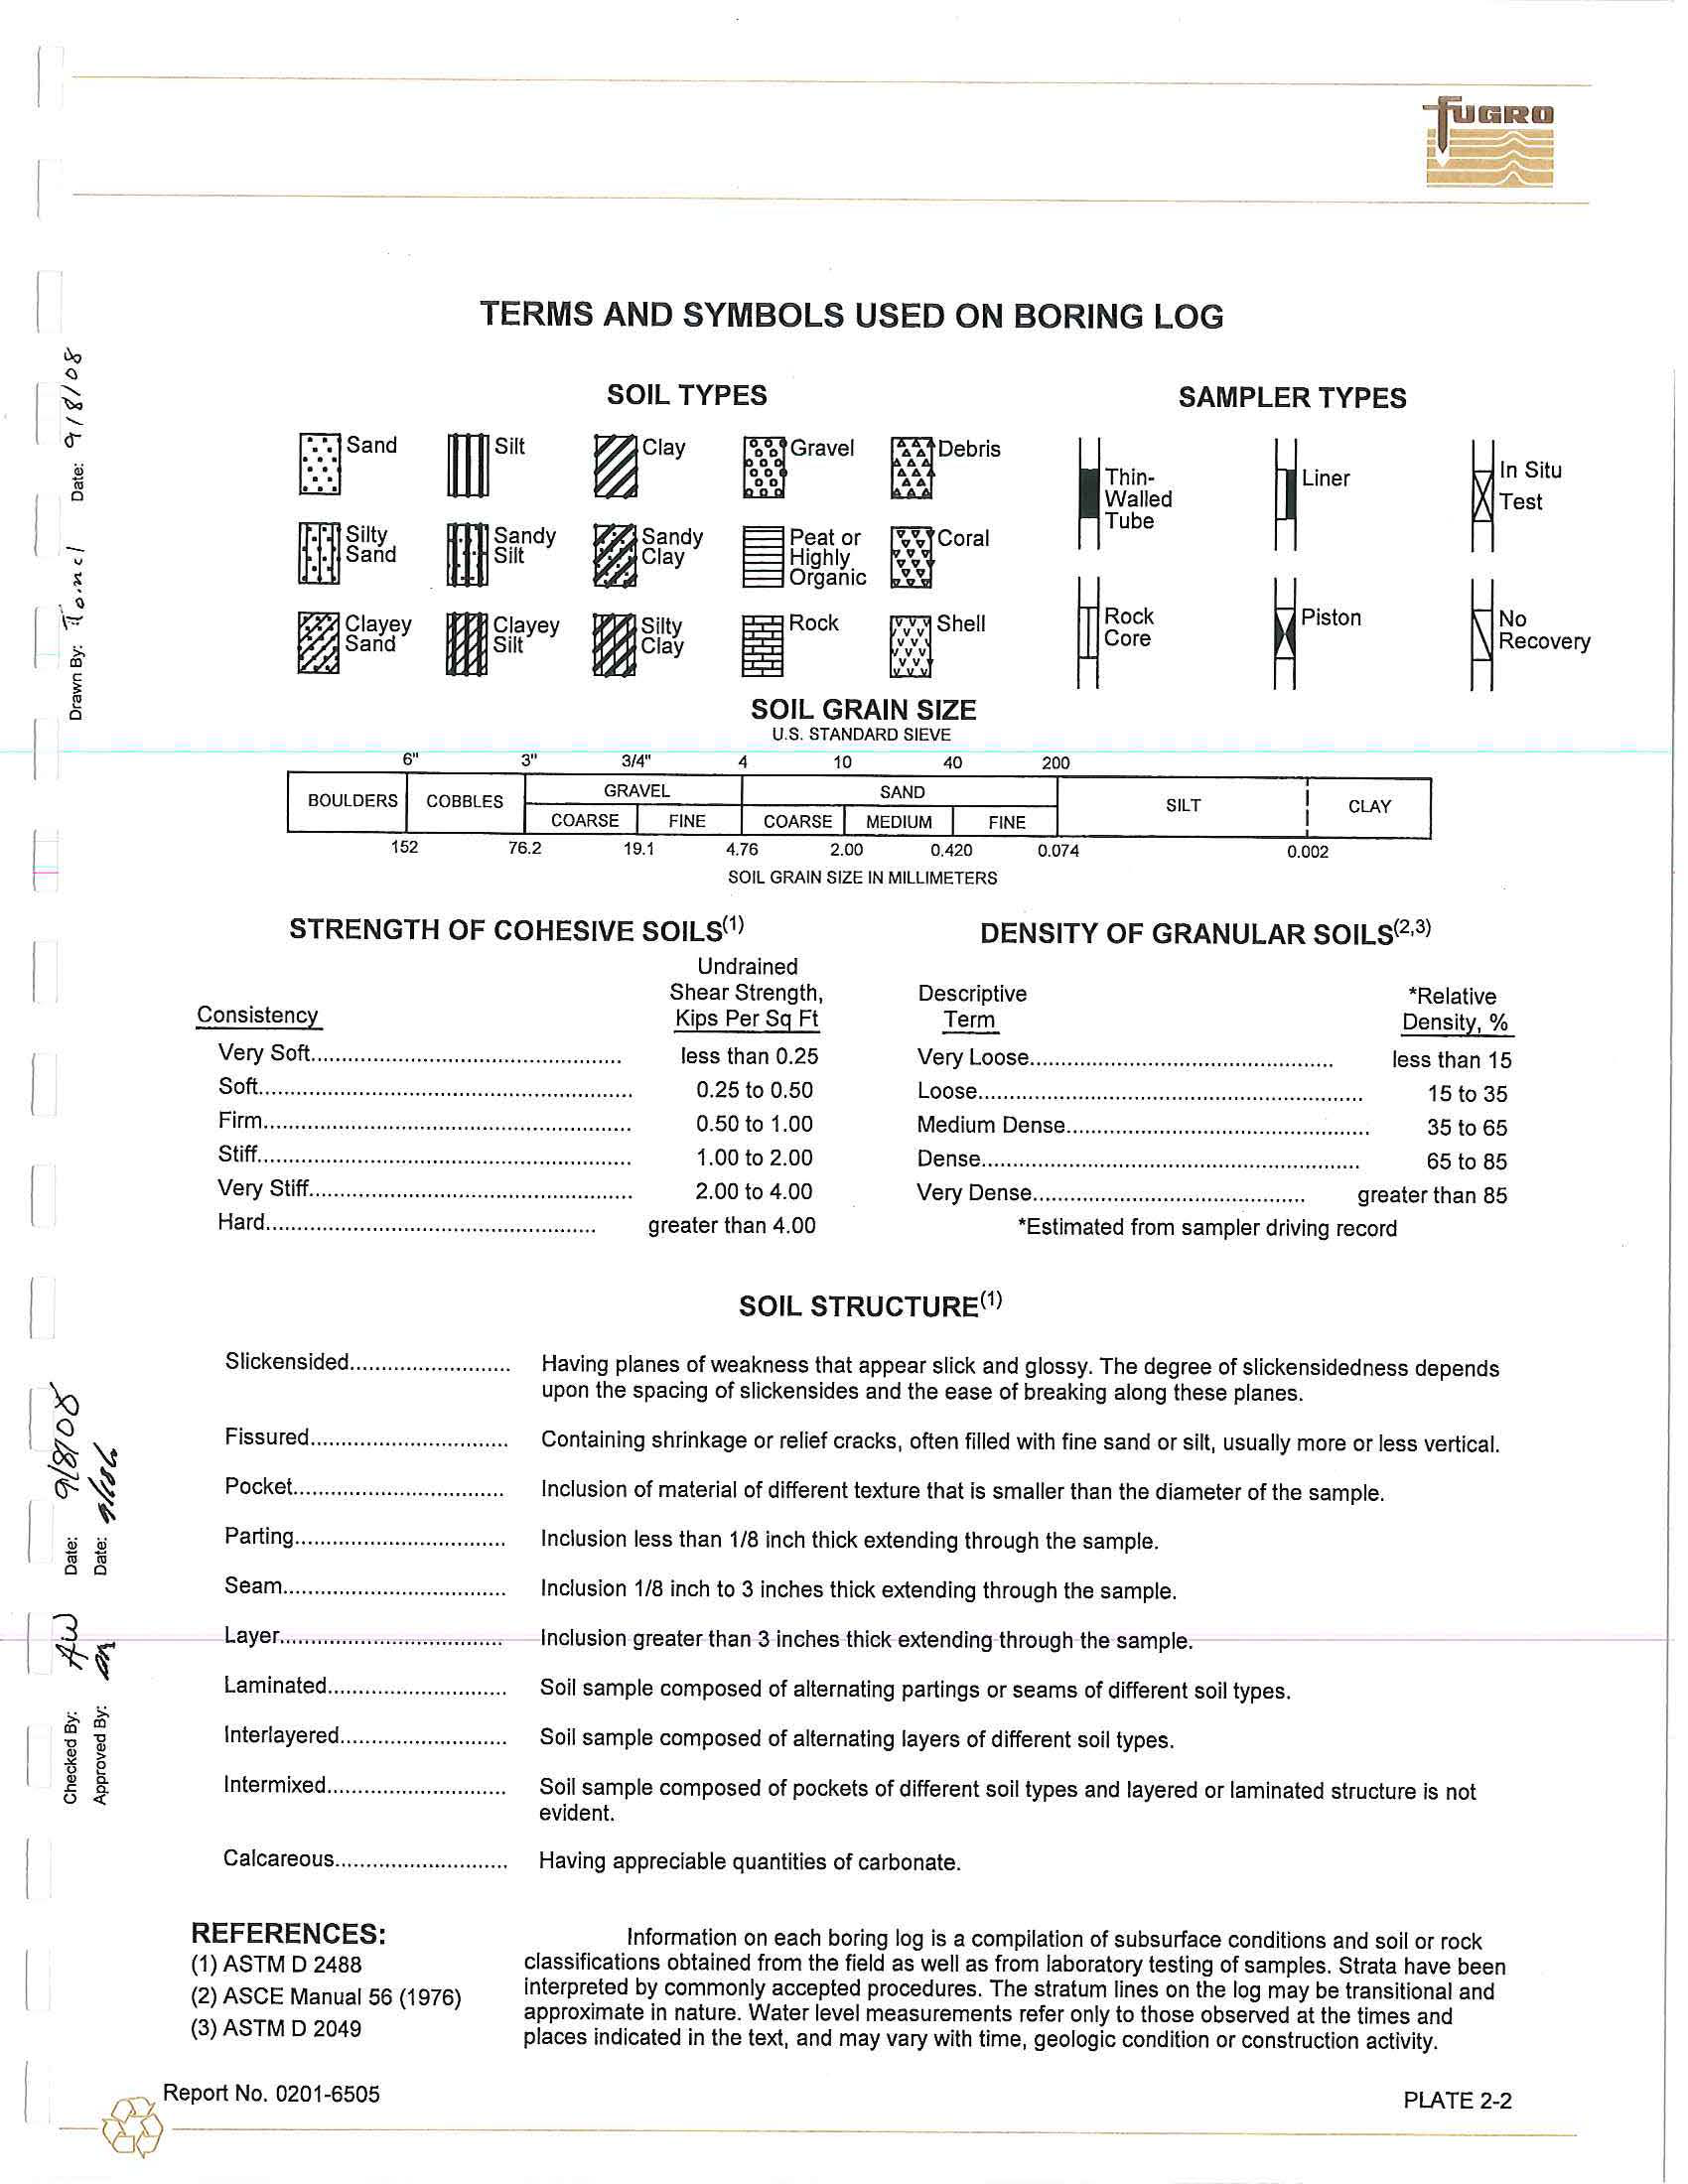
TERMS AND
SYMBOLS
USED ON
BORING
LOG
SOIL TYPES
SAMPLER TYPES
[!Sand
mSilt
~Clay
~Gravel
~Debr
i
s
~Liae,
0
..
~Th;,.
~'" su,
0
...
Walled
Test
Tube
!ill
Silty
msandy
I
Sandy
~Peat or
VI,
Coral
Sand
Silt
C
l
ay
High
l
y
"
Organic
9
v
9
v
~Clayey
mClayey
mSilty
~p;,100
I
Rock
iShell
~Rock
~No
Sand
Silt
Clay
v
Core
Recovery
v
v
SOIL GRAIN SIZE
U.S
.
STANDARD SIEVE
6"
3"
3/4"
4
10
40
200
B
OULDERS
COBBLES
GRAVEL
SAND
SILT
CLAY
COARSE
FINE
COARSE
MEDIUM
FINE
152
76.2
19
.
1
4.76
2.00
0.420
0.074
0.002
SOIL GRAIN SIZE IN
MILLIMETERS
DENSITY OF GRANULAR SOILS(
2,3
l
STRENGTH OF COHESIVE SOILS(
1
l
Undrained
Shear Strength,
Consistency
Kips Per Sg
Ft
Descriptive
*Relative
T
erm
Density,%
Very
Soft....
..............................................
less than
0.25
Very
L
oose..
...............................................
less than
15
Soft...
.........................................................
0.25
to
0.50
Loose...
...........................................................
15
to 35
Firm.
..........................................................
0.50
to
1.00
Medium Dense.
................................................
35
to
65
Stiff........
....................................................
1.00
to
2.00
Dense..
...........................................................
65
to
85
Very Stiff...
.................................................
2.00
to
4
.0
0
Very Dense
............................................
greater than
85
*Estimated from sampler driving record
Hard.
....................................................
greater than
4.00
SOIL STRUCTURE(
1
l
Slickensided..
........................
Having planes of weakness that
appear
slick and glossy. The degree
of slickensidedness
depends
upon the
spacing
of slickensides and the ease of breaking along these planes.
Fissured.............
...................
Containing shrinkage
or relief
cracks,
often filled with fine sand
or silt,
usually more or
less
vertical.
Pocket....
..............................
Inclusion of material
of
different texture
t
hat is smaller than
the
diameter of the
sample.
Parting.
.................................
Inclusion less than 1/8 inch thick extending through the sample.
Seam.......
.............................
Inclusion 1/8 inch to
3 inches
thick extending through the sample.
L
ayer.
...................................
Inclusion
g
r
eater than
3
i
n
ches thick extending through the sample.
Laminated.........
....................
Soi
l
sample composed
of alternating partings
or
seams
of
different soil types
.
l
nterlayered......
.....................
Soil sample composed of alternating layers
of
different
soil
types
.
Intermixed....
.........................
Soil
sample
composed
of
pockets of different so
i
l types and layered or laminated
structure
is not
evident.
Calcareous
............................
REFERENCES:
(1)
ASTM D
2488
(2)
ASCE
Manual
56 (1976)
(3)
ASTM D
2049
Having appreciable quantities
of
carbonate.
I
nformation
on each boring
log
is a compi
l
ation of subsurface conditions and soil or rock
classifications obtained from the field as
well
as from
laboratory
testing of samp
l
es.
Strata
have been
i
n
te
r
preted
by
commonly accepted
procedures.
The stratum lines on the log may
be t
r
ansitiona
l
and
approximate in
nature.
Water level measurements
refer
on
l
y
to those observed
at
the times and
p
l
aces indicated in
the
text, and may
vary
with time, geologic
condition
or construction activ
i
ty.
I
-
@
Report No.
0201-6505
PLATE
2-2
+
l
!
+
~
~
+
•
•
•
C.INC. Si:
1
04
§
LI
NE
S::!103
>,.,._
§
0
,,
Report
No. 0201-6505
-
\~
--
----
"'
"'
"'
no
"'
"'
'"
no
no
no
no
no
'"
+
I
,
..
-+
"'
,
..
""
,
..
"'
-eLM
,
..
"'
"
'
""
"F
,
..
~
!!
~
!
~
§
-
-
-
'
"'
'"'
=
"'
'"'
"'
"'
'
"'
-
'"'
SPM #2
Anchor Leg #6
i
1
(J)
.
.....
'
"
"
"
...
,,.
"'
...
"'
"
'
SPM#2
PLET
...
~
l!
~
'
"
~
0
-+
--
f+
+
e
-i---
=
'"'
'"'
=
.,.,
,
..
..,
-
Offshore
Terminal
=
'"'
ll
l!
~
~
~
§
""
"
"
-
'"
""
""
..
""
..
"
"
........
SPM#1 Anchor Leg #2
@
-t
""
""'
""'
~
.........
ll
...
'"'
-
+
'
"
~
""
'"
.
--
~~
@
SPM #1 PLET
-
""
'"'
...
'
"'
""'
..,
'"'
..,
l!
ij
l
I
+
+
..
"'
........
"'
"'
...
l!
~
!
~
'"'
'"'
'"'
~.
'"'
'
"'
'
"'
'
"'
--
!!
"
'--
~
"'
"'
~
""
"'
11,
,.
'"
;
~
~;
•
•
"'
•
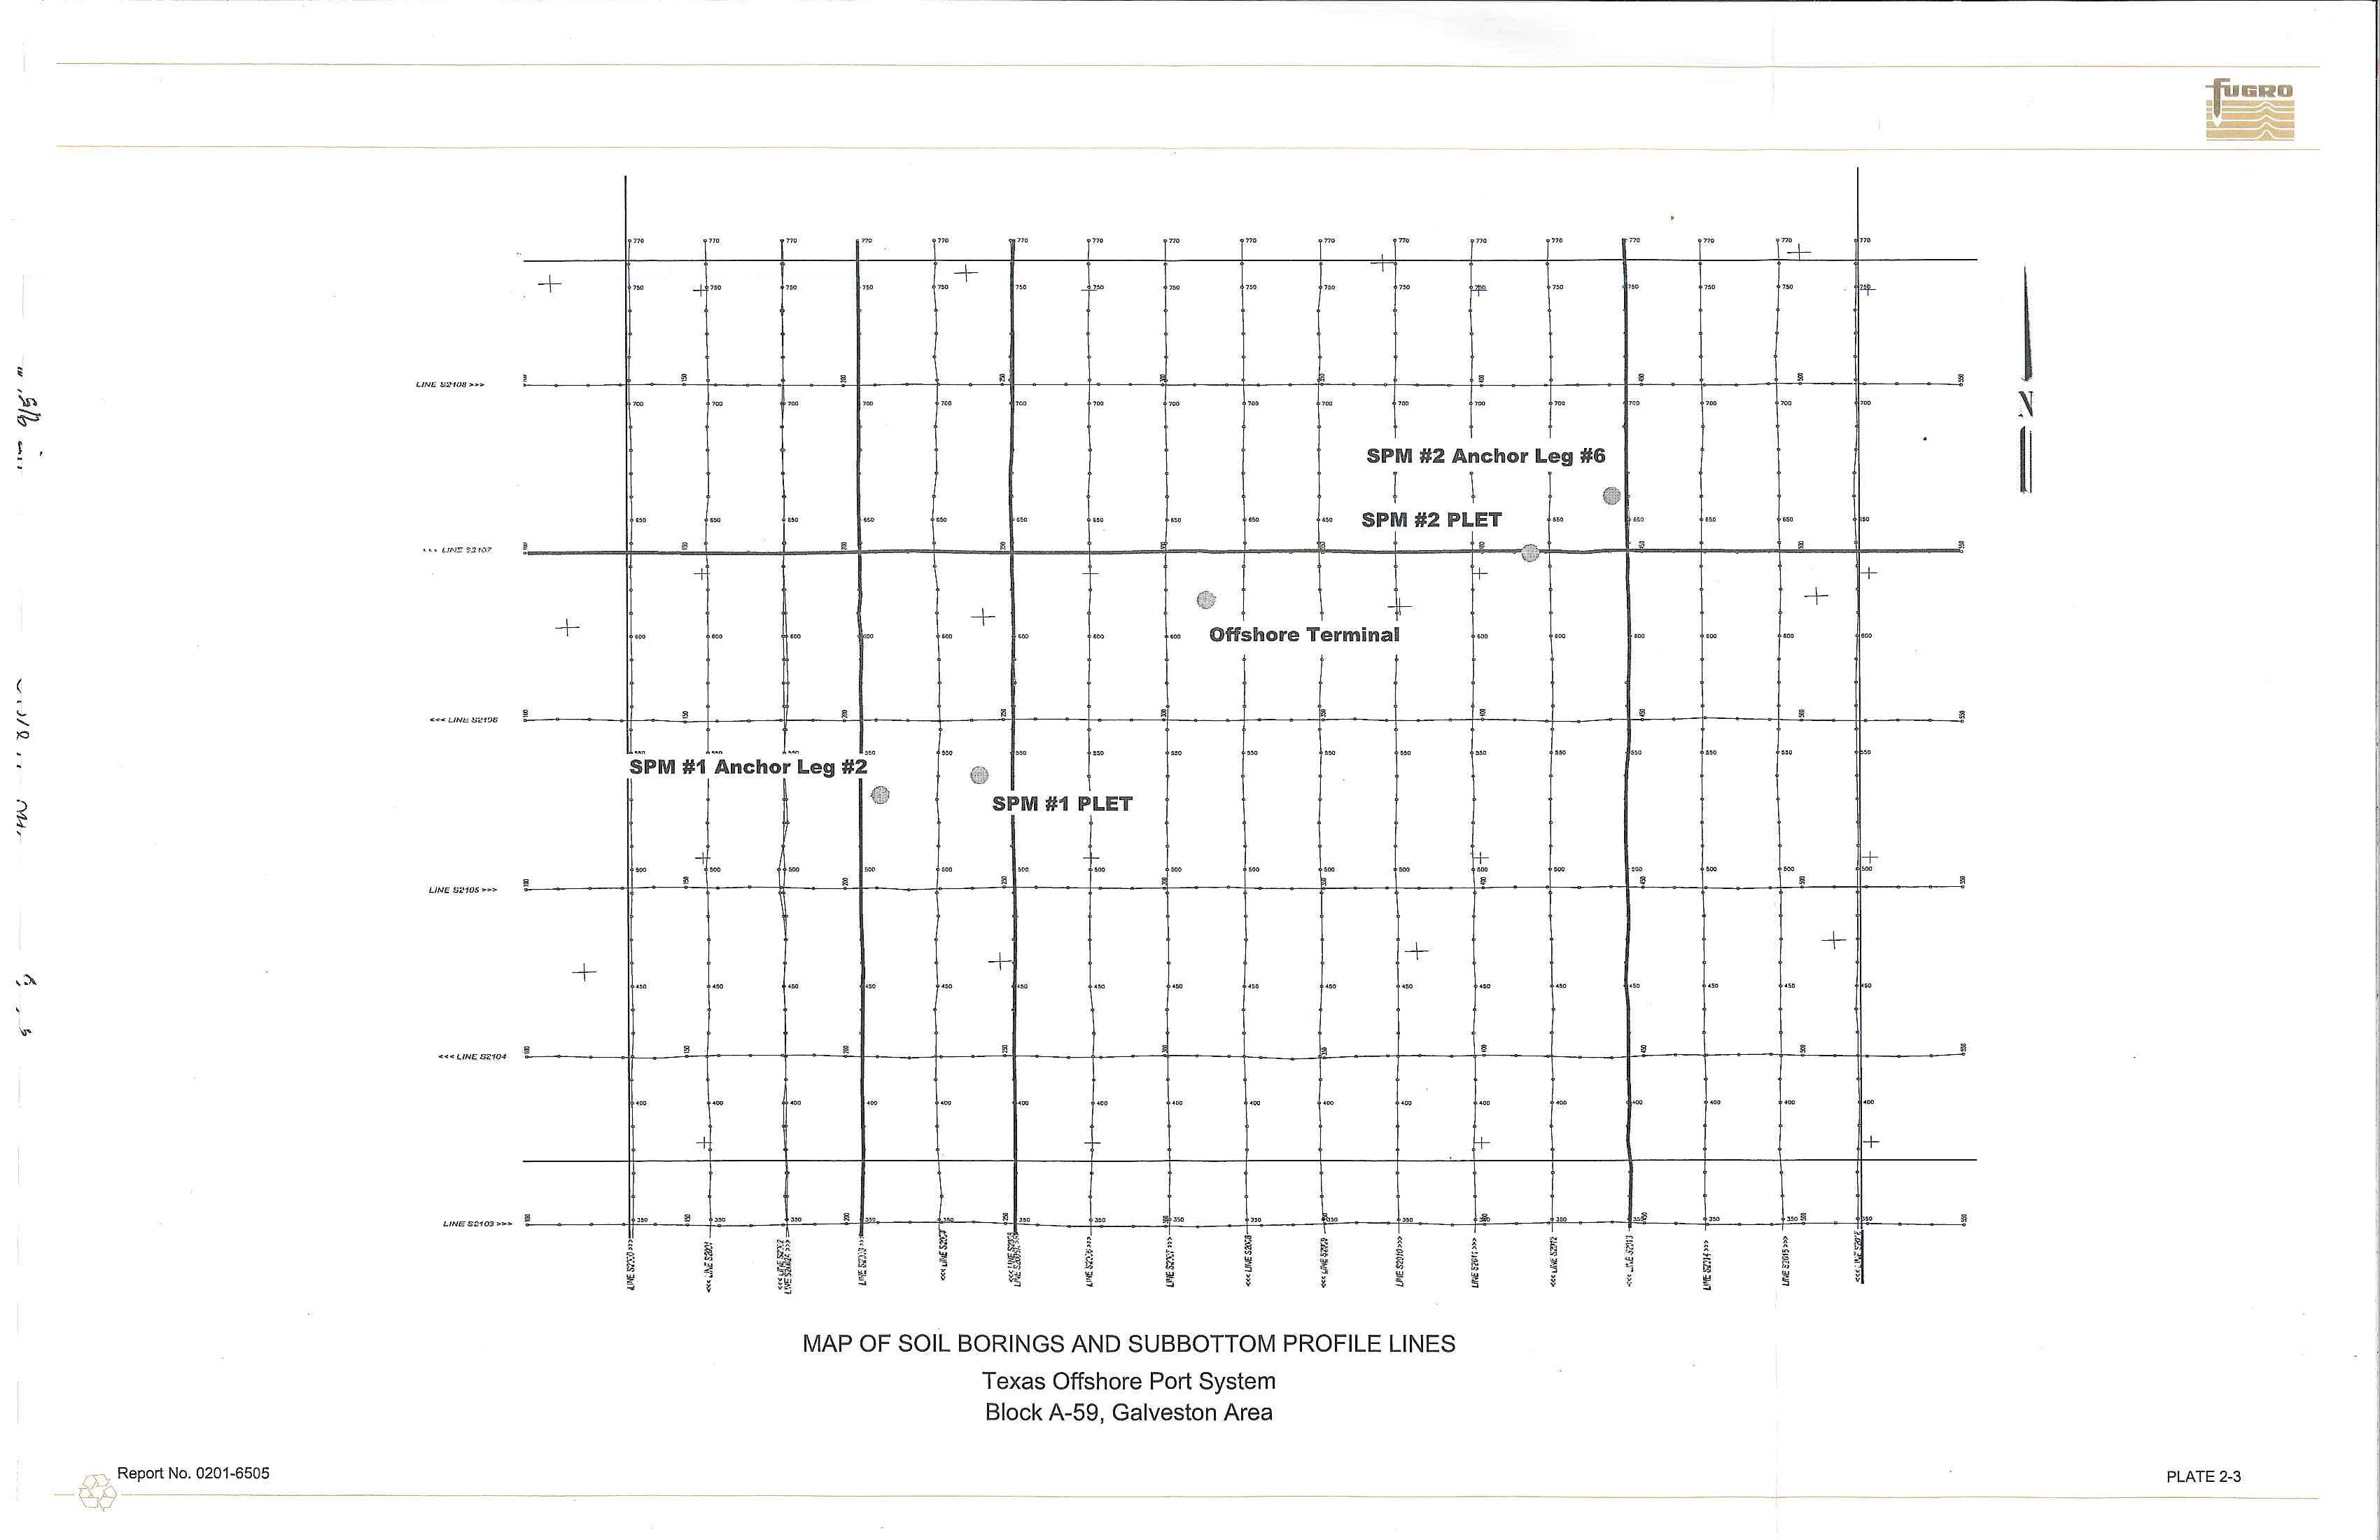
MAP OF
SOIL BORINGS
AND SUBBOTTOM
PROFILE LINES
Texas Offshore Port System
Block
A
-
59, Galveston Area
t
""'
!I
....
§
-
=
f+
A
"'
.
no
no
"'+
'"
7!
1)
'"
,
..
'+
ll
!!
~
"'
'"'
""
""
'
"
.......
~
~
~
+
+
"'
'
"'
"'
..,
ll
~
~
'
"
,
..
""
..
+
'"'
..,
..,
""'
ll
~
~
+
.........
ll
!!
~
-
-
'"'
'
"'
+
..ll
'
"
""~
..
~
•
"'
PLATE
2-3
3
SITE SPECIFIC SOIL AND PILE DESIGN INFORMATION
3.1 SPM #1 PLET LOCATION
3.1.1
Introduction
The field investigation at the location designated as
SPM
#1 PLET
was performed
on July 4 and
5, 2008. Soil
sampling
was
performed to 131-ft
penetration at
Texas
South
Central Zone Coordinates
X
=
3,258,640
ft
and Y
=
236,466
ft.
The measured
water
depth
was
123 ft.
3
.
1.2
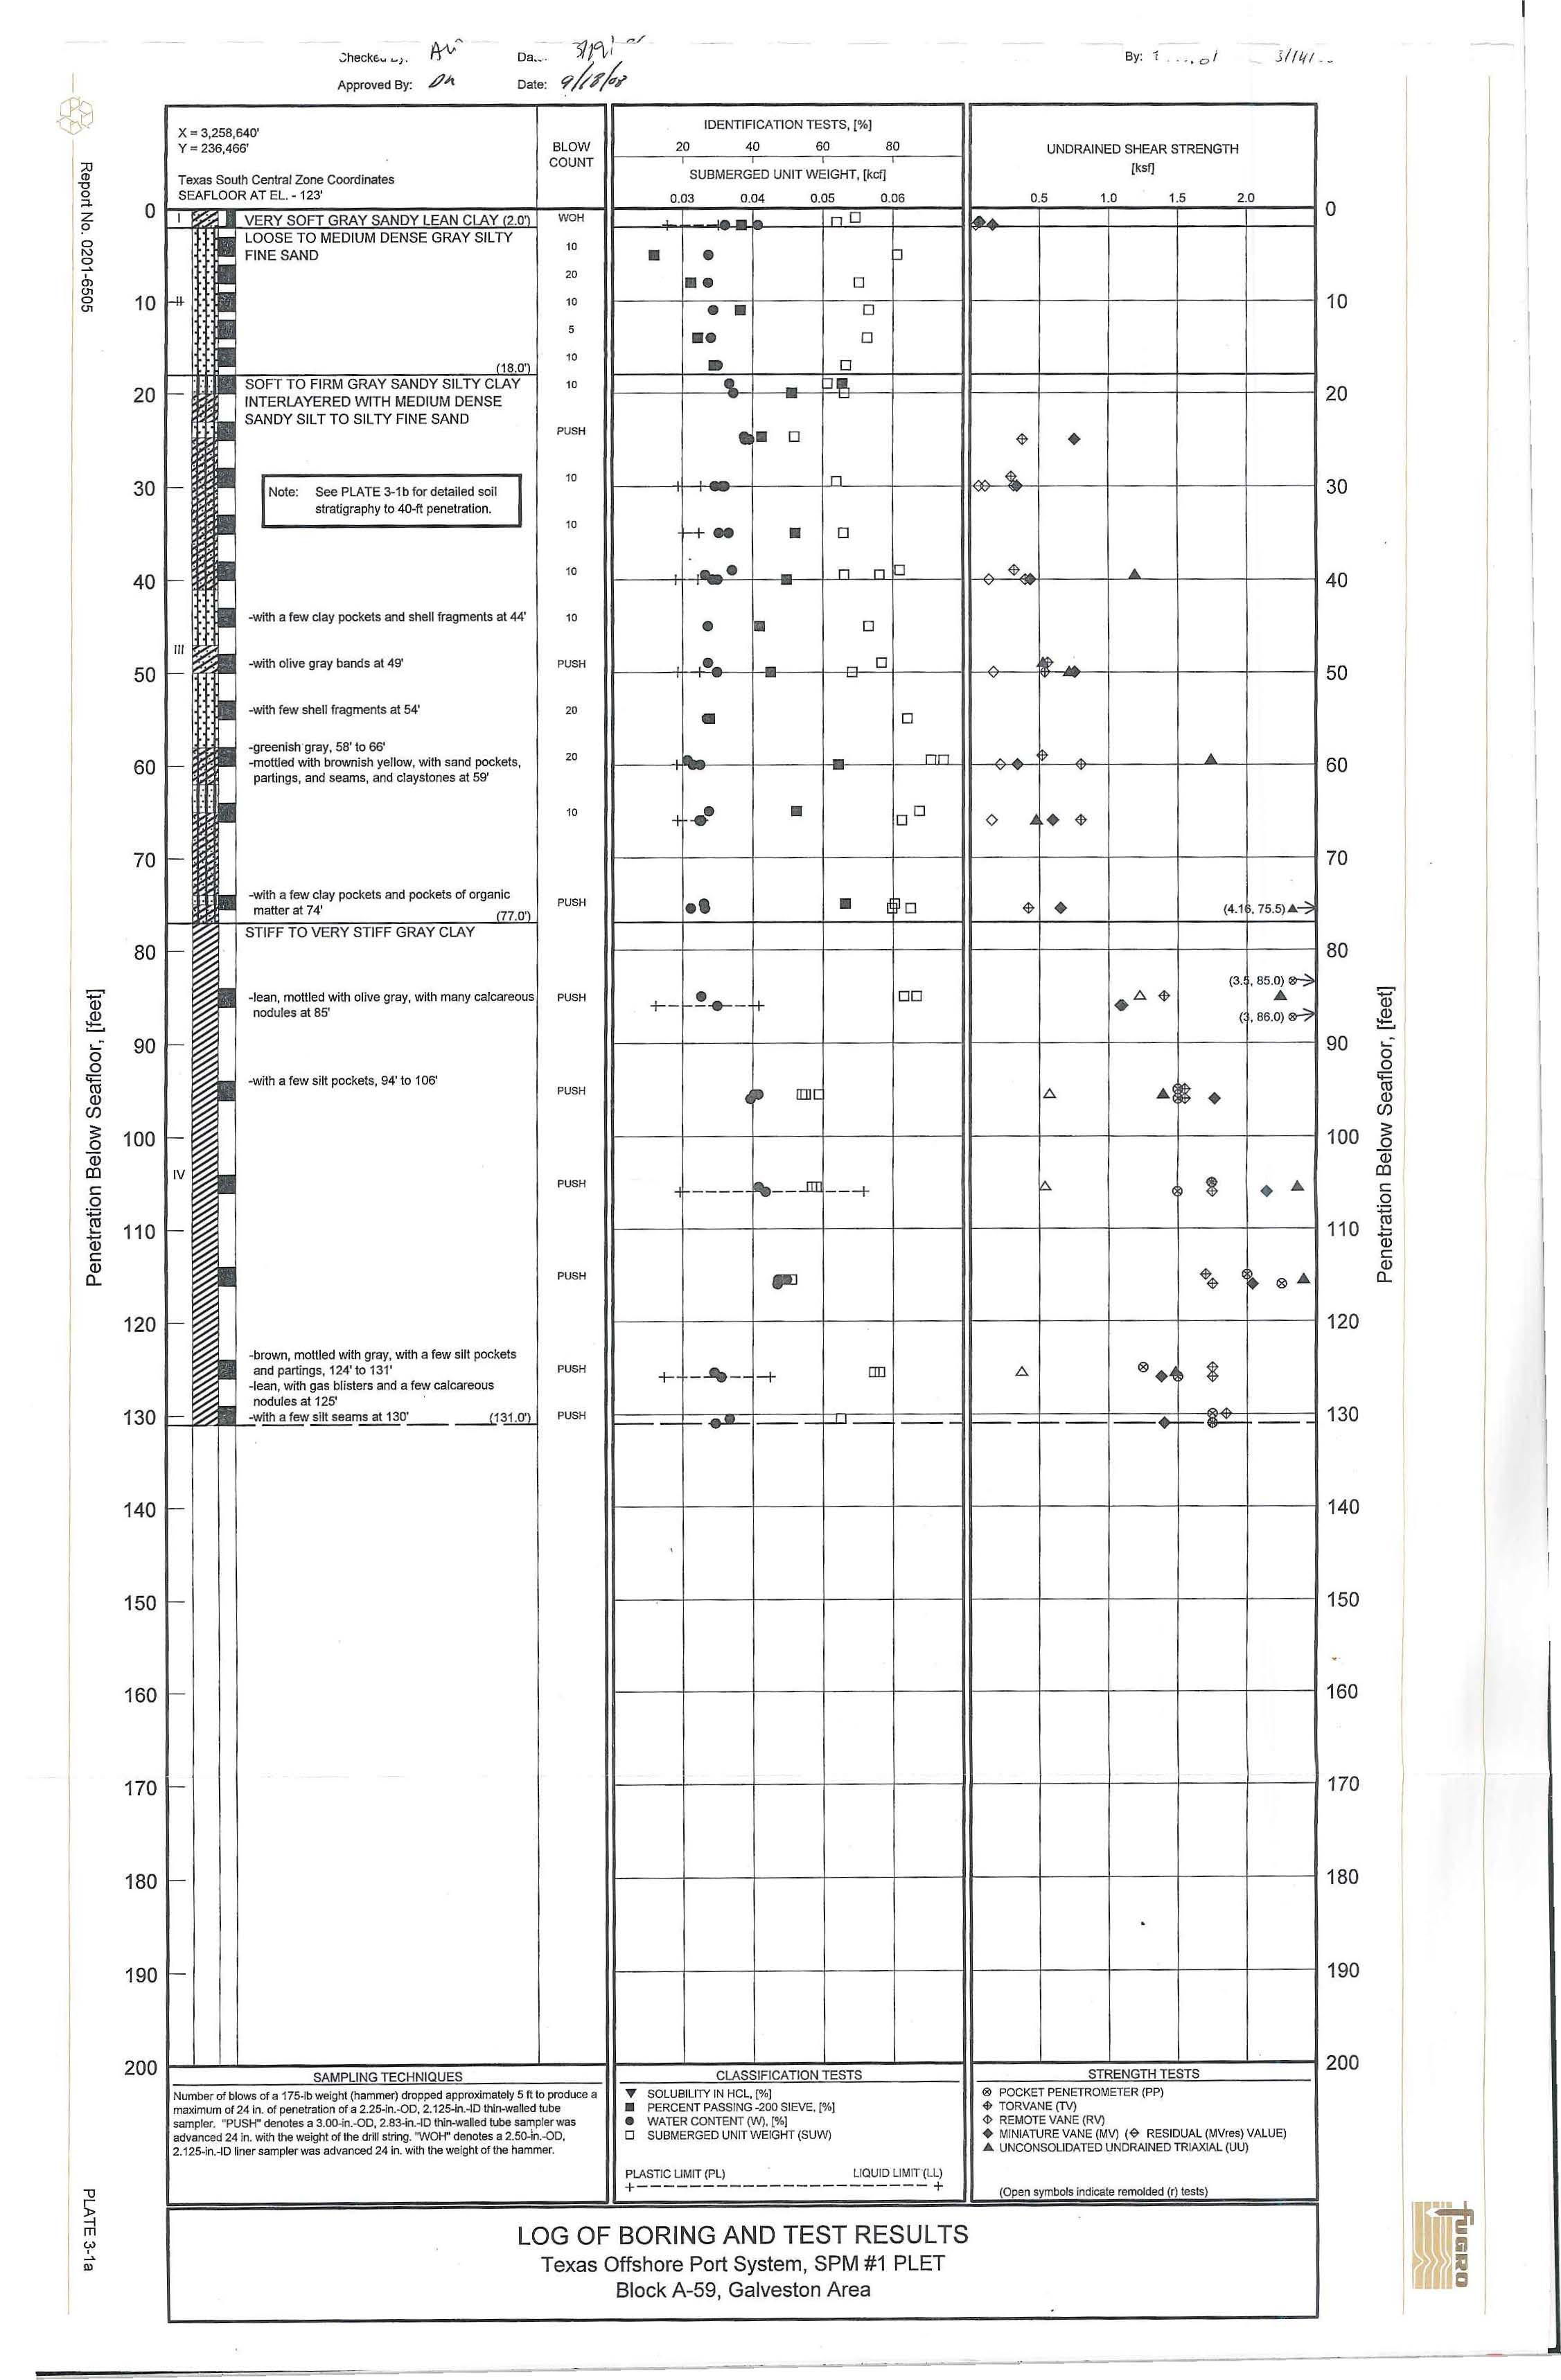
Soil Stratigraphy
The
soil stratigraphy
disclosed by
the
field
and
laboratory investigations is presented
on
the boring
log, Plate
3-1.
The
soil stratigraphy
is based
on
the
classification
of
soil samples
recovered from
the
boring
and observations made
during drilling operations.
A generalized summary of
the major
soil
strata
is
tabulated below.
Penetration,
ft
Stratum
From
To
Description
I
0
2
Very soft sandy
lean
clay
II
2
18
Loose to medium dense
silty
fine
sand
Ill
18
77
Soft to firm
sandy
silty
clay
interlayered
with
medium dense
sandy silt
to silty
fine sand
IV
77
131
Stiff
to
very stiff clay
Detailed
soil descriptions
that include textural
variations and inclusions are
noted
on
the
boring log.
A key
to
the
terms and symbols
used
on the boring log is presented on Plate 2-2. The Roman numeral
representing
each stratum
is
also shown
on the
boring
log and on relevant plates
.
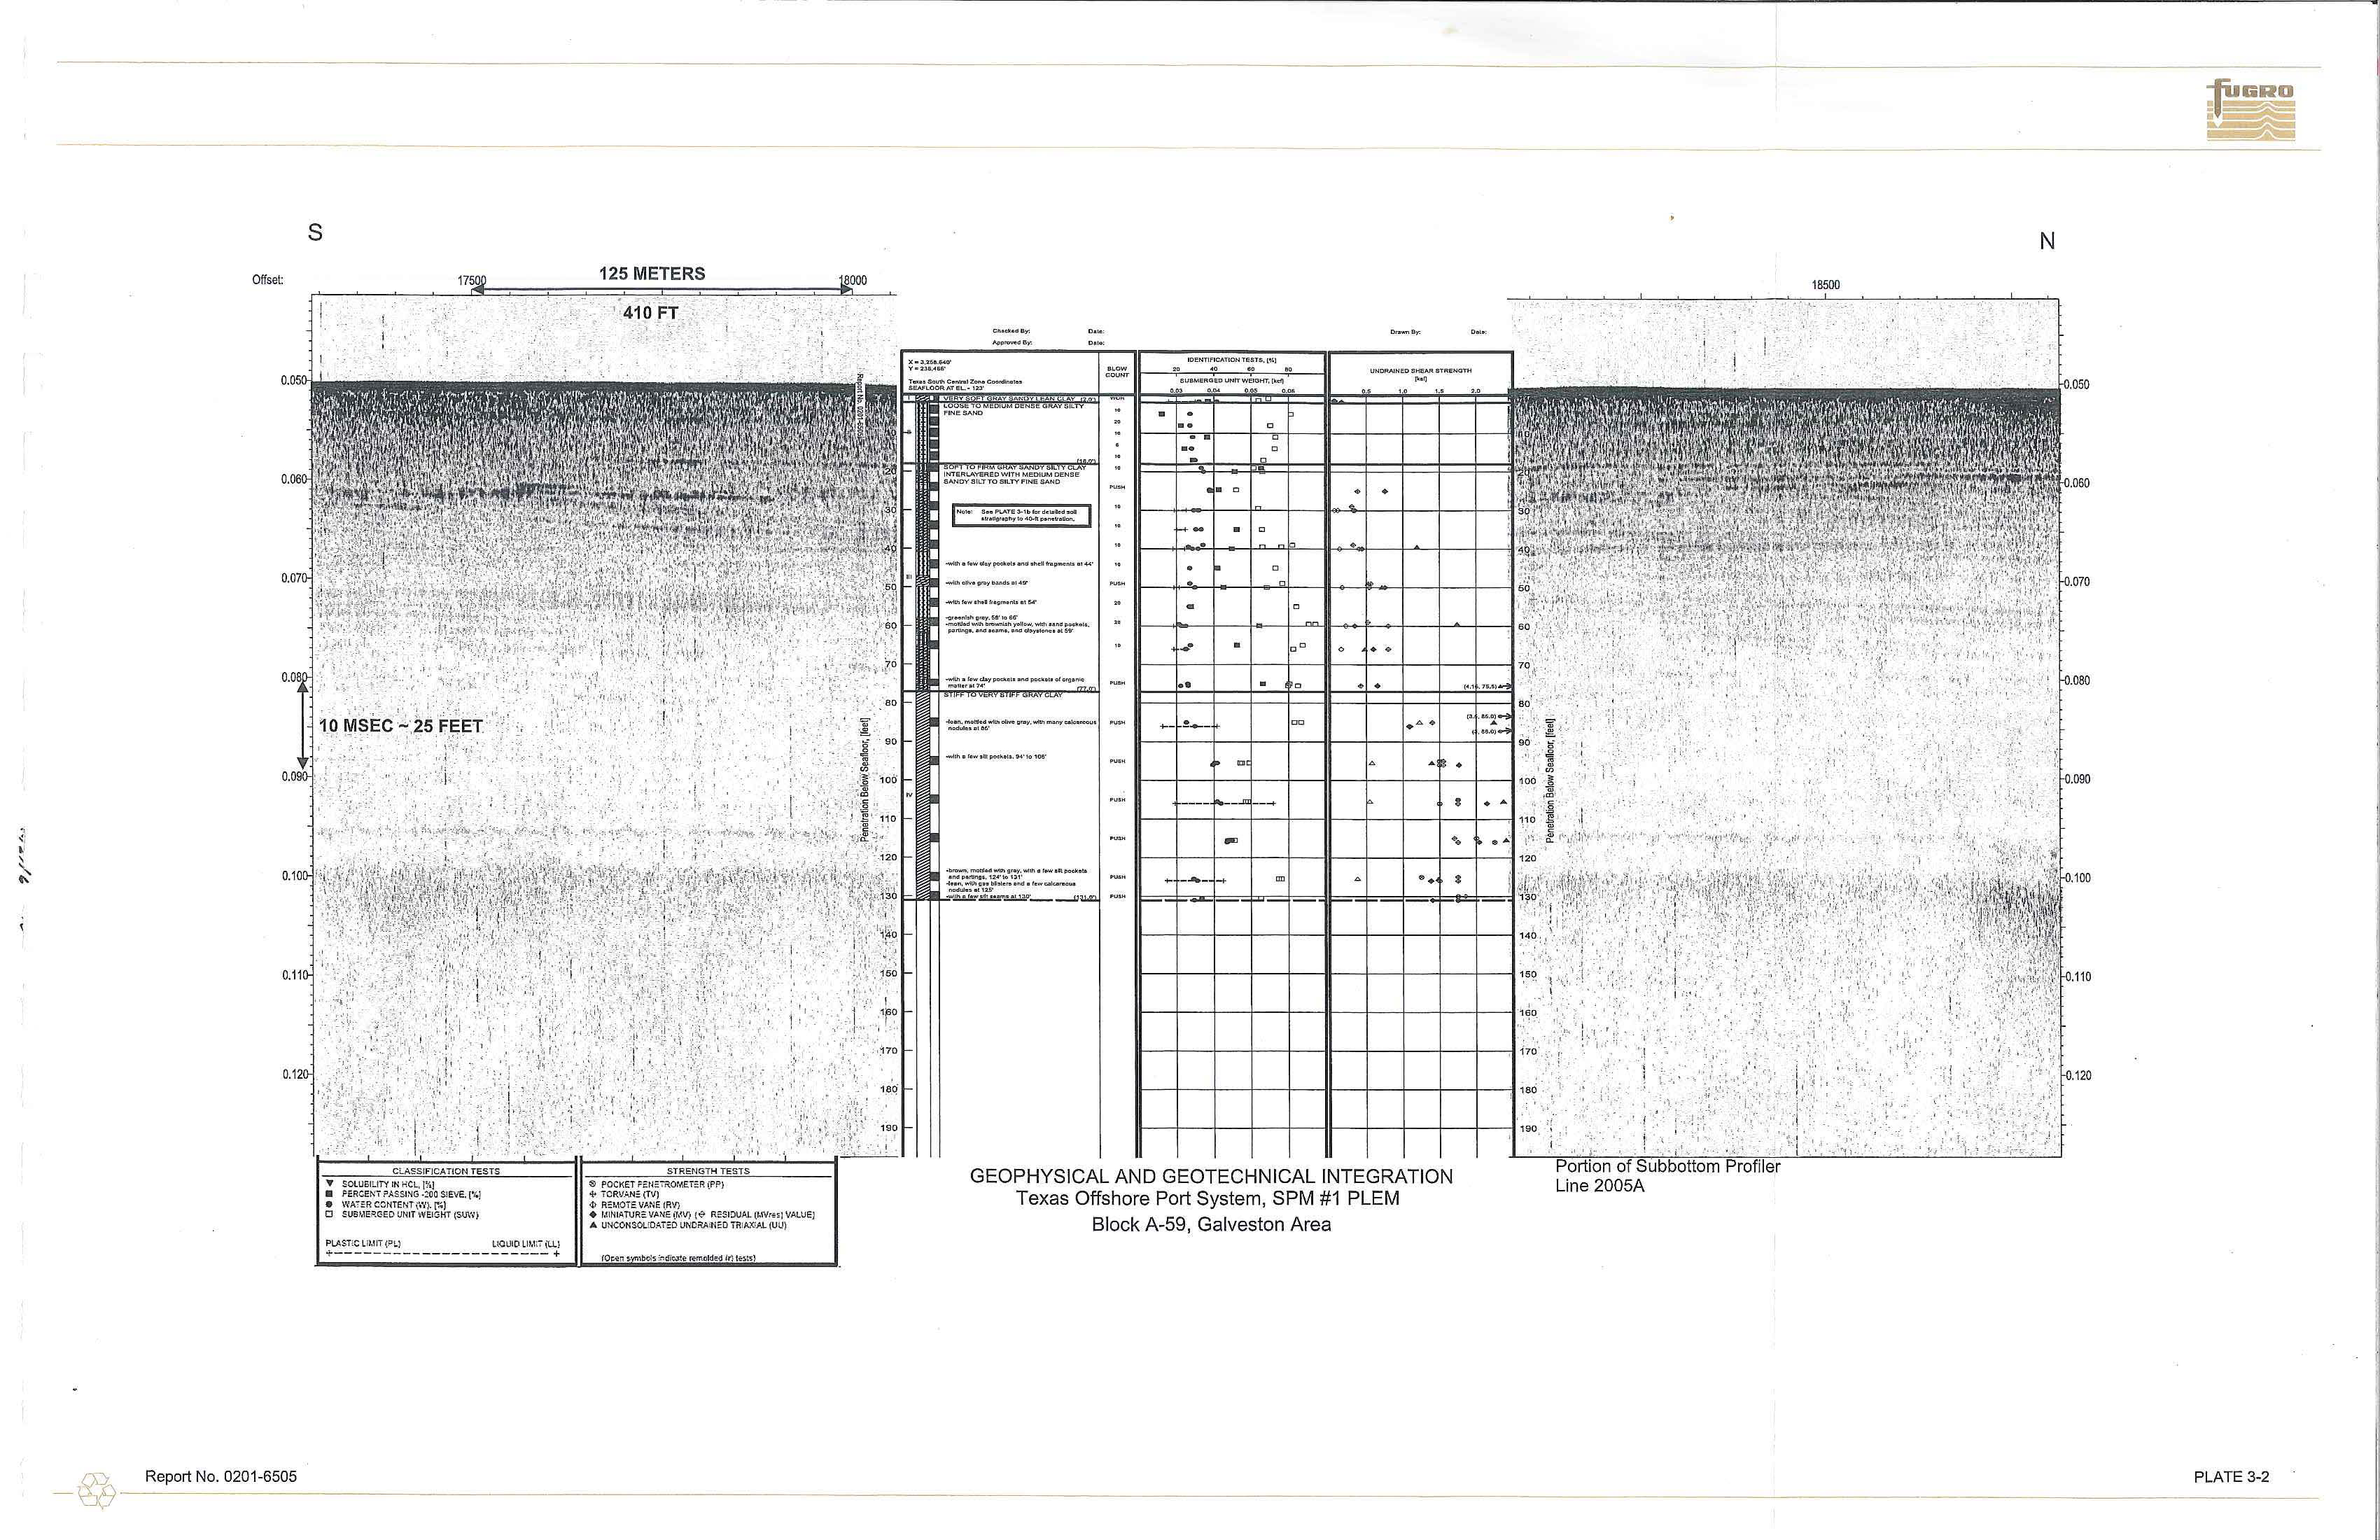
The variation in
soil
stratigraphy across
this
site
is indicated in
a comparison (integration)
ofJhe geophysical and
geotechnical
soi
l
information presented
on
Plate
3-2.
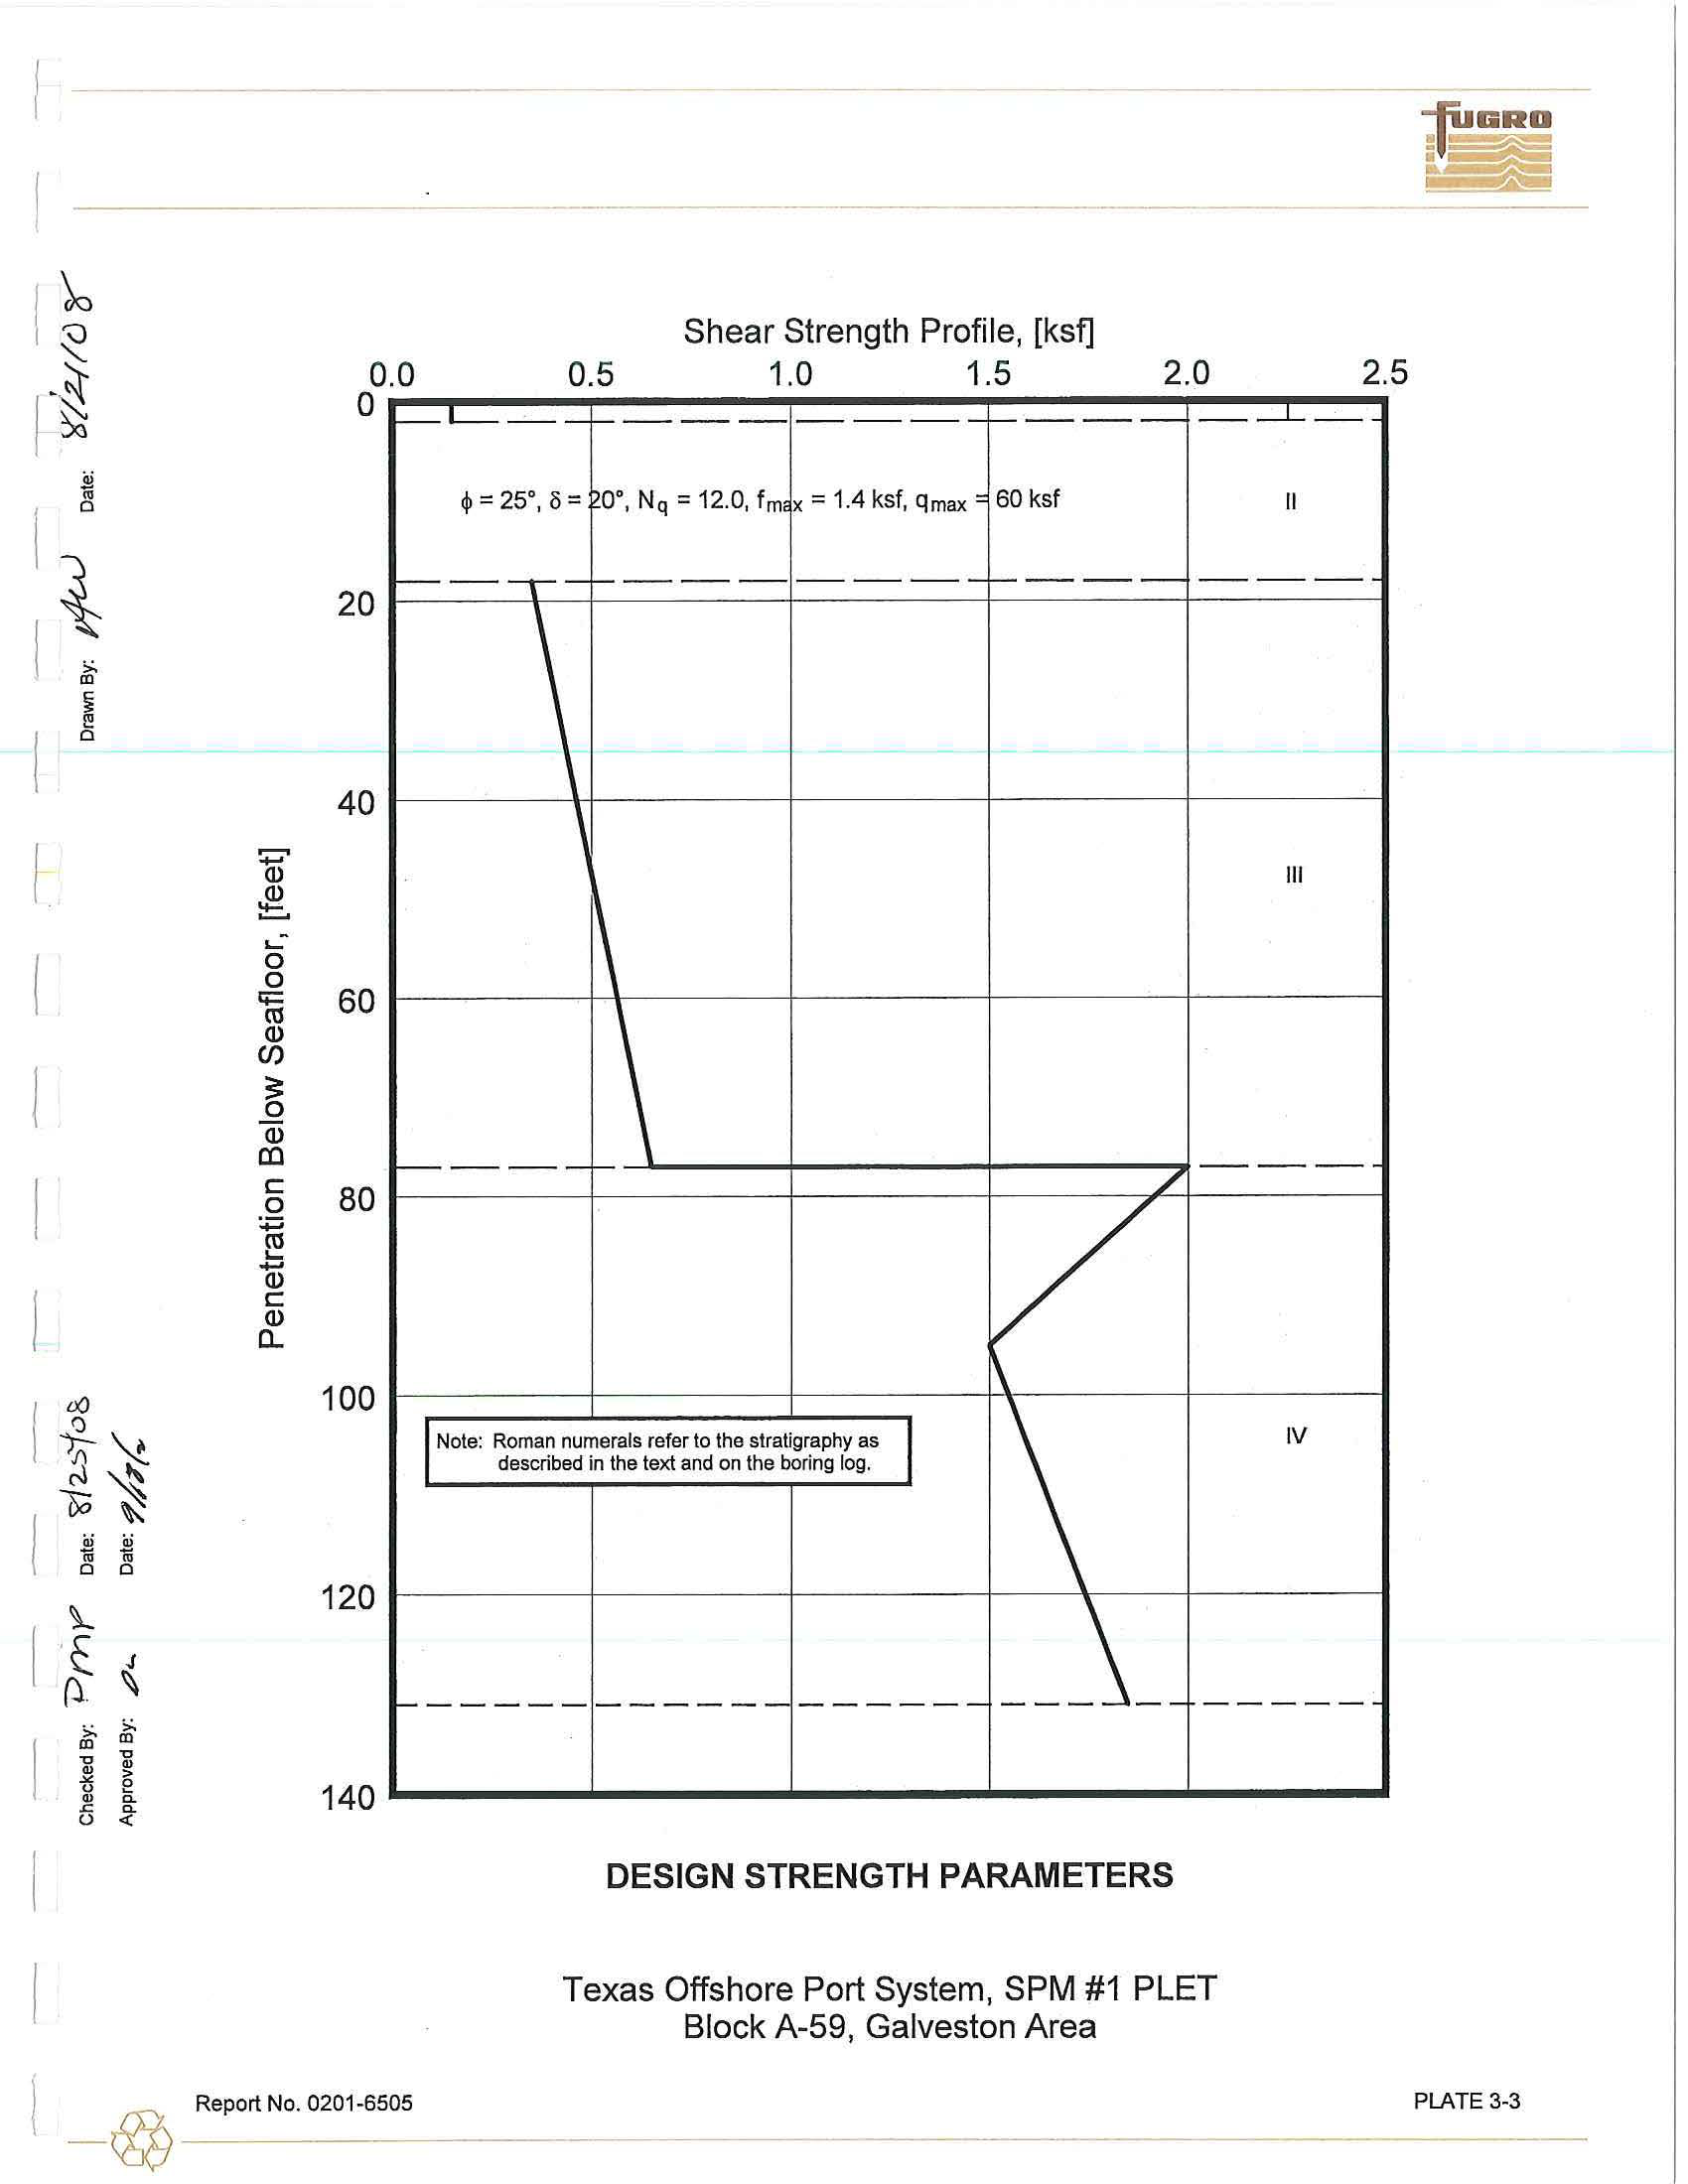
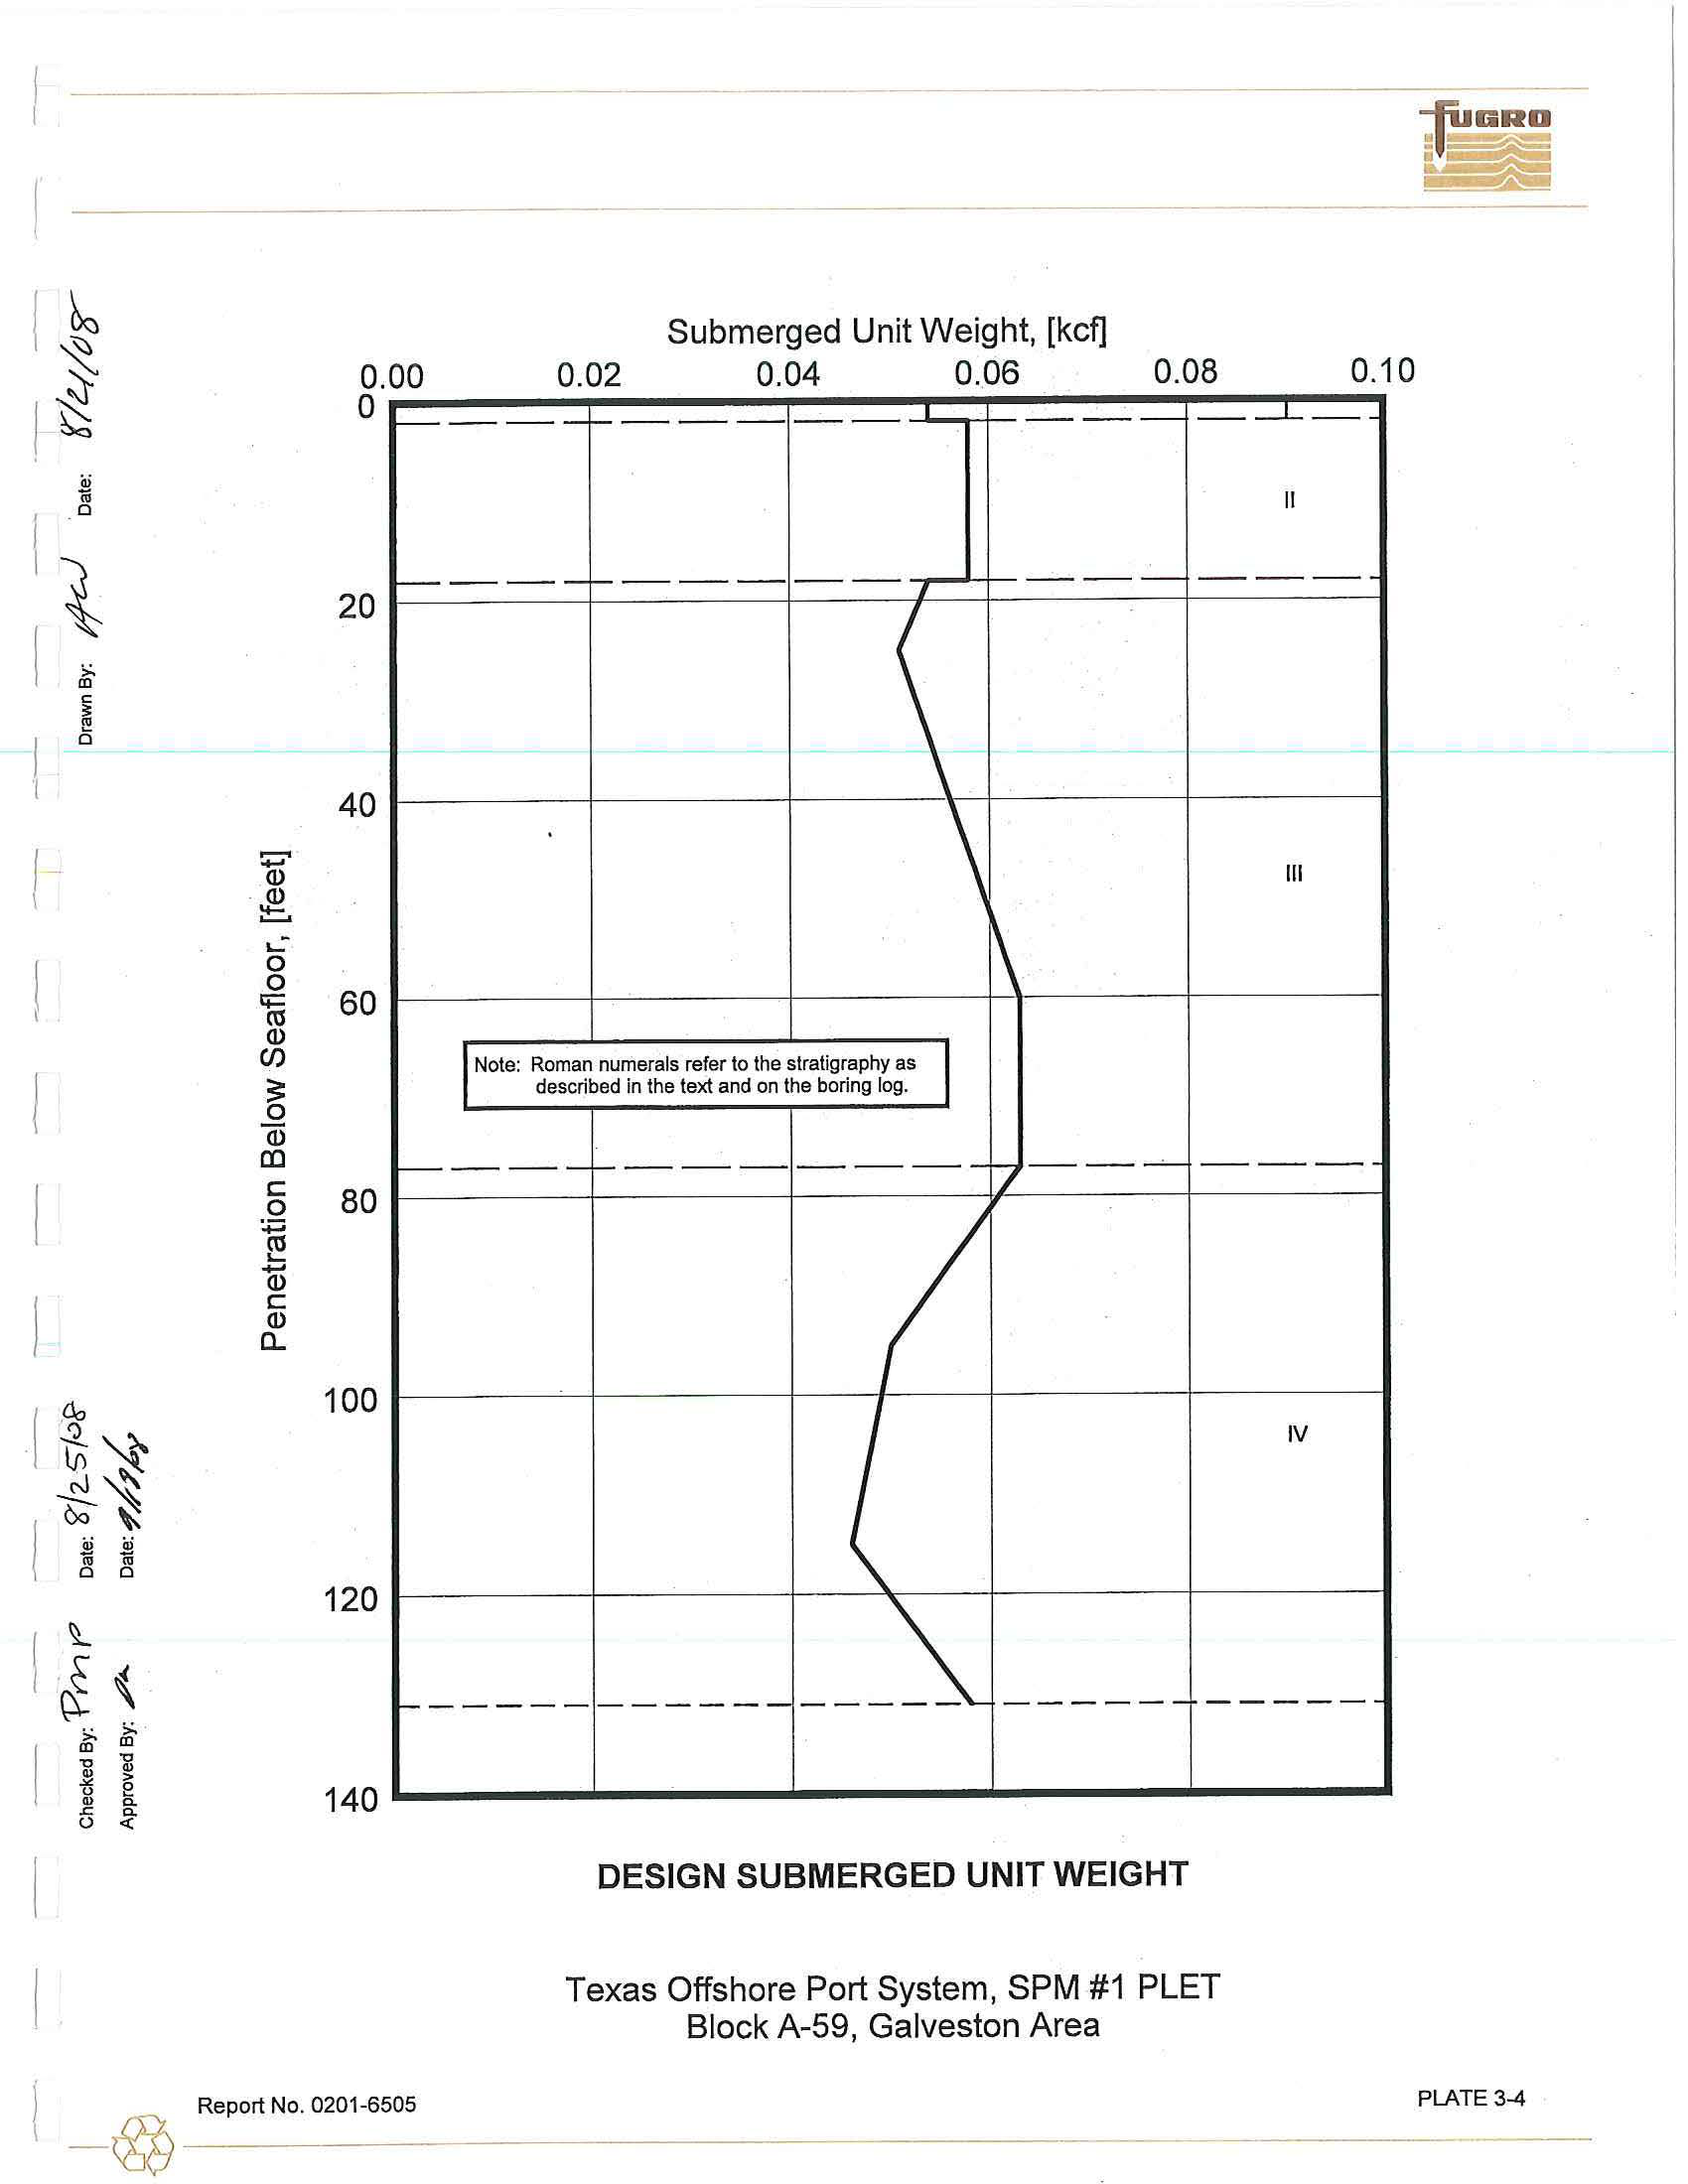
3.1.2.1 Interpretation of Soil Properties
The
shear strength
and
submerged
unit
weight profiles
shown on Plates
3-3 and 3-4,
respectively,
best
represent
the assemb
l
ed
test results plotted
on
the
boring
log.
These profiles were used in the
engineering
analyses.
3.1.3
Pile Design Information
The
pile design information developed for
this study
includes ultimate
axial capacities,
axial load-
pile movement
data, and
lateral
soil
resistance-pile deflection (p-y)
characteristics.
The analytical methods
used to develop
this
information are
presented briefly
in
Section 2.5 and
in more detail in
Appendix
B.
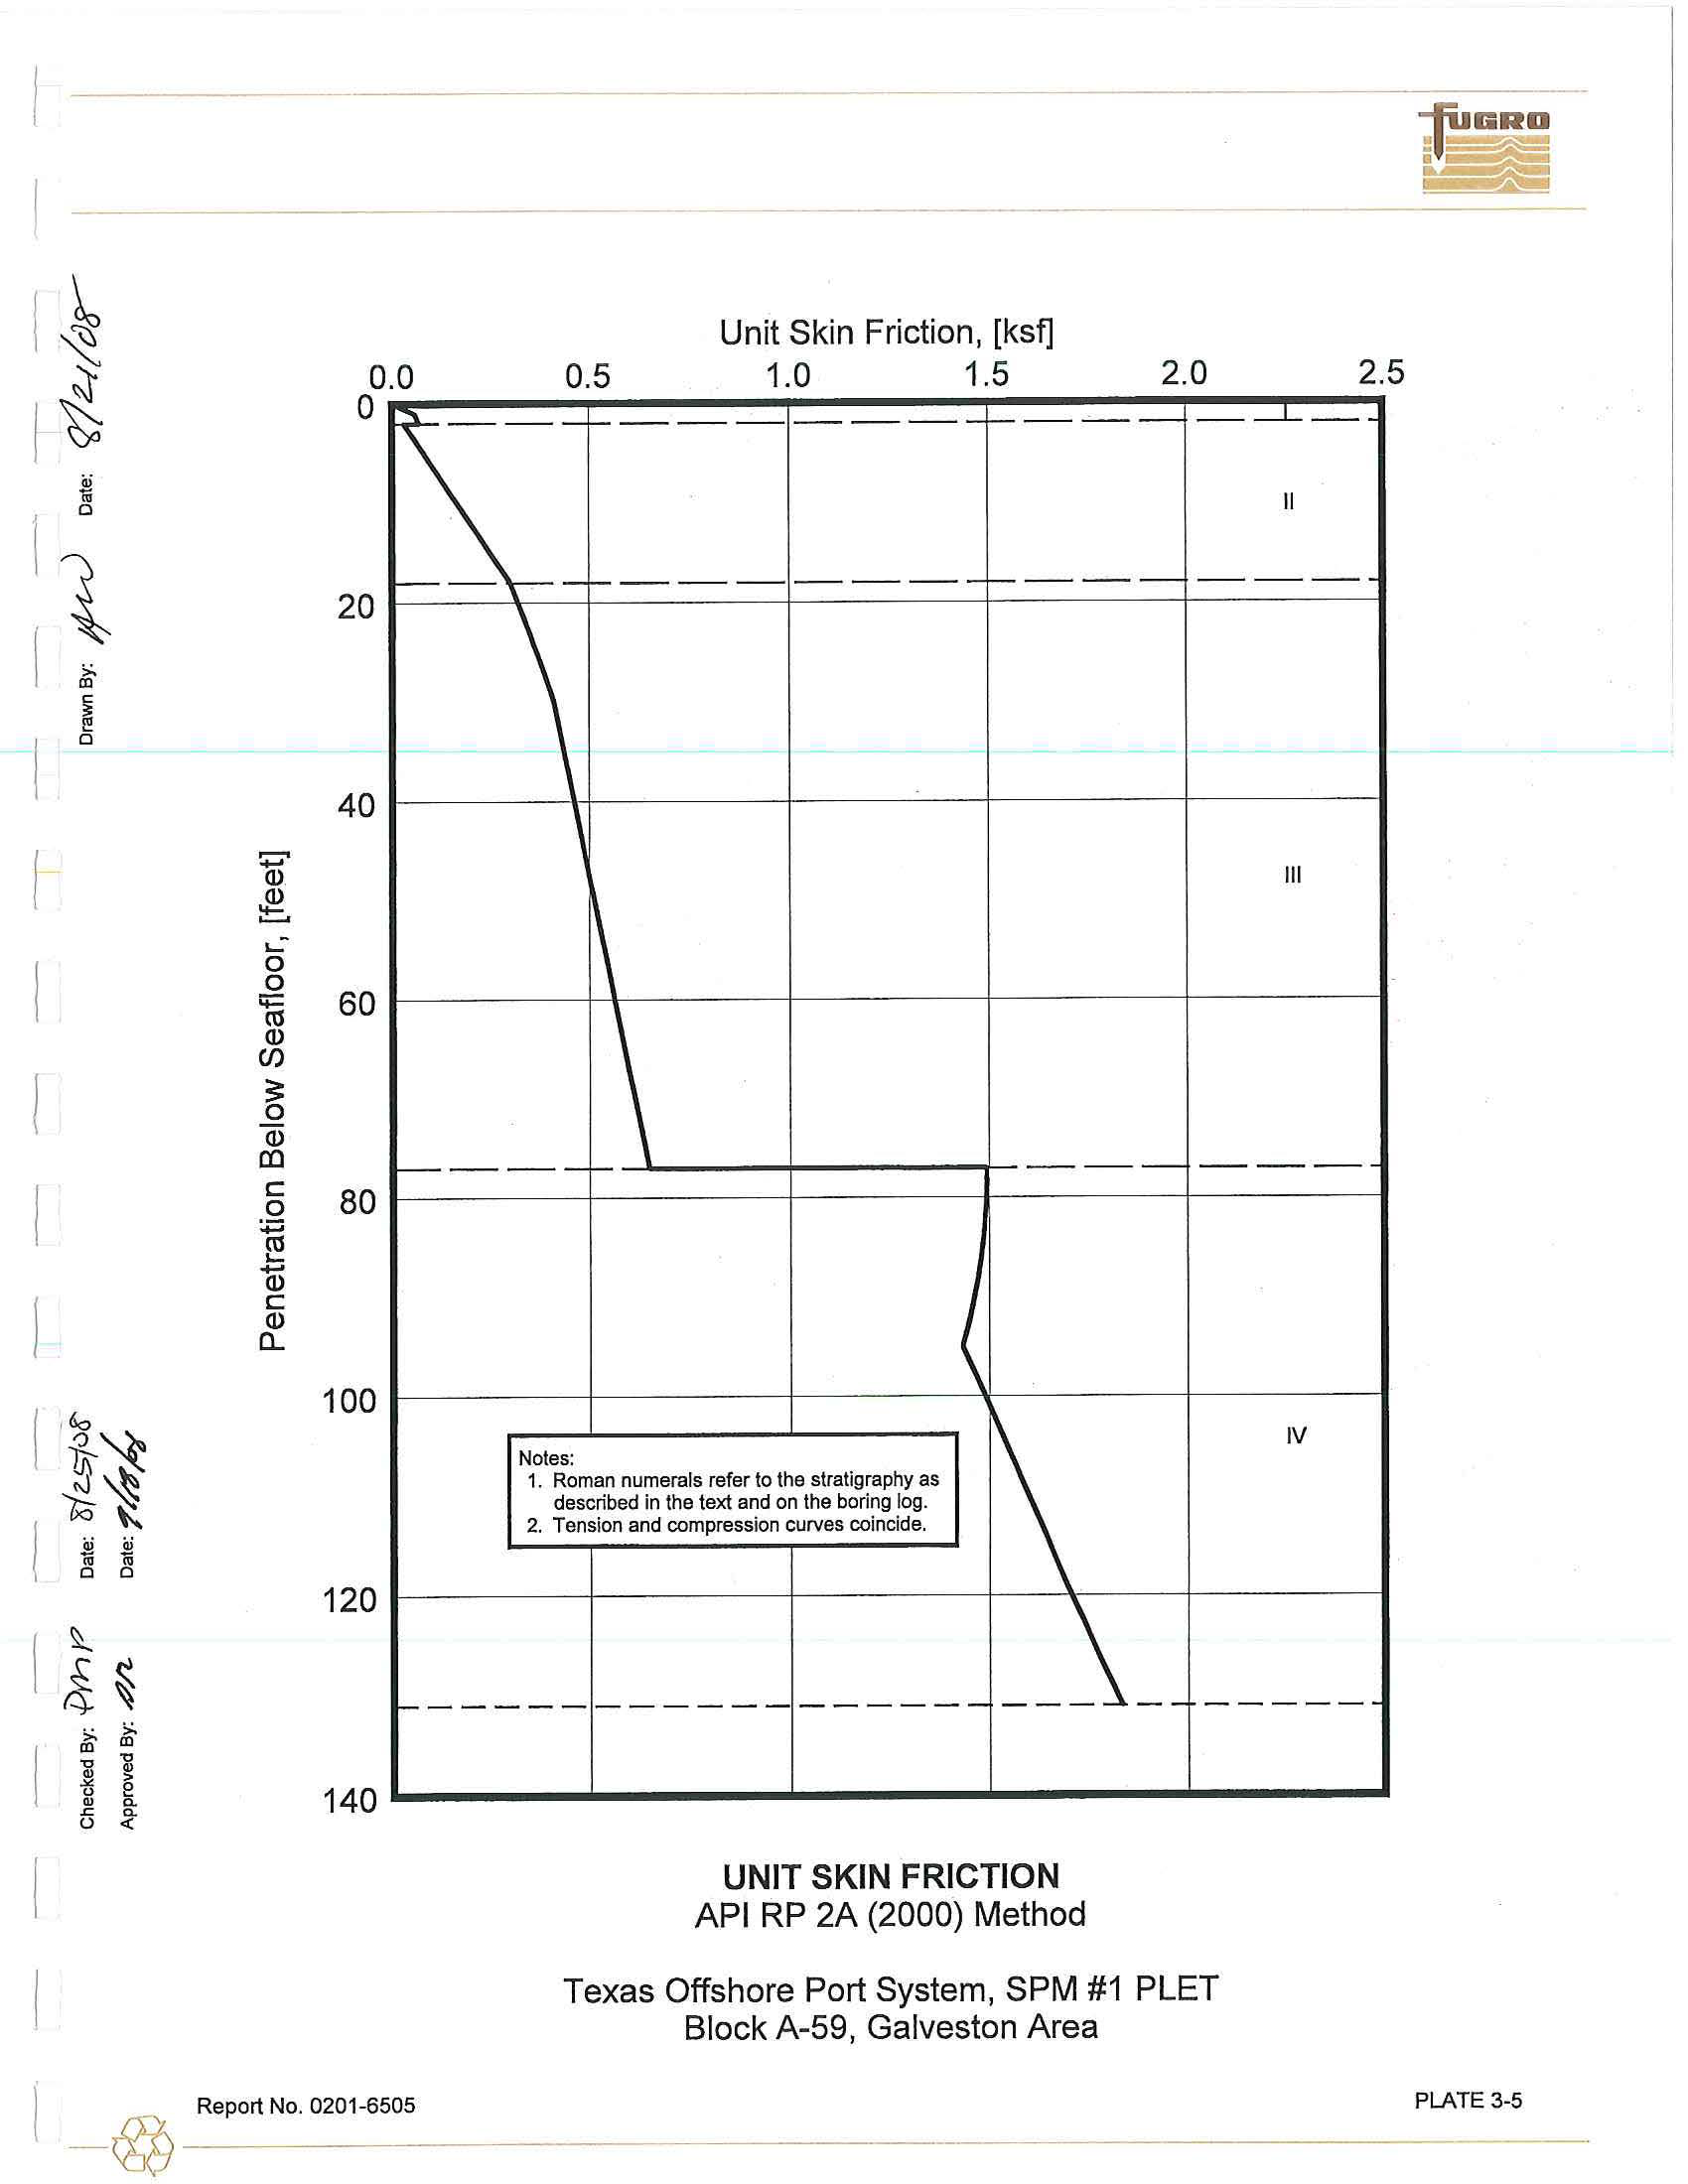
3.1.3.1 Axial Pile Design
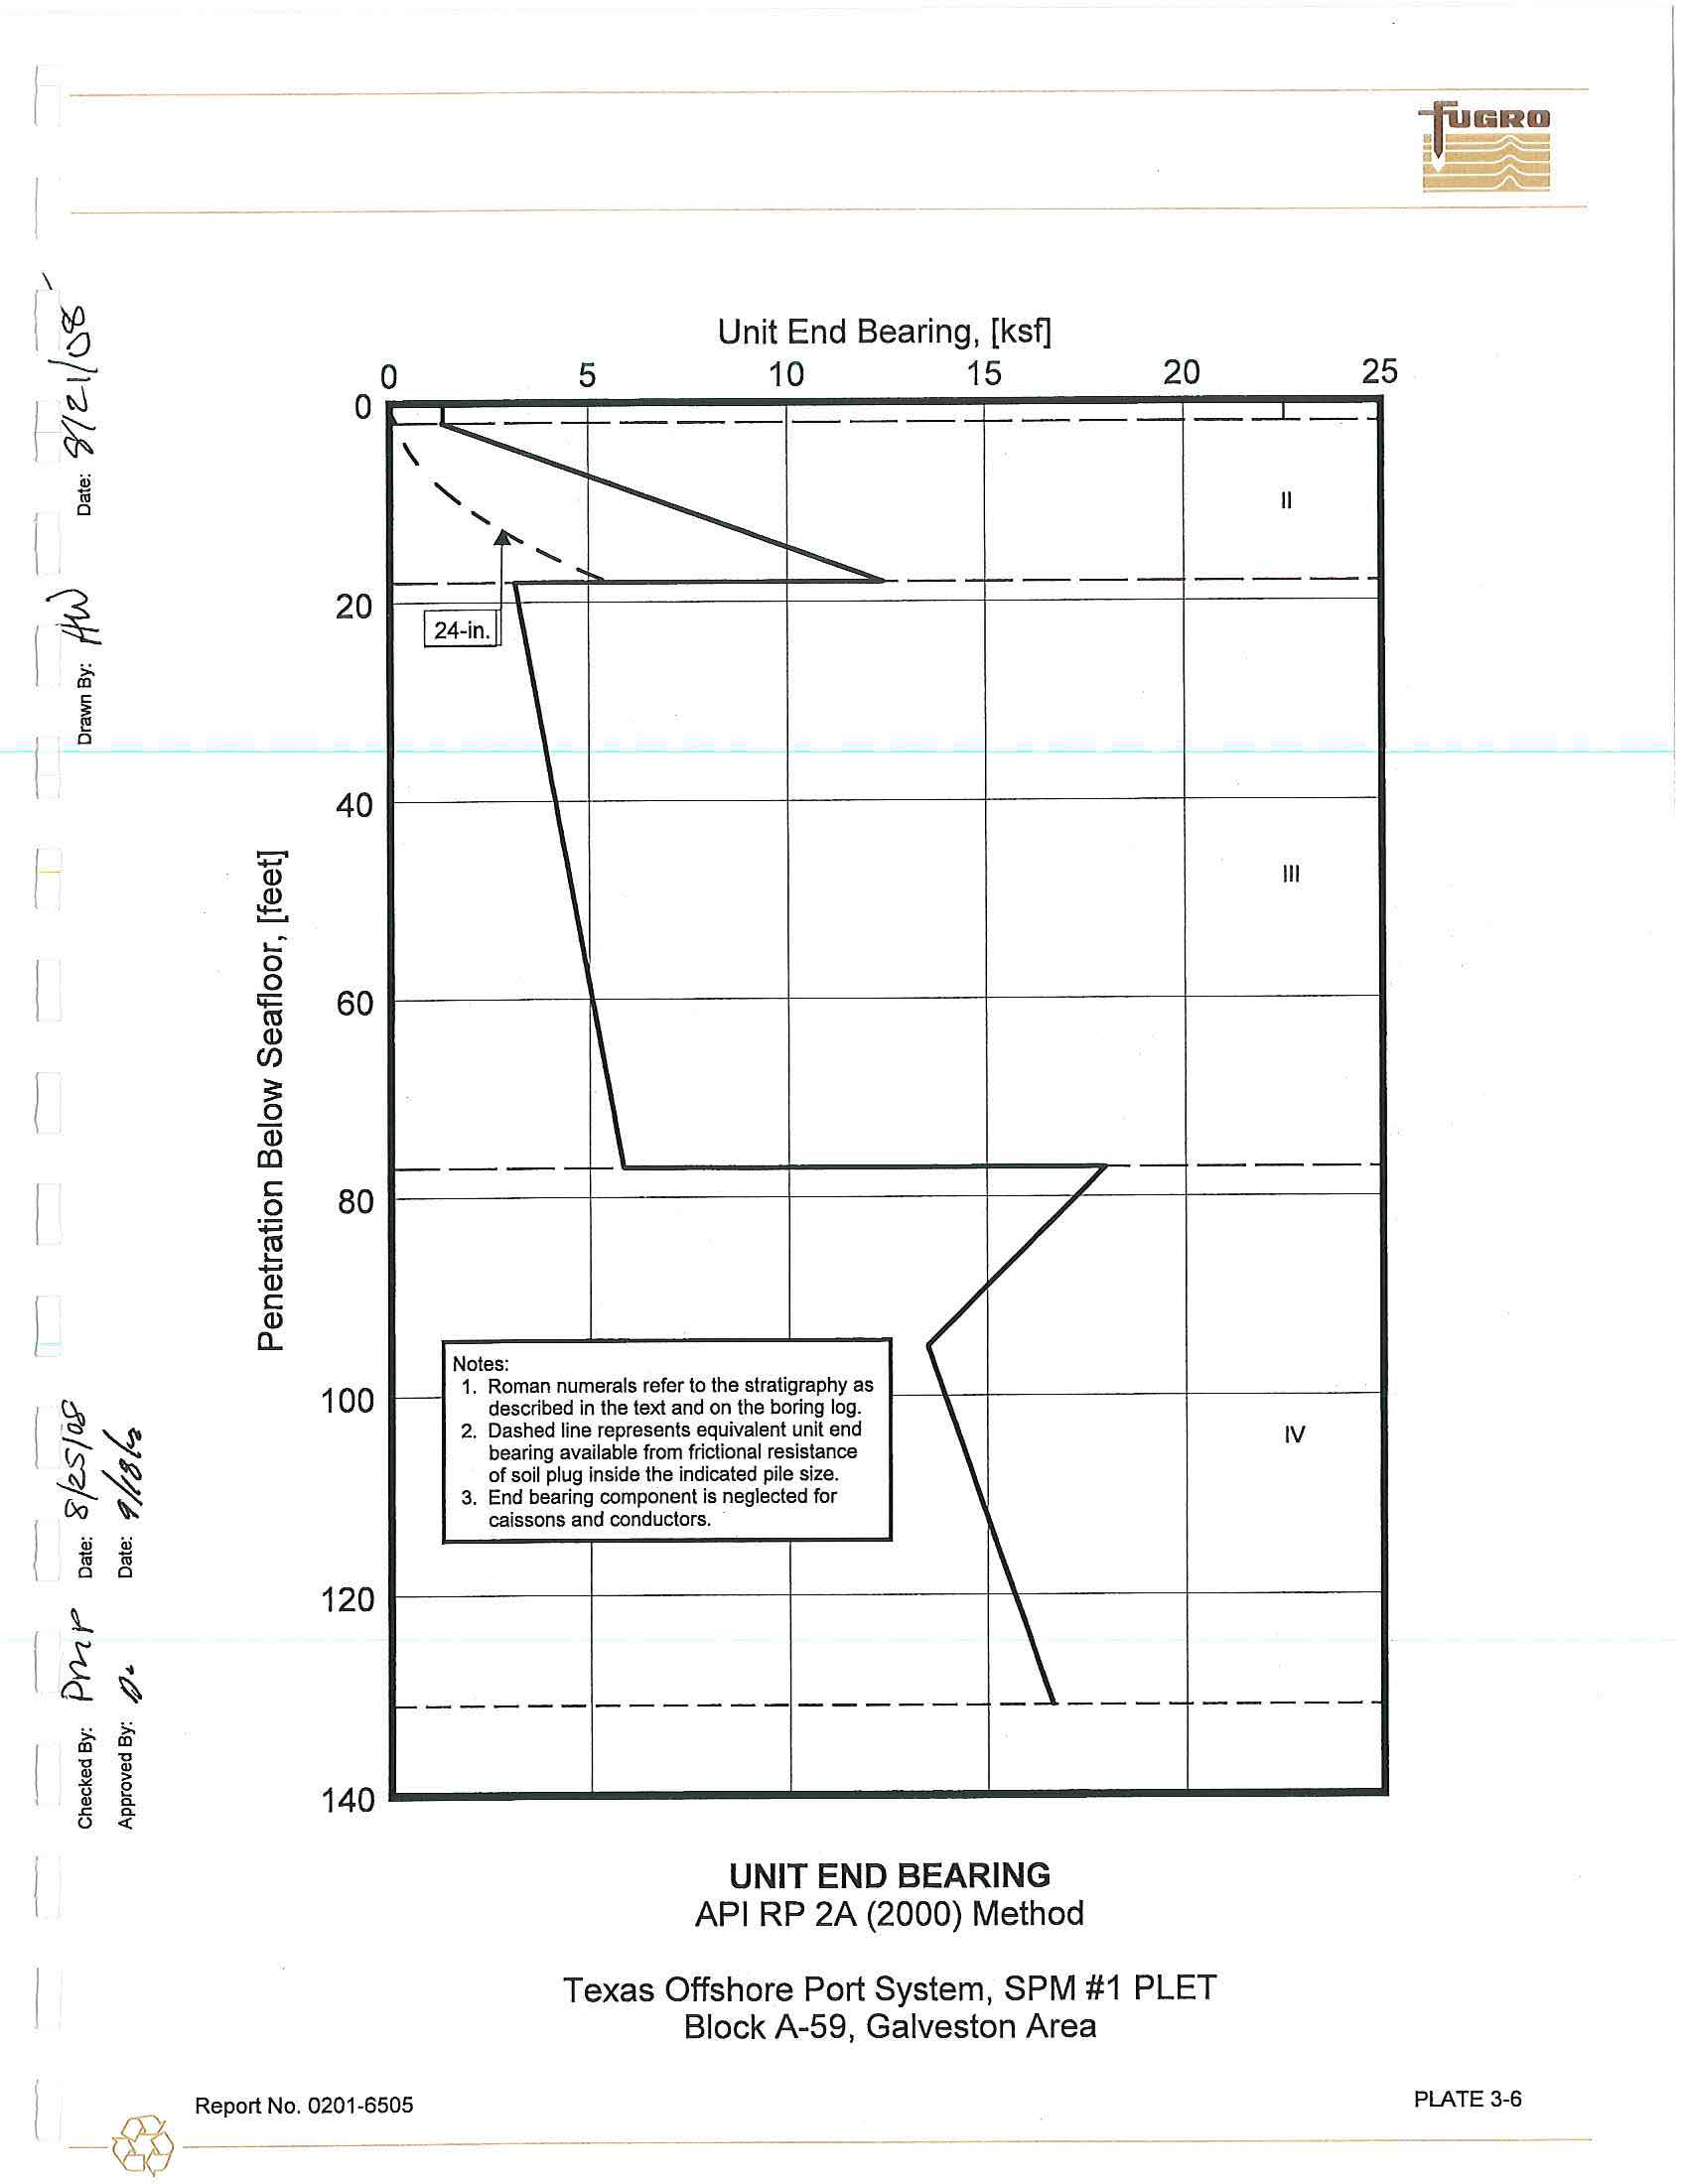
Ultimate Axial Capacity.
The unit
skin
friction
and
unit
end
bearing values plotted on Plates
3-5
and 3-6,
respectively
were calculated
using
the AP
I
RP
2A
methods described in
Appendix
B
.
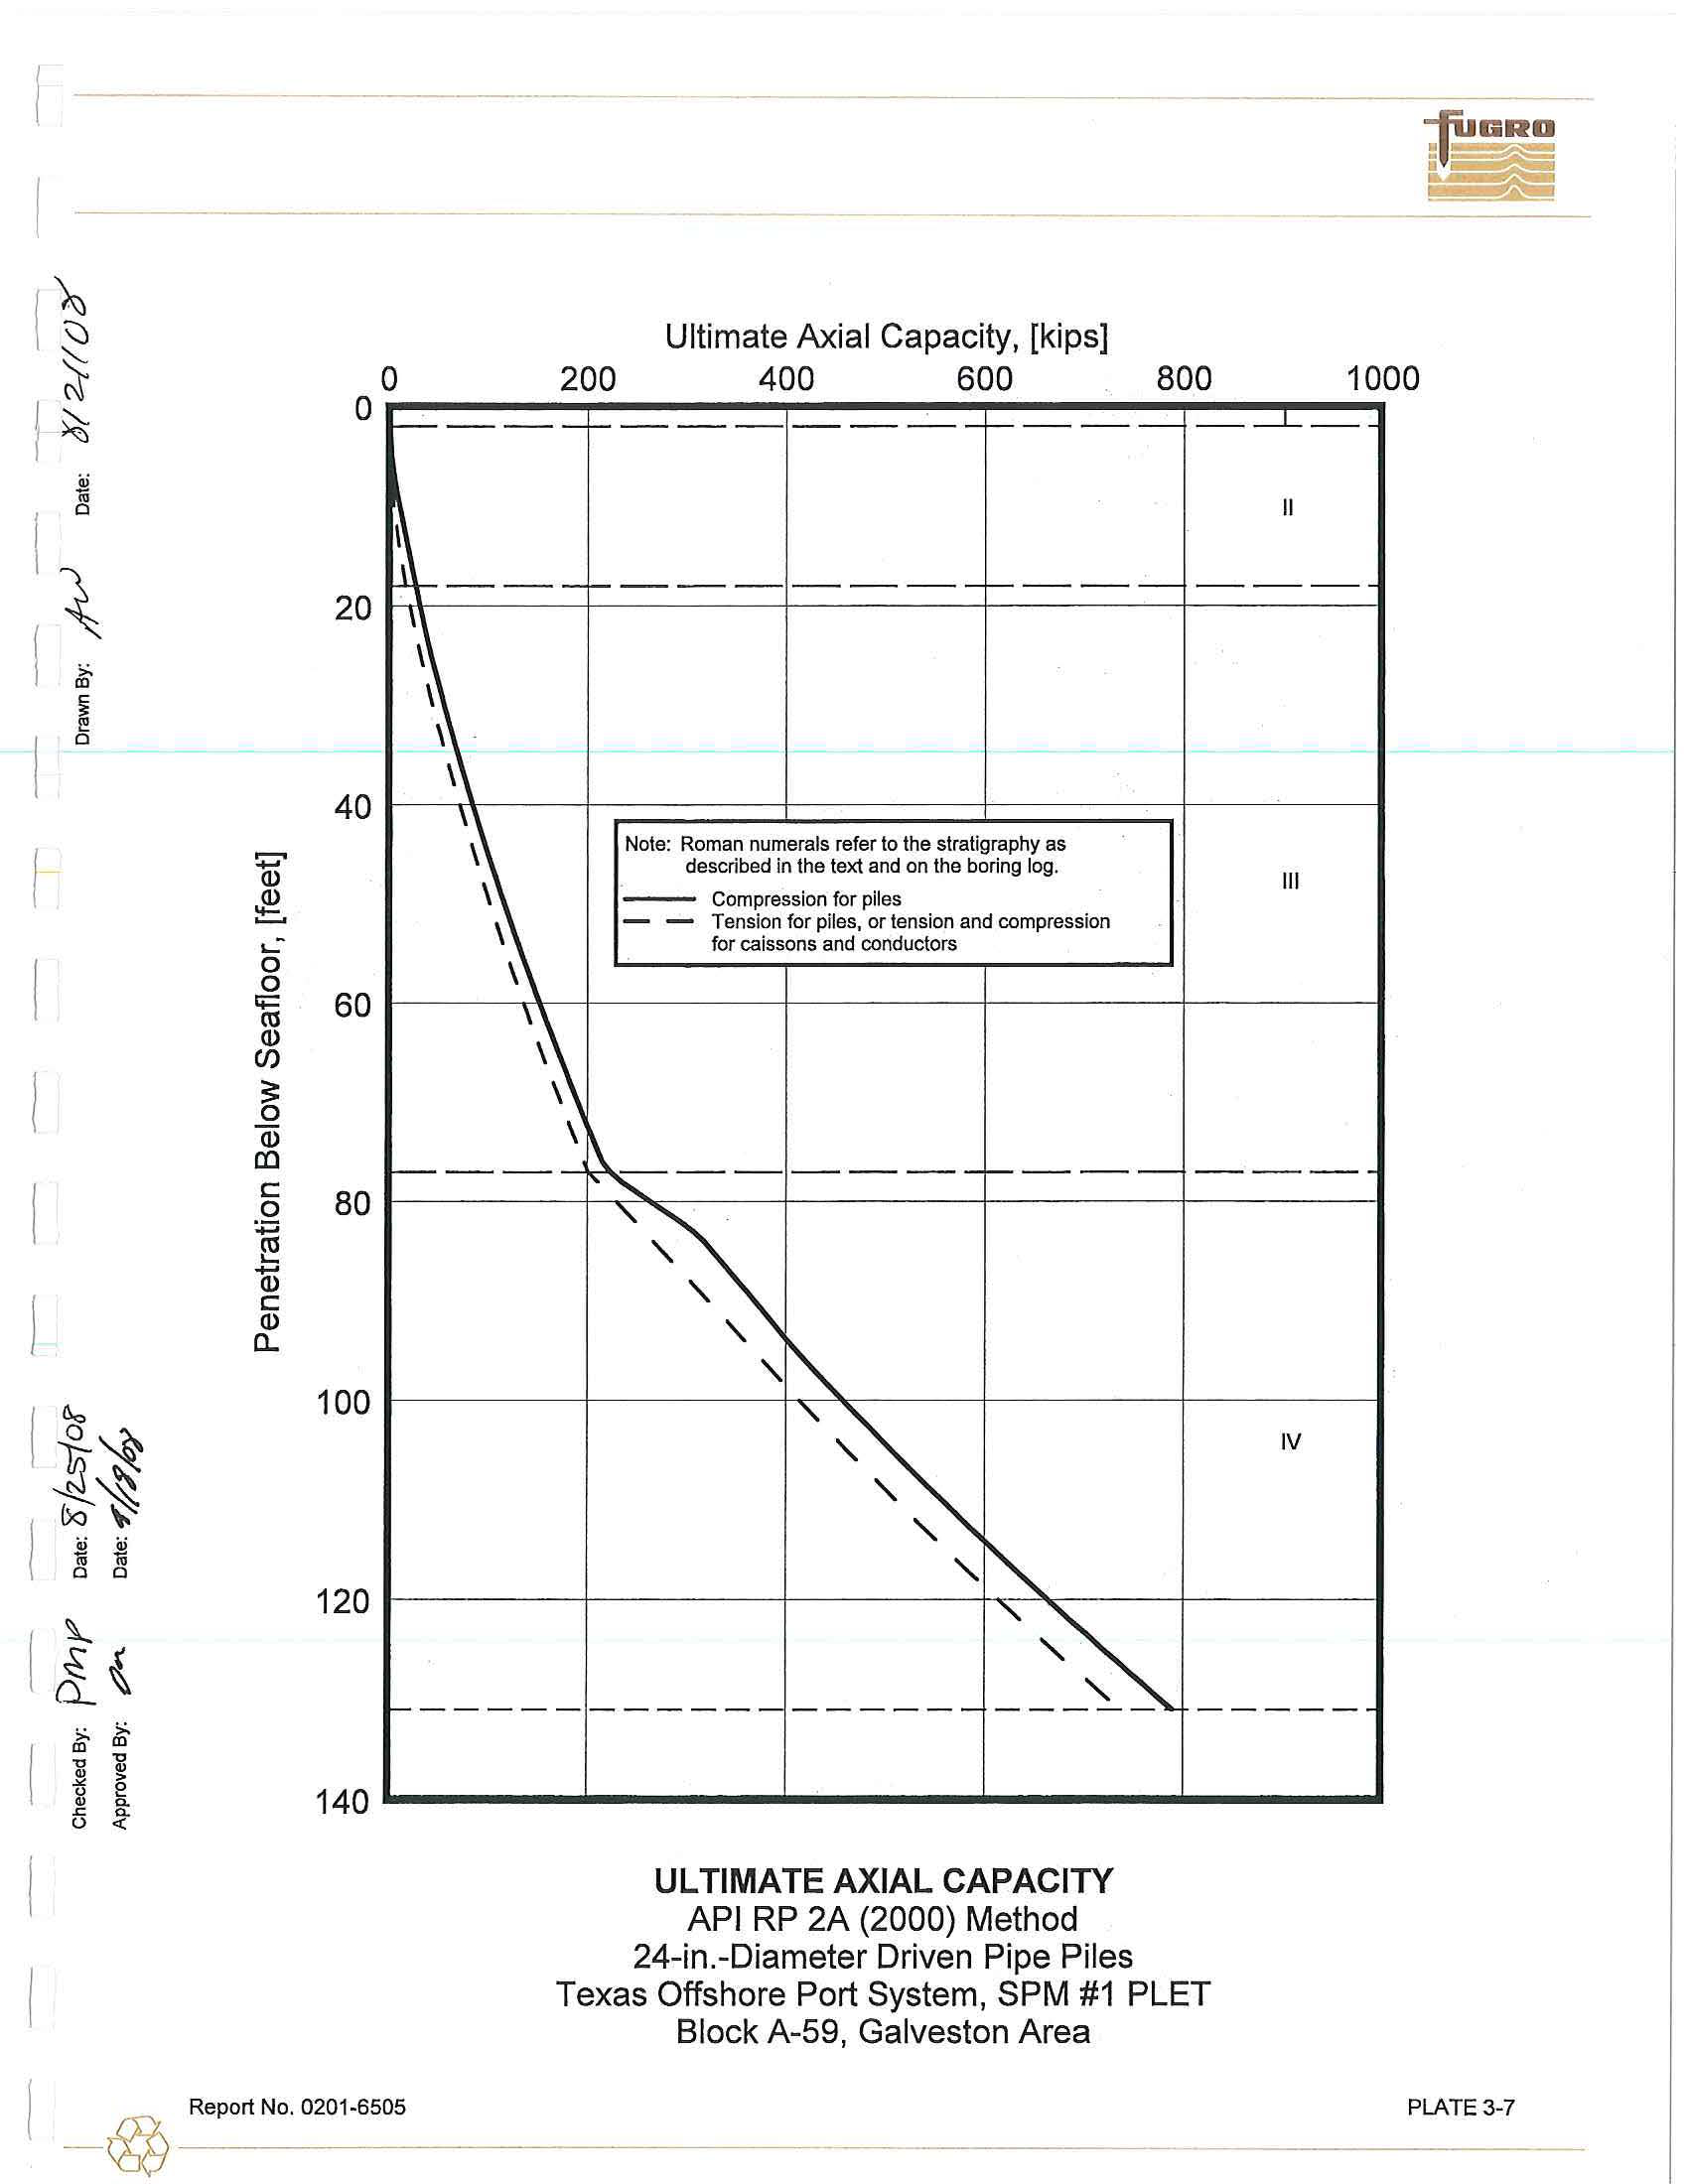
These
values
were used
to
calculate the
ultimate
axial compressive and
tensile capacities for
24-in.-diameter
pipe piles,
I
-@-
R
-
ep
_
o
_
rt
_
N
_
o.
_
0
_
20
_
1
_
-
6
_
s
_
os
3-1
-
1
driven
to
final penetration at
th
e
boring
l
ocation.
Axial
capacity curves for driven pipe piles (conductors,
caissons, anchor
and
foundation
pi
l
es) are presented on Plate 3-7.
AP
I
RP 2A
recommends that
pile penetrations be selected using appropriate
factors
of safety or
pi
l
e resistance factors.
These factors
are discussed
in
Section 2.5.1
of this
report.
.
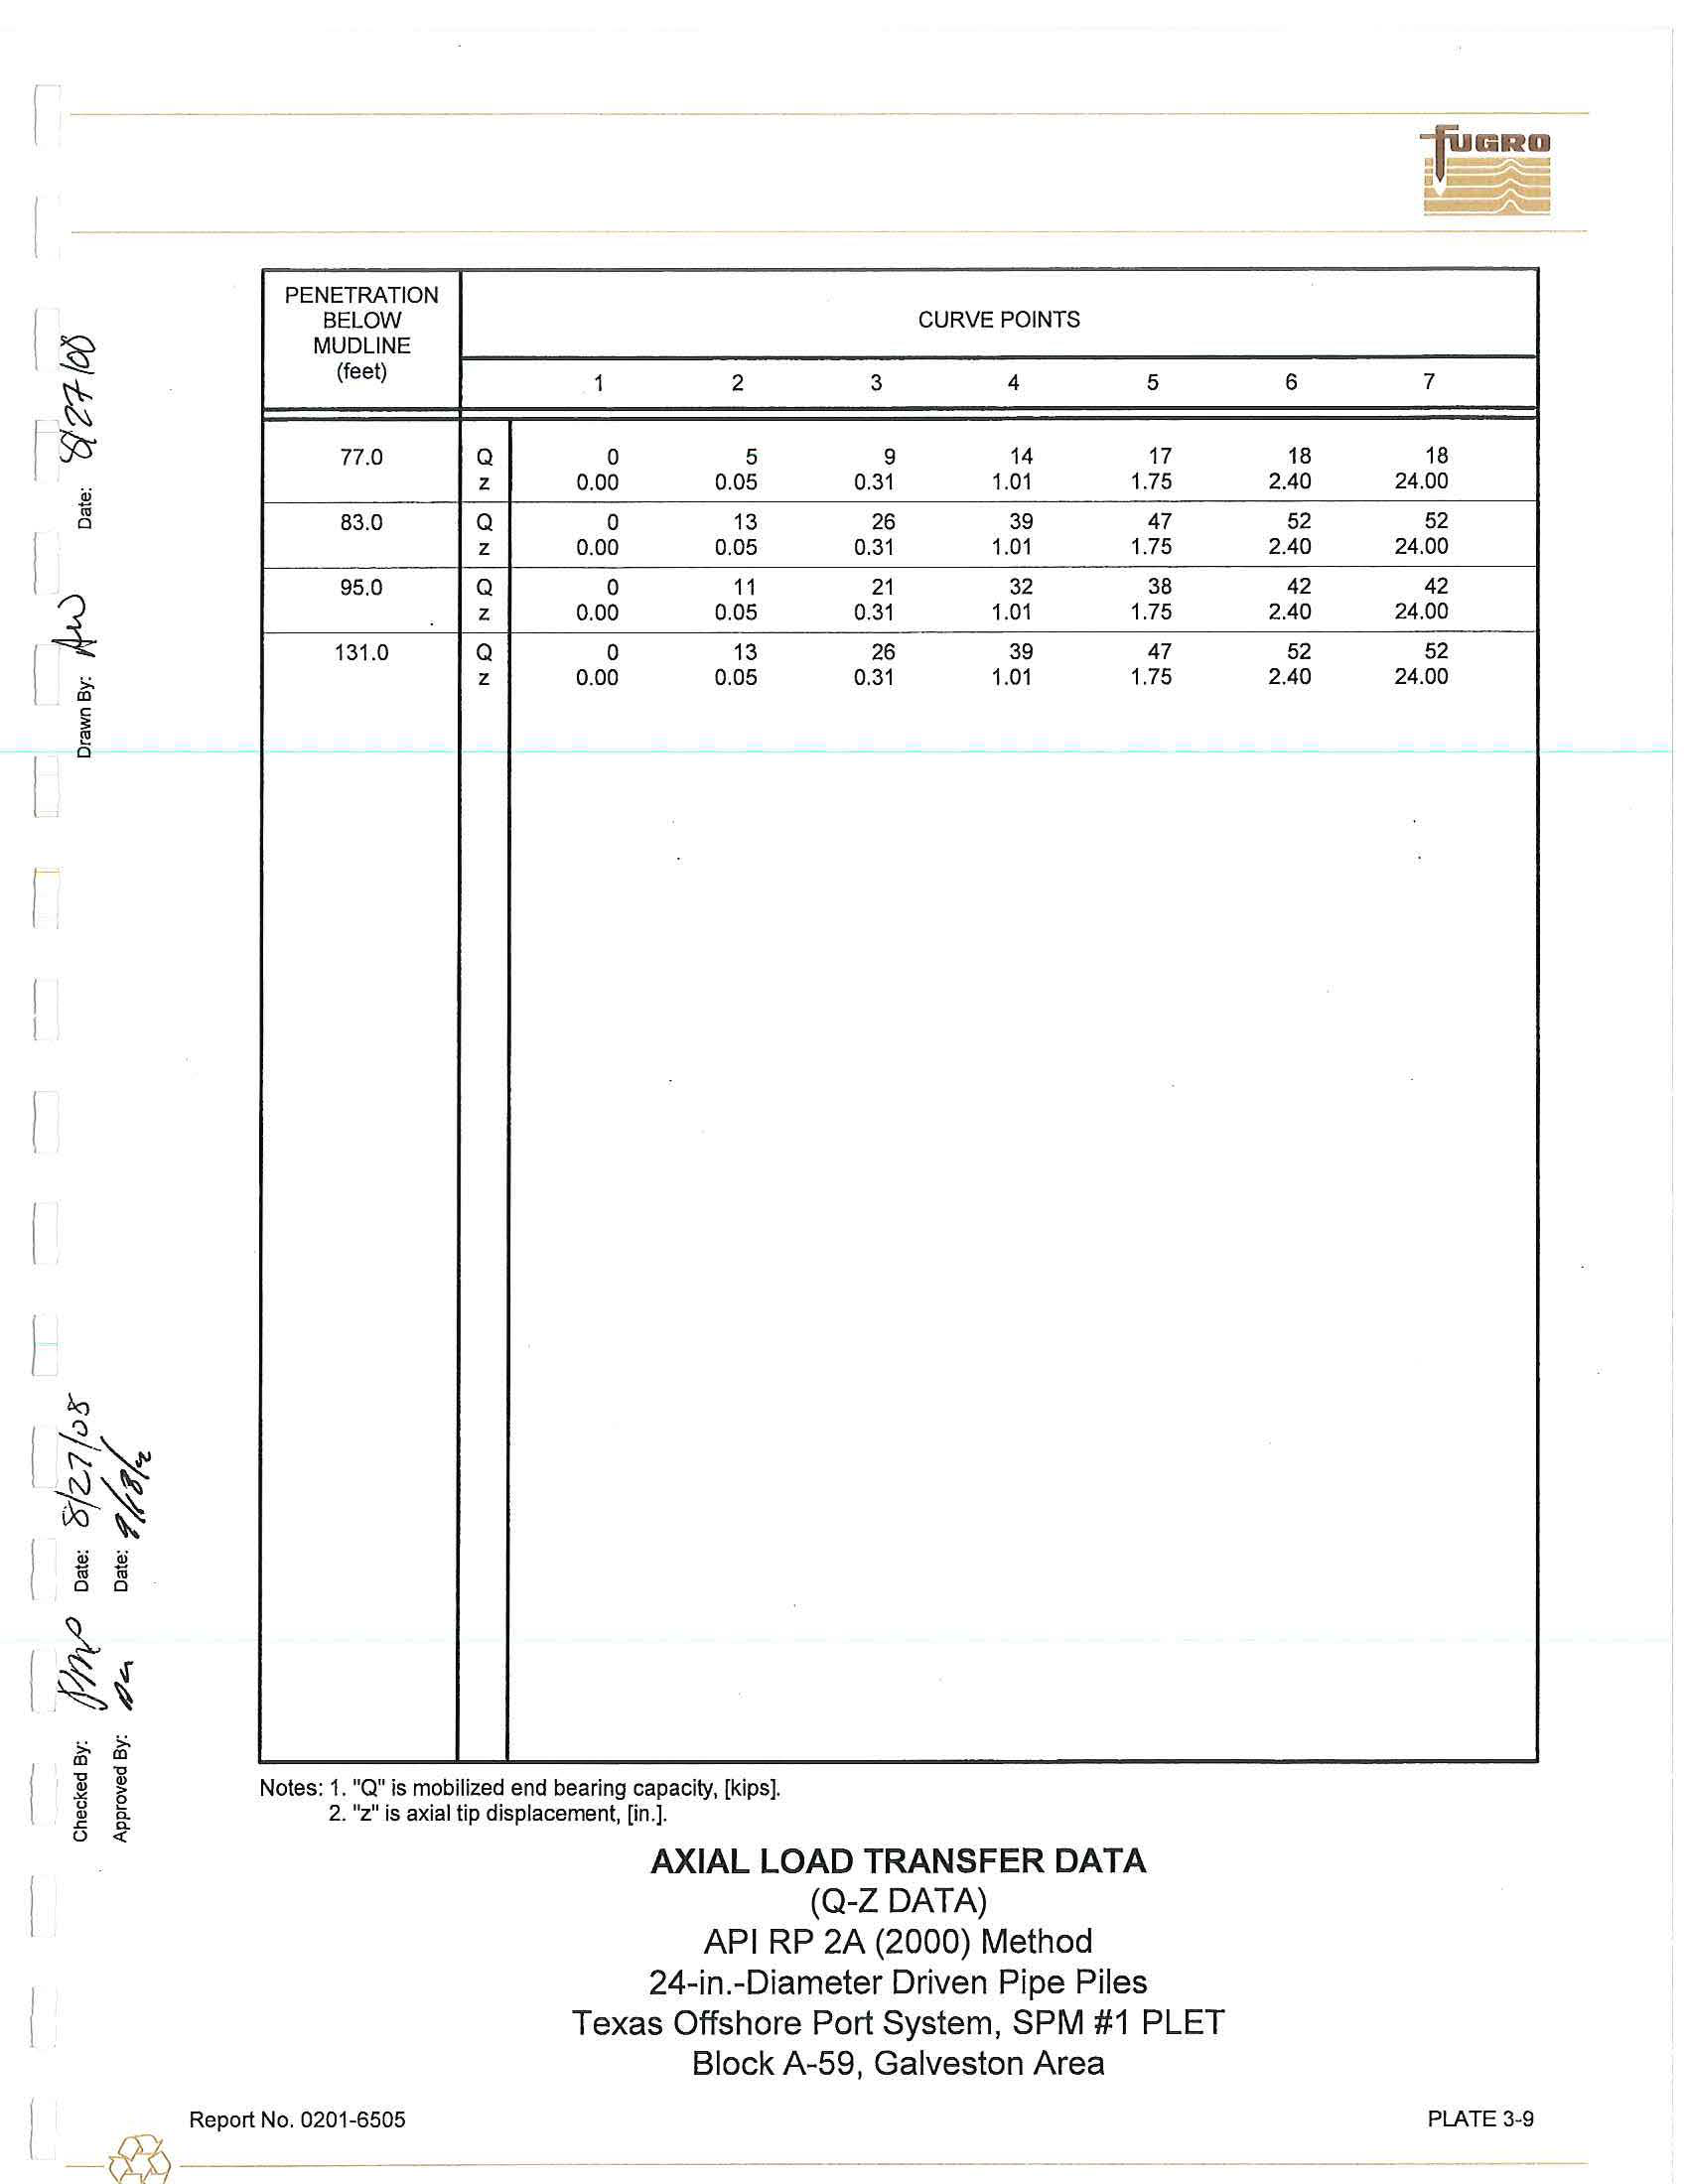
Axial
Load
Transfer Data.
Axial
load-pile
movement analyses are usually performed
using
a
computer solution based
on methods developed by Reese (1964) or Matlock, et
al.
(1976)
.
Plates
3-8 and
3-9 presents the results as side
load-side
movement (t-z) and
tip
l
oad-tip movement (Q-z)
data
for
24-in
.
-
diameter driven pipe piles, respectively.
The
presented Q-z data should be used for foundation piles and
neglected for caissons and conductor design
.
In
developing the axial
load transfer
data in the cohesive
soi
l
s, a post-peak adhesion rat
i
o of 0.90 was
utiliz
ed.
3
.1.
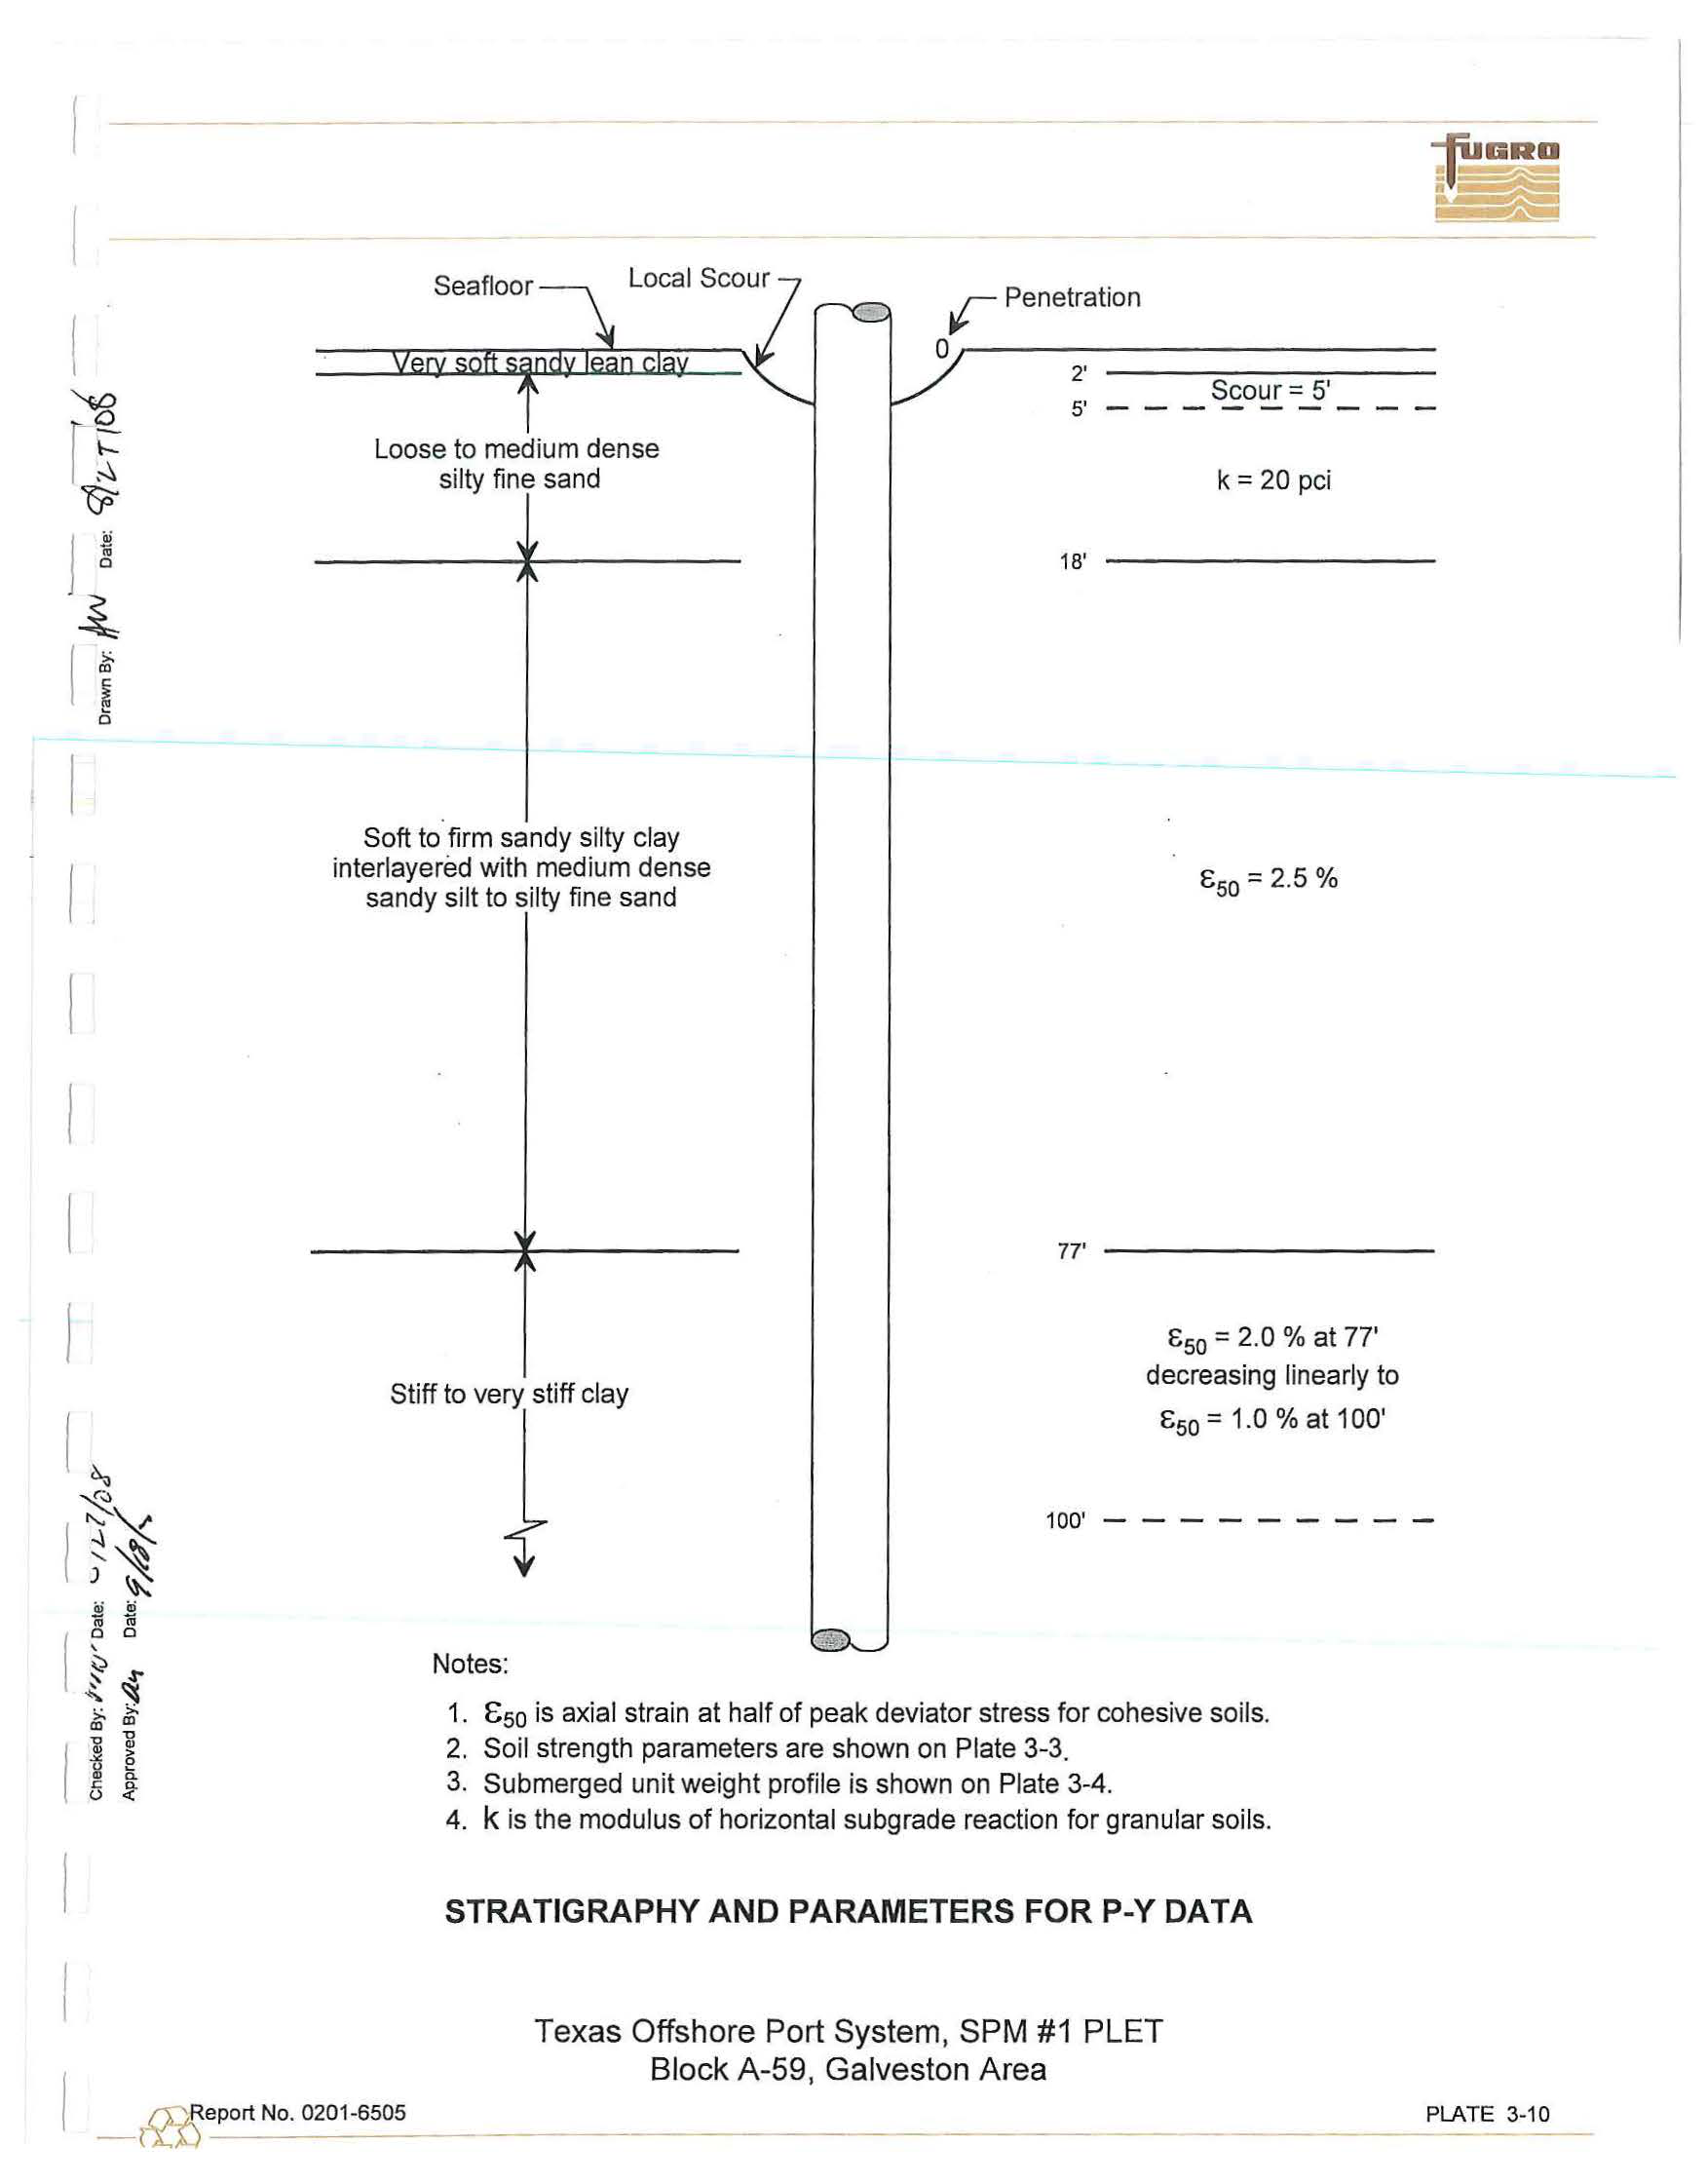
3.2 Lateral Pile Design Data
Th
e
soil resistance-pile
deflect
io
n
(p-y) characterist
i
cs of the soils at
th
e
boring location
were
developed for
individual
24-in
.
-diameter driven pipe piles. These data may be used
in lateral
l
oad analyses
of driven piles, conductors and caissons.
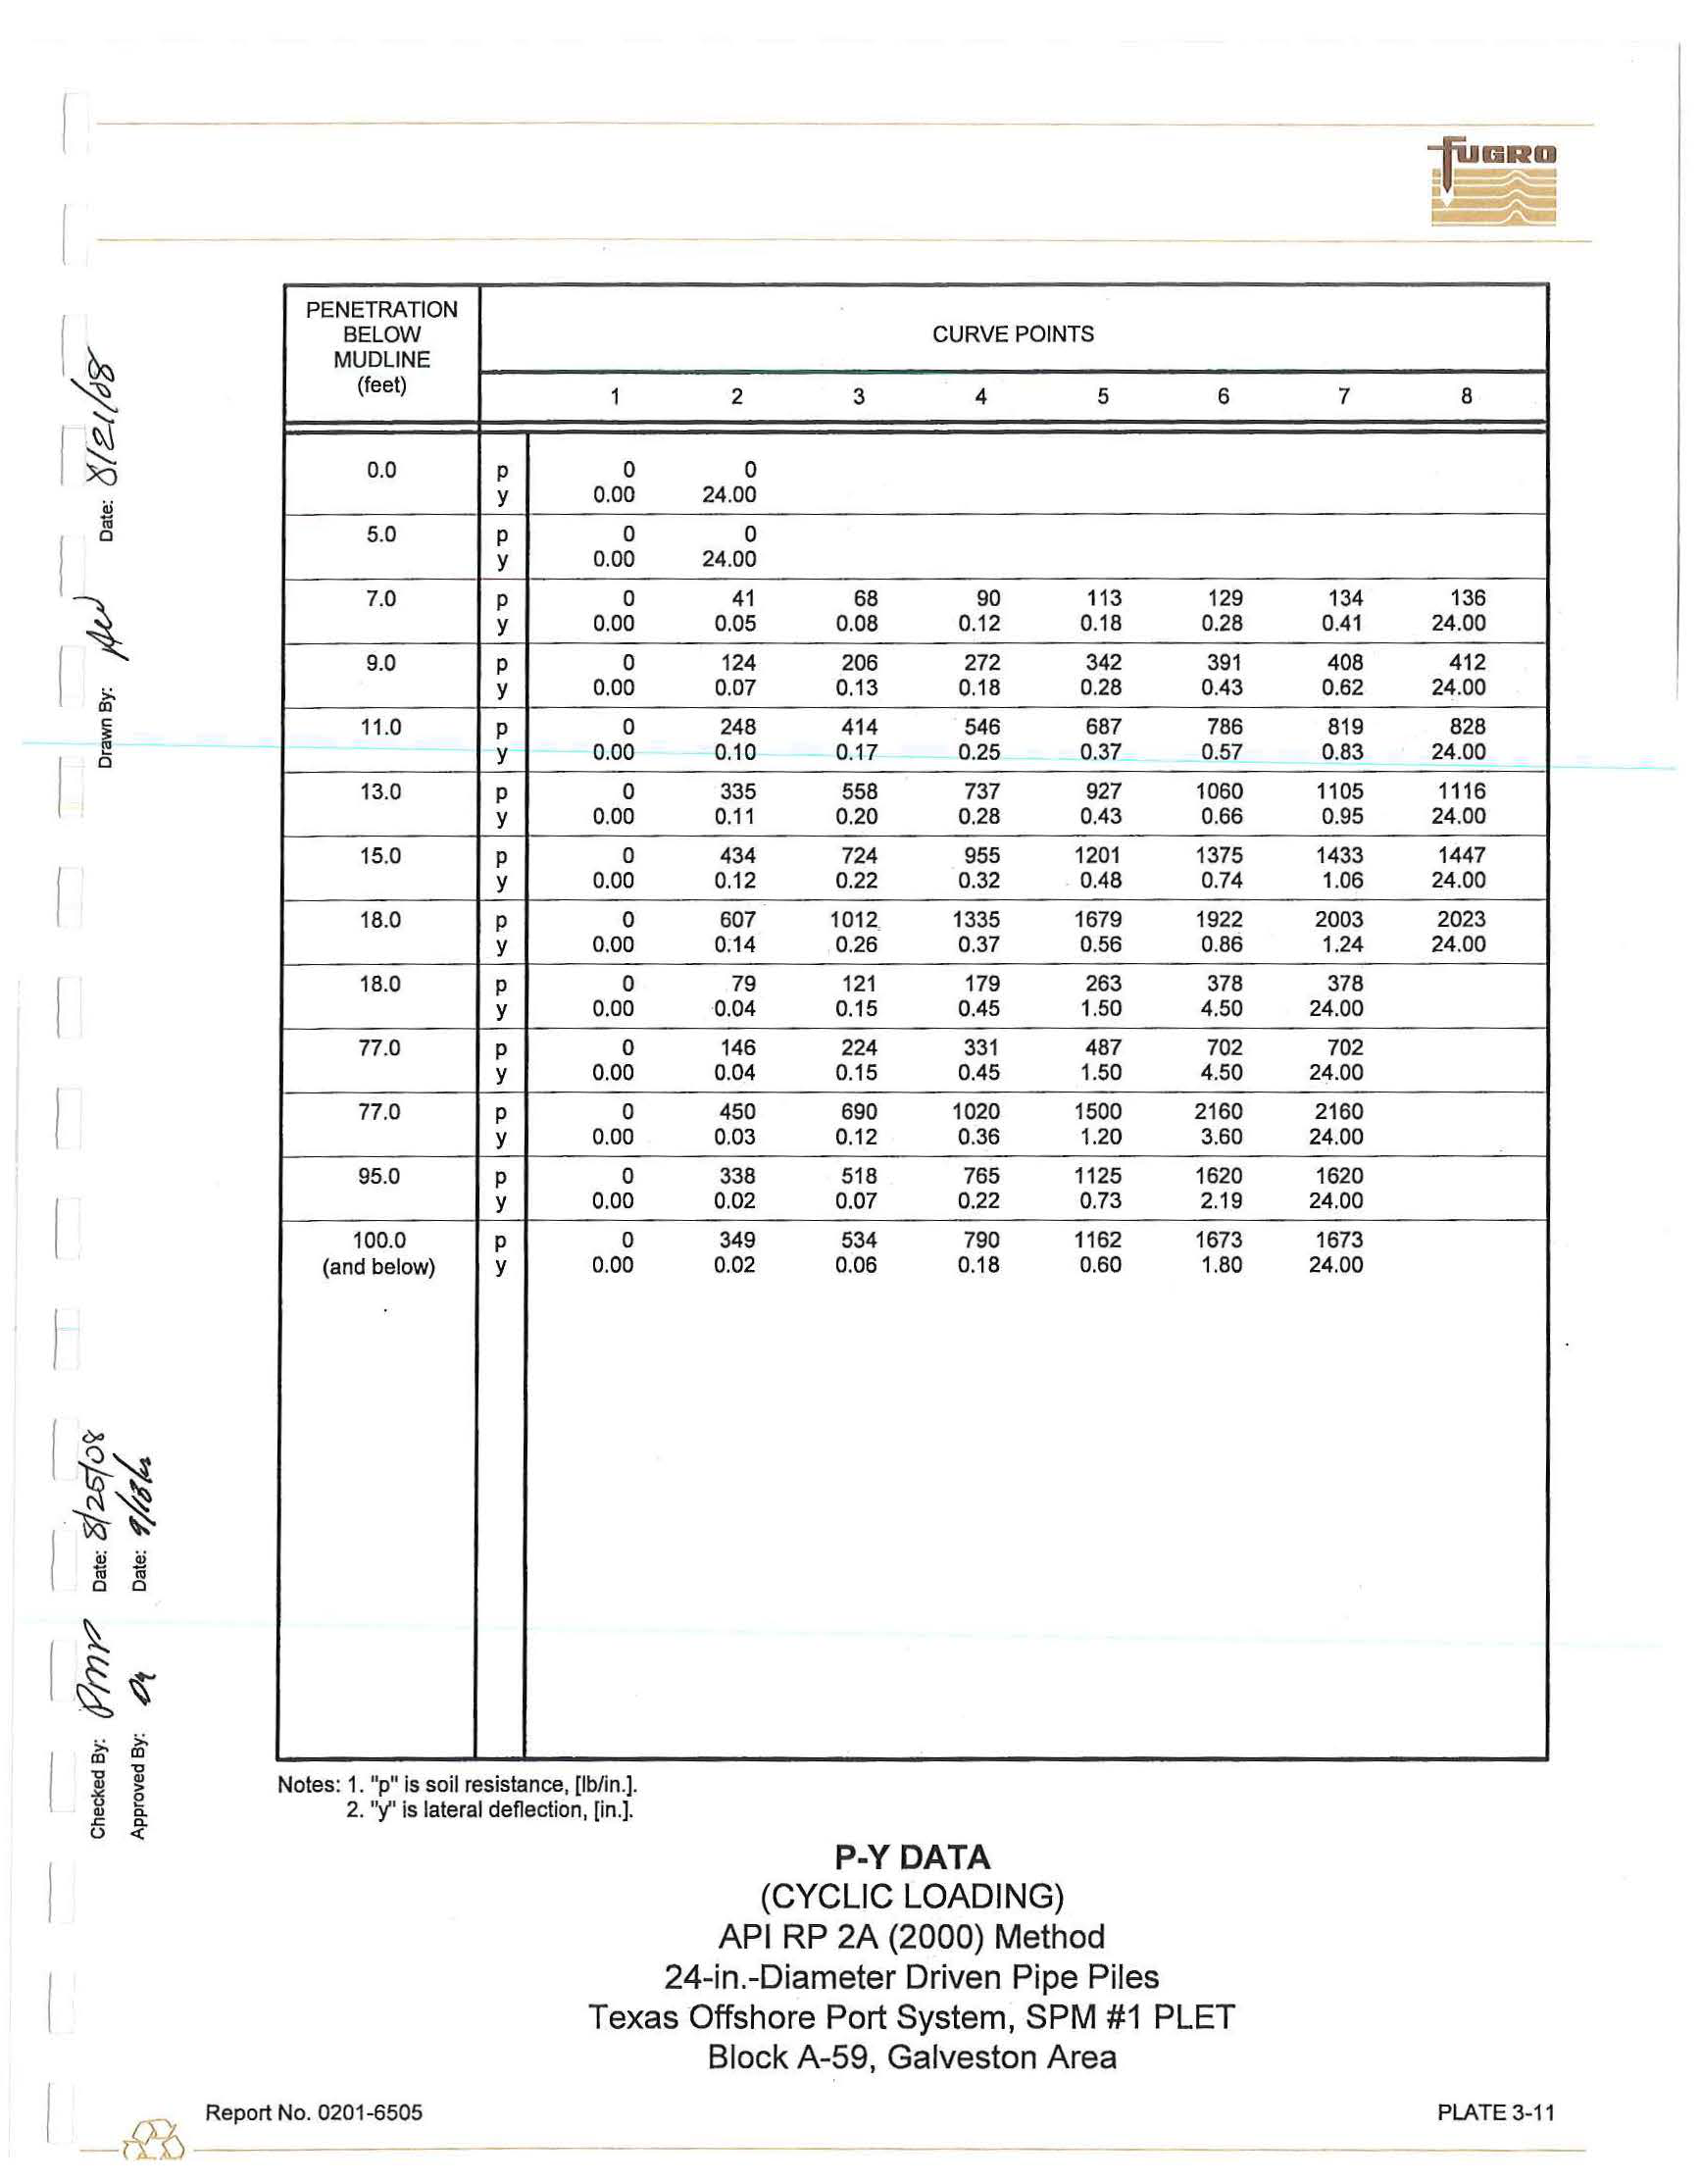
The
p-y data for cyclic
loading
were
developed to
100-ft
penetration using procedures that
h
ave
been outlined
in AP
I
RP 2A and briefly explained in Appendix B.
The stratigraphy and parameters used to develop the p-y data are presented on Plate 3
-
10.
The p
-y
data
for 24-in
.
-diameter driven pipe piles are presented
on P
l
a
te
3-
11.
P-y values presented at 100-ft penetration
may be
used
for lateral load analyses at greater depths.
3.1
.4
Seafloor
Bearing Capacity
Ultimate bearing capacity equations for
th
e
near-surface
soi
l
s were taken from a design method
deve
l
oped by Skempton (1951) and
Brown
and Meyerhof (1969) based on undisturbed
shea
r
strength.
The
follow
i
ng equations
can be
used to
determine
the
u
l
timate bearing capacity for
horizontal
tubular members
and
mud
mats resting
on
the
seafloor:
qu
=
770
for tubular members,
qu
=
770
for mud mats for B
:::;
3, and
qu
=
(770 + 9B)(1 + 0.2 B/L)
for mud mats for 3
<
B
:::;
50 ft
where:
qu
=
ultimate
bearing capacity, psf;
B
=
w
id
th of mud mat, ft; and
L
=
length of
mud
mat, ft.
For
horizontal tubular members penetrating
less
than one
radius,
the projected area at
the mudline
should be used
to
calculate the ultimate bearing capacity of the
members.
For members penetrating one
radius
or
more, the diameter
should be used. For
triangular-shaped
mud
mats,
B should be taken as 75
percent of the
l
east a
l
titude and
L
should
be taken as the
longest
side.
API RP
2A
recommends that appropriate
factors
of safety be applied
to
the capacity values.
These
factors
are discussed
in Section 2.6
.1
I
-
@
Report No
.
0201-6
_
5
_
05
____
3-2
.;hecke~ ~,.
Da...
By:
Jiit(!.
-
I
Approved By:
Date:
@
X
=
3,258,640'
IDENTIFICATION
TESTS,[
%
)
Y= 236,466'
BLOW
20
40
60
80
UND
R
A
I
NED
SHEAR
STRENGTH
:;o
(D
"O
COUNT
I
•
T
(ksf)
Texas South
Central Zone
Coordinates
SUBMERGED
UNIT WEIGHT,
(kcl]
0
~
0
z
p
0
N
~
I
~
10
S
E
AFLOOR AT
EL. -
123'
0.03
0
.
04
0
.05
0.06
0.5
1.0
1.5
2.0
I
~
•
VE
RY
SOFT
GRAY
SANDY LEAN CLAY 12.01
WOH
.
-
-
...
nO
i....
LOOSE TO MEDIUM DENSE GRAY
SI
LTY
FINE
SAND
10
J
• •
20
••
0
-II-
10
•
•
0
0
10
5
••
0
10
118.0'l
•
0
20
...
SOFT
TO FIRM
GRAY SANDY SIL
TY
CLAY
10
..
s--.
-
INTERLAYERED
-
WITH MEDIUM DENSE
-
-
=
20
SANDY
SILT
TO
SILTY FINE SAND
P
U
SH
••
0
+
•
I
Note
:
I
10
--
n
f-
See
-
~
PLATE
3-1b for
detailed
soil
~
~
stratigraphy
to
40-ft
penetratio
n.
10
f--+
..
•
0
30
30
10
--
•
-
r,
n b
A
+..........
-
-
-
v
40
-
40
-with
a
few
clay pockets and shell fragments at 44'
10
•
•
0
Ill
-with olive
gray
bands at 49'
PU
SH
.-
-
-
0
A
It
~
-
-
-
~
v
~
50
-
50
-with
few shell fragments at 54'
20
•
0
f
-greenish
.
gray,
58'
to
66'
20
-
nn
~
-
-mottled
with
brown
ish
yellow, with
sand pockets,
-
A
A
~
...
.~
partin
gs,
and
seams, and
claystones
at
59'
-
-
~
60
"'
60
..
..
..
10
+
••
•
OD
f.
0
J+
+
-
~
70
-
70
....
-with a few clay
pocket
s
and pockets
of organic
PUSH
••
matter at 74'
177.0'l
•
~jlo
+
•
(
4.1
.
75.5)&~
STIFF
TO
VERY STIFF
GRAY
CLAY
80
>---
80
p
(I)
~
I
(3
.
, 85.0)
©--:;!!
-lean, mottled with
olive
gray, with
many calcareous
PUSH
+--
_!,.__
ft-
DO
• .c,. +
.....
nodu
les
at
85'
(,
86.0) ®-"?
p
(I)
~
0
..:
90
0
i:;::
(I)
co
CJ)
-
I
-
with
a few
silt
pockets, 94'
to 106'
PUSH
!
419
[I][
.c,.
.....
:
•
90
L..
-
0
0
i:;::
co
(I)
Cf)
0
3
100
-
100
3
0
(I)
CD
c:
0
:.::;
co
--
L..
110
(I)
c:
(I)
a..
IV
I
PUS
H
;------
~
--
..llil
A
0
'
...
--
-t
•
-
I
PUSH
11£1
++
(.
® ...
(I)
CD
c:
0
:;::;
110
-
L..
co
(I)
c:
(I)
a..
120
-
120
I
-
brown,
mottled with
gray
,
with
a
few
silt pockets
and partings,
124'
to 131'
PUSH
-lean
+-
,
with
gas
blisters and a few
calca
reou
s
-
--'-
-
-+
an
.c,.
® ..~
*
I
nodules at
125'
-
-with a few silt seams
at 13
0'
_ __
___(J:u,Q'.J._
PU
S
H
- -
I--
..--
CL.I
-
_
-
+-
'--F-
--
---
---
~-
,____
__
---
130
130
140
>---
140
'
150
>---
150
160
-
160
170
-
170
180
-
180
.
190
-
190
200
SAMPLING TECHNIQUES
CLASS
I
F
I
CATION
TESTS
STRENGTH TESTS
200
Number of
blows
of a
1
75-
l
b
weight (hammer) dropped approximately 5
ft to produce
a
T
SOLUBIUlY
IN HCL
,
[%]
® POCKE
T
PENETROME
TE
R
(P
P
)
maximum
of
24
In
.
of
penetration of a 2.25~n.-OD, 2.125-in
.
-lD
thin-walled
tube
•
PERCEN
T
PA
SSING
-
200
SIE
V
E
.
[%]
$
TO
RV
ANE
(TV)
sampler
.
"
PUSH"
denotes a
3
.00-i
n.-OD, 2
.8
3-in
.-
lD
thin-walled
tube
san:ip
l
erwas
•
WATER CONTENT
0N),
[%
)
<I>
REMO
T
E
VANE
(RV)
advanced 24
in.
with the weight
of
the
d
rill
string.
"WOH"
d
eno
tes
a 2
.
50-in
.
-OD.
0
SUBMERGED UNIT
WEIGHT
(
SU
W)
+ MINIATURE VANE
(
MV)
(~ RES
I
DU
A
L
(MVres)
VALUE)
2.125
-in.
-lD liner
sampler was advanced 24
in.
with
the
weight of the hammer
.
A UNCONSOLIDATED UNDRA
I
NED
TR
IAXIAL (UU)
PLASTIC
LIMI
T
(PL)
LI
QUID LIMIT
(
LL)
+----------------------+
(Open
symbols
in
d
i
cate
r
emolde
d
(r)
te
st
s)
LOG OF
BOR
IN
G AND
TEST
RESULTS
Texas Offshore
Port
System, SPM #1 PLET
Block A-59, Galveston Area
I
-
--
1\,1,"\
___
-
~
"-
r,il./
_
hec
k
ec
.
'l
vv
.
Dat,
-
1
p.
'1#1
--
3y
:
-n
--
./
I
--
J
/l'lr
~
Approved
By:
~
Date:
@
X = 3,258,640'
IDENTIFICATION
TESTS,[%]
Y = 236,466
'
B
L
OW
20
40
60
80
UNDRAINED SHEAR STRENG
T
H
COUNT
[ks!]
Texas South Central
Zo
n
e
Coordinates
SUBMERGED UNIT WEIGHT, [kc!]
;u
CD
0
"'C
0
;:i.
z
!='
SEAFLOOR AT
EL
-
123'
0.03
0
.
04
0.05
0.06
0.2
0.4
0.6
0.8
I
~J
V
E
RY
SOFT GRAY SANDY
LEAN
CLAY
WOH
DD
-wtih manv shell
fraoments
(2
.
0'\
......
-
--
...........
LOOSE
TO MEDIUM D
E
NS
E
GRAY SIL
TY
0
0
f\.)
.....
0
O')
5
0,
F
I
NE
SAND
-
w
i
th a few shell f
r
agments
t
o 11'
10
-
-w
i
th a few mica
to
8'
-
-
-
5
0
0,
-
with a few silt seams at
7'
20
I
••
D
10
-II-
-with
a few pockets of organic matter at 1O'
10
10
•
•
D
~
Q)
~
-with clay
pockets
and shell
fragments below 12
'
5
I
••
D
:;:;'
(I)
~
....
-
0
15
c;:::
0
(ti
Q)
Cl)
3
0
20
(I)
co
c
0
:;:::;
cc
2
5
.....
-
(I)
c:
(I)
a..
-
10
'
•
D
118
.
0
'
\
-
...
..
SOFT
TO FIRM GRAY
SANDY SILTY CLAY
...
1
J
•
0
..
INTERLAYER
•
...
E
D
WITH MEDIUM
DENSE
-
-
~
-
..
SANDY SILT
TO
SIL
TY FINE
SAND
-
-
~
.;,
f
-w
i
th clay
pockets
and a few shell
fragments to
25'
~
-
~
I
-w
i
th clay
partings
at
24'
P
USH
-
.%
• •
n
~
A
-
~
~
f
~
,..
I
15
....:-
0
0
c;:::
(ti
Q)
Cl)
20
3
0
Q)
co
c
0
:;:::;
25
-
....
(ti
Q)
c:
Q)
a..
30
Ill
~.
~
1
0
~
-
~
.
-
D
--
v
v
~
~
30
~
35
~
~-
-
~~
I
~
-
10
-
~
--
-
~
-
~
35
~~
I
~
~.
w~
-
10
.-
•
D
DD
~
(
1.
H ,39
.
5)..A.7
-
-
~
SAMPLING
TECHNIQUES
CLASSIF
I
CATION
TESTS
v
STRENGTH
TES
T
S
40
40
N
u
mber of blows of a 175
~
b weight (ha
m
mer) dropped appro
xi
mate
l
y
5
ft
to produce a
..,..
SOLUBI
LI
TY
IN HCL
,
[
%]
@
POCKET PENETROMETER (PP)
maximum
of
24 in
.
of
penetra
ti
on o
f
a 2
.
25-in.-OD
.
2.125
-
i
n
.
-
lD th
i
n-wa
ll
ed tub
e
•
PE
R
CENT
PAS
SIN
G
-200
SI
EVE
,
[
%]
+ TOR
V
ANE
(TV)
sampler
.
"PUSH
"
denotes a 3
.0
0-in.
-O
D
,
2.83
-
in
.
-lD
thin-walled tube
samp
l
erwas
•
W
AT
ER
CONTENT
CW),
[
%
]
<I> REMOTE
VA
NE (RV}
advanced 24
i
n. w
i
th the we
i
ght of the drill string
.
'WOH" denotes
a 2.5
0-
in.-OD
,
D
SUBMERGE
D
UNIT WE
I
GHT (SUW)
+ MIN
I
ATU
R
E VA
N
E (MV) (~
RES
I
DU
A
L (MVres) VALUE
)
2.125-
i
n
.-
lD
li
n
er samplerwas
advance
d
24
i
n
.
with the
weight of
th
e hamme
r.
..A. UNCONSO
LI
DA
T
ED UNDRAINED
TRIAXIAL
(
UU
)
PLASTIC LIMIT
(
PL)
LIQU
I
D
L
I
MIT
(
LL)
+------
-
---------------
+
(
Open
s
y
m
b
o
ls Indicate
remo
l
de
d
(
r)
tests)
L
O
G OF BORING
A
N
D
TEST R
E
SU
L
T
S
I
T
exas Offshore
P
o
rt
System, SPM #1 PL
E
T
B
lock A
-
59, Galvest
o
n A
r
ea
{
'
,
,
~
Offset:
0.08
-
@-
-
R
_
e
_
p
_
o
_
rt
_
N
_
o.
0
2
01-6505
s
1
750
125 METERS
8000
!
'
!
.,
'
410
FT
I
.
._•,,
..,,
.....
!
I
.
'
g
,
~
.
;
::_ ..
_
--
1,I
I
,
.
::
_
'.
i:
~
r
I
.
en
'
..
r
--.
,a
o
.
.:.
-..,
';
~
C
l
'
._:-
;<
_
--:,
.
-
1
=
.
C
,
,
1
1-l,
1
''
.
•
..
-
--
..
~
"
•
.
,
•
,.
•
•
1
•
-
,
~
;
..
;
.-.
1
10
..,. ..
;,
_
1
../
'l"'-:i-d~;f'i;:/;;<,; ;.,.
.
.~;:
'
:"
'
'"-'
"
•".
\
,
:,
....
j.'
.-.1.
f.
.
f
-.
j
~
~
..:;;:,
••
:
:
I
' M,\
"
.,
•:
,
,.
,
;
•;
;
;,. I
\
.
!
)
.
1
.
~
/
_;.
'_
p
,
,. -~
'
~
f
.,.
l
t
\':
,
•
;
.
'
\
..
••
I'
,
.l.
-
!'j1
.
:.
1
so
'
.I.
..,
,
,,
;
'
~-, .;
. i'
1-~~-"
~~~
.....-~
......
~--"-~~
-111--~~
.....
~~
....~~~.i...~~-'-----I
-.--
'
~
-
.
-
.
-
CLASS
IFJ
C
A
TtON
TEST
S
Y
SO
l
U
61
LITY
IN
HCl
,
!%]
•
F-ERCENT ?ASS
I
NG
-::OO
SJEVE,
rt.
!
e
WA
'rl::RCO
NTE
N
T
\
W
}.~
)
0
~USME~GED
UN
IT
W
EIGHT
(SIJ
W
)
+-
PL.AST
----
:C U
M
IT
--
(?
!.
)
---------------+
ltOUID
ll',1
1
7 (Llt
S
T
RENGT
H
TESTS
® POCKE:T FE
r
~~i'ROMET::R (PP)
+
iCRVANE (
TV
}
4>
R::t.10TE
VANE
{
A
V}
+ l.t
!
Nl~
T\JR;.
VANE
!M
V;
(
~ RES
I
DUA
L
(
J.1Vr
tsl
VALUE}
.t.
UN
CONSO
UO
.c..T::
.
D UNC~
l
l'iE:
O
i'R!A.
"(I
Al
(U
U
)
!l
n
Pl.,O,
TC
S-
\
l>
furde
lllwd9ol
U
t~t
rn
"~
I0
4o.ft1>•M\>•Uan.
•
b
n,wn,matd
...i
w111>
1
1
•
1,""1"1
•
1-
•
II
P<>e.l<
&
~
•MP•
nlnil
&
,12-''
l*
U
1'
'!,9;;:..:"':
c
D
;t
~f~
,..
•
nd
•
f
ewi.al~
-
-wr~~,r,
~
Q'
----lJ
c
...
U
N
DRAINED 9H&AII.
9T
~
EN
Q
TH
,,,
•
.'.
1,
1
11
-
--l--+-
--l--
+----ll----+--l---+---l--~
7
1
,ij'.
.
••
I.:
'
+-- .!;.....
_
..
•
(3 H.O)
;,.
1
,
H.0)
1t-~--t
-
~+~
--t~
~+
~--1
1--
~+~--11-~+~--t
~~~1sO
.
1
:r• ;'~
~;
•
1>-~-+
~~
-+-~-+~~-+-~-tt--~-+-~--1...,__~-+-~-+~
~
~
190
. ;
'.
r
1
.:
GEOPHYSICAL AND GEOTECHNICAL INTEGRATION
Texas Offshore Port System
,
SPM
#1 PLEM
Block
A-59,
Galveston Area
N
18500
-
-
..~
.
.-;
.
.060
.
070
..
.,.:
,•
i.'.
f
~I
(
'
/
I
,~
!1' i"
;,
'
't
'i~ '
.08
0
,.
.090
.
10
0
.1
10
.1
2
0
PLATE 3-2
I
(
~
~
.....
0
-
0
Shea
r
Strength Profile, [ksf]
0.5
1
.
0
1
.
5
$ =
25
°,
o
=
0
°,
Nq = 12
.
0
,
fm
x
=
1.4
ksf,
q
max
60 ksf
2
.
0
2.5
II
Ill
i;::::
60
...._-
---
--+-
-1----
--+-
-
----+-
-
--
--f-
-
-
----1
ca
Q)
Cl)
Q)
~
co
5 80
...._
-
-
----+--
--
-
--+---
-
-
-+-
-
-
-
~-f---
--
---1
:;:::;
~
Q)
c:
Q)
Cl..
N
ot
e: Roman nu
me
rals ref
e
r
to
the
st
ratigraphy
as
d
esc
ribed in the text
and
o
n th
e
bo
ring lo
g.
IV
140
...._______...._________________________......______......
DESIGN
STRENGTH
PARAMETERS
Texas Offshore Port System, SPM #1 PLET
Block A
-
59, Galveston Area
l
Report
N
o.
0201-6505
-@--
--
PLATE 3-3
1---
:;:::;'
Q)
.
Q)
~
....-
0
0
1ij
Q)
(/)
3:
0
Q)
Cll
c:
:..::.
«>
.....
c:
0
m
Q)
a..
Submerged Un
i
t Weight, [kcf]
0
.
00
0
0.02
0.04
0.06
0
.
08
0
.
10
'-----
---
_ _l__
20
40
60
80
100
120
140
----
--
II
L-------
----
--
---
---.
I
-
Ill
I
Note
:
Ro
m
an numerals ref
e
r to th
e
stratigraphy
a
s
des
c
ribed
i
n the text and
on t
h
e b
o
ring
lo
g
.
I
c...----
._
___
----
D
----'--
---
-
I
V
1-------
------
___
\_
------
--
---
DESIGN SUBMERGED UNIT WEIGHT
Texas Offshore Port System, SPM #1 PL
E
T
Block A
-
59, Galveston Area
(
-
@
-
R
-
e
-
po
_
rt
_
N
_
o
.
_
0
_
20
_
1
-
6
-
5
0
_
5
_
PLA
T
E 3-4
Unit Skin
Friction,
[ksf]
0.5
1.0
1.5
2.0
II
~
(1)
Ill
~
S.....:-
0
0
1u
60
(1)
Cl)
3::
0
Cl)
O'.l
--1.
----+----.......,
-
--
--
2.5
§ 80
l----
--
--+----
-
-----+----
--1--
--
-
-
-1-----------11
:;:;
n1
......
-
Q)
c
Q)
a..
Notes:
1. Roman numerals refer
to the
stratigraphy
as
describ
ed
in
t
h
e
te
xt
and
on
the
boring
lo
g
.
2
. Tens
io
n and
compression curves coincide.
IV
140
....
----------------------....i..----------------
UNIT SKIN
FRICTION
API
RP 2A (2000) Method
Texas Offshore Port System, SPM
#1 PLET
Block A-59, Galveston Area
I
-@-
R
_
e
_
p
_
o
rt
_
N
_
o
_
.
0
_
2
_
01
_
-
6
_
s
_
os
______
PLATE
3-5
Unit End Bearing, [ksf]
5
10
15
20
25
\
II
Ill
Notes
:
100
1. Roman numera
l
s r
e
fer t
o
the stratigraphy as
1----------\
-+------+-
---
--
-I
described in the text and on the b
o
ring log
.
2
.
Dashed l
i
ne represents equiva
l
ent unit end
bearing availab
l
e fr
o
m f
ric
tio
n
al resistance
of soil plug insid
e t
he ind
ica
ted p
il
e
s
ize
.
3.
E
n
d bearing compo
n
ent is negle
c
ted for
ca
i
ssons and conductors
..
IV
Back to top
140
._______.......______......,________________......______
..
1
-
@
-
R
_
e
_
p
_
o
_
rt
_
N
_
o
_
.
0
_
2
_
0
_
1
_
-
6
_
s
_
os
___
UNIT END BEARING
API RP 2A (2000) Method
Texas Offshore Port System,
SPM #1 PLET
Block A-59, Galveston Area
PLATE 3-6
Ultimate Axial Capacity, [kips]
200
400
600
800
1000
I
!;:;'
Q)
~
L..-
0
0
Nole:
Roman
numerals refer to the
stratigraphy as
described
in the
text and
on
the boring log.
.
-
Compression for
piles
Tension
for
piles
,
or tension and compression
for caissons and conductors
II
Ill
i:;::
60
11--
~~
-----.-+---+~~~~~--t------~
~~
~-t-~~~~~--~~~~--t1
(U
en
Q)
co
Q)
~
§ so----
--
-
-t,-,.,__
,----
+------+------+-----~
:;::::.
m
c
Q)
~
a..
'
'
'
'
IV
140.._
____________________________________________
ULTIMATE AXIAL
CAPACITY
API RP 2A (2000) Method
24-in.-Diameter Driven Pipe Piles
Texas
Offshore Port System, SPM
#1 PLET
Block A
-
59, Galveston Area
I
Report No. 0201-6505
-
@
---
PLATE
3-7
I
(
~
--..::::_
i
t
i
{
\
t
~
0
t
'
;.:.
m
'O
.,
.,.
.r:::
.,
"
()
~
\
m
;.:.
'O
.,
>
0
0.
a.
<
--
Rn
PENETRATION
BELOW
CURVE
POINTS
MUDLINE
(feet)
1
2
3
4
5
6
0.0
t
0.00
0.00
0.00
0.00
0.00
0
.
00
z
0
.
00
0
.
04
0
.
07
0
.
14
0.19
0
.
24
1
.
0
t
0
.
00
0.02
0.03
0.04
0.05
0.06
z
0.00
0
.
04
0
.
07
0
.
14
0.19
0
.
24
2.0
t
0
.
00
0
.
02
0.03
0
.
05
0.06
0
.
07
z
0
.
00
0.04
0.07
0.14
0.19
0.24
2.0
t
0.00
0.03
0.03
z
0
.
00
0.10
24.00
18.0
t
0
.
00
0.30
0
.
30
z
0
.
00
0
.
10
24.00
18.0
t
0.00
0.09
0
.
15
0
.
23
0.27
0
.3
0
z
0.00
0.04
0
.07
0.14
0.
19
0
.
24
25.0
t
0.00
0
.
1
1
0
.1
8
0
.
28
0.33
0
.
37
z
0
.
00
0.04
O.Q7
0
.
14
0
.
19
0.24
29.0
t
0.00
0.12
0.20
0.30
0.36
0.40
z
0.00
0
.
04
0.07
0
.
14
0.19
0.24
77.0
t
0.00
0.19
0.32
0.49
0.58
0.65
z
0.00
0
.
04
0.07
0
.
14
0.19
0
.
24
77.0
t
0
.
00
0.45
0.75
1.12
1.35
1.49
z
0.00
0
.0
4
0.07
0.14
0.19
0.24
95.0
t
0.00
0.43
0.72
1.08
1.29
1.43
z
0
.
00
0.04
O.Q7
0.14
0.19
0
.
24
115.0
t
0
.
00
0
.
50
0.83
1
.24
1.49
1.65
z
0
.
00
0.04
0.07
0.14
0.19
0.24
131
.
0
t
0
.
00
0.55
0.92
1
.
38
1.65
1.83
z
0.00
0.04
0.07
0.14
0.19
0
.
24
Notes: 1
.
"
!
"
is
mobilized soil
-
pile adhesion, [ksf].
2
.
"
z"
is
axial pile displacement
,
[in.]
.
3
.
Data
for tension and compression
coincide.
Report
No
.
0201-6505
AXIAL
LOAD
TRANSFER
DATA
(T-Z
DATA)
API RP
2A (2000)
Method
24-in.-Diameter
Driven
Pipe Piles
Texas
Offshore Port System
,
SPM
#1
PLET
Block A-59,
Galveston
Area
7
8
0.00
0
.
00
0.48
24.00
0
.
05
0.05
0.48
24
.0
0
0.06
0
.
06
0.48
24.00
0
.
27
0
.
27
0.48
24
.0
0
0.33
0.33
0.48
24.00
0
.
36
0
.
36
0.48
24.00
0.58
0.58
0.48
24
.
00
1.35
1.35
0.48
24
.00
1
.
29
1
.
29
0.48
24.00
1.49
1.4
9
0.48
24
.
00
1
.
65
1.65
0.48
24
.
00
PLATE
3
-8
[
(
~
r
~
;,;
'"
0
1
4
(
i
~
e!
0
::,:.
>.
<D
<D
-
P
ENETRAT
I
ON
BE
L
OW
M
U
D
LINE
(
feet
)
77.0
Q
z
8
3.
0
Q
z
95.0
Q
z
131.0
Q
z
CURVE PO
I
N
T
S
1
2
3
4
5
0
5
9
14
17
0
.
00
0
.
05
0
.
31
1
.
01
1
.
75
0
13
2
6
39
4
7
0
.
00
0
.
05
0
.
3
1
1
.
01
1.
75
0
1
1
2
1
32
38
0
.
00
0.05
0
.
3
1
1
.
0
1
1
.
75
0
1
3
26
39
47
0
.
00
0.05
0
.
31
1
.
0
1
1
.75
I )
N
otes: 1
.
"
Q"
i
s mobilized e
nd
bear
i
ng capac
i
ty, [kips]
.
l
[
2
.
"
z" is axia
l
tip d
i
s
p
lacement
,
[
i
n.
].
(.)
-,:
I
Rep
o
rt No. 0
2
01-6505
-
~
---
AX
I
AL LOAD TRANSFER DATA
(
Q
-Z
DA
TA)
AP
I
RP 2A
(
20
00
) Meth
od
24
-
i
n.
-
Diamete
r
Dri
v
e
n
Pi
p
e Pi
l
es
Texa
s O
ffs
ho
re Port S
y
stem
,
SP
M
#1 PLET
Bl
oc
k
A
-59, Ga
lv
es
ton
A
r
ea
6
7
1
8
18
2.40
24
.
00
52
52
2.40
24.00
42
42
2.40
24.00
52
52
2
.
40
24.00
P
LA
T
E 3-9
I
r
I
'W
Q_
~
N
~
J
!
-l
I
f
r
Penetration
~GRD
~
Or-------------
Loose
to medium dense
si
lty
fine sand
Soft to firm sandy silty clay
interlayered with medium dense
sandy silt to
silty
fine sand
St
iff to
very stiff clay
Notes
:
2'
Scour= 5'
5'
-
-
-
-
-
-
-
-
-
k
= 20 pci
18'
E
50
=
2.5 %
77'
---------
E
50
=
2
.
0
%
at 77'
decreasing linearly to
E50
=1
.
0
%
at
100'
100' -
-
-
-
-
-
-
-
-
1.
E:
50
is axial strain at half of peak deviator
stress for
cohesive soils
.
2. Soil
stre
ngth
parameters are shown on
P
la
t
e
3-3.
3
.
Submerged unit weight profile is shown on
P
late 3-4.
4.
k
is the
modulus
of
horizontal
subgrade
reaction for granular soils.
STRATIGRAPHY AND PARAMETERS FOR P-Y DATA
Texas Offshore Port System, SPM
#1 PLET
Block A-59
,
Galveston Area
n;).f{
epo
rt No
. 020
1
-
6505
-
rx.JJ
PLATE
3
-
10
;.:.
;.:.
Ill
Ill
"O
"O
"'
"'
-"'
e
>
u
"'
a.
.r:
a.
t)
.,::
-
Ri
PENETRATION
BE
L
OW
CURVE POINTS
MUDLI
NE
(feet)
1
2
3
4
5
6
0.0
p
0
0
y
0
.
00
24.00
5.0
p
0
0
y
0.00
24
.
00
7.0
p
0
41
68
90
113
129
y
0
.
00
0.05
0.08
0
.1
2
0
.18
0.28
9.0
p
0
124
206
272
342
391
y
0.00
0
.
07
0.13
0.18
0.28
0.43
11
.
0
p
0
248
414
546
687
786
y
0.00
0.
10
0
.
17
0
.25
0.37
0.57
13
.
0
p
0
335
558
737
927
1060
y
0.00
0
.
11
0
.
20
0.28
0.43
0.66
1
5
.
0
p
0
434
724
955
1201
1375
y
0.00
0.
12
0.22
0.32
0.48
0.74
18.0
p
0
607
1012
1335
16
79
1922
y
0.00
0.
1
4
0.26
0.37
0.56
0
.
86
18.0
p
0
79
121
179
263
378
y
0.00
0.04
0.15
0.45
1.
50
4.50
77.0
p
0
146
22
4
331
487
702
y
0.00
0
.
04
0.15
0
.45
1.50
4.50
77.0
p
0
450
690
1020
15
00
2160
y
0.00
0.03
0.12
0
.
36
1.20
3.60
95.0
p
0
338
518
765
11
25
1620
y
0.00
0.02
0.07
0
.22
0.73
2
.
19
100.0
p
0
349
534
790
11
62
1673
(and
b
elow)
y
0.00
0.02
0
.
06
0.
18
0.60
1
.80
Notes
:
1. "p" is soil res
i
stance, {lb/in
.
]
.
2. "y'
'
is
lateral
defl
ection,
[in
.].
Report
N
o.
0201
-
650
5
P-Y
DATA
(CYCLIC LOADING)
API RP
2
A
(2000)
Method
24
-in.-Diame
te
r Driven Pipe
Piles
Texas
Off
s
hore
Port System, SPM #1 PLET
Block A-59, Galveston Area
7
8
134
136
0
.
41
24.00
408
412
0.62
24.00
819
828
0
.
83
24.00
1105
1
11
6
0.95
24.00
1433
1447
1
.
06
24.00
2003
2023
1.
24
24.00
378
24.00
702
24
.
00
2160
24
.
00
1620
24.00
1673
2
4.00
PLATE
3
-
11
Date
:,/')
{
,
July 4,
2008
-
(
Jul
y
5, 2008
!
1
io'"
"
i
~
~
!
:,..,
•
~
~
~
I
Report No. 0201-6505
@
-
~
GRD
Time
From
To
Descri~tion of Activities
****
2350
Arrive
in Bloc
k
A-59,
Gal
ves
ton
Area, SPM
#
1
PLET locatio
n
onboard
the
vessel
RIV
Sea
probe
.
2350
2400
Set 4-pt
ancho
r
s.
0000
0115
Set 4-pt
anchors.
0115
0130
Rig
up
to drill and
sam
ple
.
****
0130
Estimate water
depth
of
117
ft
with
vessel's
echo
sounder
and 122 ft usin
g
wireline
techn
i
q
u
e.
0130
0140
Run
scanning sonar.
0140
0240
Run
drill pipe to
mudline.
****
0240
Mea
s
ure water
depth
o
f 123
ft
using
b
ottom
se
n
so
r
/p
ipe tally
and 121.0 ft
wi
th
the
pres
sur
e
transducer.
0240
0655
Drill
and
s
amp
le.
Bor
ing termi
n
ated
at
131-ft
penetration.
0655
0720
Pull drill pipe
abo
v
e
mudline a
nd
r
epositi
on
vessel.
**
*
*
0720
Measure supplemental water
de
pt
h
of
123
ft
wit
h
the
bottom
se
n
sor/pipe tally
and 122.0
ft wi
th
pressure
trans
du
cer.
0720
0740
Pull drill pipe
to
deck
and secure equipment for
travel.
0740
0825
Pull
anchors.
0825
****
D
epa
rt
l
ocation.
SUMMARY OF FIELD OPERATIONS
Texas Offshore Port System, SPM #1 PLET
Block A
-
59, Galveston Area
PLA
TE
A-
1
I
@
Checked
B
y:
/kJ
Approved
By
:
~
Date:
Date:
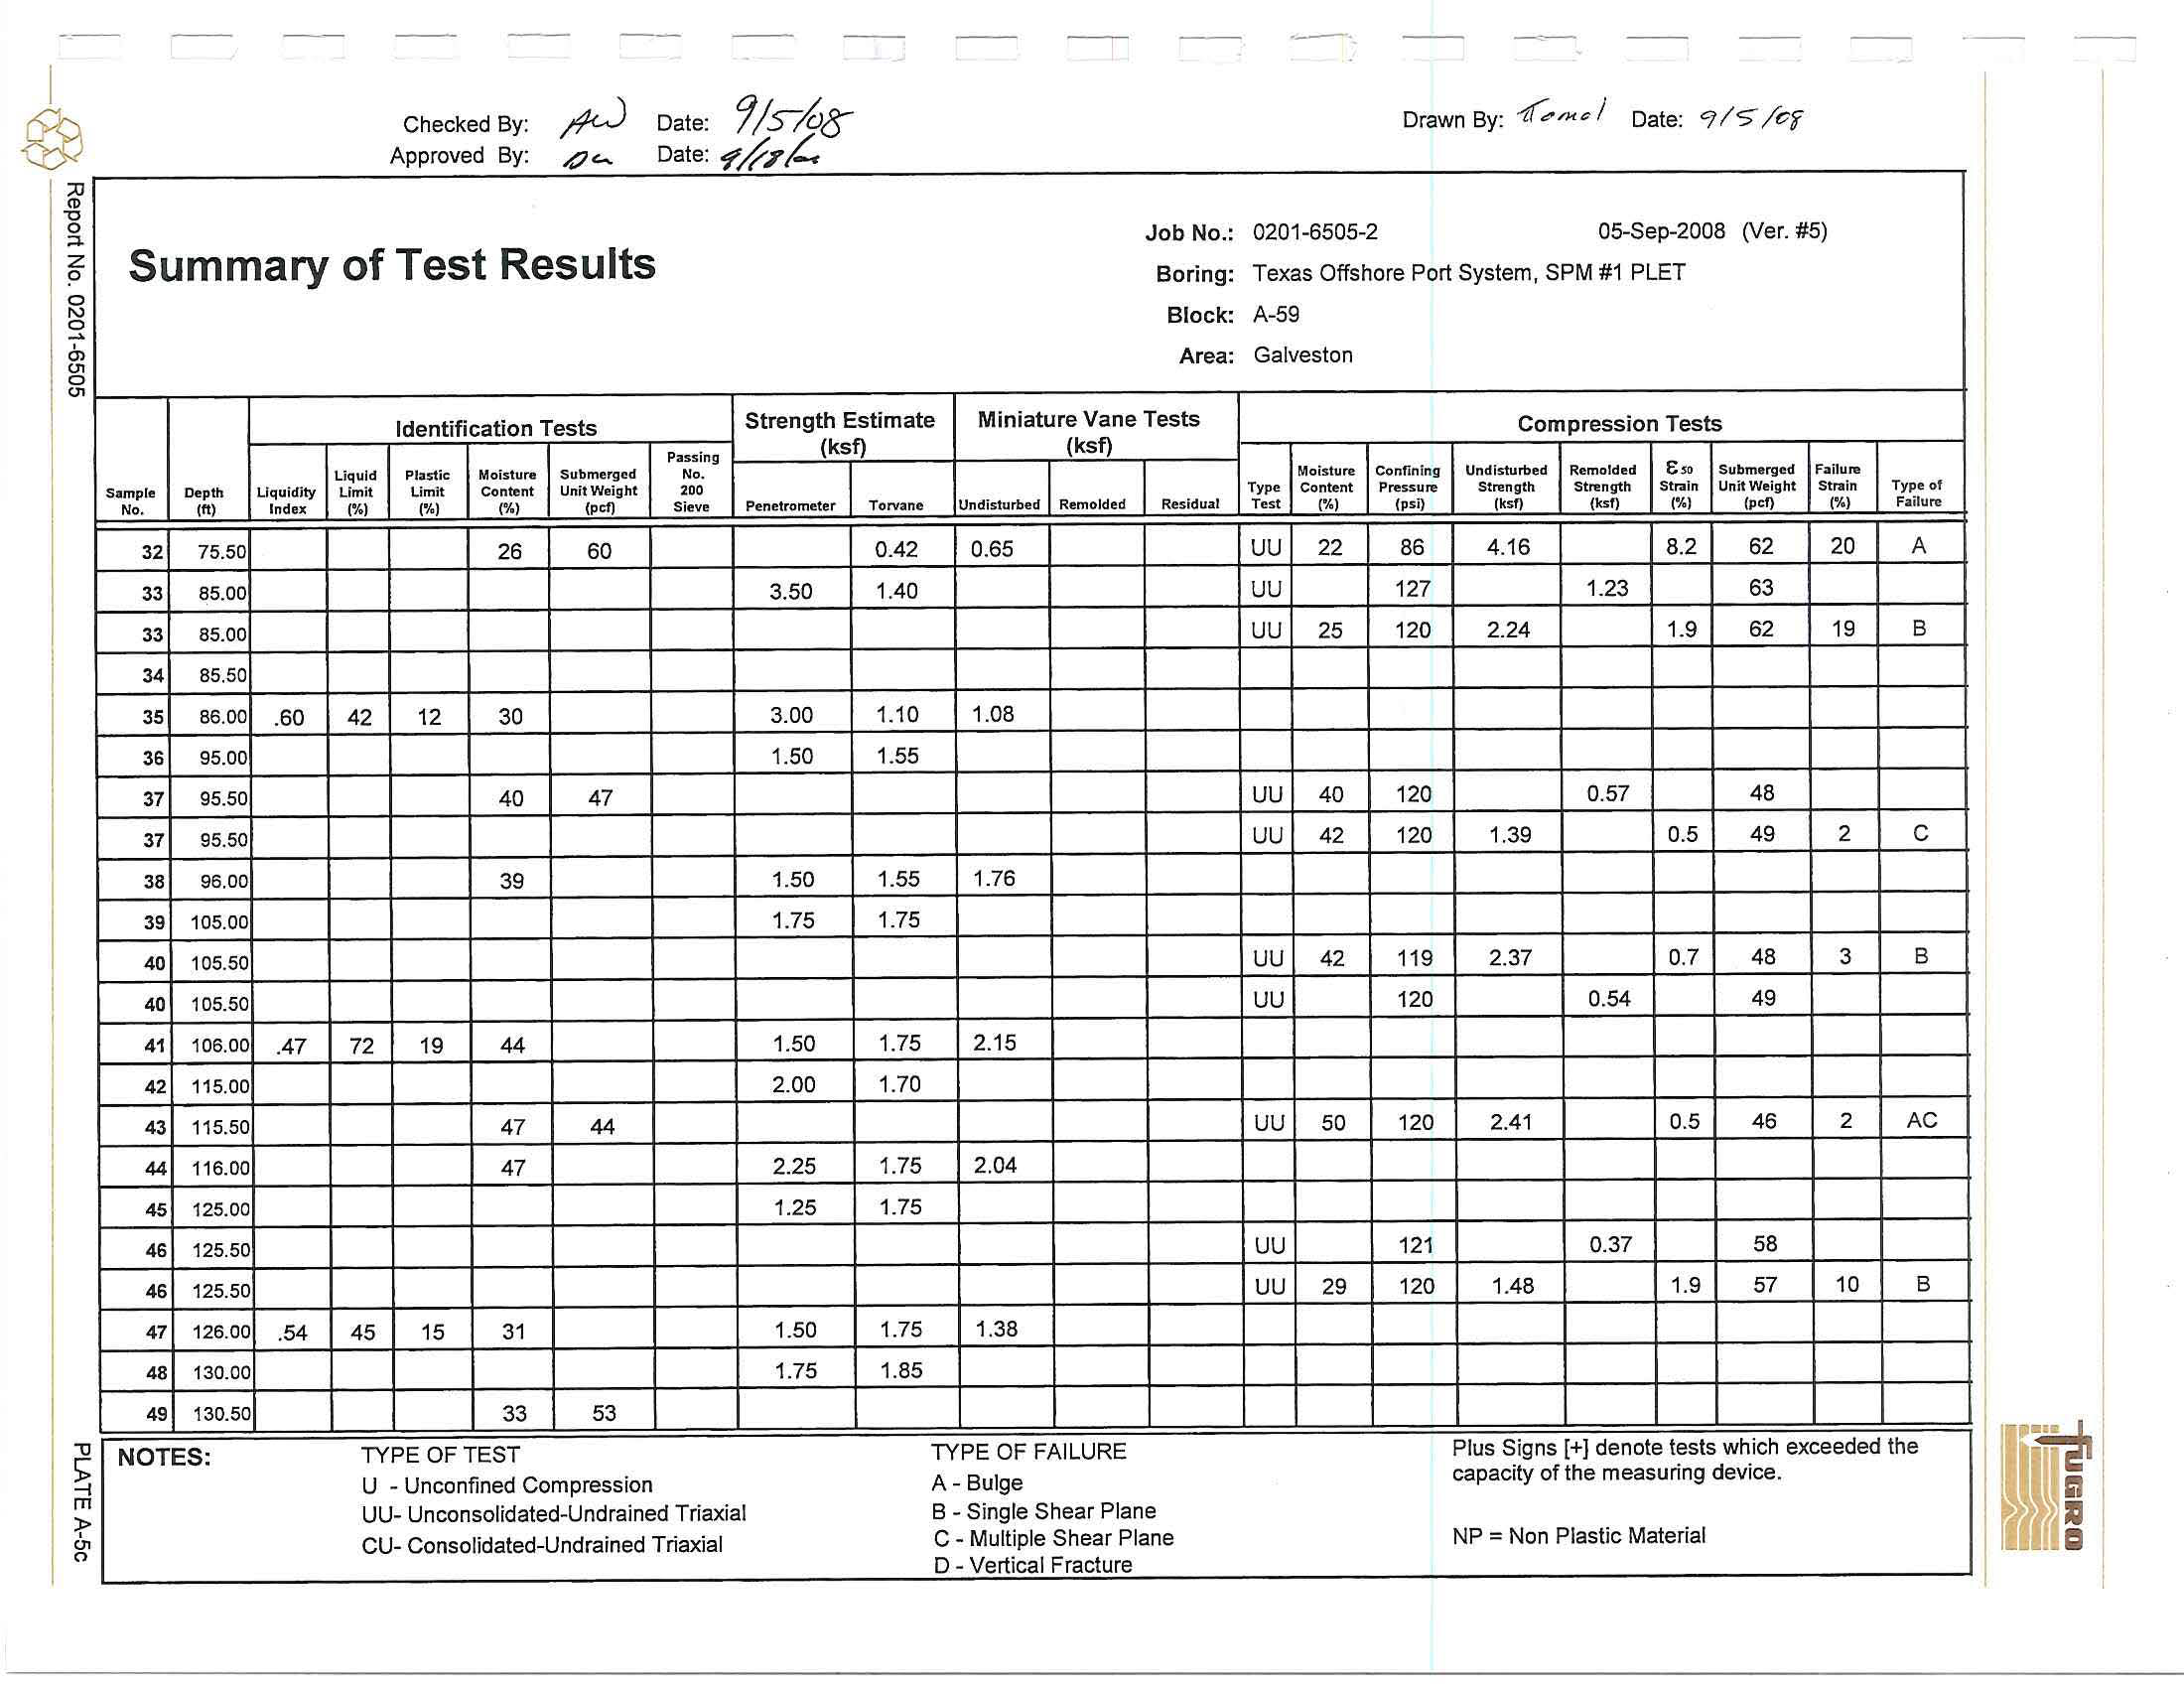
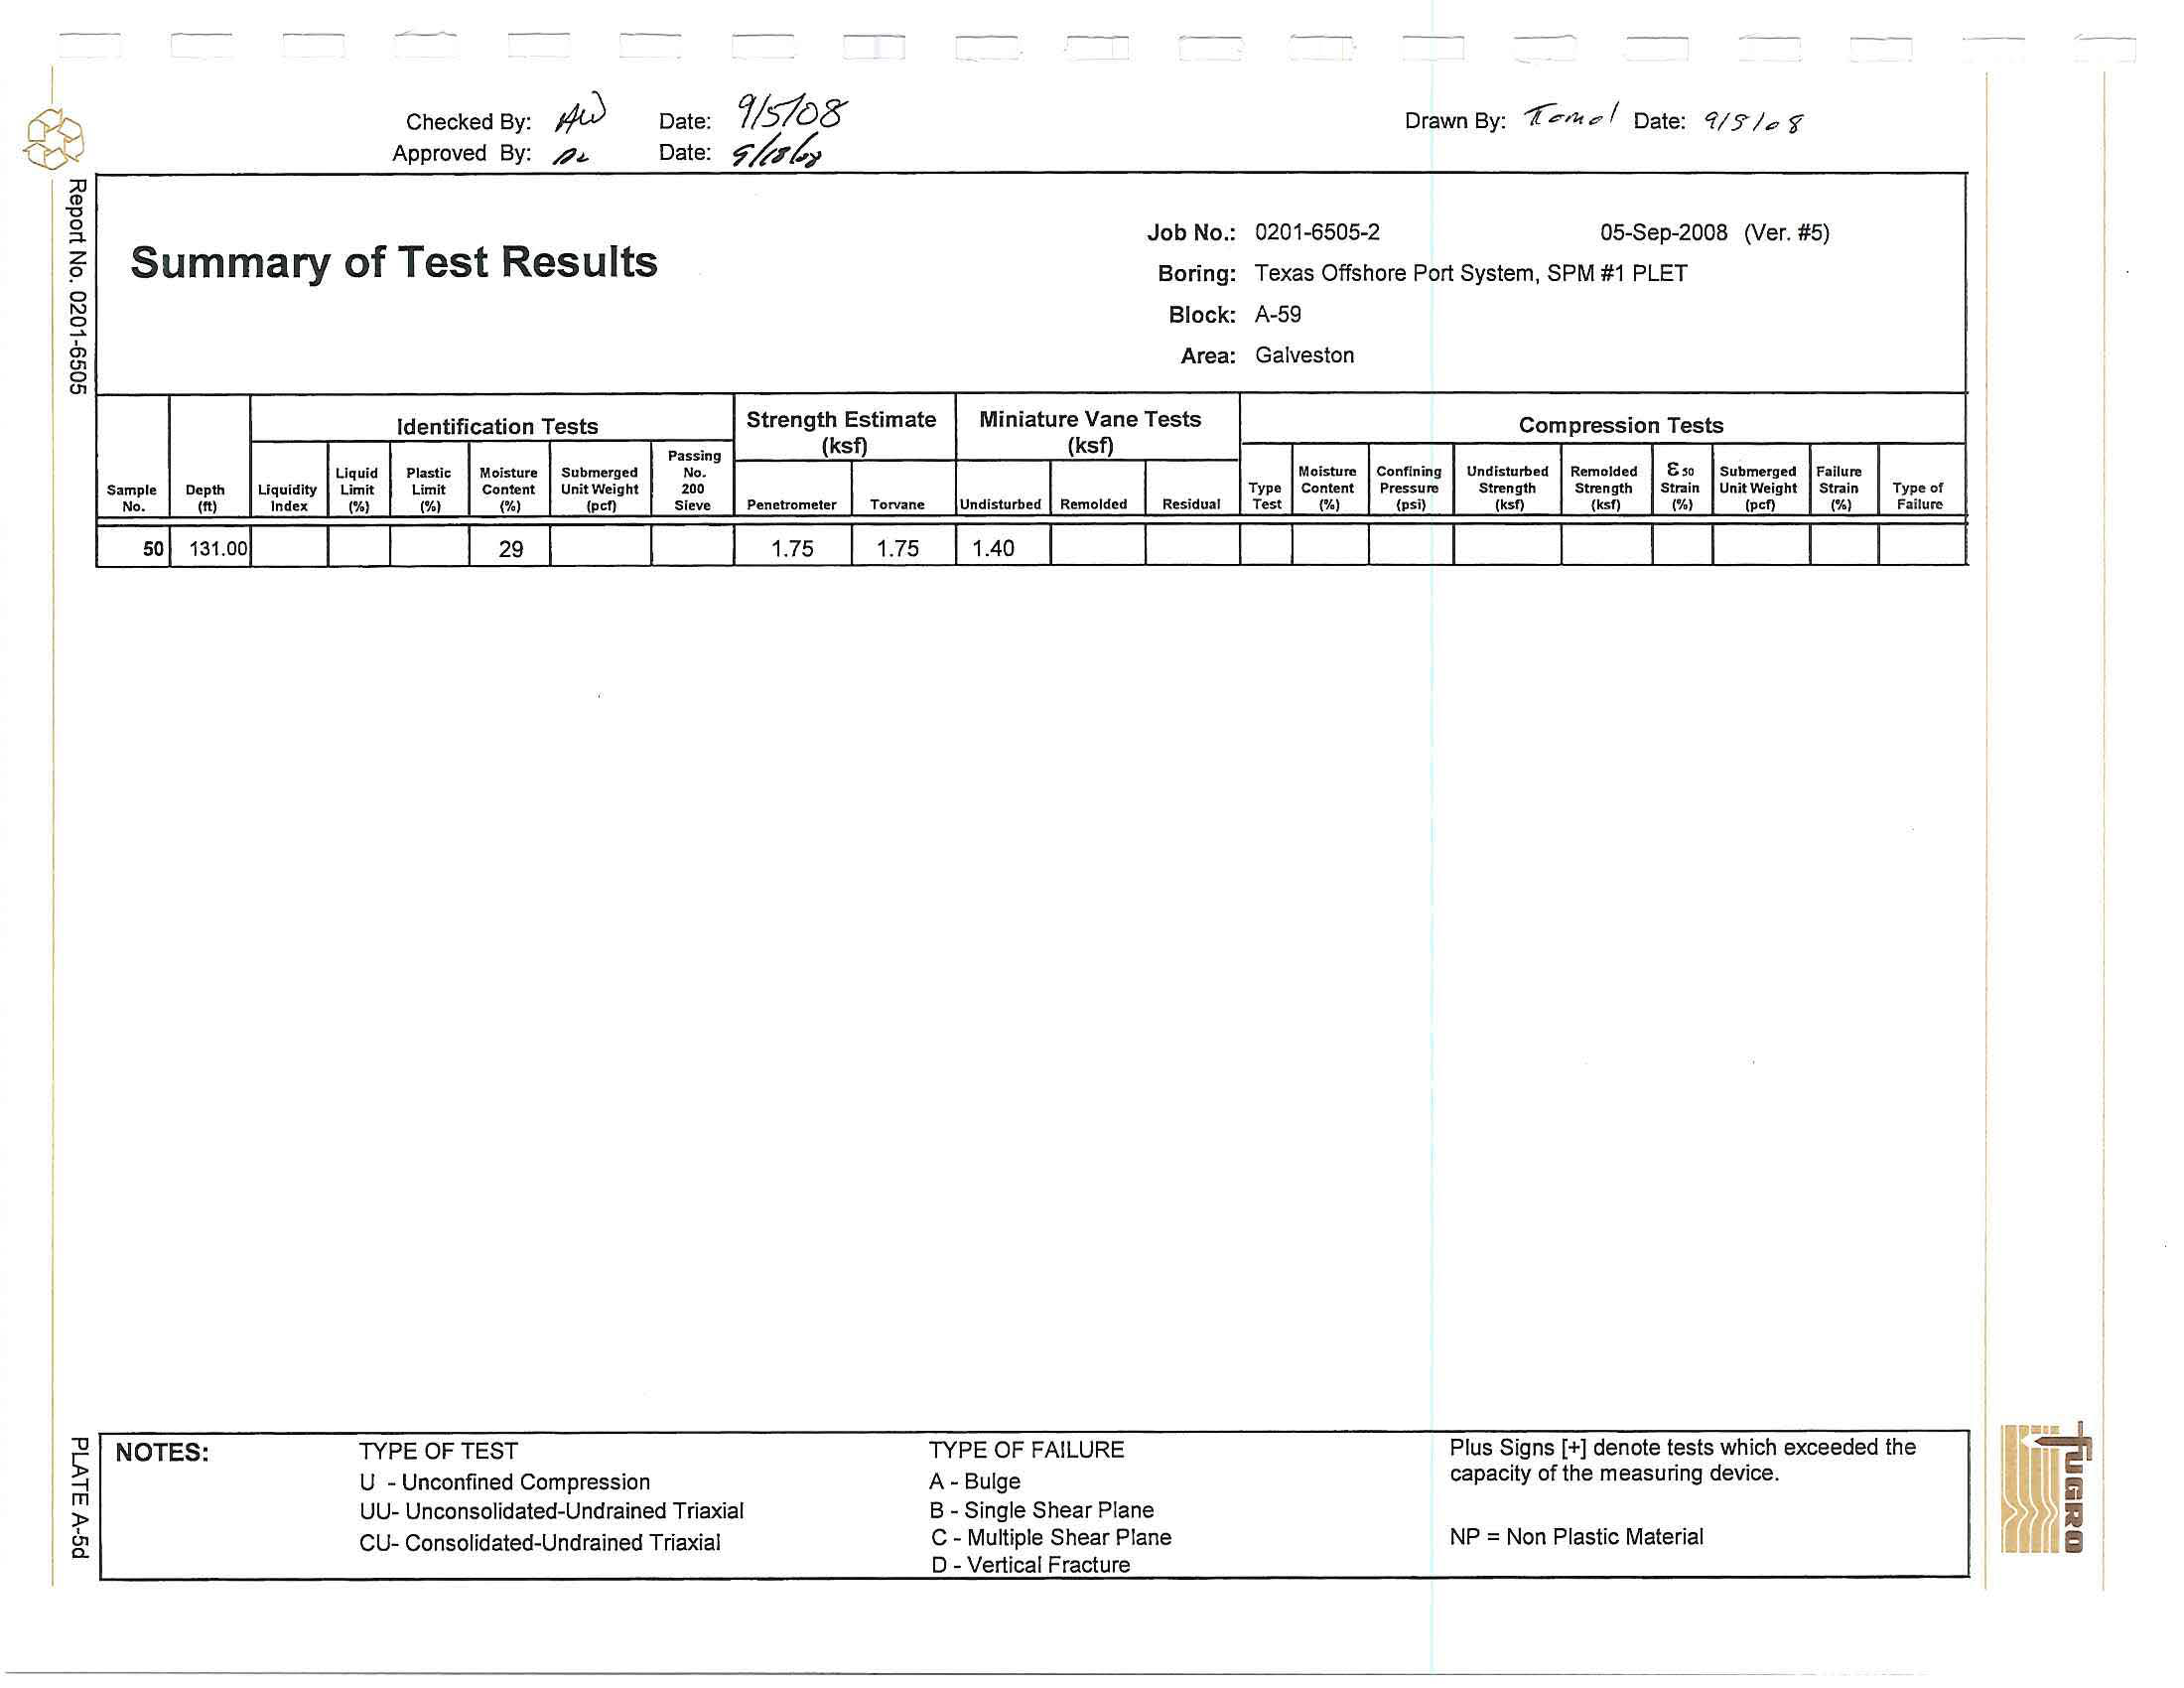
Summary
of
Test Results
;
Id
entification
Tests
P
ass
ing
Liquid
Pl
asti
c
Moisture
Sub
m
erged
No.
Sample
D
e
p
th
Liquidity
Li
m
it
Limit
Content
U
nit
Weight
200
No.
(ft)
Index
(%)
(%)
(
'/
,
)
(pc!)
Sieve
1
1
.00
55
2
1
.
50
52
3
1.80
32
3
1
.
80
1
.
13
30
16
32
3
1.80
41
37
4
5
.
00
27
6
1
12
5
8
.00
27
55
22
6
1
1.00
29
5
7
36
7
14.00
28
56
24
8
17
.
00
30
53
29
9
19.00
33
51
65
10
20
.
00
34
53
51
11
24.70
38
46
43
12
25.00
39
12
25.00
38
13
29
.
00
14
29.50
52
15
30.00
1
.
94
25
19
31
15
30.00
29
15
30.00
32
15
30.00
16
35.00
2
.
25
25
20
30
N
O
TE
S:
TYPE OFTEST
U - Unconfined Compression
UU- Unconsolidated-Undra
i
ned Triaxial
CU
-
Consolidated-Undrained
Tria
xial
Drawn By
:
1(:.
fl'
c
l
Date:
er /,Ice-
Job No.:
0201-6505-2
05-Sep-2008
(Ve
r.
#5)
Boring
:
Texas
Offshore Port
System,
SPM
#1
PLET
Bloc
k: A
-5
9
Area
: Ga
l
vesto
n
St
ren
gt
h
Estimate
Miniature
Vane
Tests
Compression Tests
(ksf)
(ksf)
Moisture
Co
n
fini
n
g
Undist
urbed
Remo
l
ded
&,
o
Submerged
Failure
T
ype
Content
Pressure
Strength
Strength
Strain
Unit Weight
Sb.tin
Typ
e
of
Penetro
m
eter
Torvane
Und
i
sturbed
Remolded
Residual
Te
st
('/,)
(psi)
(ks!)
(ksf)
(
%)
(pcf)
(
%)
Failu
re
0.07
0.06
0
.
04
0.16
0
.
38
0.76
0.30
0.07
0.32
0
.
34
0.1
1
TYPE
OF
FAILURE
Plus
Signs[+]
denot
e
tests
w
hi
c
h
exceeded the
A
-
Bulge
capacity
of the measuring device
.
B
-
Si
ngl
e Shear
Plane
C
-
Multiple
Shea
r
Plane
NP= Non Plastic
Materia
l
D
-
Vertica
l Fracture
I
@
::u
(D
"U
0
;i.
z
?
0
"'
0
~
(])
01
0
01
Che
ck
e
d B
y:
~
A
ppro
ve
d
By:
,p
<-
D
a
t
e:
Date:
Summary of Te
s
t R
e
sults
Id
e
nt
i
fi
c
ati
on
Tests
Passi
n
g
L
iq
u
id
P
l
astic
Moisture
Submerged
No.
Samp
l
e
D
epth
L
iqui
di
ty
L
imit
L
imit
Conte
n
t
U
n
it Weight
20
0
No
.
(ft)
I
n
dex
(%)
rM
(
'/,)
(
p
cf)
Sieve
1
6
35
.
00
33
53
52
17
39
.
00
34
61
18
39.50
53
19
40
.
00
1
9
40.00
30
50
19
4
0.00
1
.
66
2
4
18
29
20
45.00
2
7
5
7
42
2
1
49.00
22
49.50
23
50
.
00
1
.80
25
19
30
45
23
50
.
00
24
55
.
00
27
62
28
25
59
.
00
2
6
59.50
67
2
7
60
.
00
.
9
1
23
1
8
23
2
7
60.00
25
64
27
60
.
00
28
65.00
27
6
4
52
29
65
.
50
3
0
66
.
00
.9
2
26
19
25
3
0
66.00
3
1
75
.
00
26
60
66
NOTE
S:
TYPE OF
T
ES
T
U -
U
n
co
n
fi
ned
Co
m
p
r
ess
i
o
n
UU
-
U
n
c
o
n
soli
d
ate
d
-U
n
dra
in
e
d Tr
iaxial
CU
-
Consolida
t
ed-
U
n
dr
ained
T
riaxial
J
ob
No
.
:
0201
-
6505-2
05-Se
p
-2008 (V
er
.
#
5)
Bo
ri
n
g:
Texas Offshore Port Syste
m,
S
P
M
#
1 P
LET
B
l
oc
k
:
A
-
59
A
r
ea
:
Galves
t
o
n
S
tren
g
th E
s
timate
Mini
a
t
u
re
Van
e
T
ests
C
o
mp
r
ession Tests
(
ksf)
(ksf)
Mo
i
st
u
re
Confining
Undistuz1Jed
Remolded
6,o
Sub
m
e
r
ged
F
a
ilune
T
ype
Content
Pressun!
Strength
Stnmgth
Str2in
Unit Weigh
t
S
t
r.irn
Typ
e
of
Pcmetro
m
eter
Torvane
U
n
dist
ur
bed
Remolded
Residu
a
!
Test
('/,)
(
p
si)
(ks!)
(ksf)
('/,)
(
p
cf)
(
'/
,
)
F•llure
0
.
32
u
u
26
1
20
1
.19
9
.
7
58
20
A
0.14
0
.40
0.4
4
0
.
56
uu
27
7
5
0.53
4.4
58
20
A
0
.
54
0.76
uu
30
76
0.72
2.7
54
12
A
0
.
17
0.52
uu
2
1
80
1
.74
7.2
65
20
A
0.
80
0
.34
0
.
2
2
0
.
80
0
.
60
uu
25
80
0.48
3
.
7
6
1
16
A
0.
1
6
TYP
E
O
F F
AI
L
UR
E
Pl
u
s S
i
g
n
s
[
+
]
de
n
ote
t
es
t
s wh
i
ch exceeded the
A- B
ul
ge
capacity
of
t
he measuring device.
B
-
Sing
l
e Shea
r
P
l
a
n
e
C - Multi
p
le Shea
r
P
l
ane
N
P
= N
on
P
l
asti
c
Mate
ri
al
D - Ve
rti
cal
Fr
act
u
re
I
@
;;o
CD
-c,
0
::i.
z
!='
2
0
_.
0)
CJ1
0
CJ1
"'O
rn
~
1"
CJ1
0
C
h
e
c
ked By:
~
Approved
B
y:
,Cl
"'-
Summary of Test Results
Date
:
9
/
s-;b!)
Da
t
e: .,,
/?.F
/-.
Job
No.:
B
oring:
B
l
o
ck
:
A
re
a
:
Identifi
c
ati
o
n T
es
ts
S
trengt
h E
sti
m
ate
M
i
n
iat
ur
e
V
ane Te
s
ts
Passing
(ksf)
(
ksf)
Liquid
Pl:astic
Mois
t
ure
Sub
m
erged
No
.
S•mple
Depth
Li
q
uidity
Limit
Limit
Co
n
tent
Unit Weig
h
t
200
No.
(ft)
Index
(%)
(%)
(
~,
)
(pen
Sie
ve
P
enetrometer
Torvane
Undisturbed
Remolded
Residua
l
3
2
75.50
26
60
0.42
0.65
33
85.00
3
.
5
0
1.40
33
85.00
34
85.50
35
86.00
.
60
42
1
2
30
3.00
1.10
1
.08
36
95.00
1.50
1
.
55
37
95.50
40
4
7
3
7
95.50
38
96.00
39
1.50
1.55
1.
76
39
105.00
1
.
75
1
.
75
4
0
105
.
50
40
105
.
50
4
1
106
.
00
.47
7
2
19
44
1
.50
1.75
2.15
42
1
15.00
2.00
1
.
70
43 115.50
47
44
44
116
.
00
47
2.25
1.75
2.0
4
45
125.00
1.25
1
.75
46 125
.
50
46 125
.
50
4
7
126.00
.54
45
15
3
1
1
.
50
1.75
1.
38
48
130.00
1
.
75
1
.
85
49
130.50
33
53
NOTE
S:
TY
P
E OFT
E
ST
TYP
E
OF FAI
L
URE
U
-
U
n
co
n
fined C
om
p
r
ess
i
o
n
A
-
B
ul
ge
UU-
U
n
co
n
solida
t
e
d
-Und
r
ained
T
riaxial
B
-
Sin
g
le Shea
r
P
l
a
n
e
CU- Co
n
soli
d
ated
-
Un
dra
ined
Tri
axia
l
C
-
M
u
lt
i
ple She
a
r P
l
a
n
e
D -
Vertical
F
ract
ur
e
Drawn By:
-11.,,
//.<"
I
Date:
915'
/cf
0201
-
6505-2
05
-
Sep
-
2008
0fer. #5)
T
exas
Offshore
Port Sys
t
em, SPM
#1
P
L
E
T
A
-
59
Galveston
Compre
s
si
o
n T
e
sts
Moisture
Co
n
fin
f
n
g
Undisturbed
Re
m
olded
&,a
Su
b
merged
Failura
Type
Content
Pressun:
Stn!
n
g
th
Stre
n
gth
Str.al
n
U
n
it We
i
ght
Strain
Type of
Test
('
.4
)
(psi)
(ksn
<ksn
('kl
(ptn
(
%
)
F
ai
lure
u
u
22
86
4.16
8.2
62
20
A
uu
1
27
1.23
63
uu
25
120
2.24
1
.
9
62
1
9
B
u
u
40
1
20
0.57
48
uu
42
120
1
.39
0.5
49
2
c
uu
42
1
19
2.37
0.7
4
8
3
B
uu
1
20
0
.
54
49
uu
50
1
20
2
.4
1
0.5
4
6
2
AC
uu
121
0
.
37
58
uu
29
1
20
1
.48
1.9
57
10
B
P
l
us Sig
n
s [
+
] de
n
ote test
s
whic
h
exceeded
the
capacity
of t
h
e
m
eas
u
ring device.
N
P
= N
o
n P
l
astic Material
::0
CD
-0
0
;::i.
z
~
0
N
....
0
en
u,
0
Summary of Test Results
Job No.:
0201-6505-2
05-Sep-2008
(Ver
.
#5)
Boring: Texas Offshore Port System, SPM #1
PLET
Block:
A
-59
Area: Galveston
u,~
~---,.--~~..-~~~~~~~~~~~~~~~~~~-,-~~~~~~~~..-~~~~~~~~~~--,-~~~~~~~~~~~~~~~~~~~~~~~~~~~~
~
S.1mple
Depth
Liquidity
No.
(ft)
Index
50
131.00
NOTES:
Passing
Liquid
Plastic
Moistu
r
e
Submerged
No
.
Limit
Limit
Content
Un
it
Weight
200
('/.)
(II,)
(%)
(pc!)
Sieve
29
TYPE
OFTEST
U
-
Unconfined Compression
UU- Unconsolidated-Undrained
Triaxial
CU- Consolidated-Undrained
Triaxial
Penetrometer
Totvane
1.75
1
.
75
Undisturbed
Remoldcd
1.40
TYPE OF FAILURE
A- Bulge
Res
i
dual
B
-
Single Shear
P
la
ne
C
-
Multiple Shear
Plane
D -
Vertical Fracture
Moistum
Type
Content
Test
{
'!.
)
Confining
Pressure
(psi)
Undisturbed
Stre
ngth
(ksf)
R
emoJded
st
..
ngth
(ksf)
Su
bme
rged
Fa
ilure
UnitWeight
Strai
n
(pcf)
(%
)
Typ
e
of
Failure
Plus
Signs[+] denote
tests
which exceeded the
capacity
of the
measuring
device
.
NP
=
Non
Plastic
Material
I
@
I
;o
J
i
I
!
N
en
~
0,
0
0,
I-
I
('.)
~
>-
co
Cl
~
(/)
(/)
~
I-
z
w
()
a.
0::
w
100
90
80
7
0
6
0
50
40
30
20
1
0
0
1
00
C
h
ecke
d
b
~
~
-
--
D
at
e
:
<