~
x = 3,256,
4
00ft
~
Y
=
247,000 ft
I
N
~
~
l'
X
=
3
,
261,400ft
X
=
3
,
266,400ft
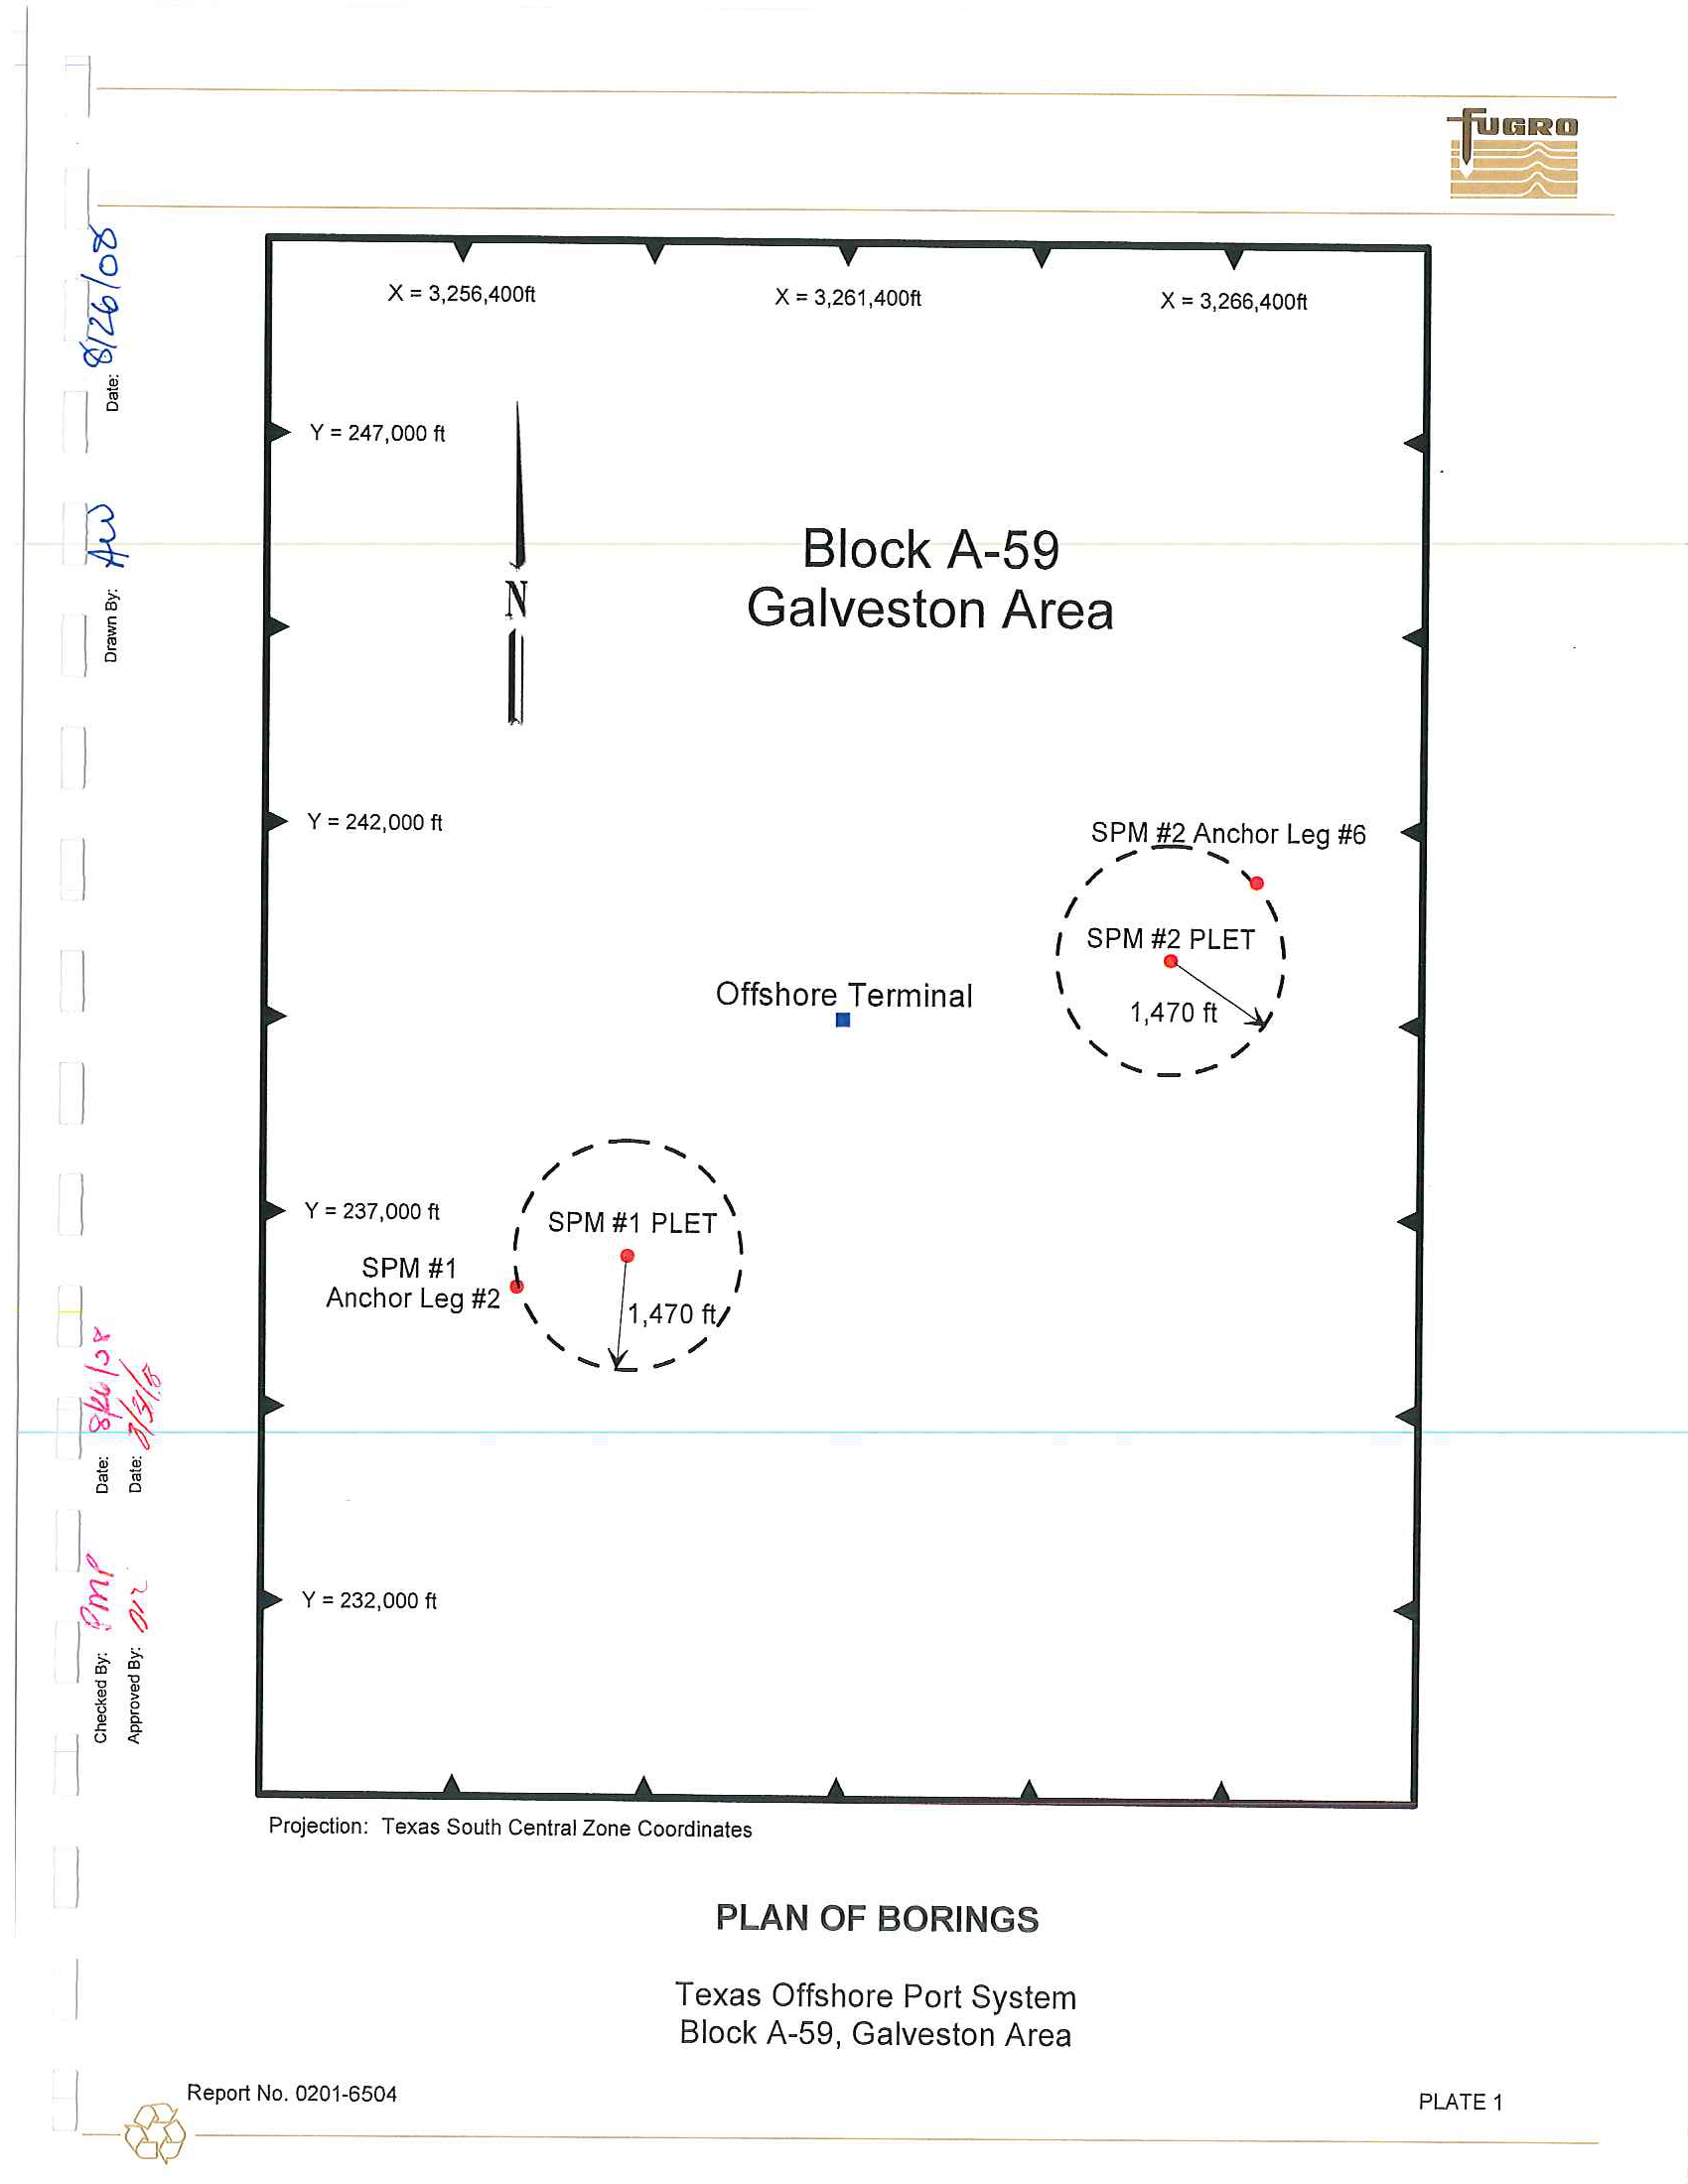
Block A-59
Back to top
Galveston Area
~
Y
=
2
4
2,000 ft
S
P
M!£,.A
........
n
ch
or Le
g #6
/
'e
I
\
,
S
PM #
2
PLET \
Offshore Terminal
•
\
",-
,
\
1,4
70
ft
~
...
,.
.....
~
/
"
Y
=
237,000 ft
I
SP
M
#1 PLET \
,
\
SPM
#
1
•
f
I
A
nch
o
r L
eg
#2 \
1,470 ft
l
"
..........
",
~
Y
=
232,000 ft
•
Pro
j
ec
t
ion:
Texas
South Central
Zo
n
e Coordi
n
ates
PLAN OF BOR
I
NGS
Tex
as O
ffs
hor
e
Por
t S
y
s
t
e
m
Block A
-
59, Galveston
A
r
e
a
"
.....
_
.....
",
1
__
~
R
_
e
_
p
o
_
rt
_
NO
_
.
_
02
_
01
_
-6
_
5
_
04
_______________________________________
•
PLATE
1
@
.
I
;lJ
ro
"C
0
;>
z
~
0
'"
II>
...
'"
0
:;:;'
Q)
~
.:
0
0
<i=
en
Q)
ro
:;:
0
Qi
Q)
c
0
:;:;
ro
~
Q5
c
Q)
D-
S
"
m
'"
ru
0
25
.
50
75
100
125
1
50
175
200
225
250
2
7
5
300
3
2
5
350
375
4
0
0
425
450
475
500
Chec"
....
""1
'
~-
.tJ
,r&
c•.•
.
~L, '~5
Da
l
e
' J'ft
/
h
.... '
......
0 By:
~
....
"',...
[1
12
"
~
w
Appro
v
ed
By
:
X ..
3
,
26
1
,412'
IDENTIFICA
TI
ON
TESTS, f
k
J
y =:
2
39,522'
BLOW
20
40
60
80
UNDRA
I
NED SHEAR STRENGTH
COUNT
[ksf]
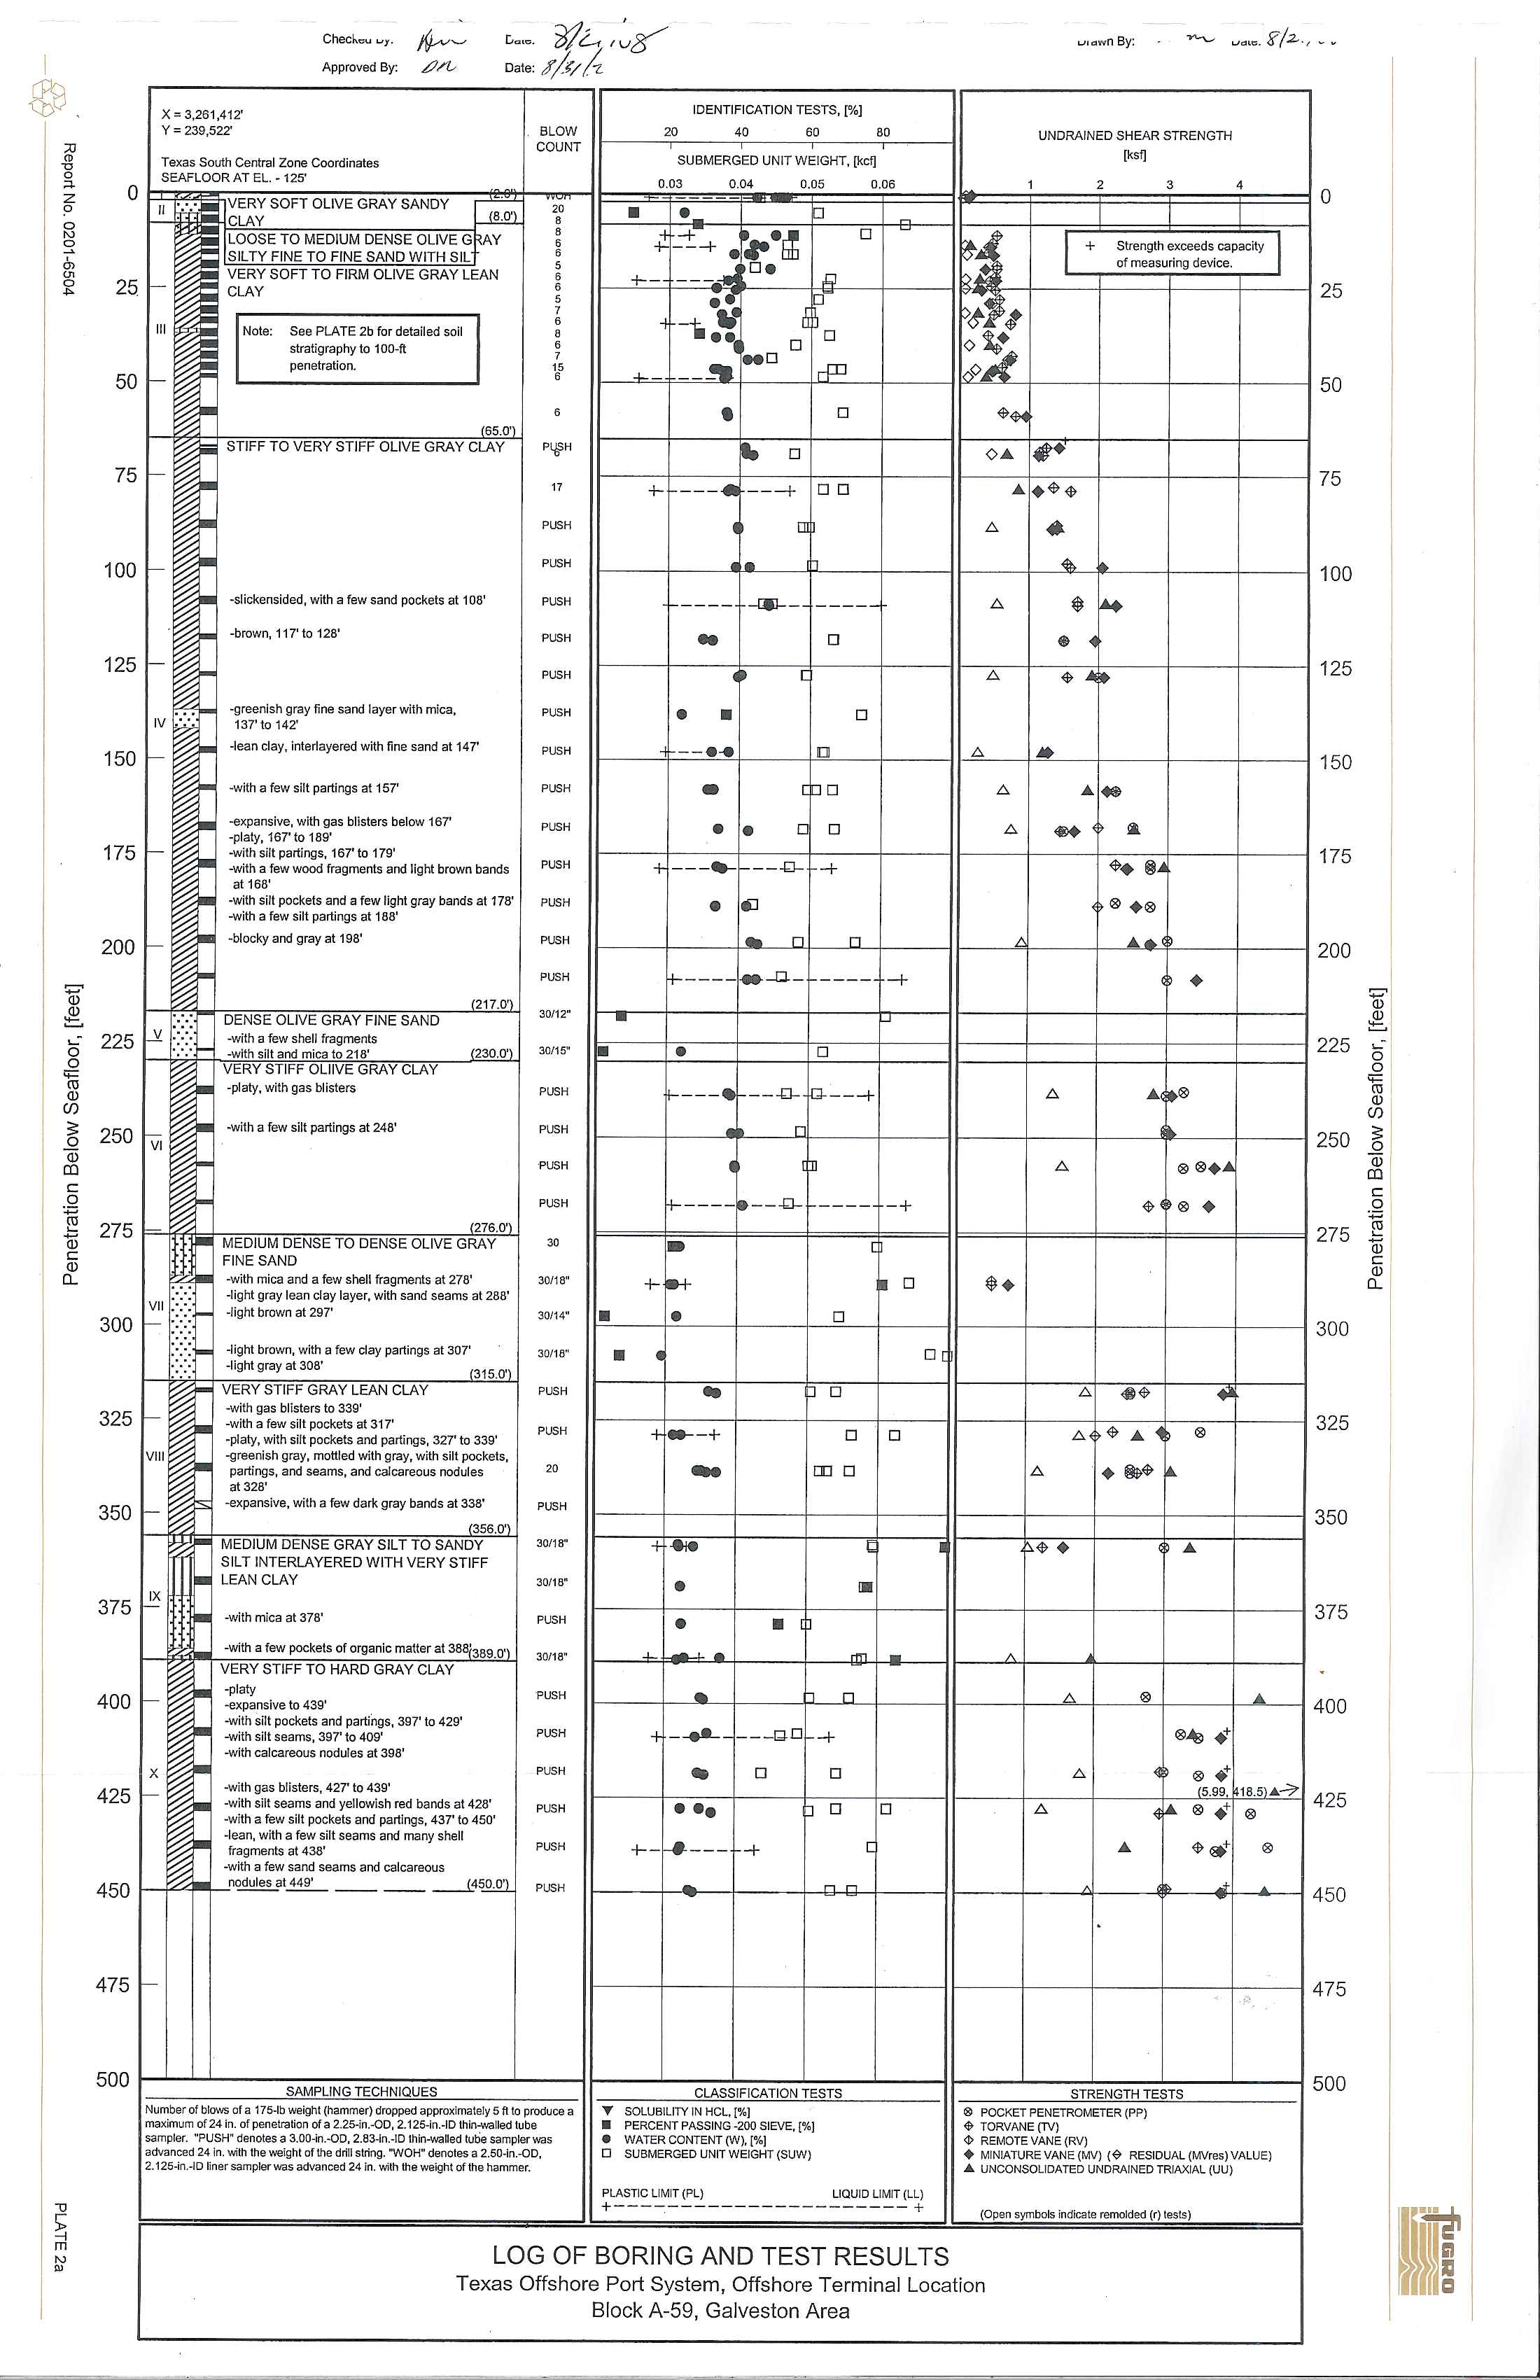
Texas
South Centra
l
Zone Coordinates
SUBMERGED
UN
I
T WEIGHT,
[kef]
SEAF
L
OOR
A
T
EL.
-
125'
0.03
0
.
0
4
0.05
0,06
1
2
3
4
I=f
'':''
VERY
SOFT OLIVE
GRAY SANDY
~
20
•
•
P
I
I
I
r-
CLAY
-"!IQ1.
8
LOOSE TO
MEDIUM
D
E
NSE
OLIVE G
~Y
8
+!
+
...
~
0
~.(
I
•
--+ •
+
Strengt
h
exceeds
caPac
i
t
y
)
~
SILTY F
I
NE
T
O F
I
NE SAN
D
WITH
S
I
L
6
of meas
ur
i
n
g
d
evice
.
S
O
.
~~
V
ERY SOFT TO FIRM O
LI
VE GRAY
L
EAN
•
+-
-
--
-
...!
.!J
I-
6
CLAY
s
.~-:
p~
•
7
-'i.
"
0
III
!!
Note:
See PLATE
2b
for detailed soi
l
,
••
0
o~+
st
r
atigraphy to 100
-
ft
•
0
~
7
"0
boA
penetrat
i
on.
15
.~
rfI!
I-
..
6
o
25
50
•
•
•
0
$<M
165
.
0')
iii
STIF
F
TO
VERY STIFf
O
LI
VE GRAY
CLAY
P
W
H
•
0
0'"
~.
l-
•
17
+-
--
-
.
--
-+
D
O
'" +$ $
75
'""
PUSH
[]
1:0.
..
I-
'""
P
US
H
•
$.
100
•
-slickensided,
wit
h
a few sand
pocke
t
s at
l
OS'
PUSH
--
-
-
~-
--
---
1:0.
*
....
-
-brow
n
,
11
7'to 128'
PUSH
..
0
.
~
I-
-
PUSH
[
1:0.
$
~
•
125
.-
-green
i
sh gray fine
sand laye
r
with
mica,
PU
S
H
•
•
0
I
V"
137' to
142'
I-
-
-lean clay, interlayered
with
fine
sand
at 147'
P
US
H
--...
D
1:0.
•
150
-
-with a
few silt part
i
ngs at
1
57'
PUSH
•
[
PO
1:0.
"'*
•
-e
xp
ansive, w
i
th
gas
b
l
i
sters below 167'
P
US
H
•
•
0
0
1:0.
e+
!It.
-platy, 167'10
189'
l-
•
-with
sill
partings, 167' to 179'
PUSH
-with
a few wood fragments
and
light brown bands
+
$+
!I~
--
-
--.
--
.Q-
+
175
at 168
'
•
-with s
i
l
t
pockets and a few lig
h
t
gray
b
ands at 178'
PUSH
•
tJiJ
® +®
-with
a few silt partings
at
188'
l-
•
-
blocky
and gray at 198'
PUSH
..
n
n
"
"'.
200
PUSH
ft-----
_...!:l_
-
---
-t-
+
1217.Q1
DENSE OLIVE
GRAY
FINE
SAND
301
1
2
"
•
f-'
'ii3
~
.:i
.....
-with
a few shell
fragments
(230.0'
3
0
/
15
"
•
•
..
0
-with
sill and mica
to 218'
VERY ST
I
FF OU
I
VE GRAY C
L
AY
225
.:
0
0
0=
""
-platy, with
gas blisters
PUSH
i--
--
.
-
-.Q-
0---+
1:0.
'"
.®
en
Q)
ro
Vi
""
-with
a
few
silt
parlings at
248'
PUSH
L
~
PUSH
D
1:0.
®®+~
250
:;:
0
Qi
Q)
~
P
US
H
+--
--
-
~
--.Q-
----
-
+
$
®
+
(276.0'
""
MEDI
U
M
D
ENSE TO DENSE
O
LI
VE GRAY
30
-
FI
NE
SAND
.""
-with mica and a few
shell fragme
n
ts at
278'
30
/1S
"
+-
~
~
0
*+
VII :-:-
-
l
ig
h
t gray lean
clay
layer,
with sand seams
at
288'
:~
-
li
g
h
t
brown at
297'
301
1
4"
•
•
_
....
0
c
0
275
~
~
Q5
c
Q)
D-
300
:~
-light b
r
ow
n
, with
a
few
clay partings at
307'
30
f
1
S
"
•
•
0
-
l
ight gray
at
308
'
...
1315.0')
VERY
STIFF
GRAY
LEAN CLAY
P
USH
..
J 0
1:0.
.$
~
-
-with
gas blisters to
339'
""
-with a few s
il
t pockets
at
3
1
7'
PUSH
+
$",1
®
-
platy,
w
i
th silt pocke
t
s and
partings, 327' to 339'
---+
0
0
1:0.
325
VIII
""
-greenish
gray, mottled with
gray, with silt
pockets,
+ &$
..
partings, and
seams, and c
al
careous nodules
20
-
rno
1:0.
at 328'
-
is
-expansive, with
a few dark
g
r
ay
bands at 338'
PUSH
350
135M>
MEDIUM DENSE
GRAY SIL
T
TO
SANDY
3
011
8"
+
-
~
I
$+
'"
SILT
INTERLAYERED
WITH VERY
S
T
IFF
""
LEAN CLAY
30/1S
"
•
III
~
-
""
-with
mica at 378'
PUSH
•
•
375
-with
a few pockets of organic matter at 388(389.0'1
301
1S
"
•
""
A
VERY STIFF
T
O
H
ARD
GRAY
CLAY
""
-p
l
aty
PUSH
..
J
0
1:0.
®
'"
-
-expa
n
sive
to
439'
400
""
-wi
t
h
s~t
pockets and
partings, 397'
to 429'
P
US
H
+
--.a-
-
__ -QO
®~
-wi
t
h
silt
seams
,
397'
to 409'
+
.;
-with
calcareous nodules
at 398'
X
""
PU
S
H
..
0
0
1:0.
®.;
-
-with gas
b
lis
t
e
r
s
,
427' to 439'
-".99
18
.
""':;'
""
-with silt seams and
yellowish
r
ed bands
at 428'
P
US
H
•
••
0
0
1:0.
~
I"'®';
®
-w
i
th a few silt pockets
and
partings, 437' to 450'
425
'"'
-lean, with
a few
sill seams and many shell
P
US
H
~-
--
[
'"
$fiJ/
®
fragments
at
438
'
+--
-+
-
w
ith a
few sand seams and ca
l
careous
nodulesa
l
~
____
--.-kf~
PUS
H
4
5
0
-
475
SAMPLING
TECHNIQUES
CLASS
I
F
I
CATION
TESTS
STRENG
T
H TESTS
500
Num
ber
of blows
o
f
a 175-1b weight (hammer) dropped approx
i
mately
5
ft
to
produce a
T
SOLUB
I
LITY
IN
HCl,
[
%
]
®
POCKET PENETR
O
METER
(
PP)
maximu
m
o
f
241n.
of
penetra~on
of a
2
.
25
-i
n
.
-OO, 2
.
125-1n.-10 thin-walled tube
•
PERCENT
PASSING
-
200 SIEVE, (%
]
+
TORVANE
(TV)
sampler
.
.PUSH" denotes
a 3.00-in.-00, 2
.
83
-
ln
.
-l0
thln-walled tube sampler
wa
s
•
WATER
CONTENT
(W)
,
{%]
<1>
REMO
T
E VANE
(RV)
advan
ce
d 24
1
n
.
with
the weigh
t
of
the drill
string
.
-WOH"
deno
t
es a 2.50
-
ln.
-
00,
0
SUBMERGED UNIT
WEIG
H
T
(SUW)
•
M
I
NIATURE VAN
E
(MV)
(~
RESIDUAL (MV
r
es) VALUE)
2
.
125
.
in
.
-
ID
Uner
s
ampler-was
advanced 24
I
n
.
with
the weight of the hammer
....
UNCONSO
LI
DATED UNDRA
I
NED
TR
I
AX
I
AL (UU)
PLASTIC
LIM
I
T
(PL
)
LIQUID L
I
M
I
T
(L
l)
+-
-
-~---
-----
-------
---
+
(Open s
ym
bols
in
dicate
remolded
(
r
)
tes
ts
)
LO
G
O
F BO
RIN
G
AN
D
T
E
ST R
E
SUL
T
S
Texas Offshore Port Sys
t
em, Offshore
T
erm
i
nal Location
Block
A
~
59.
Galveston Area
-
-
~
~
1
@
"0
iii'
o
"
Z
~
o
'"
~
.;,
'"
'ii!
~
~
.c-
o
O
<+=
'"
tll
(f)
Qi
~
tIl
c
o
Q)
~
c
tll
0..
"U
~
'"
C"
£?<-
Oat"
r!!l2b lUiS
Date
;;1/"4
Checked By
:
~
Drawn By
:
/"'.
.
v\
1
Date
:
g
/26'10 0
Approved
By
:
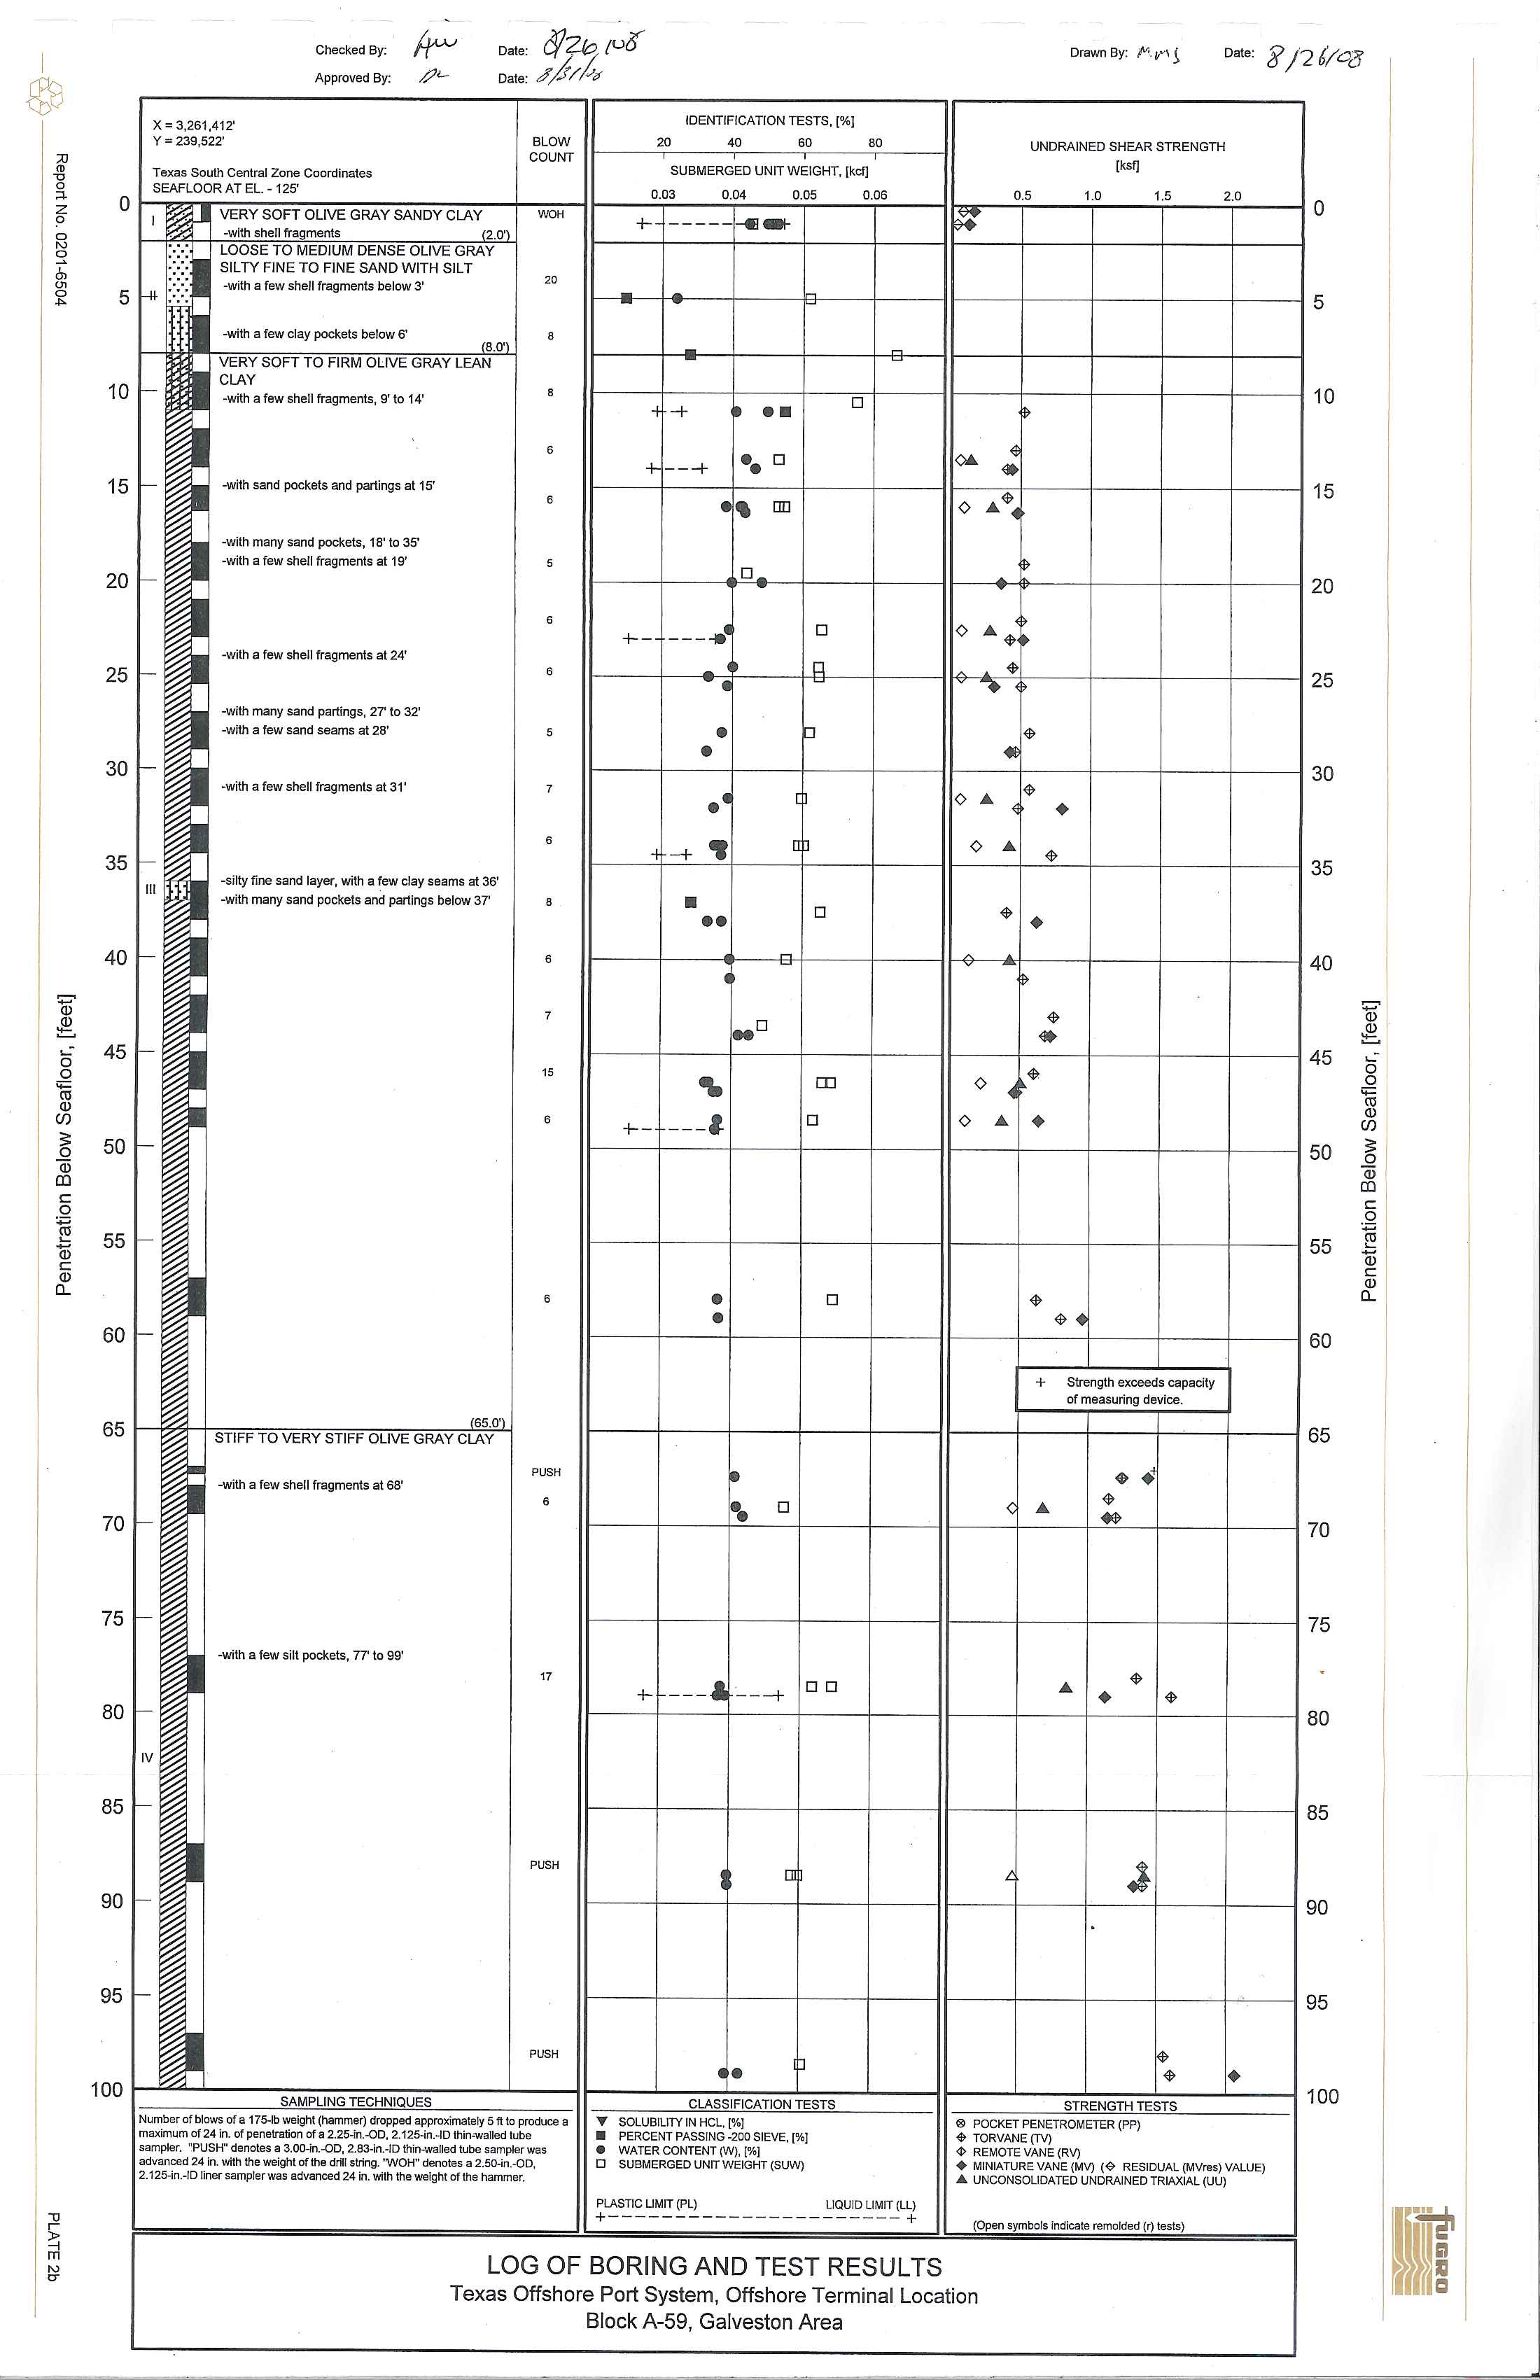
IDENTIF
ICATION
TESTS,
[%j
X=3
,
261,412'
Y
'"
239
,
522'
Texas So
u
th Ce
ntral Zone
Cocrdina1es
SEAFLOOR
AT EL. - 125'
BLOW
COUNT
20
40
60
80
SUBMERGED UNIT
WEI
GH
T,
[kef]
UNDRAIN
ED
SHEAR STR
E
NGTH
[ksij
o
0.03
0.04
0.05
0.06
0.5
I
VERY SO
FT
OLIVE GRAY
SANDY ClAY
-I-
~-
----
I
-iII
__
I
k~
.wHh
shell
fragment
s
2.
~
L
OOSE
TO
M
EDIU
M
DEN
SE
OLI
V
E GRAY
S
I
LTY
FINE TO
FINE
SAN
D
W
I
TH
S
ILT
5
-with
a
few shell fragments below
3'
10
t
15
I-
20
I-
25
30
I-
35
l-
-wit
h
a few clay
pockets
below
6'
(S
.O')
VERY SOFT
TO
FIRM OLIVE
G
RAY LEAN
ClAY
-with a few shell fragments
,
9
'
to
14'
-with
sand
pockets and
partings at
15'
-with many sand pockets,
18'
to
35'
-with
a few shell
fragments
at 19'
-with a few
shelt
fragments at 24'
-w
it
h
many
sand partings,
27'
t
o
32'
-with
a
few
sand
seams at 28'
-
w
ith
a few shell fragments
at
3
1'
I
-sllty
fine
sand layer,
w
i
th
a few
clay
seams at
36'
III
.
-with
many
sand poc
kets
and
partIng
s
below
37'
40
l-
45
I-
50
I-
55
I-
~
J
60
I-
20
8
•
•
•
s
7
•
•
•
7
15
•
8
-1+-+
••
o
~
II
1---+
I..
0
I
I
II:J
°
",,$~
~.
IlIl
i,Q
-1--
+
--
-
"
.
I
•
•
.'1
~-
+.
I
D
•
••
'It
-1-
-+---1
•
1
..
0
o
1
[:\
p
o
rn
o
o
10
""$
<I
..
...
1$
10 "" J$ •
° ""
I
$
$,
•
$
*
<>
l
+:
~
°
""
I
.
$
$.
+
Strength exceeds capacity
of measuring
device.
65.0'
65
ST
I
FF
TO
VERY STIFF OLIVE GRAY
ClAY
~.
o
P
USH
•
-
with a few shell fragments
at
68'
70
I-
"
-I-f----.
--
--t
PUSH
[]
PUSH
<
""
DO
""
,
•
•
$
*
$
•
1
$
J
100
SAMPLING TECHNIQUES
CLASSIFICATION
TESTS
STR
E
NGTH TESTS
Numb
er
of
blows
of
a
1
75-1b
weight
(hammer) dropped approximately 5
11
to
produce
8
T
SOLUB
ILITY
IN HC
L,
[
%]
@
POCKET
PEN
ETROMETER
(PPJ
maximum
of2
4
in.
of
penetration
of a 2.25
./
n.-OO
,
2
.1
25-in.-ID
Ihin.:wall
e
d
tube
•
PERCENT PAS
S
ING
.
200 S
I
EVE,
[
%J
•
T
ORVA
N
E
(TV)
samp
l
er
.
"PUS
H"
denotes a 3.OIJ-.ln.-OO,
2.83-in.-l0 thin-wa
ll
e
d tube
samp
l
er was
•
WATER
CON
TENT
(W)
,
[%
]
~
REMOTE VANE
(RV)
•
advanced 24 in
.
with the weight
of
the
drill
string
.
'WOH" denotes
a
2.5Q.in
.-
OD,
0
SUBMERG
E
D UNIT WEIGHT (SUW)
•
MINIATURE VANE (MV)
(~
RESIDUAL (MVres) VAL.UE)
2.
125-ln.
-
10
l
iner sampler
was advanced
24
in
.
with the weight of the hammer
....
UNCONSQL.IDATED UNDRA
I
NED
TRIAXIAL
(UU}
PLASTIC UMIT
(
PL)
LI
Q
U
I
D LI
MIT
(
LL
)
+-
--
----
-
------
-
---
-
---
+
LOG OF BORI
N
G
AND
TEST RES
ULT
S
Texas
Offshore Port System, Offshore
Terminal
Location
Block
A
-59
,
Galveston Area
in
dica
te
r
emolded (
r)
t
ests
)
o
5
10
15
20
25
30
35
40
45
50
55
60
65
70
75
80
85
90
95
100
~
~
.c-
o
O
<+=
'"
tll
(f)
Qi
~
tIl
c
+J
o
[ll
Q)
C
tll
0..
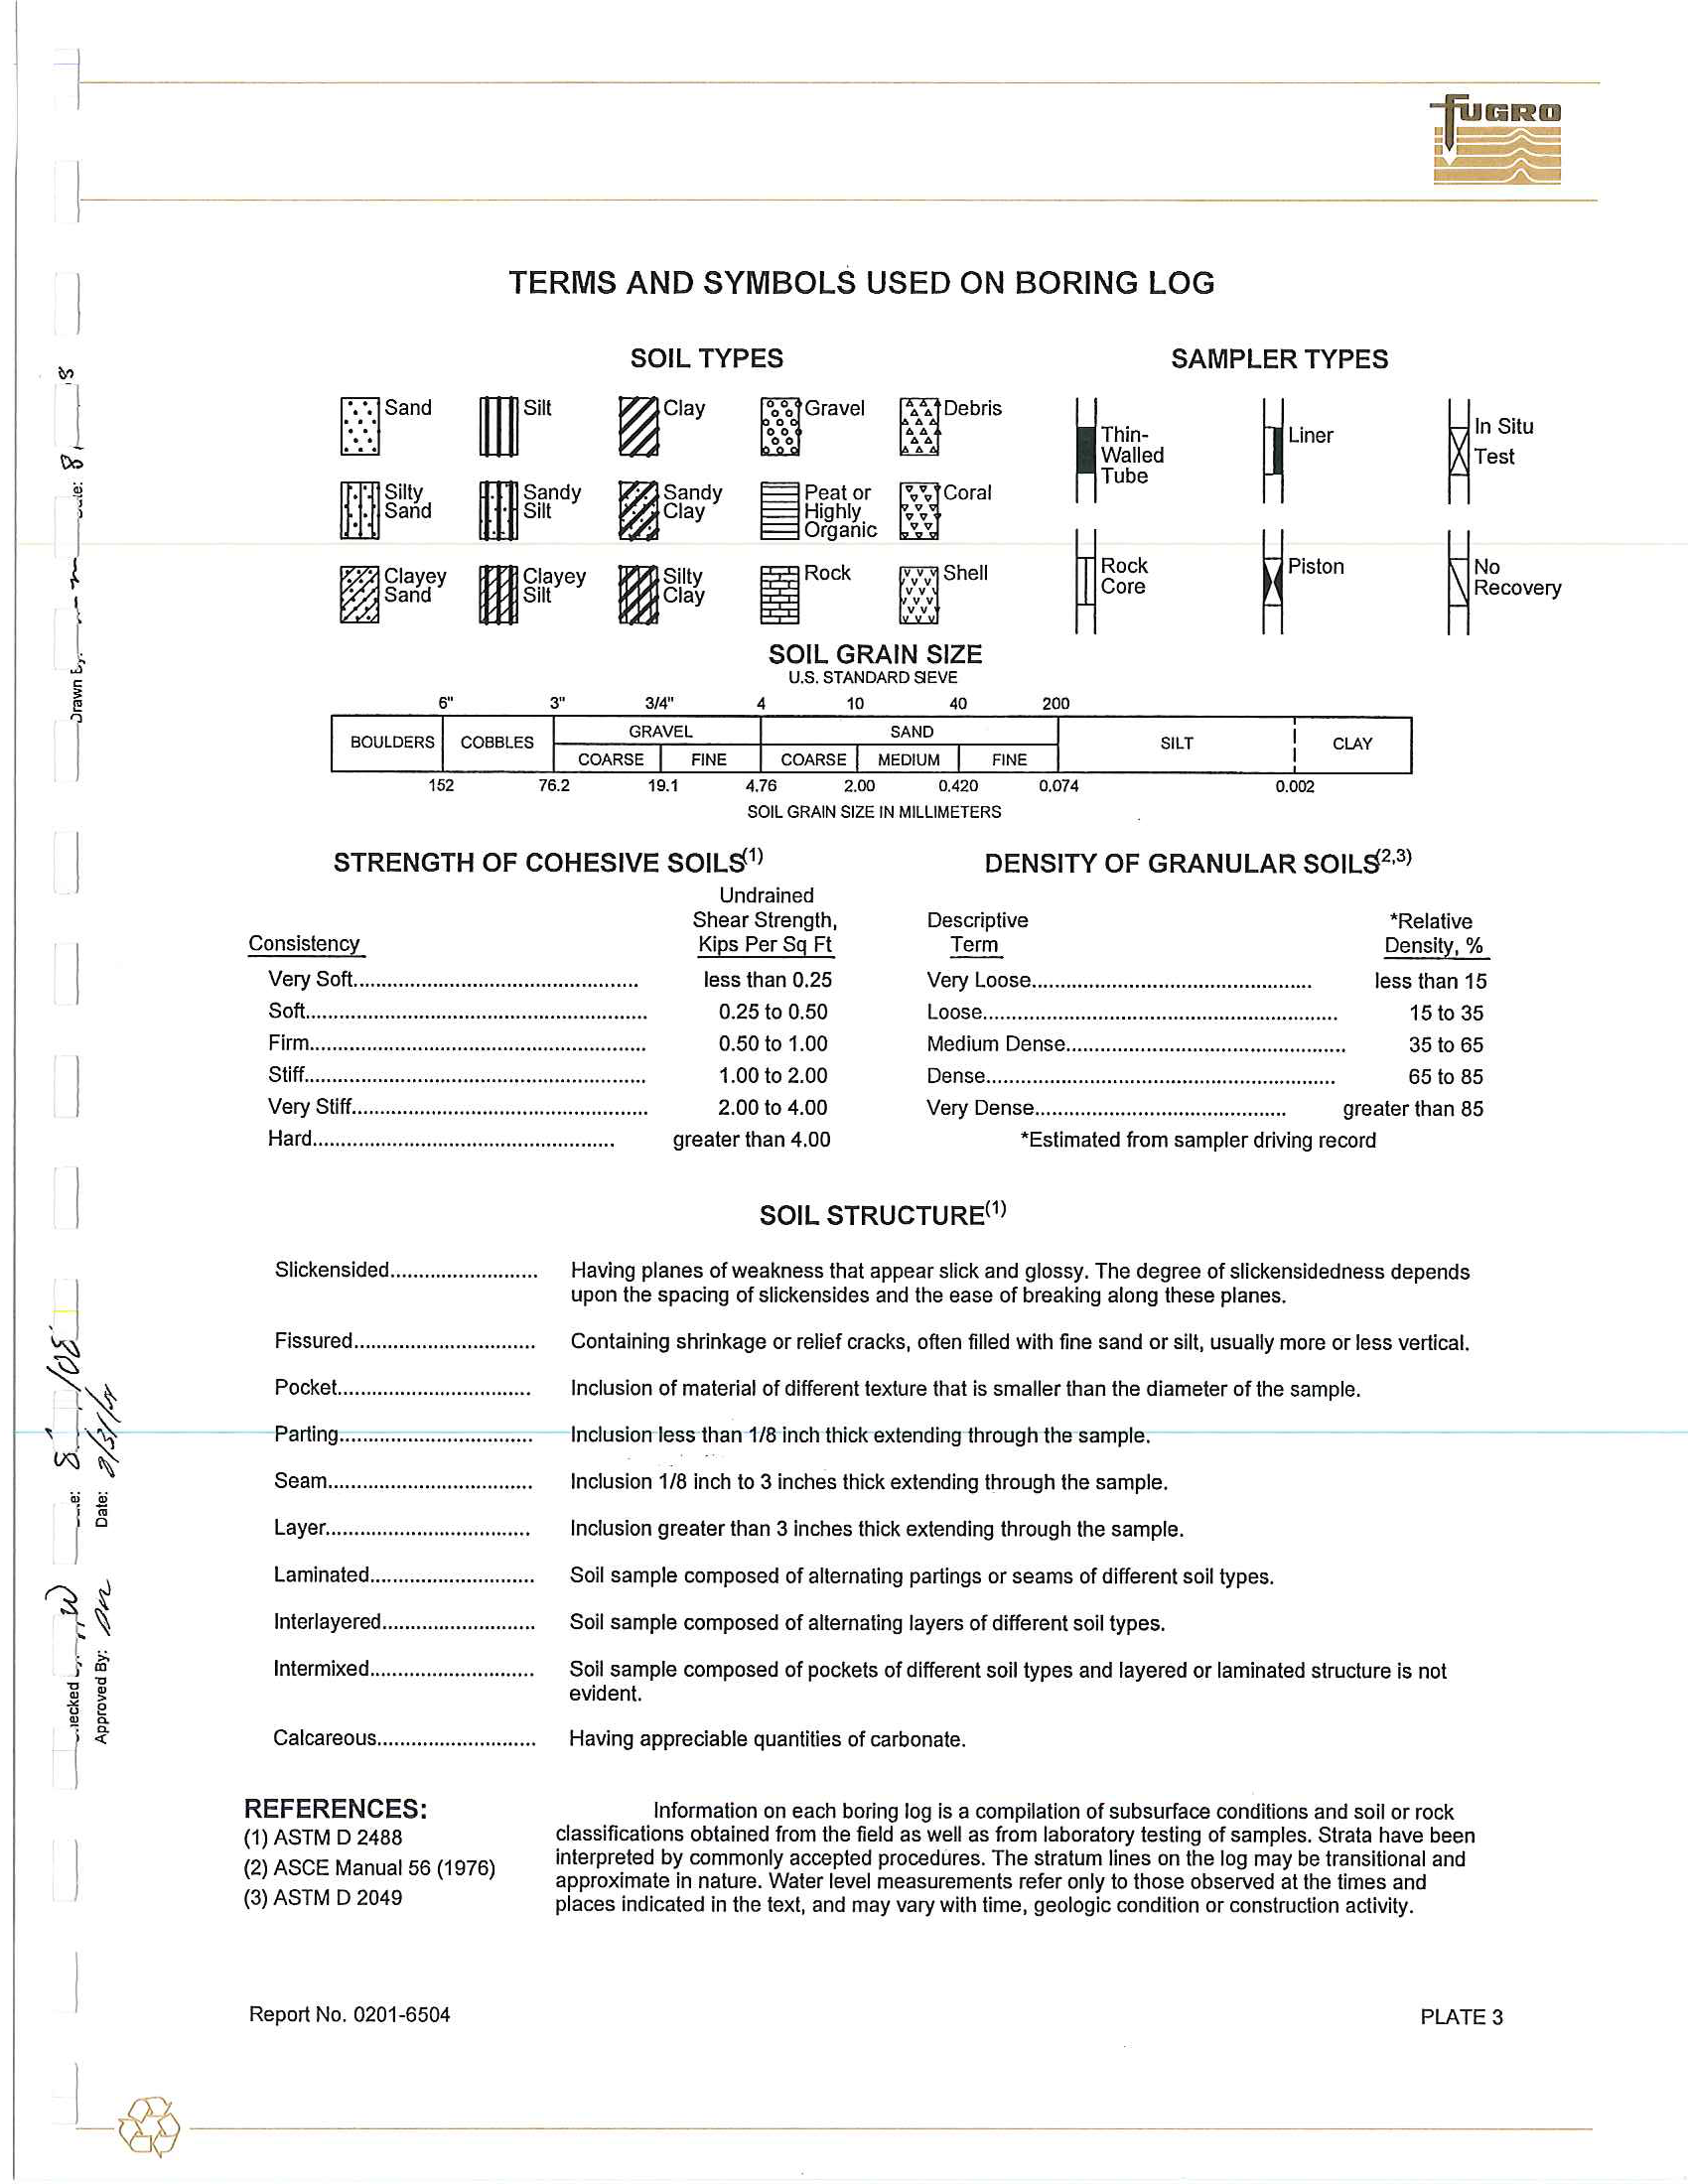
TERMS AND SYMBOLS USED ON BORING LOG
SO
IL
TYPES
SAMPLER TYPES
DSand
m
Sili
~Clay
~GraVe
l
[JDebr
i
S
.....
°0°0
.
Wa
ll
ed
Test
~
~Thin-
Liner
~lnSilU
Tub
e
[j]SilIY
[D8and
Y
~SandY
~peator
:"',,:
... Coral
•
Sand
. Silt
..
Clay
Hi
ghly
Organic
..
~
ROCk
~PiSlon
~NO
~Clayey
mClayey
mSillY
I
Rock
~Shell
•
Sand
S
ilt
C
la
y
n
..
Core
Recovery
n
SOIL GRAIN SIZE
u.s. S
T
ANDARD SEVE
3"
3/4"
'0
4
0
'00
COBBLES
GRAVEL
SAND
SILT
CLAY
COARSE
FINE
COARSE
MEDIUM
FINE
152
76.2
19.1
4.76
'
.00
0.420
0.074
0
.
002
SOIL GRAIN S
I
ZE
I
N
MILliMETERS
STRENGTH OF COHESIVE SOILS')
Undrained
DENSITY OF GRANULAR SOILS'.3)
Consistency
Shear Strength,
Kips
Per
Sq
Ft
Descriptive
Term
*Relative
Density,
%
Very Soft
.................................................
l
ess
than
0.25
0.25100.50
0.50101.00
1
.0
0102
.00
Very Loose................................................
less than
1
5
Soft
............................................................
Loose ........................................................
151035
35
to
65
65
to
85
Firm
...........................................................
Medi
u
m Dense
St
i
ff
............................................................
Dense............................................................
Very Stiff...............................................
.....
2.00
to
4.00
Very Dense................
............................
g
r
eater
than
85
H
ard.........
............................................
greater than
4.00
*Eslimated from
sample
r
driving record
Slicke
nsi
ded..........................
Fissured ....................
Pocket. .......
Parting ......
Seam
..........
L
ayer
....................
,..
•
,.""
.....,
L
am
in
ated
..................
Int
e
rla
yered
................
Int
erm
i
xed .............................
Ca
l
careous
.........................
,
..
REFERENCES:
(1) ASTM D
2488
(2) ASCE
Manual
56 (1976)
(3)
ASTM D 2049
Report No.
0201-6504
SOIL STRUCTURE!')
Having
planes of
weak
n
ess that appear slick
and
g
l
ossy.
Th
e
degree
of slickensidedness
depends
upon the
spacing
of
slickensides
and the ease o
f
breaking along
th
ese
planes.
Containing shr
in
kage
or
r
elief cracks,
often filled with fine
sand or silt,
usually more
or
less
vertical.
In
c
lu
sion
of materia
l
of different texture
that is
smaller than
the diameter of the
samp
l
e
.
Inclusion
l
ess
than
1/8
inch thick
extending through
the
samp
l
e.
Inclusion
1/8
i
nch
to
3
in
ches
thick
extending through the samp
l
e.
In
clusion
greater than 3
in
ches thick extending
through the
sample.
Soil sample composed
of alternating
partings
or seams of
different
soil
types.
Soil sample composed o
f
a
ltern
ating
la
yers
of d
iff
erent soil
types.
Soil sample
composed
of
pockets
of
different soil types
and
l
ayered
or
l
aminated str
u
cture
is not
evident.
Having appreciable quantities
of carbonate.
Inf
ormation on each
bor
i
ng log
i
s
a
compilat
i
on of subsurface conditions and sa
il
or
rock
classificat
i
ons obtained
from the
field as well as
f
rom
l
aboratory
testing
of sa
m
ples. S
tr
ata
have been
interpreted by
commonly accepted procedures.
The
stratum
l
ines on
the log may be
tr
ansitiona
l
and
app
r
oximate
in
nature.
Wa
t
er
l
eve
l
measurements refer
only
to those
observed a
t
the
times
and
places
indicated
in
the
text,
and may vary
with lime,
geologic condition
or conslruclion activ
it
y.
PLATE 3
I_
@
____________
________
__
I
I
~
~
~
I
;;
1i
0
I
'
*
1
6'1
~
1
0
I
"'"
OJ
~
...:
0
0
c;:::
C1l
OJ
(/)
~
0
Qi
Ol
c
0
:;::;
...
C1l
1ii
c
a..
OJ
l
~~
N'ti:
I
;:;;..~
;;
iii
iii
o
0
<Q
~
if.
~
~
>.
6'1
I
~
~
~
•
e
>
~
~
~
0
«
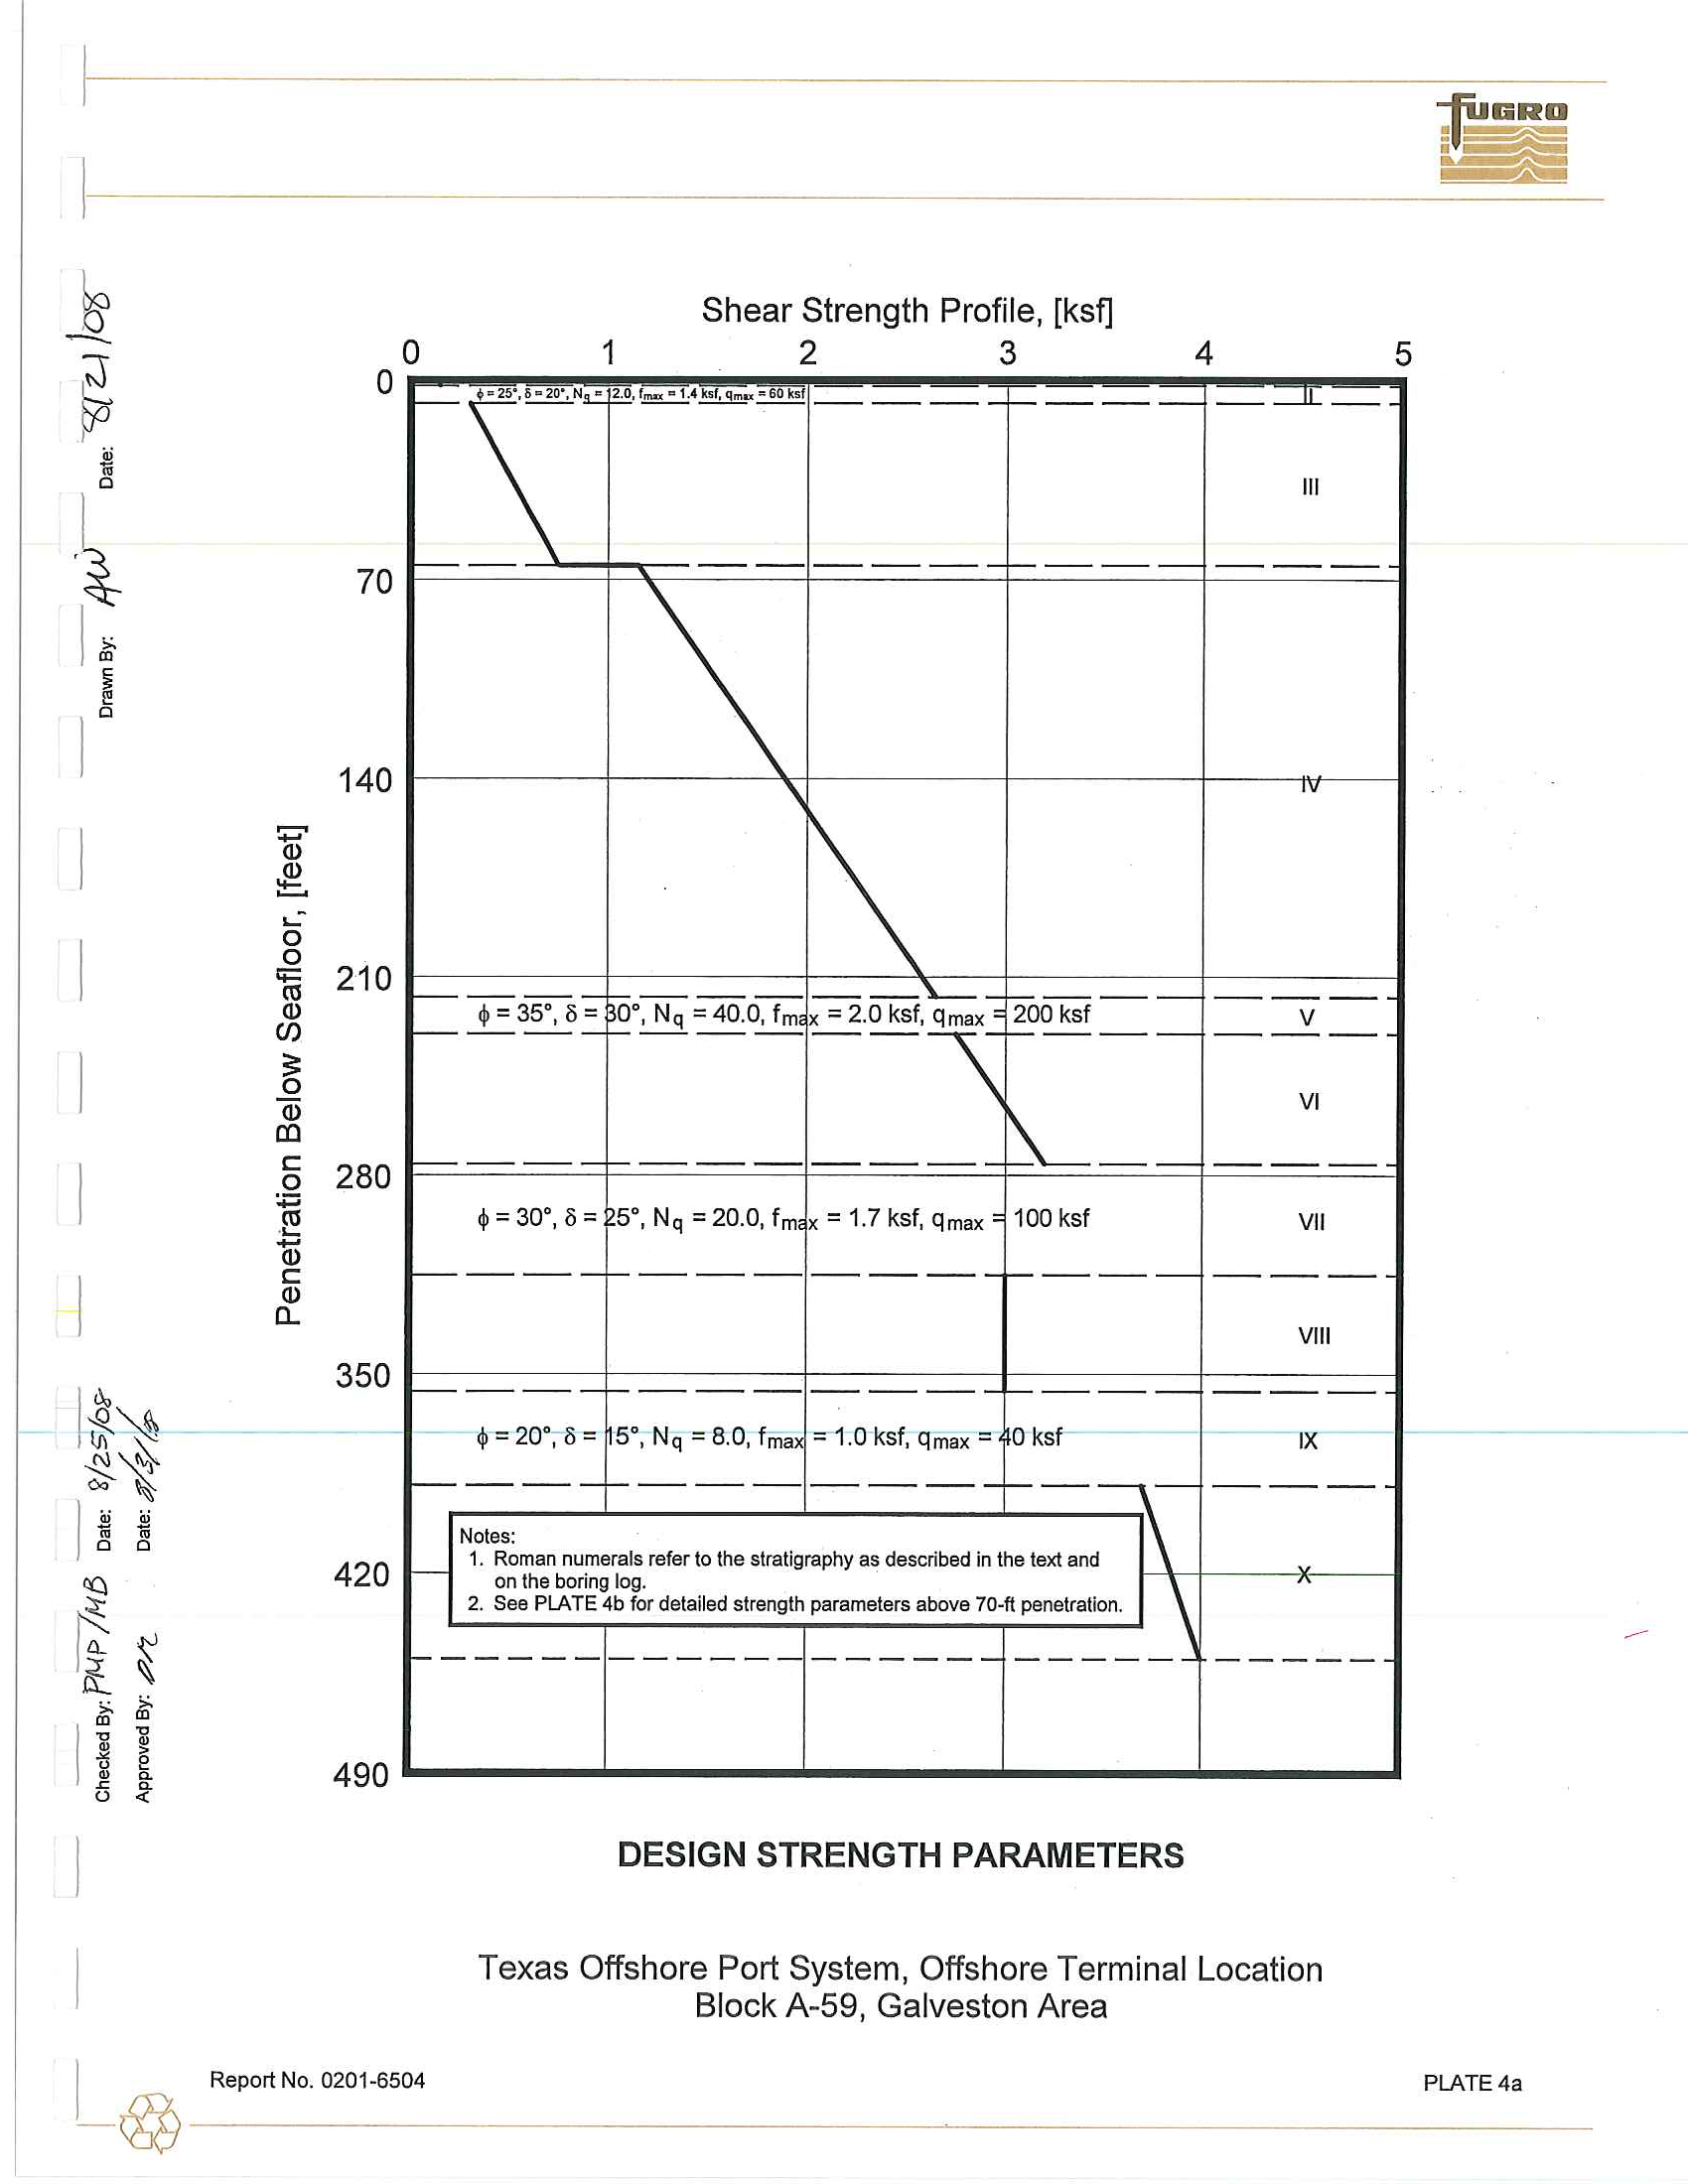
Shear Strength Profile, [ksf]
o
o
1
2
3
r--
'
~
2~
·
,6
-
20·.N.s..!.
~
,
r!!!5...!.!..4k1I,q
.......
~
4
--------
70
'--
.-
-
-
140
\
1\
-
$=35'
,6
;-
t-o.
---
--;~-
'200ksf-'-
0', N
q
= 40
.
0, fm
x
=
2.0
ksf, qmax '
----
c----
--\
r---'-
210
1\
280
-
.-
r-
.-
$=30',6= 5',
N
q
=
20
.
0
,
fm
x
=
1
.
7 ksf,
qmax'
100
ks
f
--_.-
,----
--_.---_.-
350
--_.-
----
---.-
---.-
$ =
20
', 6
=
5
°
,
Nq
=
8.0, f
ma
= 1
.
0
ksf,
q
max
=
o
ksf
--_.-
----
--_.-
f--
.
--.-
420
Notes:
1\
-
1
.
Roman numer
als
refer to the stratigraphy
as
described in
the
text
and
on
the
boring l
og.
\
2.
See PLATE 4b
for detailed
strength
parameters
above 70
-ft pe
ne
trati
on.
------
------------ ------
490
DESIGN
STRENGTH
PARAMETERS
_.---lL_
III
IV
---
-----
V
VI
VII
---
VIII
-----
I
X
---
X
Back to top
---
--
Texas
Offshore Port System, Offshore
Terminal
Location
Block
A
-5
9,
Galveston
Area
I
Report
No
.
0201.6504
-
~----------------~------
5
PLATE4a
1
I
D
~
I
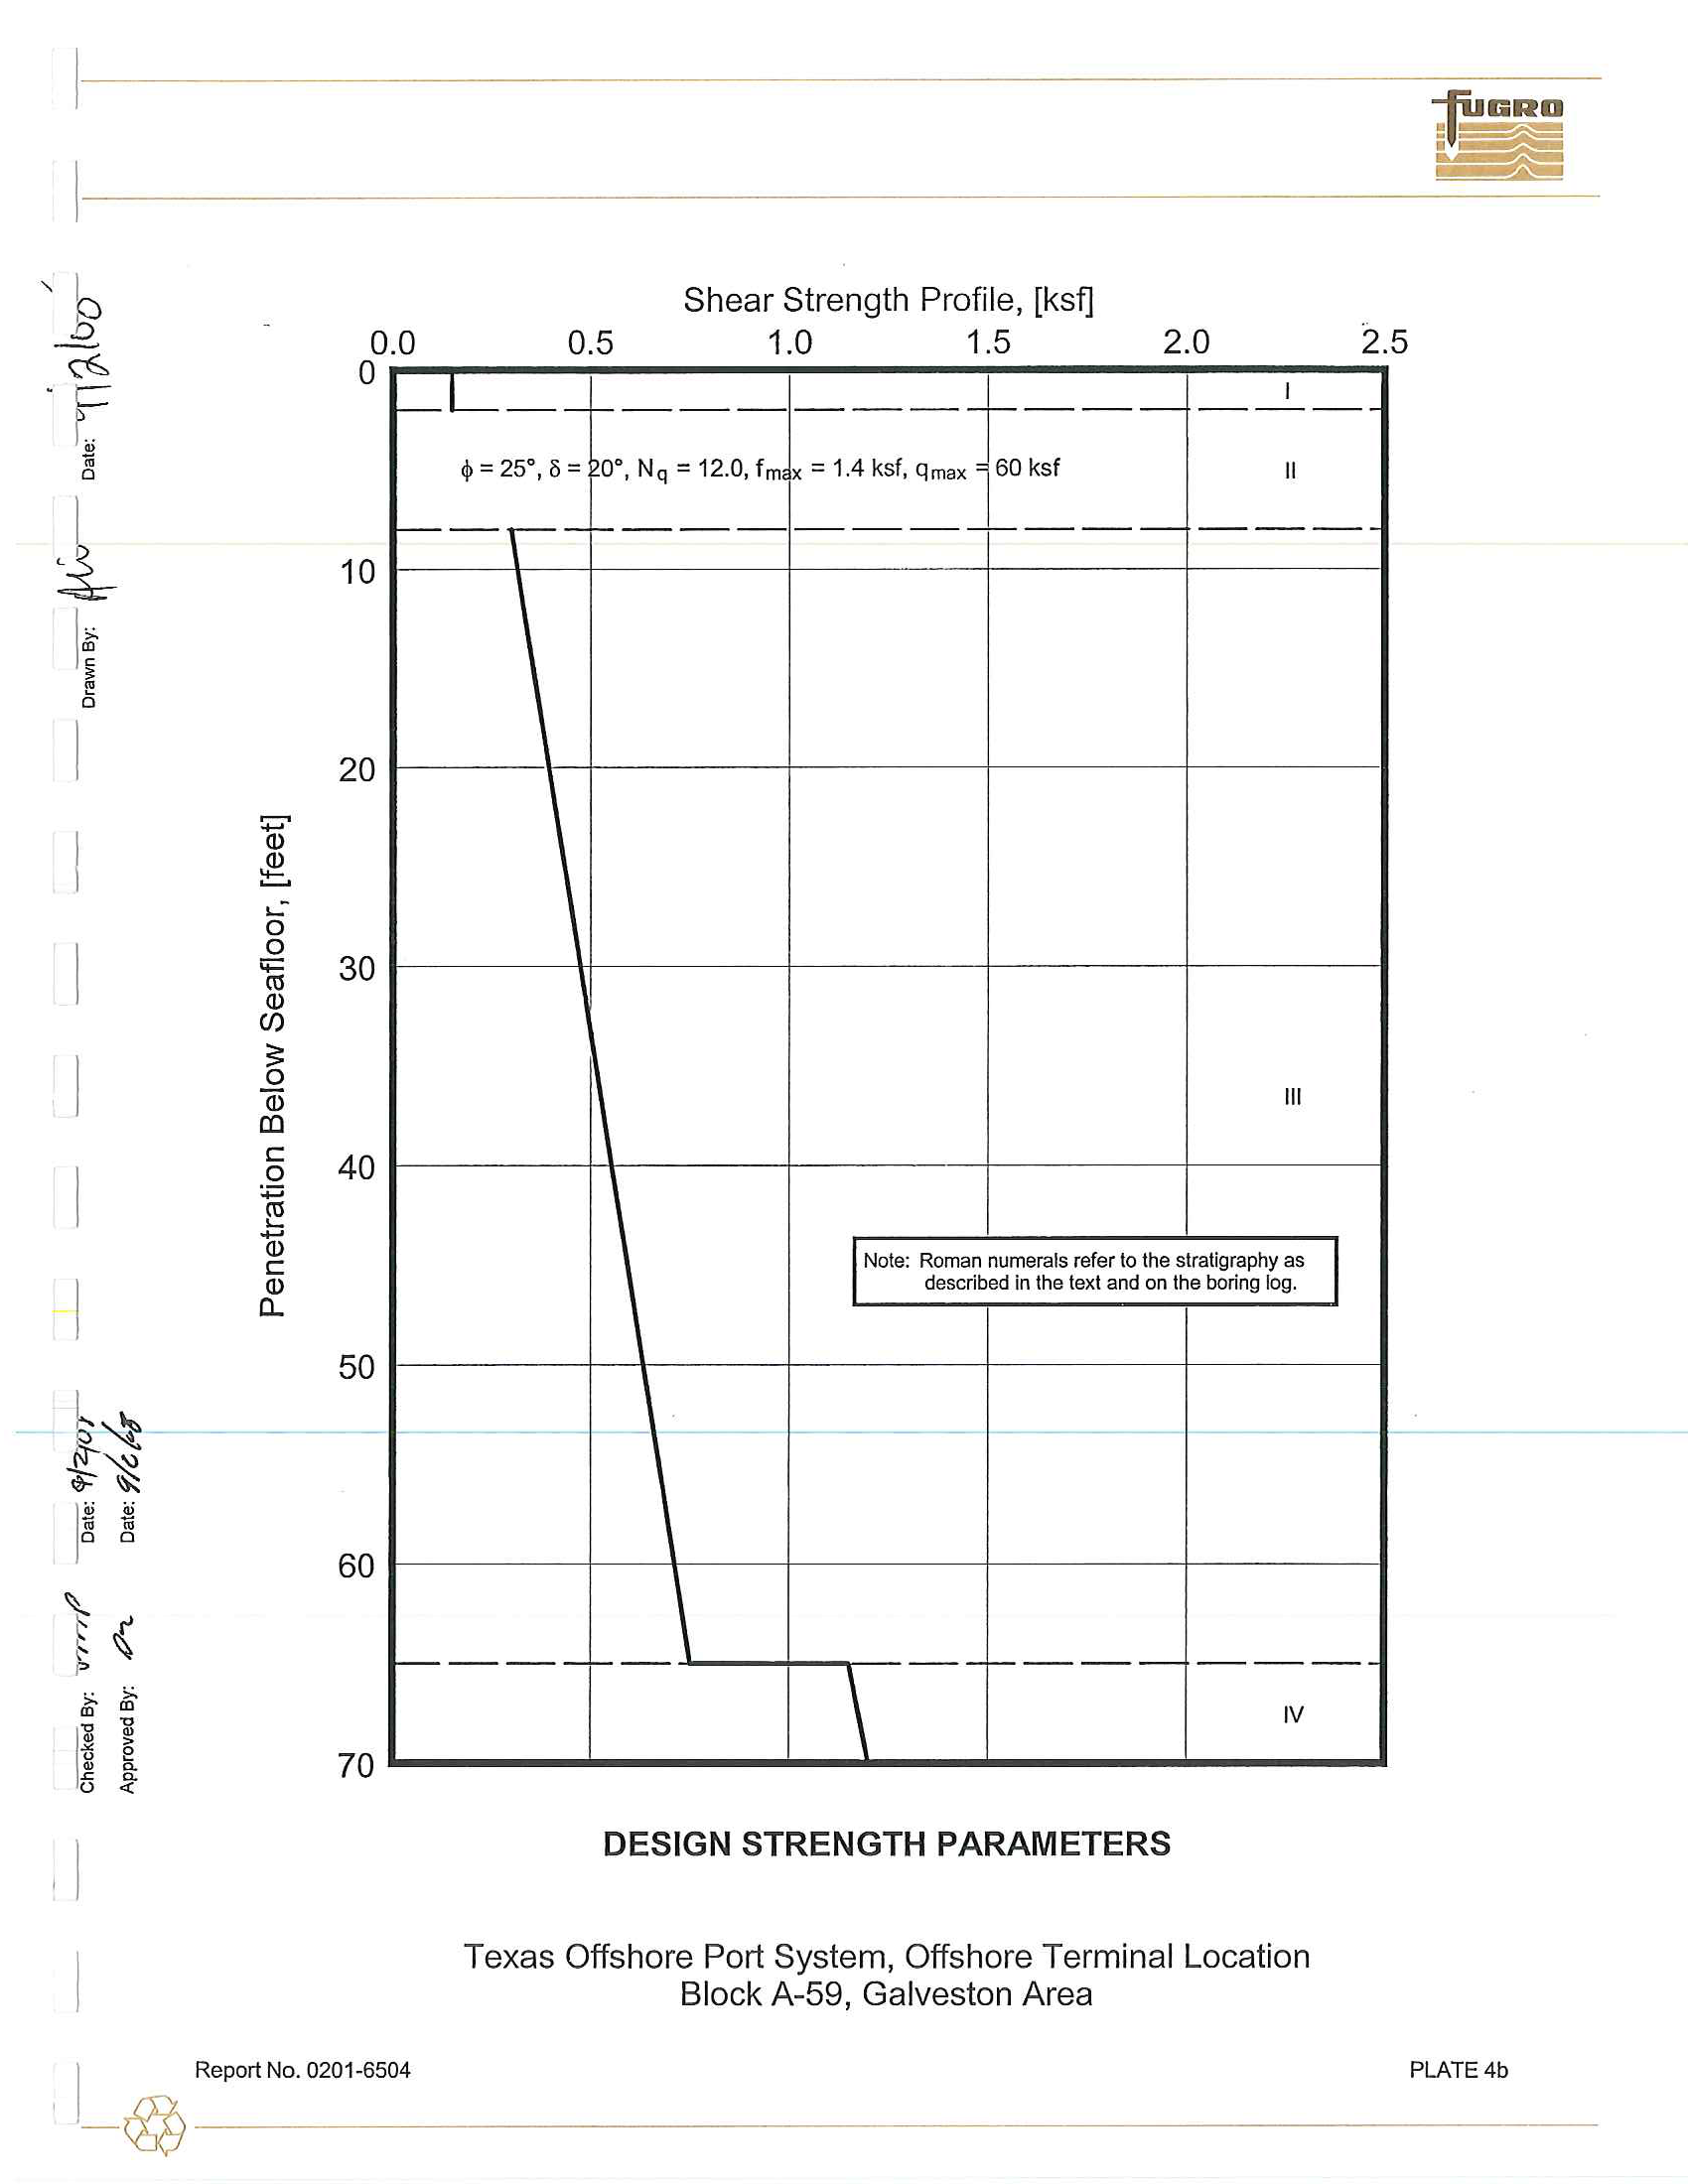
Shear Strength Profile, [ksf]
o
0.0
~L_._
0.5
1.0
1.5
2
.0
2.5
--
-t
--.-
I
Ql
~
....
-
o
10
20
'iii
30
Q)
(f)
5:
o
ill
a:l
§
40
:;:;
~
Q)
c
a..
Q)
50
60
70
1----
---
$
= 25',
B
=
0',
N
q
= 12.0, fm
x
= 1.4 ksf.
qmaXr
ksf
_._
II
~·-T--
1----
---
III
Note: Roman
numerals
refer to the
stratigraphy as
I
described in
the
text and on
the
boring log
.
-
,-----
C-
.-
1---'-
--_.-
\
IV
\
DESIGN STRENGTH
PARAMETERS
Texas Offshore Port System, Offshore Terminal
Location
Block
A-59, Galveston
Area
I
PLATE4b
Report
No.
0201.6504
-@----------------------
,...
Q)
~
.....
-
0
0
<+=
Q)
ro
(J)
:,:
0
Q)
al
c
0
:;:::
ro
-
.....
Q)
c
Q)
a..
I
~~
-
~
~t,;;
I
8
.
"
•
0
~
I
£~
"
..
>.
~
<D
<D
~
11
~
•
>
0
e
•
~
£
~
tJ
""
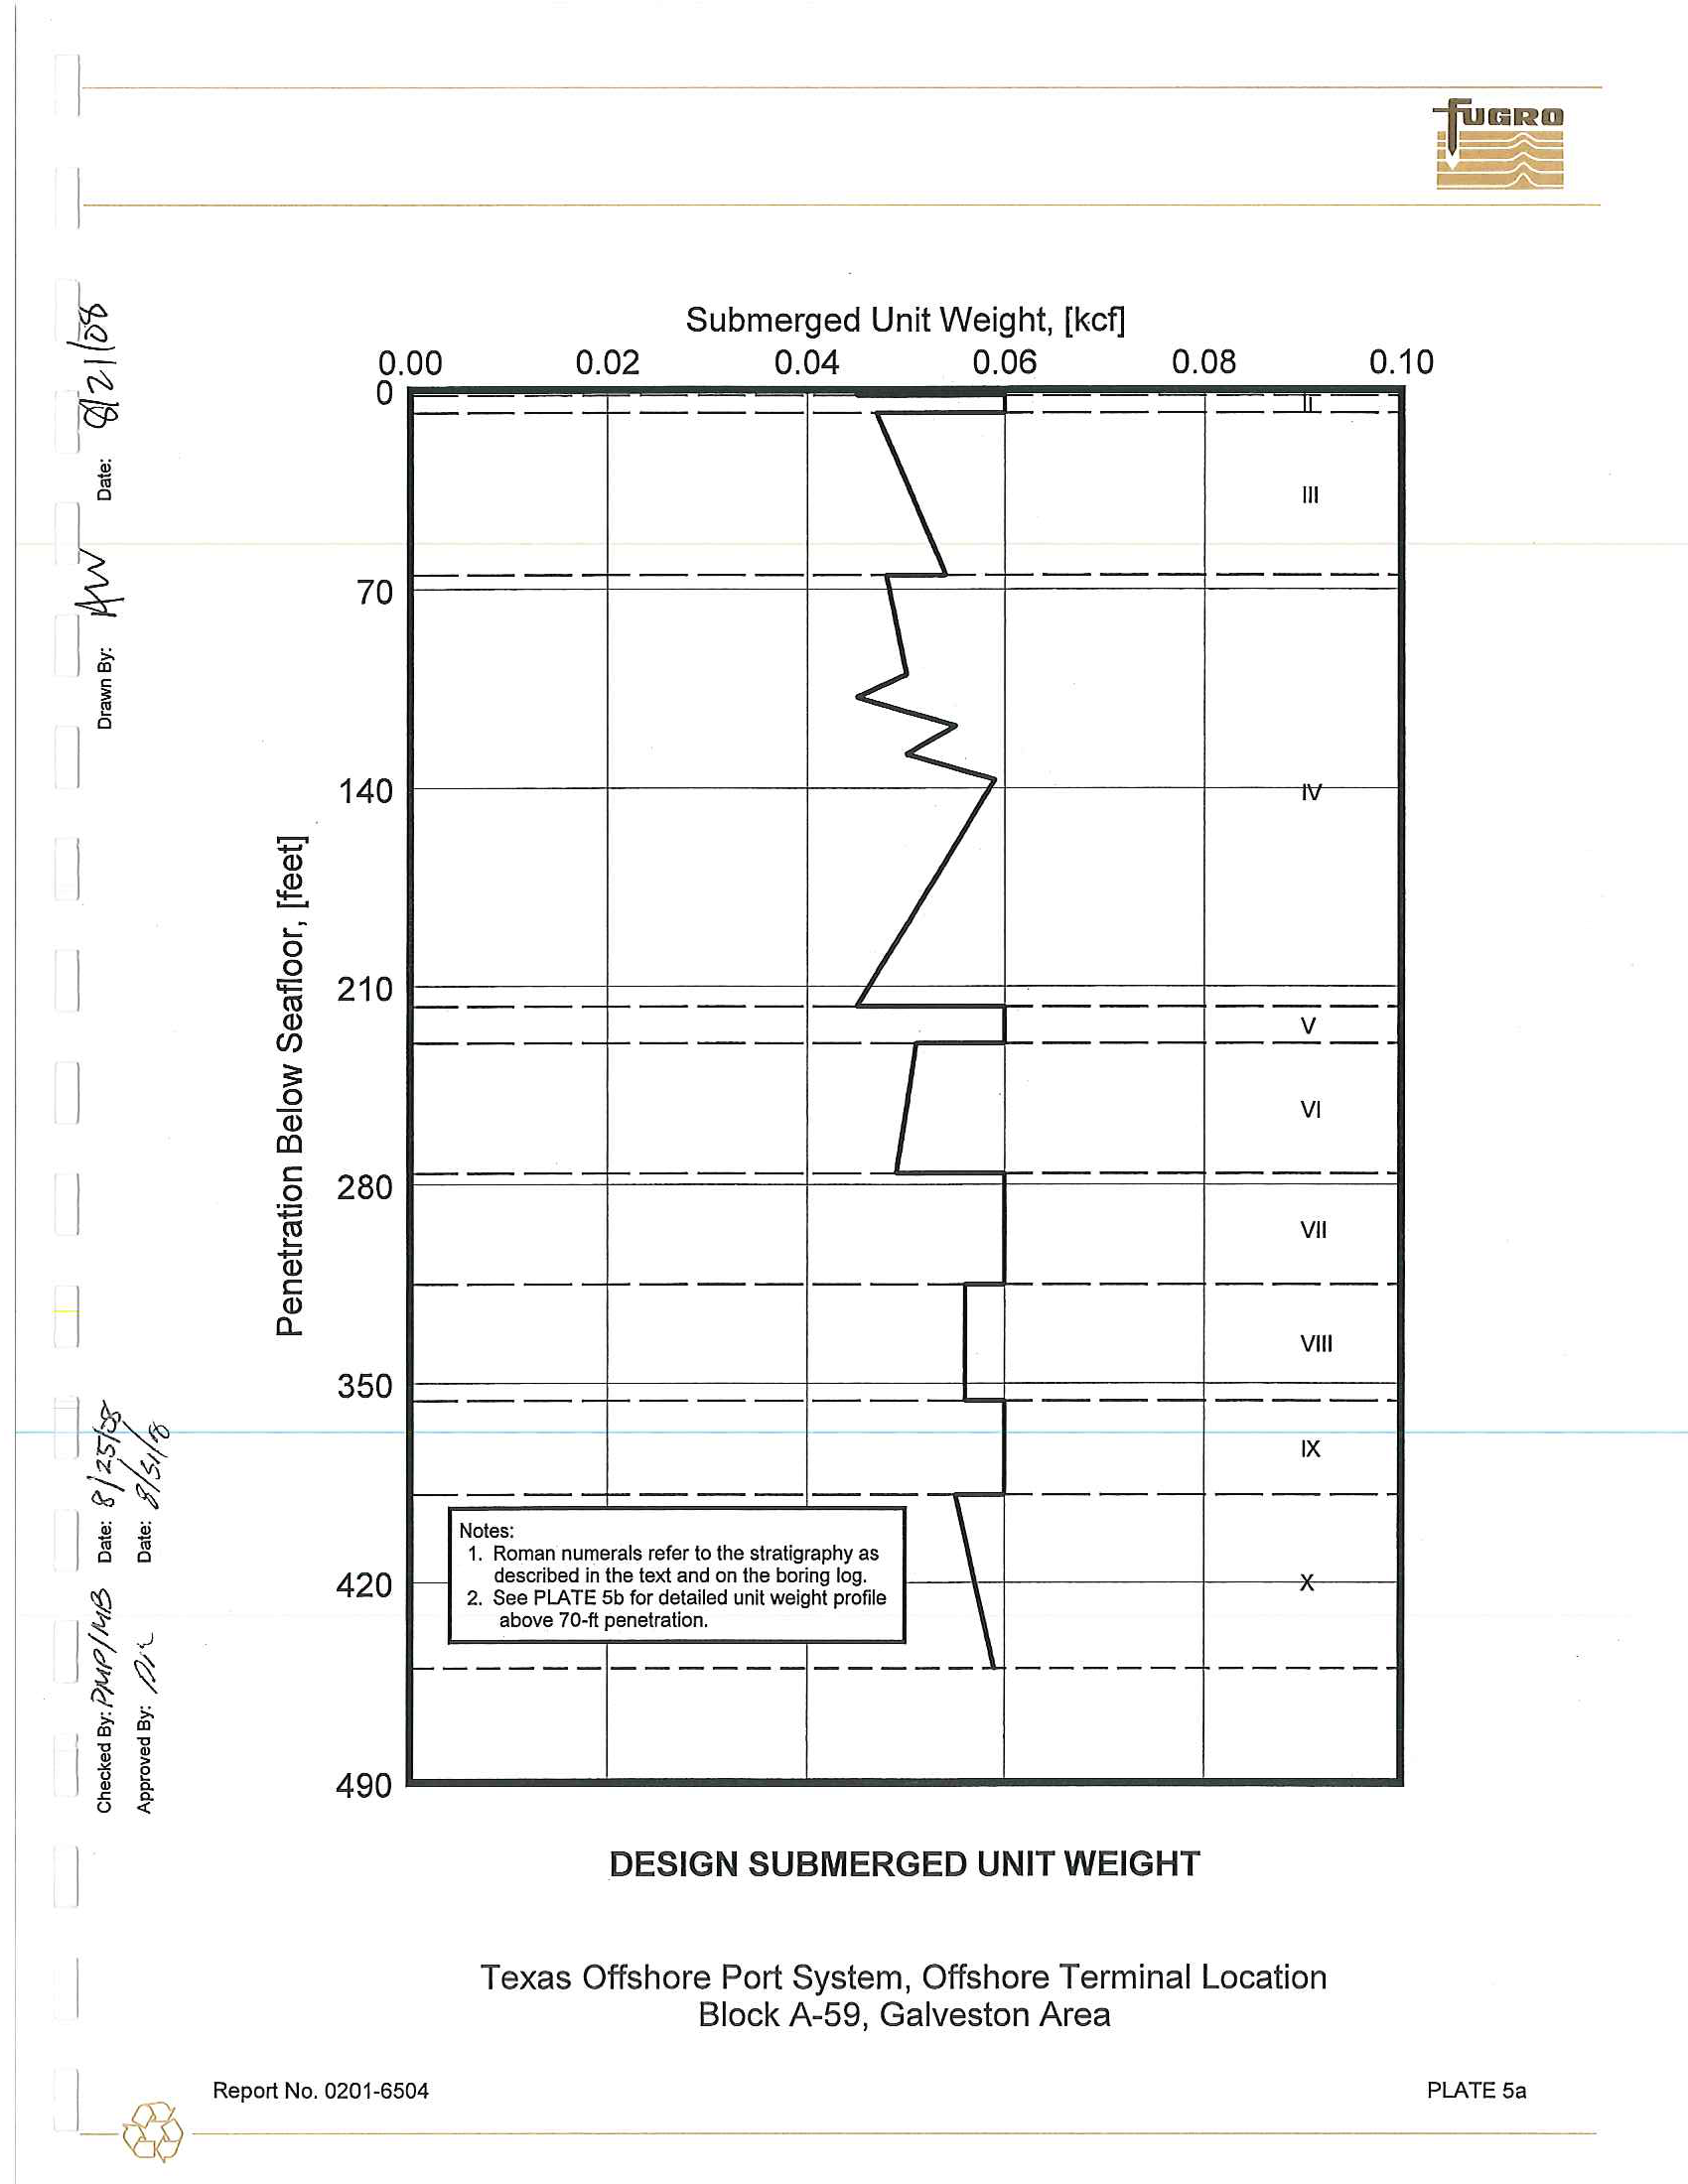
Submerged
Unit Weight, [kcf]
o
0
.
00
O.~
O.~
0.06
0.08
0
.
10
:=n:
70
140
210
280
350
420
49
0
-
.-
-
.-
.
-
III
-
.-
-
--
.-
~
'
v
-
.-
-
.-
v
--------
-
-_
.
-
---
V
I
I
-
-
-
-
V
II
--------
--
------
VIII
-
-
-
-
IX
r-----
1----
--
---
---
Notes
:
1. R
oma
n
numerals refer to
the stratigraphy
as
f------
described
in
the
text and on the
boring log.
2. See PLATE 5b
for
detailed unit weight
profile
_\
above 70*ft penetration.
-----------------
------
-----
DESIGN
SUBMERGED
UNIT WEIGHT
Texas Offshore Port System, Offshore Terminal Location
B
l
ock
A
-59,
Ga
lv
eston
Area
I
Report
No.
0201-6504
-@----------------------
PLATE
5a
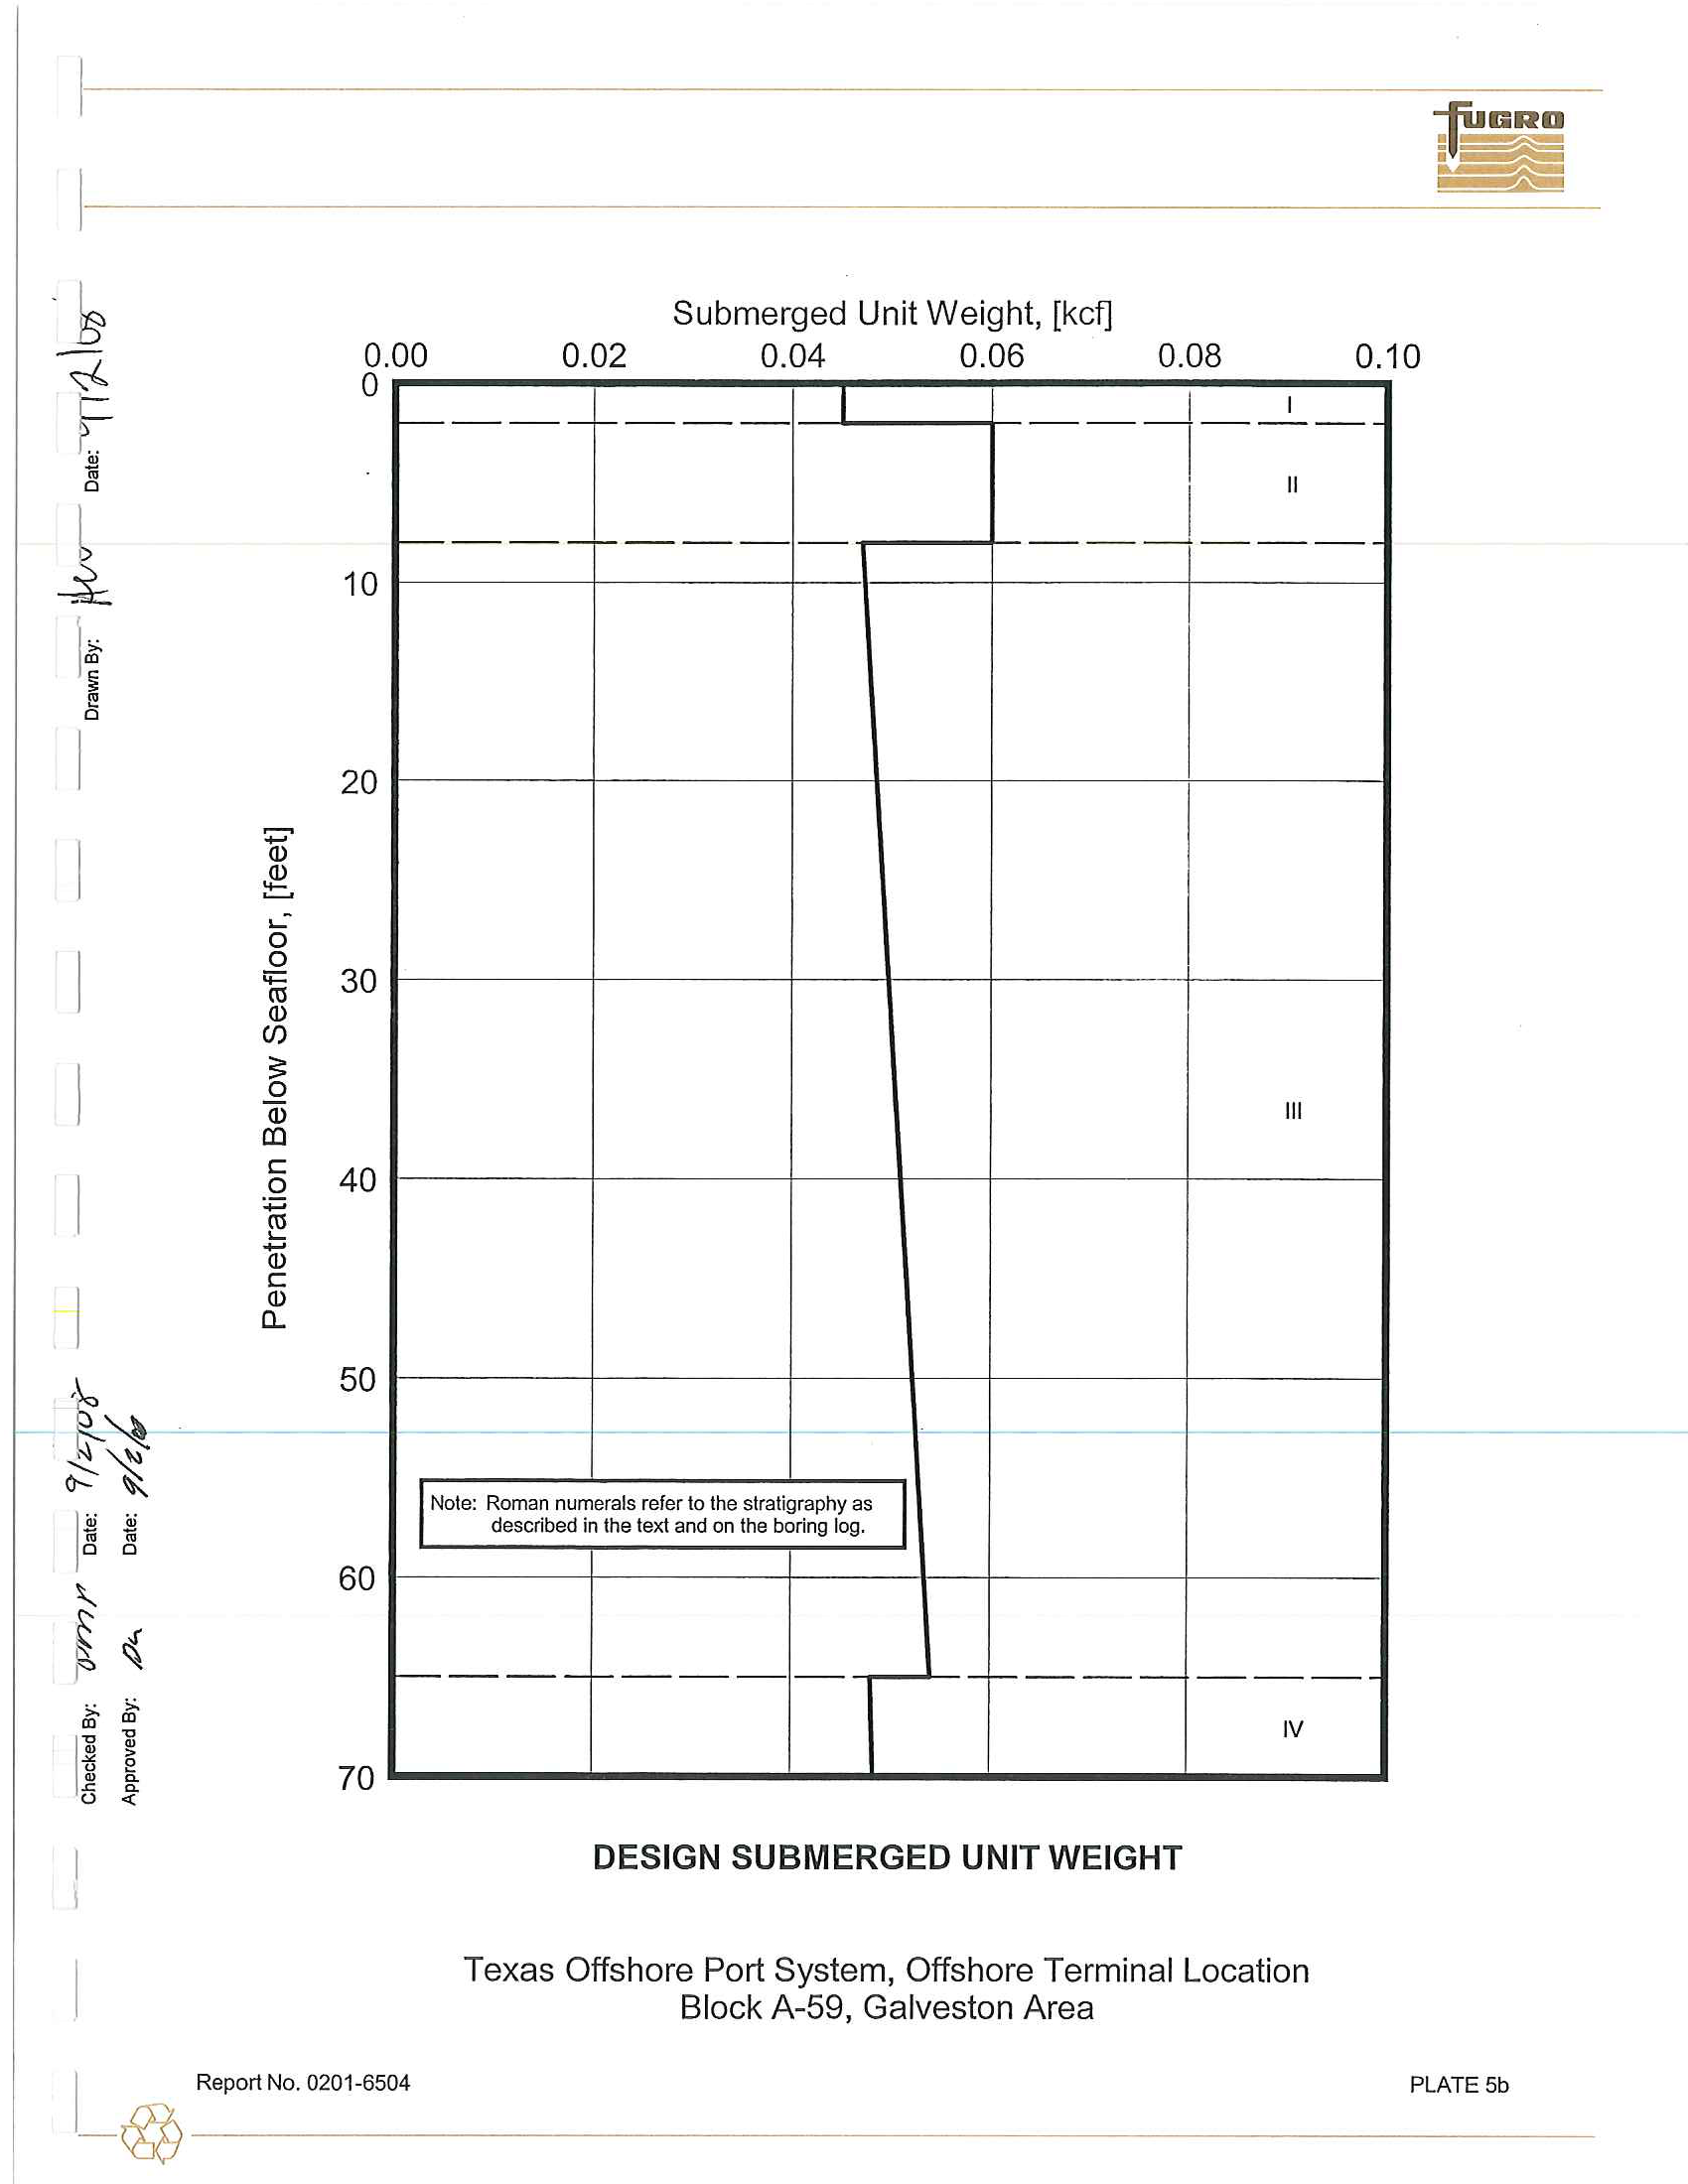
Submerged Unit Weight, [kcf]
o
0.00
0.02
o.~
0.06
0.08
0.10
10
20
30
40
50
60
70
I
I
I
--_
.
-
1----
-1---
--_.-
1----
I
II
-
--~---.-
III
--
I
Note:
Roman numerals refer to
th
e
strat
i
gr
a
phy as
descri
b
ed in
the
text and on the boring log.
I
r----.-
1----
-
.-
---.-
---
IV
DESIGN SUBMERGED
UNIT WEIGHT
Texas Offshore Port System
,
Offshore Terminal
Location
Block
A
-
59, Galveston
Area
I
Report No. 0201.6504
PLATE 5b
-@--------------------------------
b
0
-
Ii
f
~
"
l
I
~
"
I
I
-
Ql
~
~.
0
0
'+=
C1l
Ql
(/)
s:
0
Ql
0)
C
:;:::
0
C1l
~
-
c
Ql
Ql
Q..
~
"'t
~W
I
~
"
2
•
\.
~
.-
~
.-
'"
'"
I
~
•
e
>
~
~
0
«
Unit Skin Fr
i
c
t
ion,
[
ksf]
o
1
2
3
4
o
~+-
-
-+
--
-+
--.
~-=-
5
70
140
210
280
350
420
490
-
C-
-
-
C---
-
-
r-----
-
--
---
------
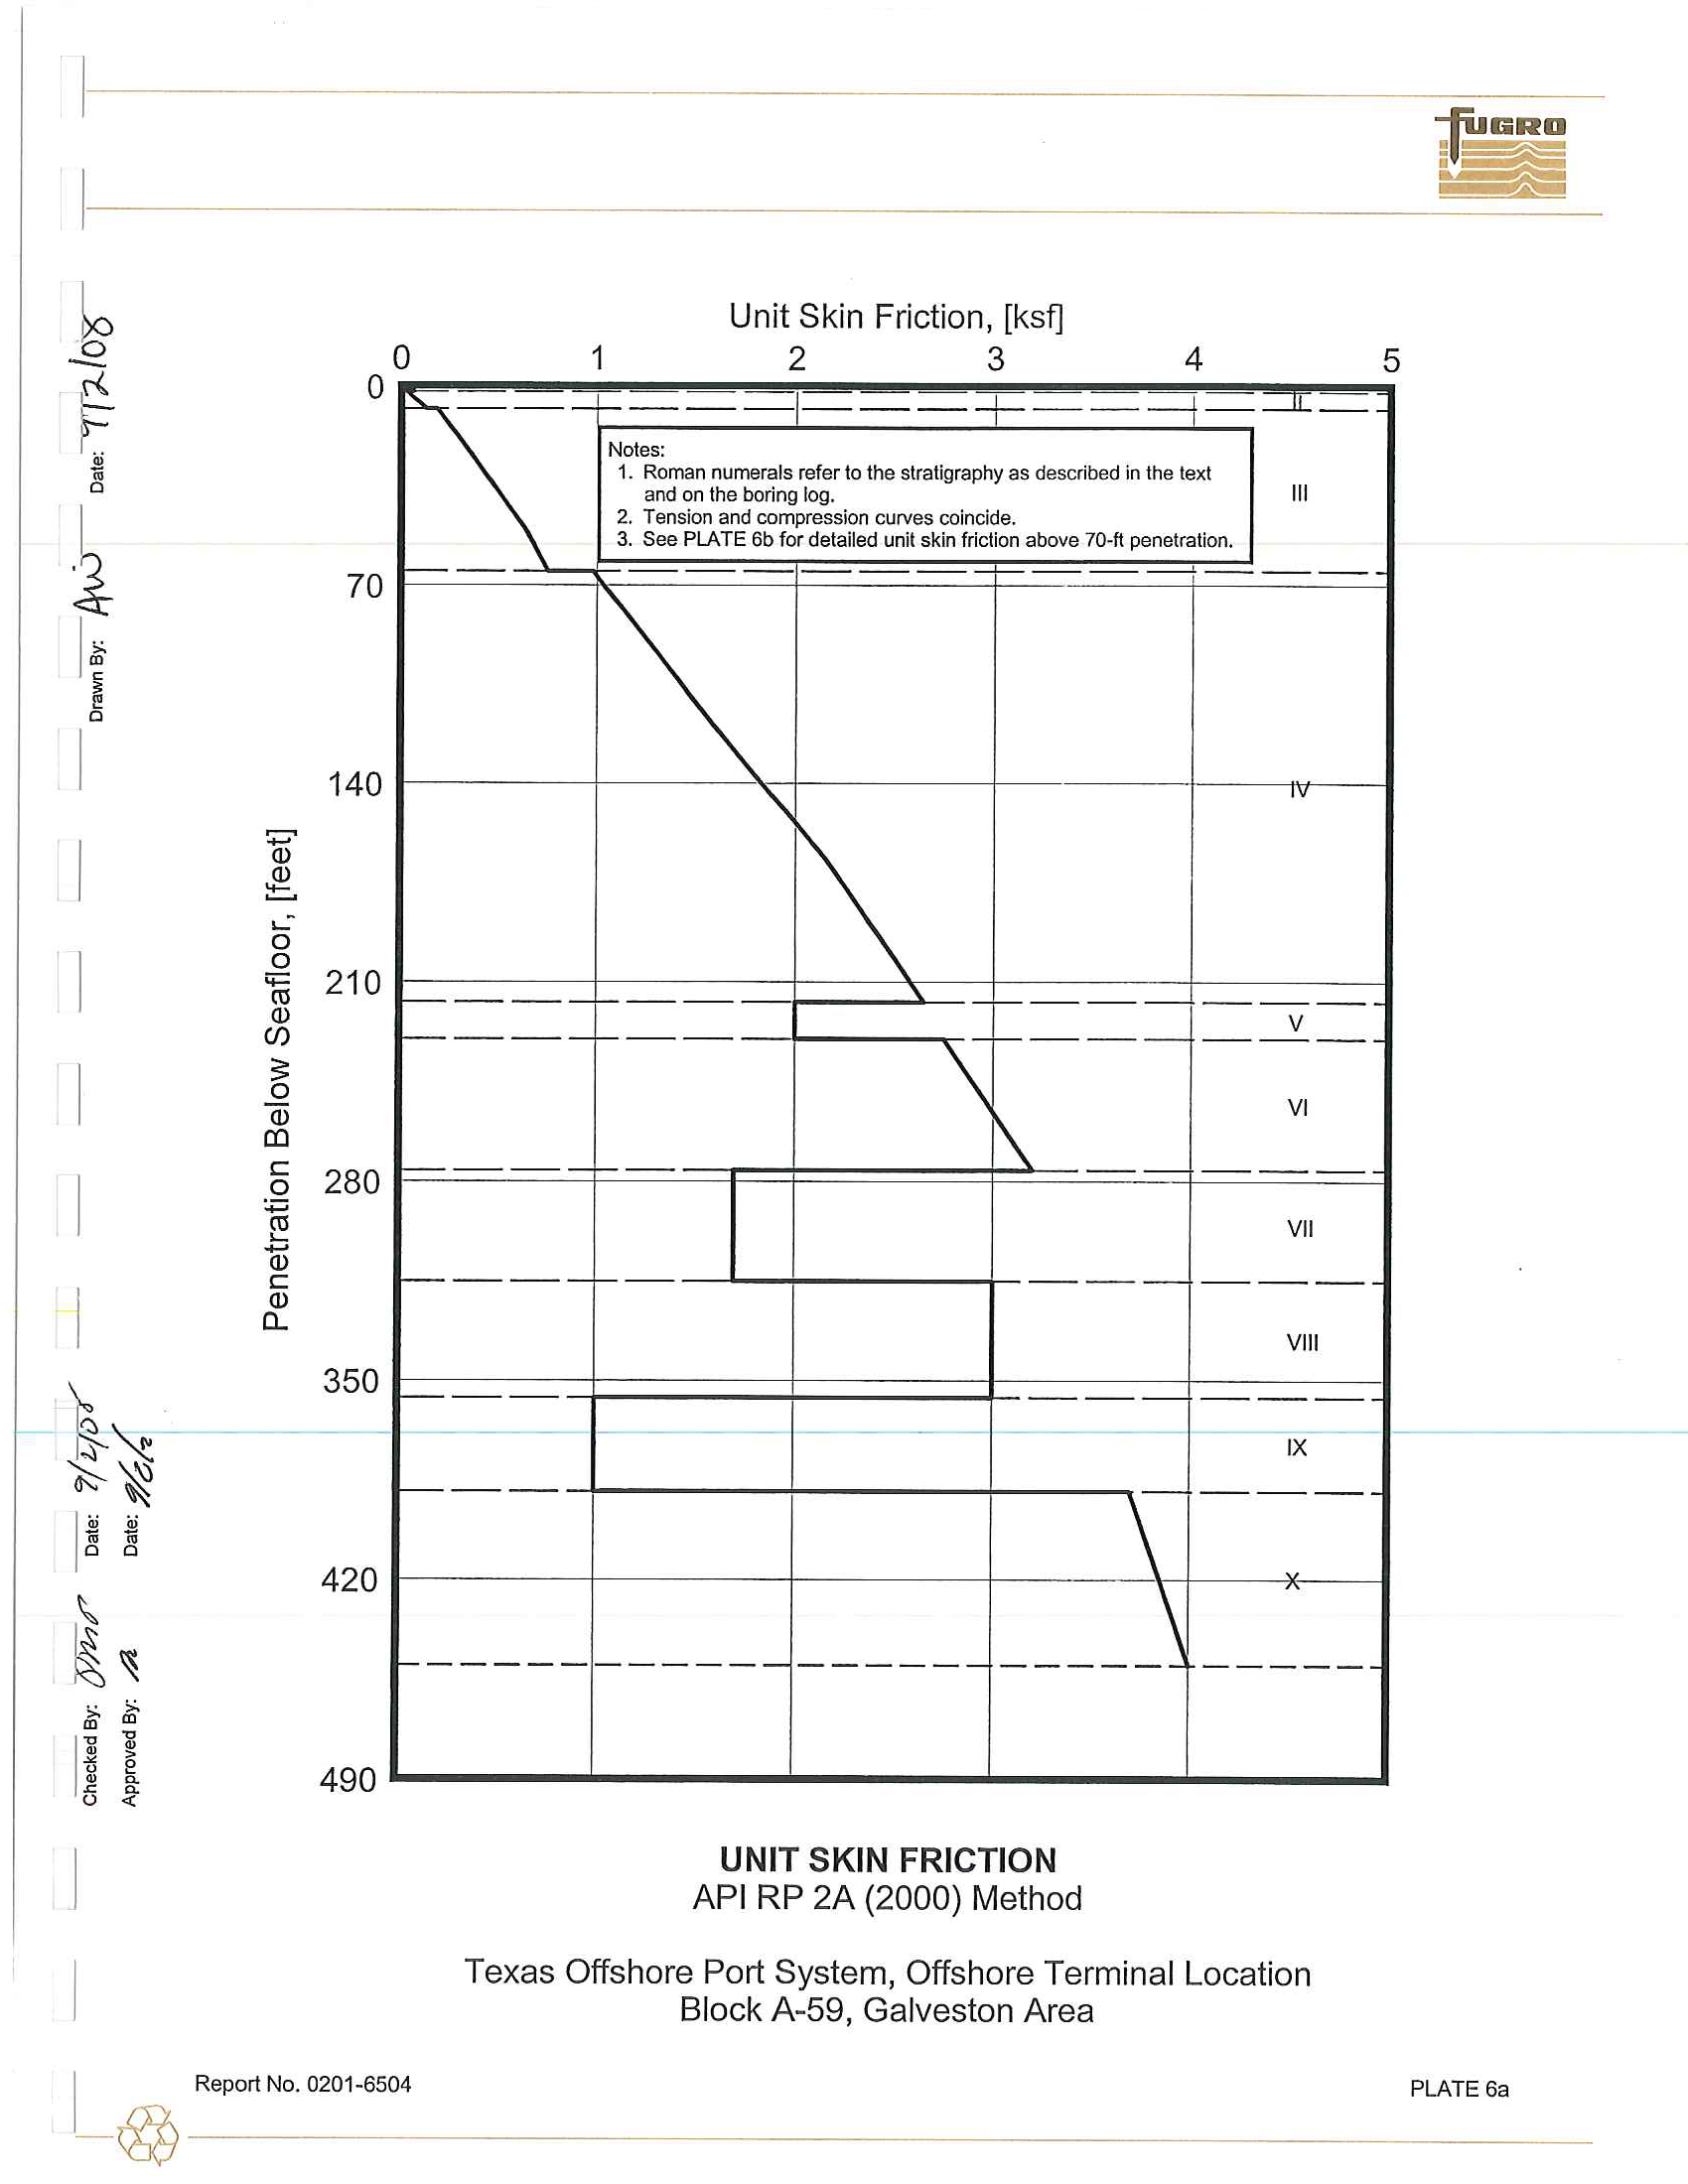
Noles
'
1 Roman numerals
r
e
fer to
th
e
stratigraphy as d
esc
nb
e
d In th
e
te
x
t
and on
the bOring log
.
I
II
2. Ten
s
ion and compr
ess
ion curv
e
s coincide
3 See
PLATE
6b for detailed
Unit
skin
friction
abov
e 7
0-ft p
e
n
e
trallO
n
.
~
'\
1\
C-
--
r-
--
'--
-
'\
r---
--
1\
-
-
--
-
--
. -
-
\
\
------
------
------
UNIT
SKIN FRICTION
API
RP
2A
(2000) Method
I
-
.
--
V
-
V
I
V
II
---
V
III
..
IX
-
-
-
)(
Back to top
-
----
Texas Offshore
Port
System,
Offshore
Termina
l
Location
B
l
ock A
-
59,
Ga
l
veston
Area
I
_
@
_
R
_
e
_
po
_
rt
_
N
_
O
_
,
0
_
2
_
01
_
-6
_
5
_
04
______________________
PLATE 6a
1
I
~
:.B
~
-c::
~
.
"
0
1
I
;;;
0
~
1
I
,.:;'
OJ
~
...:
0
0
<;::
ro
OJ
(f)
~
0
OJ
III
c
0
:;::;
-
....
ro
OJ
C
a..
OJ
~
~~
.
d2:~
I
~
0
~
'-.
~
(
>.
>.
"'
"'
~
~
e
•
>
~
u
«
~
o
00
0.5
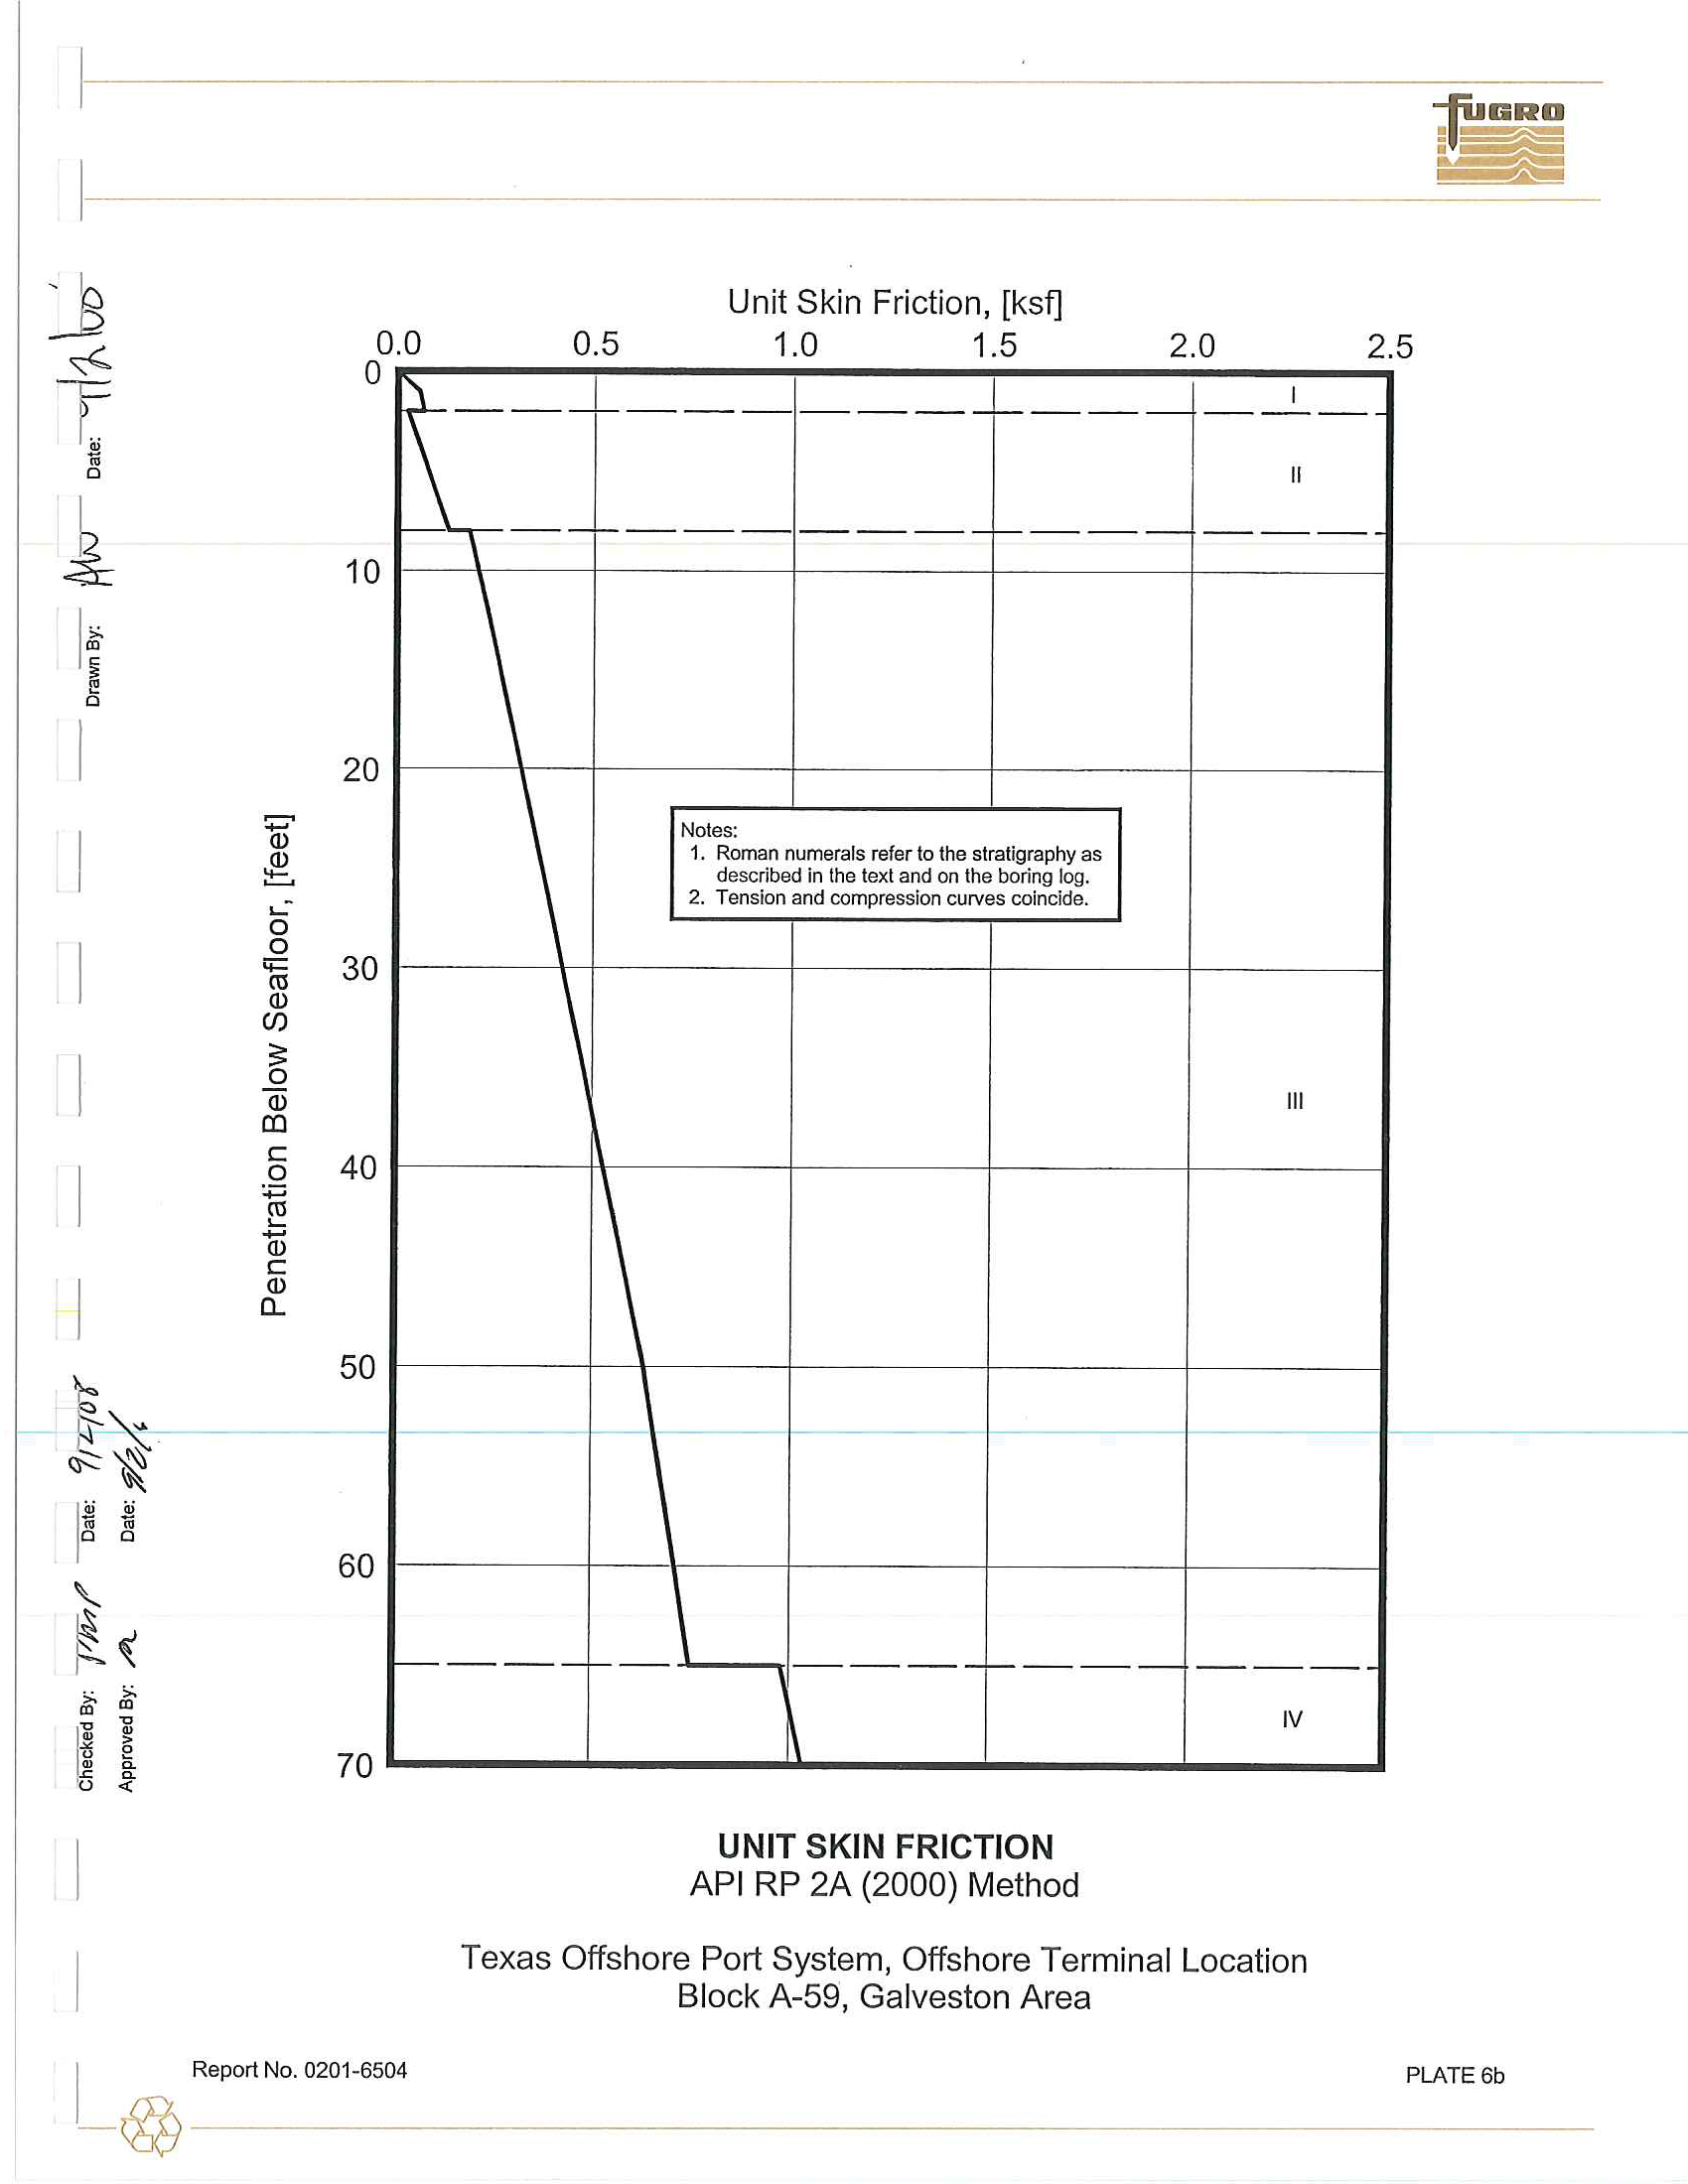
Unit
Skin Fr
ic
tion, [
k
sf]
1.0
1 5
2.
0
L
__
._
I
----
--_.-
f---
.
-
---
10
20
30
40
50
60
70
\
II
_.-
----
--_.-
f---
--
---
'\
No
l
e
s:
1
.
R
oma
n
numerals
r
efe
r
to t
h
e
st
rati
g
rap
h
y as
d
esc
rib
e
d
in
the tex
t
and
o
n t
h
e boring
l
og.
2.
T
ensio
n
and compres
s
ion c
urv
es co
i
nc
i
de.
\
III
1
\
\
f--------
I-
----
f-
----
---
UNIT SKIN FRICTION
API RP
2A (
2
000) Method
I
V
Te
x
a
s
Off
s
hor
e
Port Sy
s
t
e
m,
Offshore
T
er
minal Location
Blo
c
k A
-
59, Galveston Area
I
_
@
_
R
e
_
p
_
o
_
rt
_
N
O
_
.
_
O
_
20
_
1
_
-6
_
50
_
4
________________________
2.5
PLA
T
E
6
b
"'"
ill
:=.
ill
L-
0
0
<;::
m
ill
(j)
:s:
0
ill
III
c
0
:;::;
L
m
~
ill
C
ill
0...
""
~\t
~~
I
~
0
~
~
t
):,
~
>.
>.
'"
'"
~
I
)
•
e
>
~
~
"
"
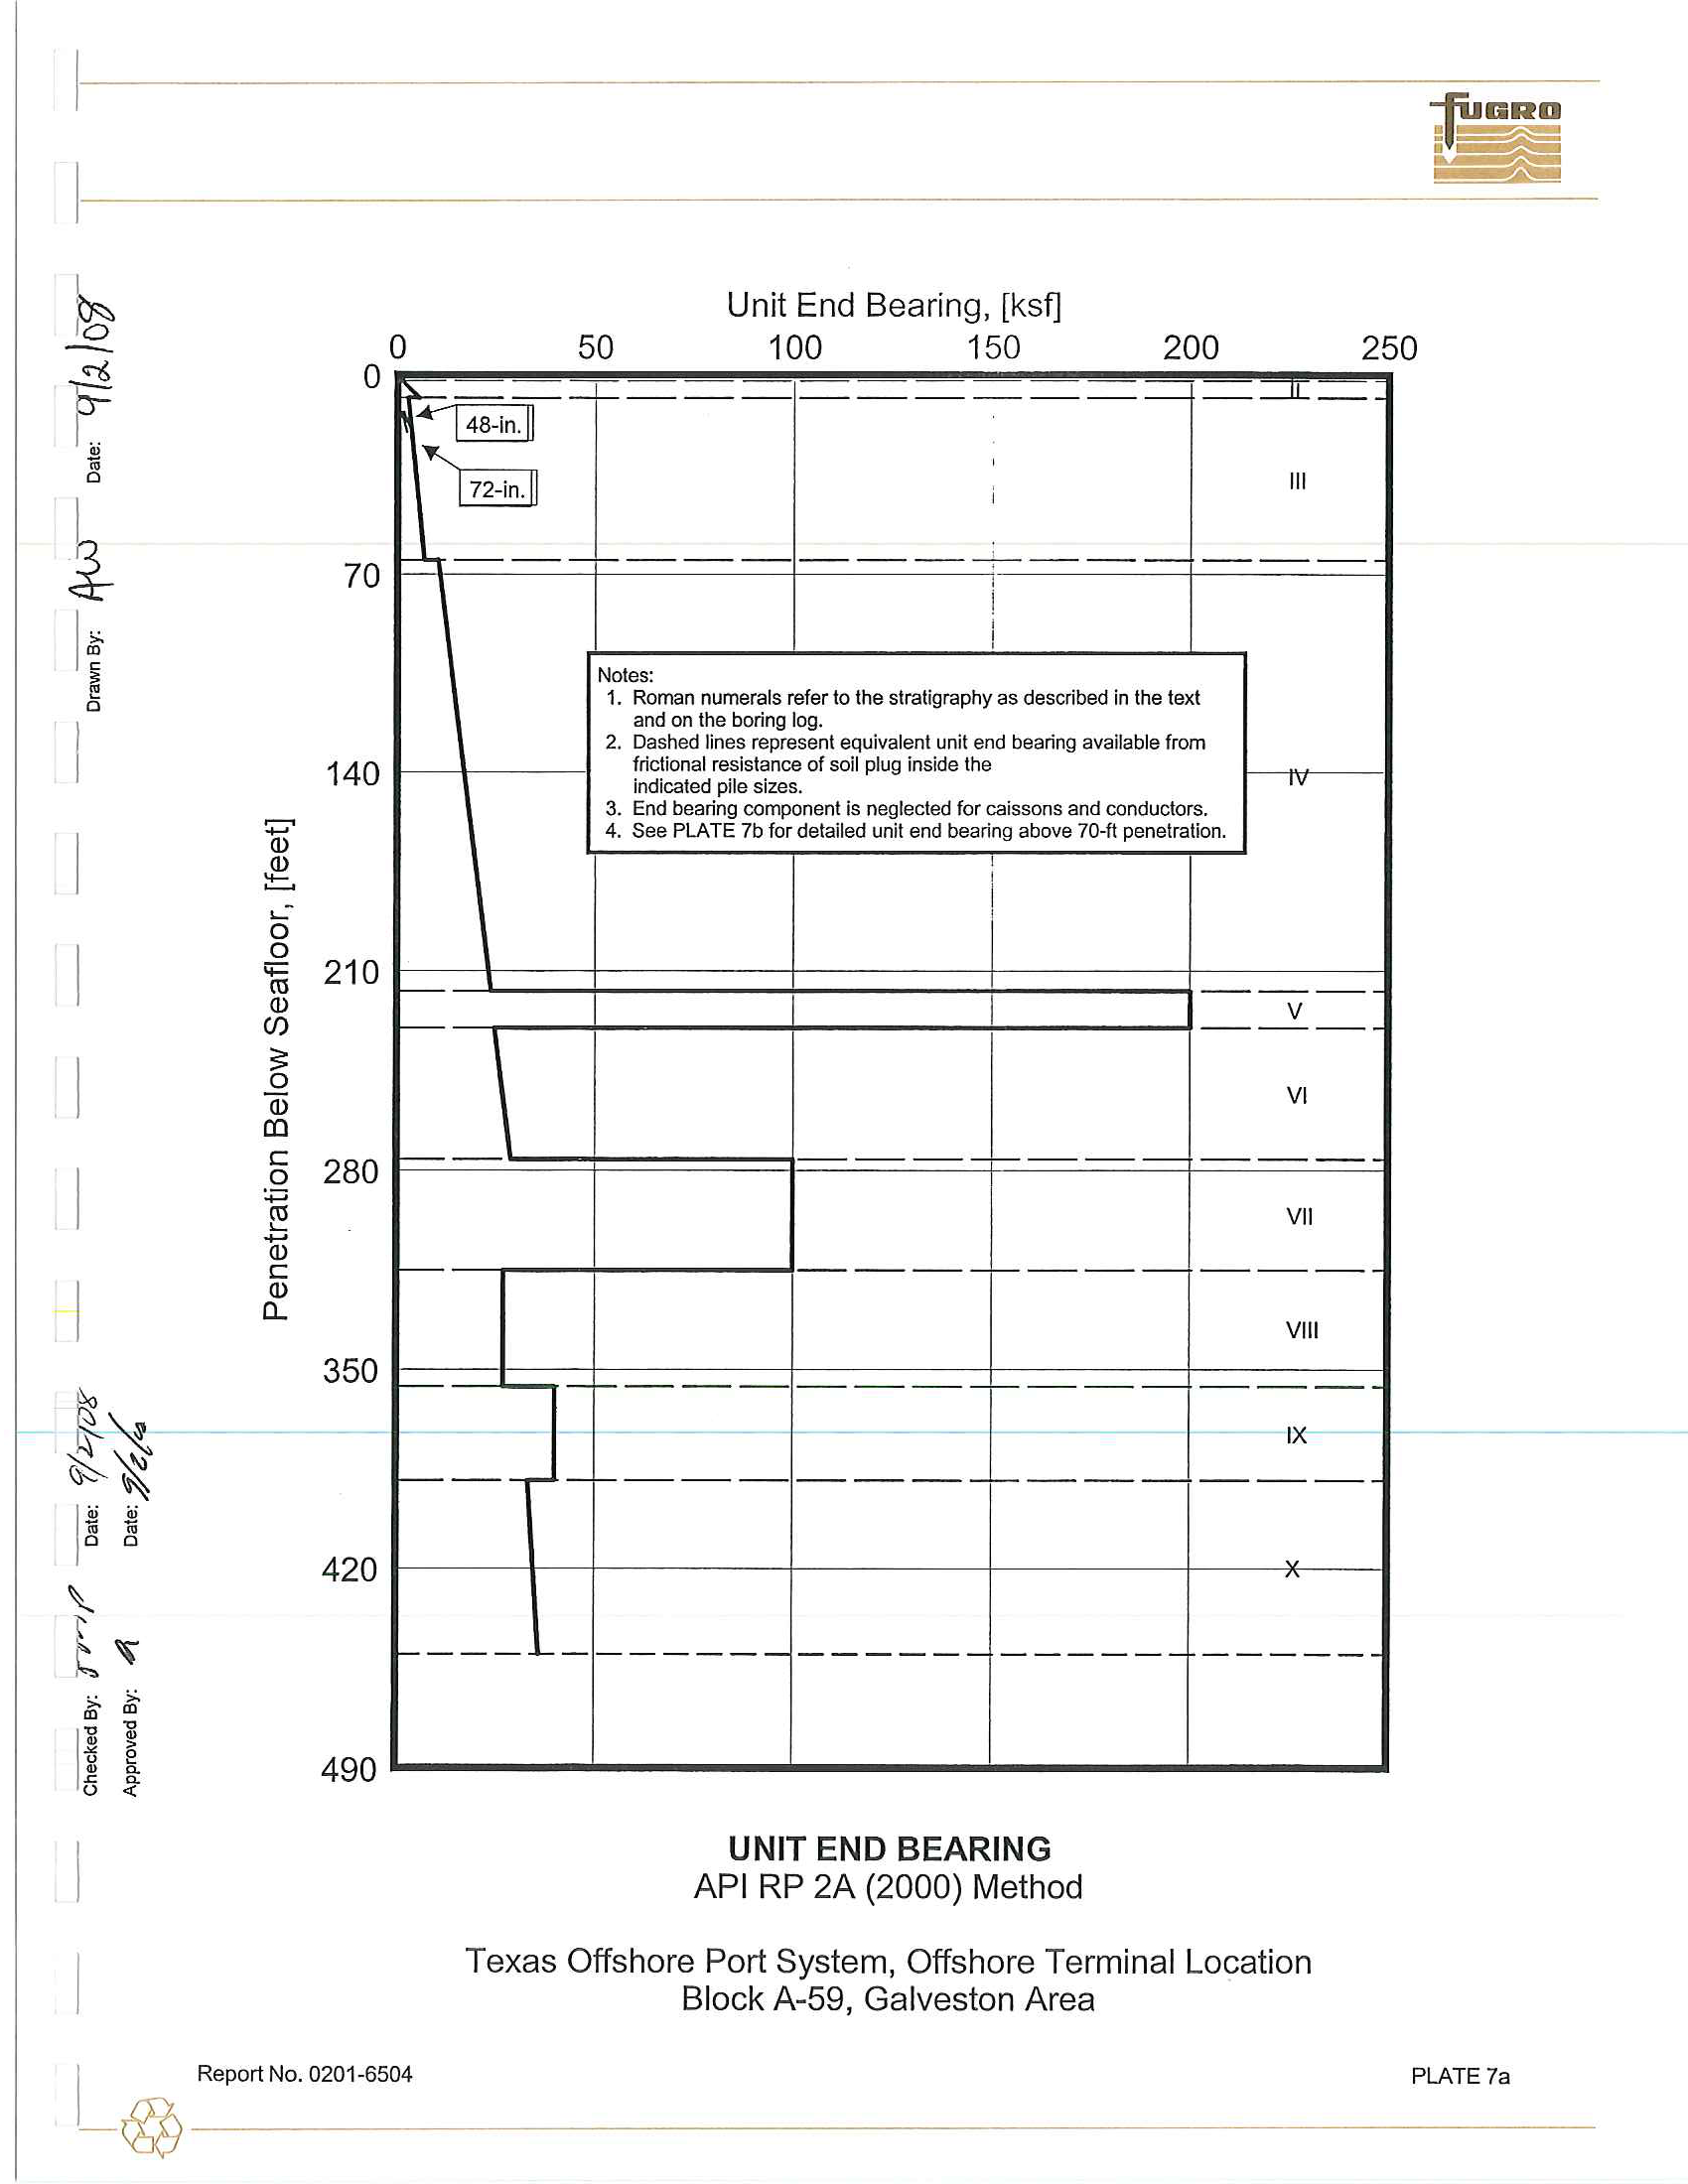
Unit End Bearing, [ksf]
o
o
"-
50
100
150
200
250
_.---.lL_
70
140
210
280
350
420
490
.-
----
-----_.-
-lifiIiJl
~
I-'-t--.-
r--
r--
r--
~
-
r-
--
__
.--,_L_
____ L-_
.
i
III
-------
-
:
---
--
.
-
------
,
i
!
Notes:
1.
Roman
numerals
refer to the stratigraphy as
described in the text
and
on
the
boring
log.
2.
Dashed
lines
represent equivalent unit end bearing available from
fridional resistance
of soil plug inside the
indicated pile
sizes.
'v
3.
End bearing component is neglected
for
caissons and conductors.
4. See PLATE 7b
for
detailed
unit
end bearing above 70-ft penetration.
,
I
I
--
f--
--
--.-
f-----
f-
.-
r-
--
-
1----
--_.-
--_.-
------
------
------
UNIT END BEARING
API
RP
2A
(2000) Method
V
---
VI
VII
-----
VIII
IX
-----
------
Texas Offshore Port System, Offshore Terminal Location
Block
A-59, Galveston
Area
1
_~-
R
-
e
-
po
-
rt
-
N
-
o
-
.
-
o
-
2o
-
1
-6
5
-
o
-
4
--------------------
____________
P
_
LA
_
T
_
E
_
7
_
a
___
-
ill
~
..:
0
0
""
(Il
ill
(j)
I
~
0
m
ill
c
0
:;::;
(Il
~
-
ill
C
ill
0..
I
~~
~~
I
~
~
0
\..
p
~
~
..
>-
..
>-
n
I
•
e
>
~
~
"
~
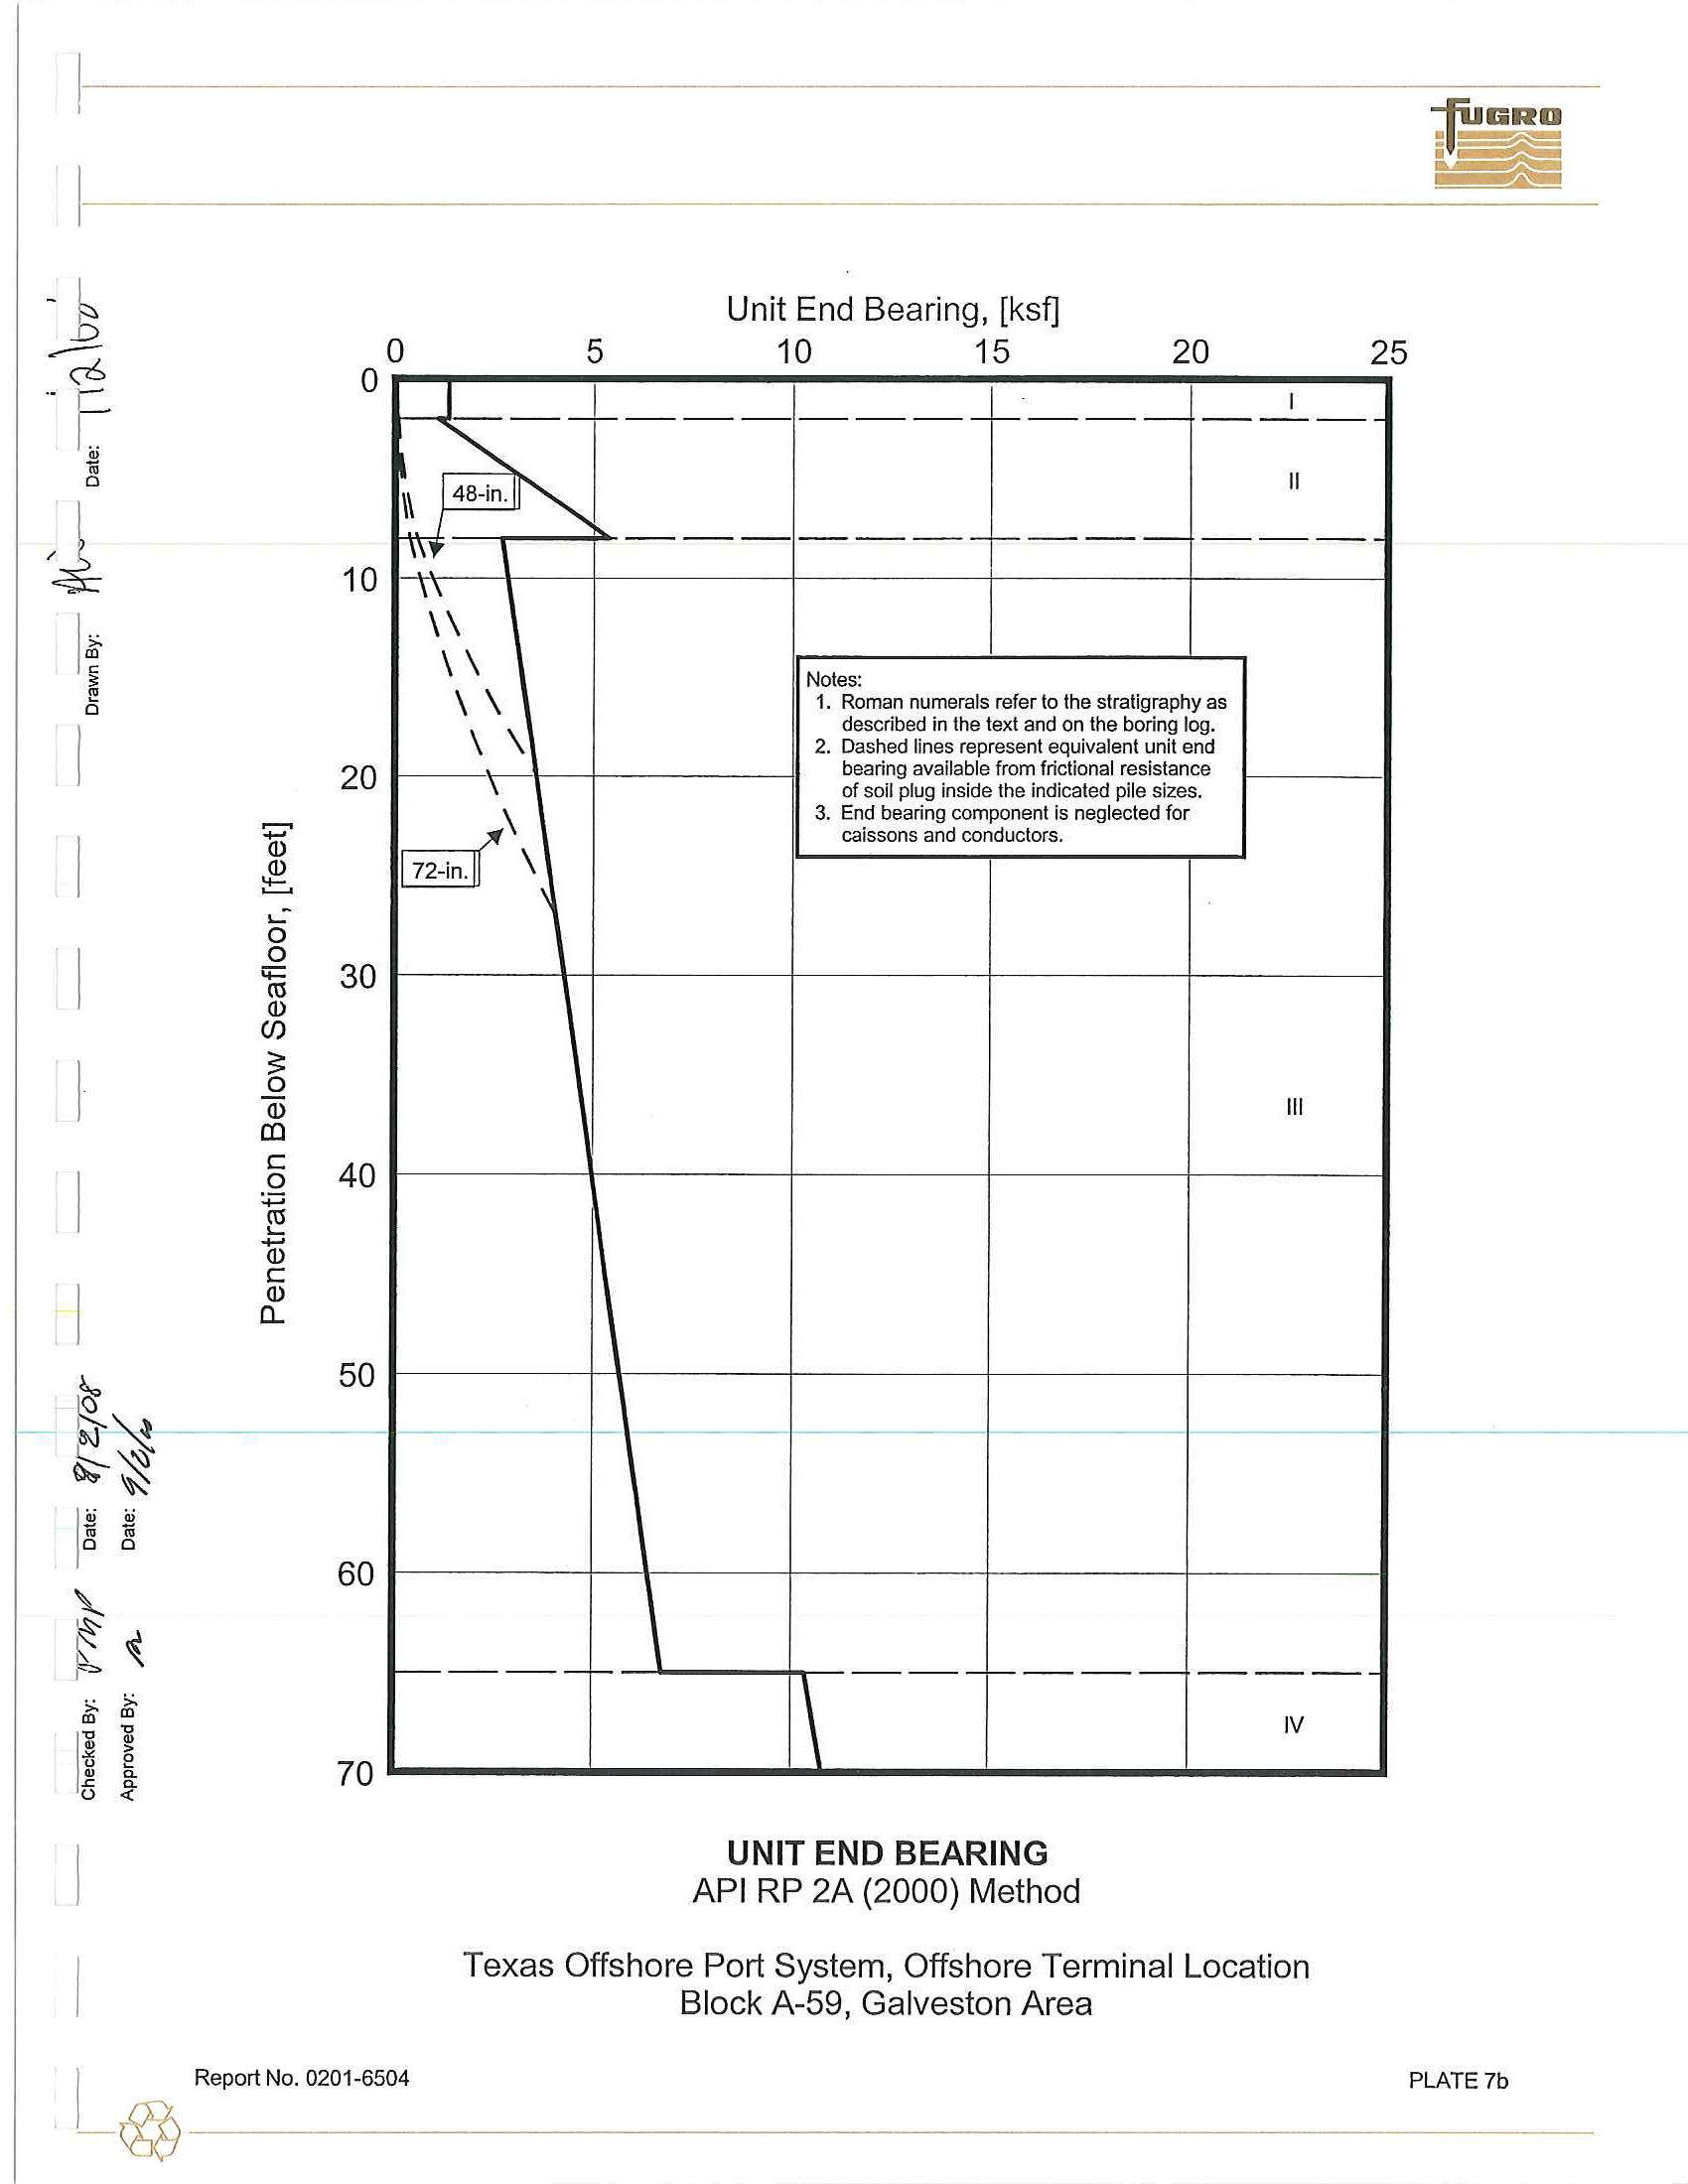
Unit End Bearing, [ksf]
o
5
10
15
o
~-
t
---
20
10
20
30
40
50
60
70
II
48-inJ
~
\\
\\
\\
\
\
\
\
\
\
~\
-
-----
I-
I
-----
f-----
------
II
--------
-
f----
------
N
o
les:
1.
Roman numerals refer to
the
stratigraphy as
describ
e
d
in
the
text
and on the boring
log.
2.
Dashed
li
nes represent equivalent unit end
bearin
g
available from frictional resistance
of soil p
l
ug inside th
e i
ndi
c
ated pile s
i
zes.
3. End bearing component is neglected
for
caissons and
c
onductors
.
III
-
-
--
f-----
------
\
IV
\
UNIT
END BEARING
API RP
2A (2000)
Method
Texas Offshore Port System, Offshore Terminal Location
Block
A-59,
Galveston
Area
25
I
PLATE 7b
Report No_
0201-6504
-
~
---------------------------------
ffi
.:s.
J
'CP
I
~
I
",
!
f
O;;-t,i;
i~
1
15
"
iii
"
o
0
~
I'
~"
~ ~
'"
'"
'"
'"
~
~
•
.!!
>
u
~
•
~
~
~
0
«
+0'
OJ
~
..:
0
0
""
C1l
OJ
C/')
;:
0
"iii
Ol
c
0
:;:::;
~
C1l
.....
OJ
c
OJ
0...
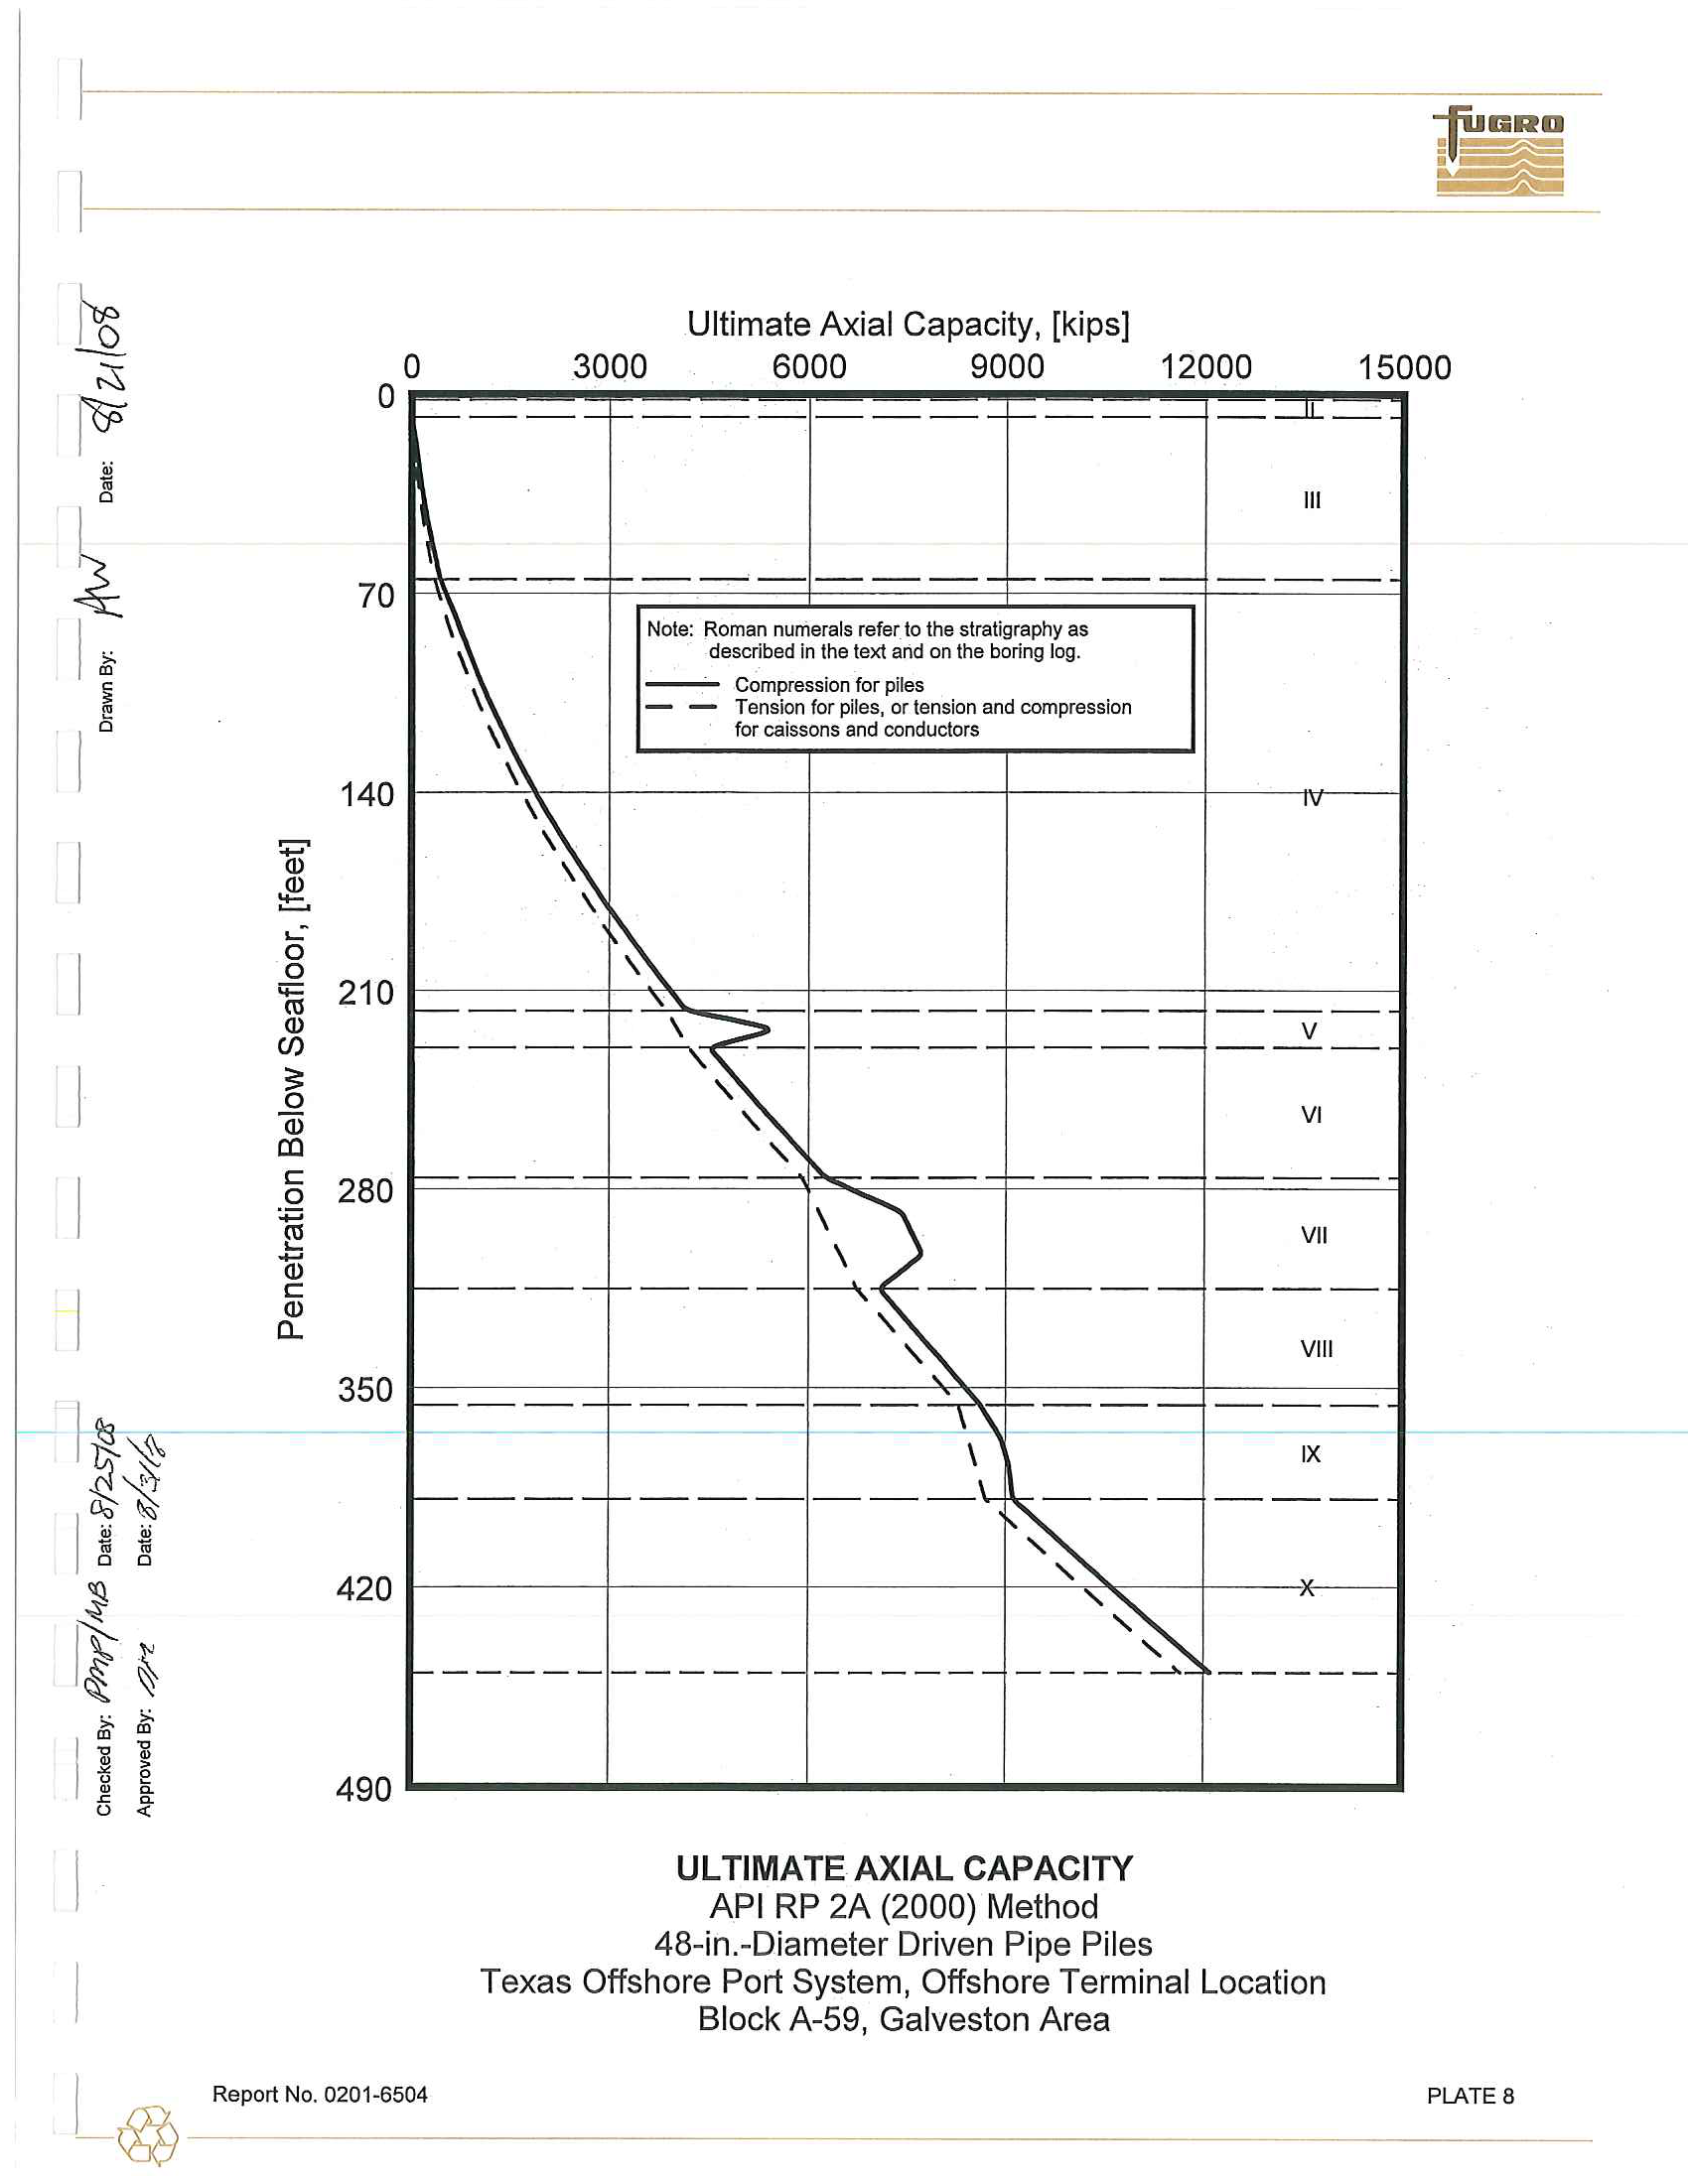
Ultimate Axial Capacity
,
[kips)
o
o
3000
6000
9000
12000
15000
1-----
1----
1--
---
_.--1L_
70
140
210
280
350
420
490
:-+---
\
\
\
\
\
'\
-
--
-----
-
--
---
-
-
-
--
-
-----
1------
-----
1---
-
-
-----
1-----
Nole: Roman
n
umerals
refe
rlo
the stratigraphy as
descr
i
bed
in the
text
and on the
boring
l
og.
--
-
C
ompression
for
p
iles
T
ension for
piles, or
t
ensio
n
and compression
for
caissons and
conductors
~
~ \~
--
-
--
~~,,~
---
-
-
-----
-
.
-
-
--
\
\
----
----\.
,
,
-
-
-
---
-
-
,
-
'\
--
----
----\.-
~--
------
------
~
----~-
ULTIMATEAXIAL
CAPAC
ITY
API
RP
2A
(2000) M
et
hod
48-
in.
-
D
i
ameter Driven P
i
pe P
il
es
III
---
'v
-----
V
V
I
VII
---
V
III
-
-
IX
---
-----
Texas
Offshore Port System, Offshore
Term
in
a
l
Location
B
l
ock A
-
59, Ga
l
veston Area
1
Report
No
. 0201.6504
-@--------------------------------
PLATE
8
I
Ultimate Axial Capacity, [kips]
o
o
4000
8000
12000
16000
20000
f.------
f--
---
f------
_----lL_
.....
-
o
70
140
'iii
210
Ql
(/)
~
Ql
co
§
280
~
Qj
c
Ql
0..
350
420
490
-----
r\
~----
f-----
-----
f-------
\
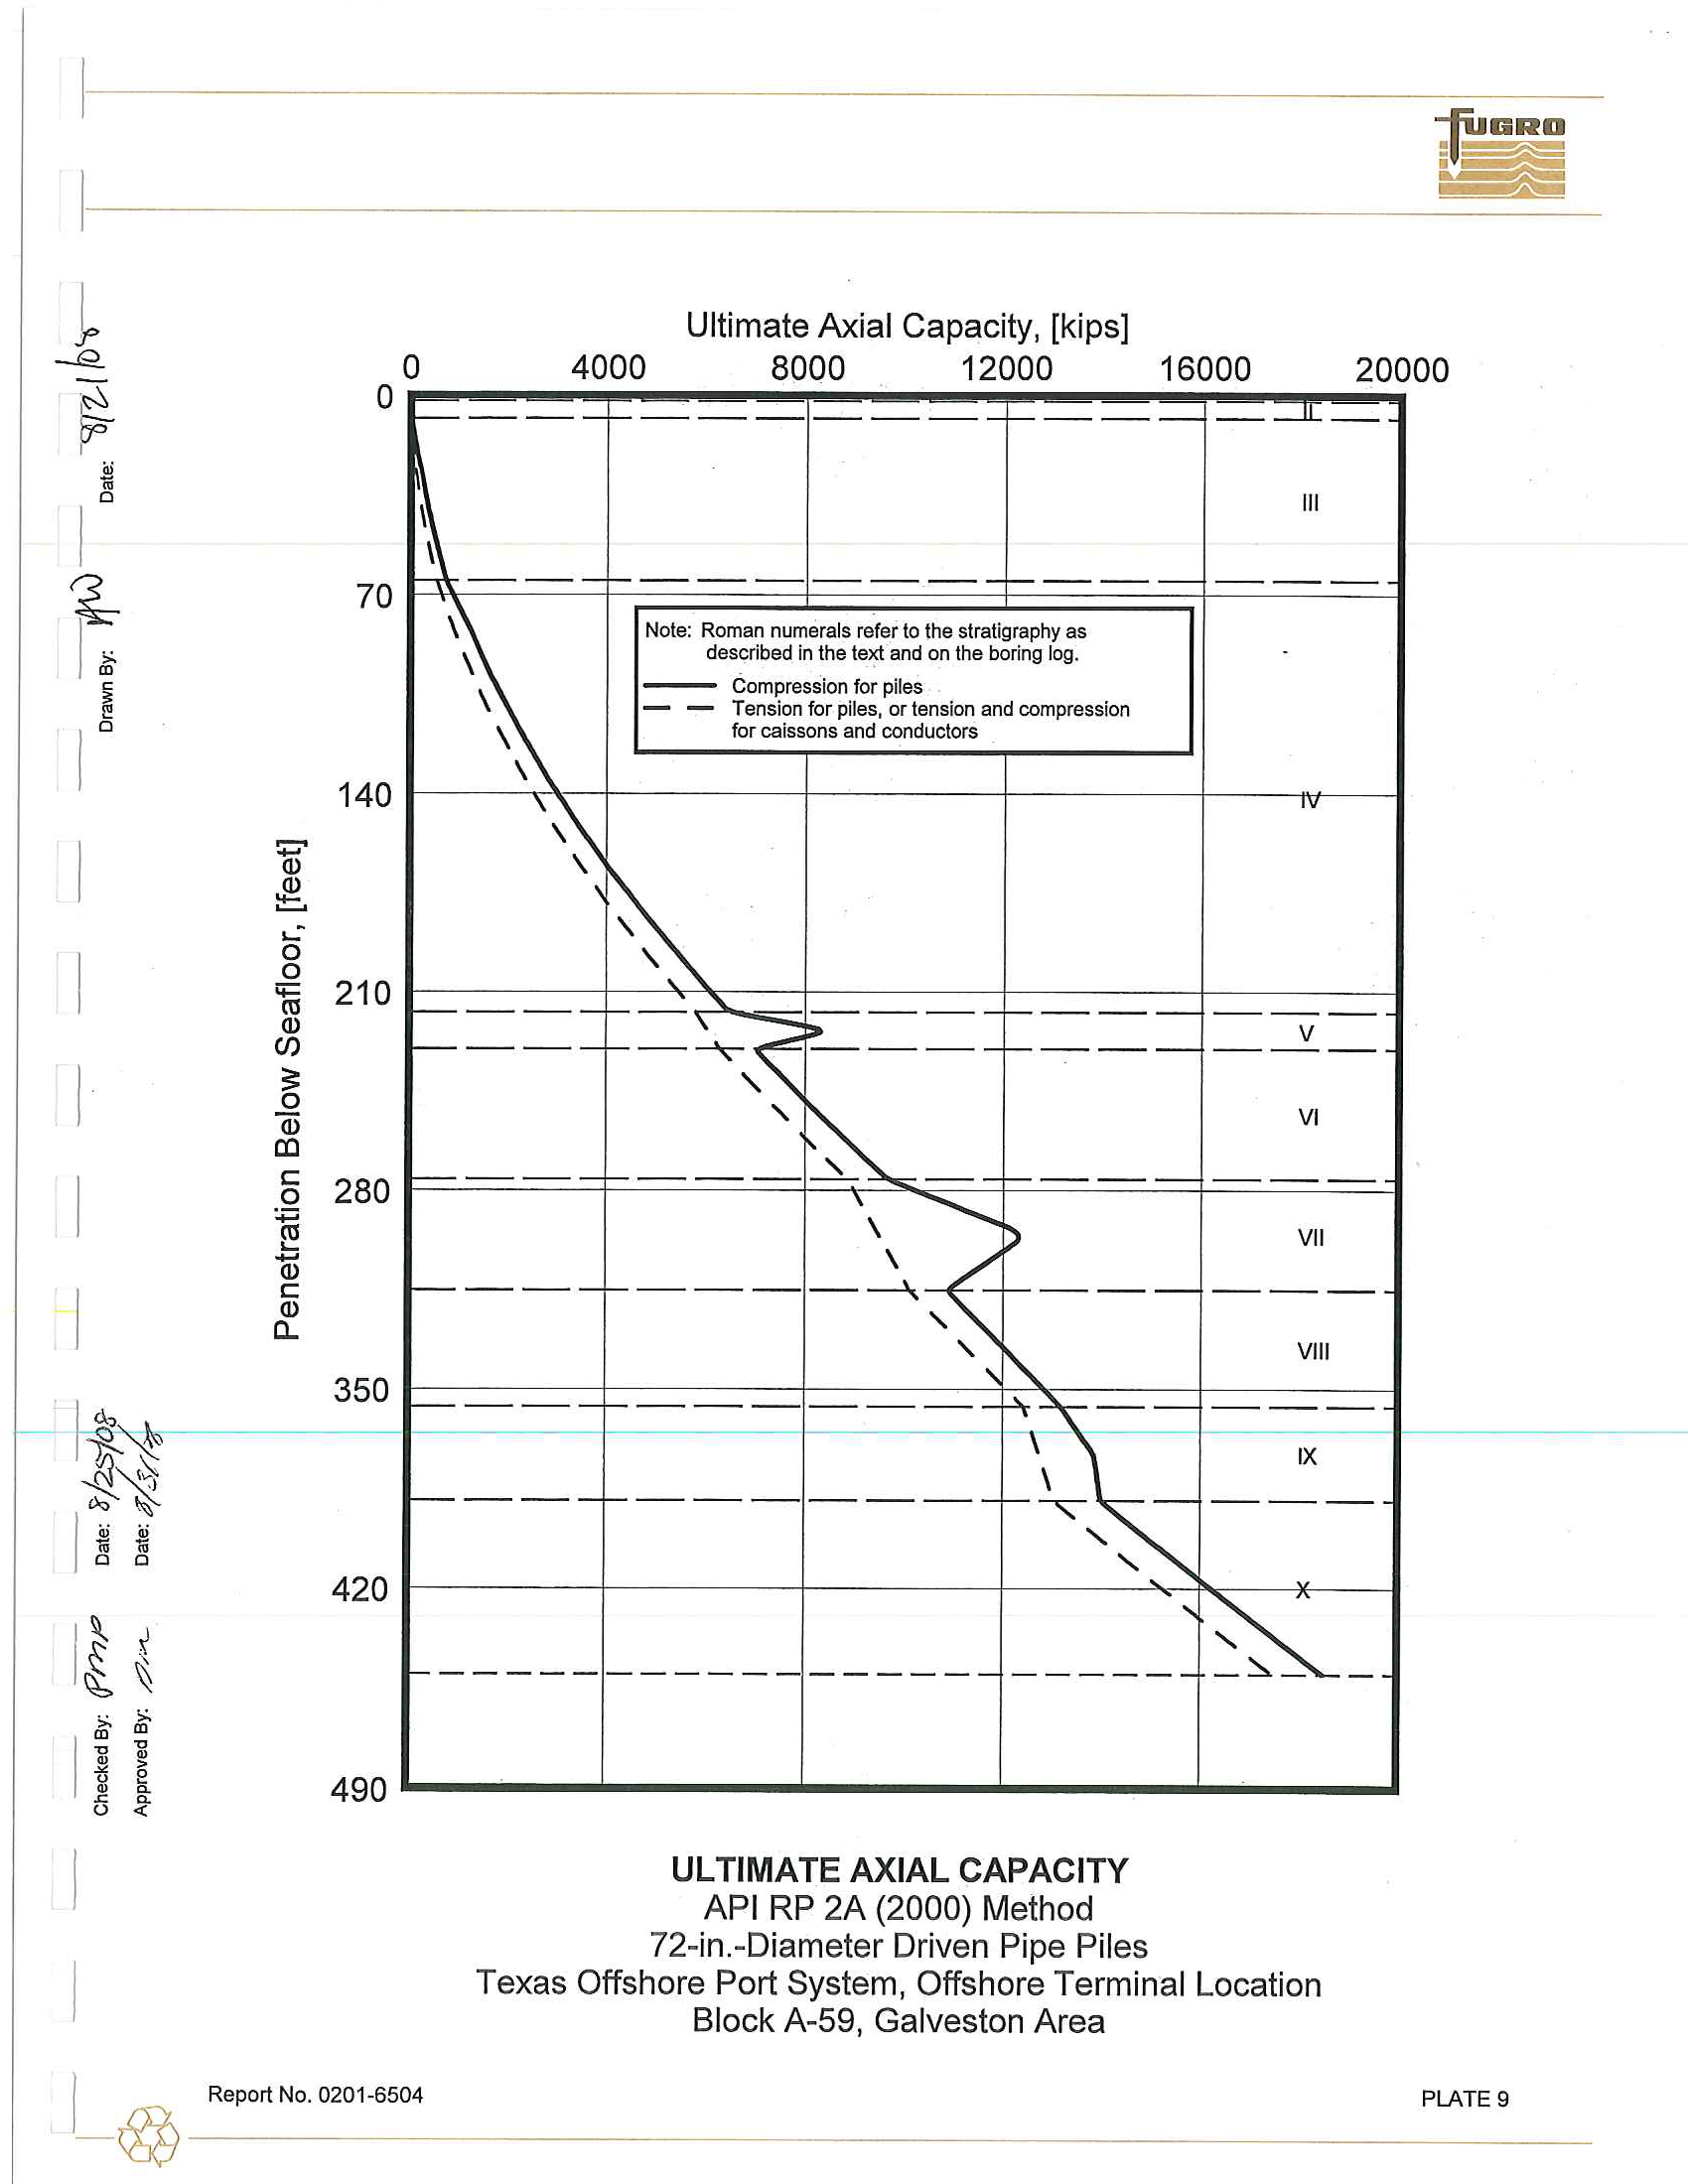
Note
:
Roman numerals refer to the stratigraphy as
\
de
sc
ribed
i
n
the text and on the bor
i
ng log
.
\
-- Compress
io
n f
or
pi
les
--
Tension for piles
,
or tens
io
n
and comp
r
ess
i
on
\
for caissons
and conductors
\
'\
"
~
f-.-
--
-
,
1>-
f--
--
f-.-----
I----~,~
-----
f-------
f-.-----
"
~---
1---
---
f------
\
............
t>
-~~
f-.-----
1------
f------
"
r'\.
,
f-.-----
1---
-------
f-\-
-
-
-
'------
1--------
-
-
-
\
\
!----
--_.-
f--~
--
"-
"-
-
,
------
------
------
ULTIMATE AXIAL CAPACITY
API RP
2A (2000)
Method
72
-
in.-Diameter Driven Pipe Piles
III
-----
IV
V
--
---
VI
---
VII
---
VIII
---
I
X
---
h_
Texas Offshore Port System, Offshore Terminal Location
Block A-59, Galveston Area
1_@_
Re
_
p
_
ort
_
N
_
O
_
.0
_
2
_
0
_
1-6
_
5
_
04
________
PLATE 9
~
D
t
I
~
~
I
D
PENETRATION
BELOW
CURVE POINTS
MUDLINE
(feel)
1
2
3
4
5
0.0
I
0.00
0.00
0.00
0.00
0.00
z
0.00
0.08
0
.15
0
.
27
0.38
2.0
I
0
.
00
0
.
02
0.03
0
.
05
0
.
06
z
0
.
00
0.08
0.15
0
.
27
0.38
2.0
I
0.00
0.03
0
.
03
z
0
.
00
0.10
48.00
8.0
I
0
.
00
0.13
0
.1
3
z
0.00
0.10
48.00
8.0
I
0.00
0.06
0
.
09
0.14
0.17
z
0
.
00
0.08
0.15
0.27
0.38
50.0
I
0.00
0
.
1
9
0.32
0.47
0
.
57
z
0.00
0.08
0
.
15
0
.
27
0
.
38
65.0
I
0.00
0
.
23
0
.
38
0.56
0
.
68
z
0
.
00
0.08
0.15
0
.
27
0.38
65.0
I
0
.
00
0
.
29
0.49
0
.
73
0
.
88
z
0.00
0
.
08
0.15
0
.
27
0.38
100.0
I
0
.
00
0.4
1
0.69
1
.
03
1.24
z
0.00
0.08
0
.
15
0
.
27
0
.
38
108.0
I
0.00
0.44
0.73
1.
10
1
.
31
z
0
.0
0
0.08
0.15
0
.
27
0
.
38
118.0
I
0.00
0.47
0.79
1
.
18
1.42
z
0.00
0.08
0
.
15
0
.
27
0
.
38
128.0
I
0.00
0
.
51
0.85
1.27
1
.
52
z
0.00
0
.
08
0
.
15
0.27
0
.
38
137
.
0
I
0.00
0
.
54
0.90
1
.
35
1
.
62
z
0.00
0
.
08
0.15
0.27
0
.
38
167
.
0
I
0
.
00
0.65
1
.08
1.62
1.94
z
0.00
0
.
08
0.15
0.27
0
.
38
217.0
I
0.00
0
.
79
1.32
1
.
99
2
.
38
z
0
.
00
0.08
0.15
0.27
0.38
217
.
0
I
0.00
2.00
2.00
z
0.00
0
.
1
0
48
.
00
230
.
0
I
0.00
2.00
2
.
00
z
0.00
0.10
48.00
230
.
0
I
0.00
0.83
1
.3
8
2.06
2.48
z
0.00
0.08
0
.
15
0.27
0.38
.
276
.
0
I
0.00
0.96
1.60
2.40
2.88
z
0.00
0.08
0.15
0.27
0.38
276.0
I
0.00
1.70
1.70
z
0.00
0.10
48
.
00
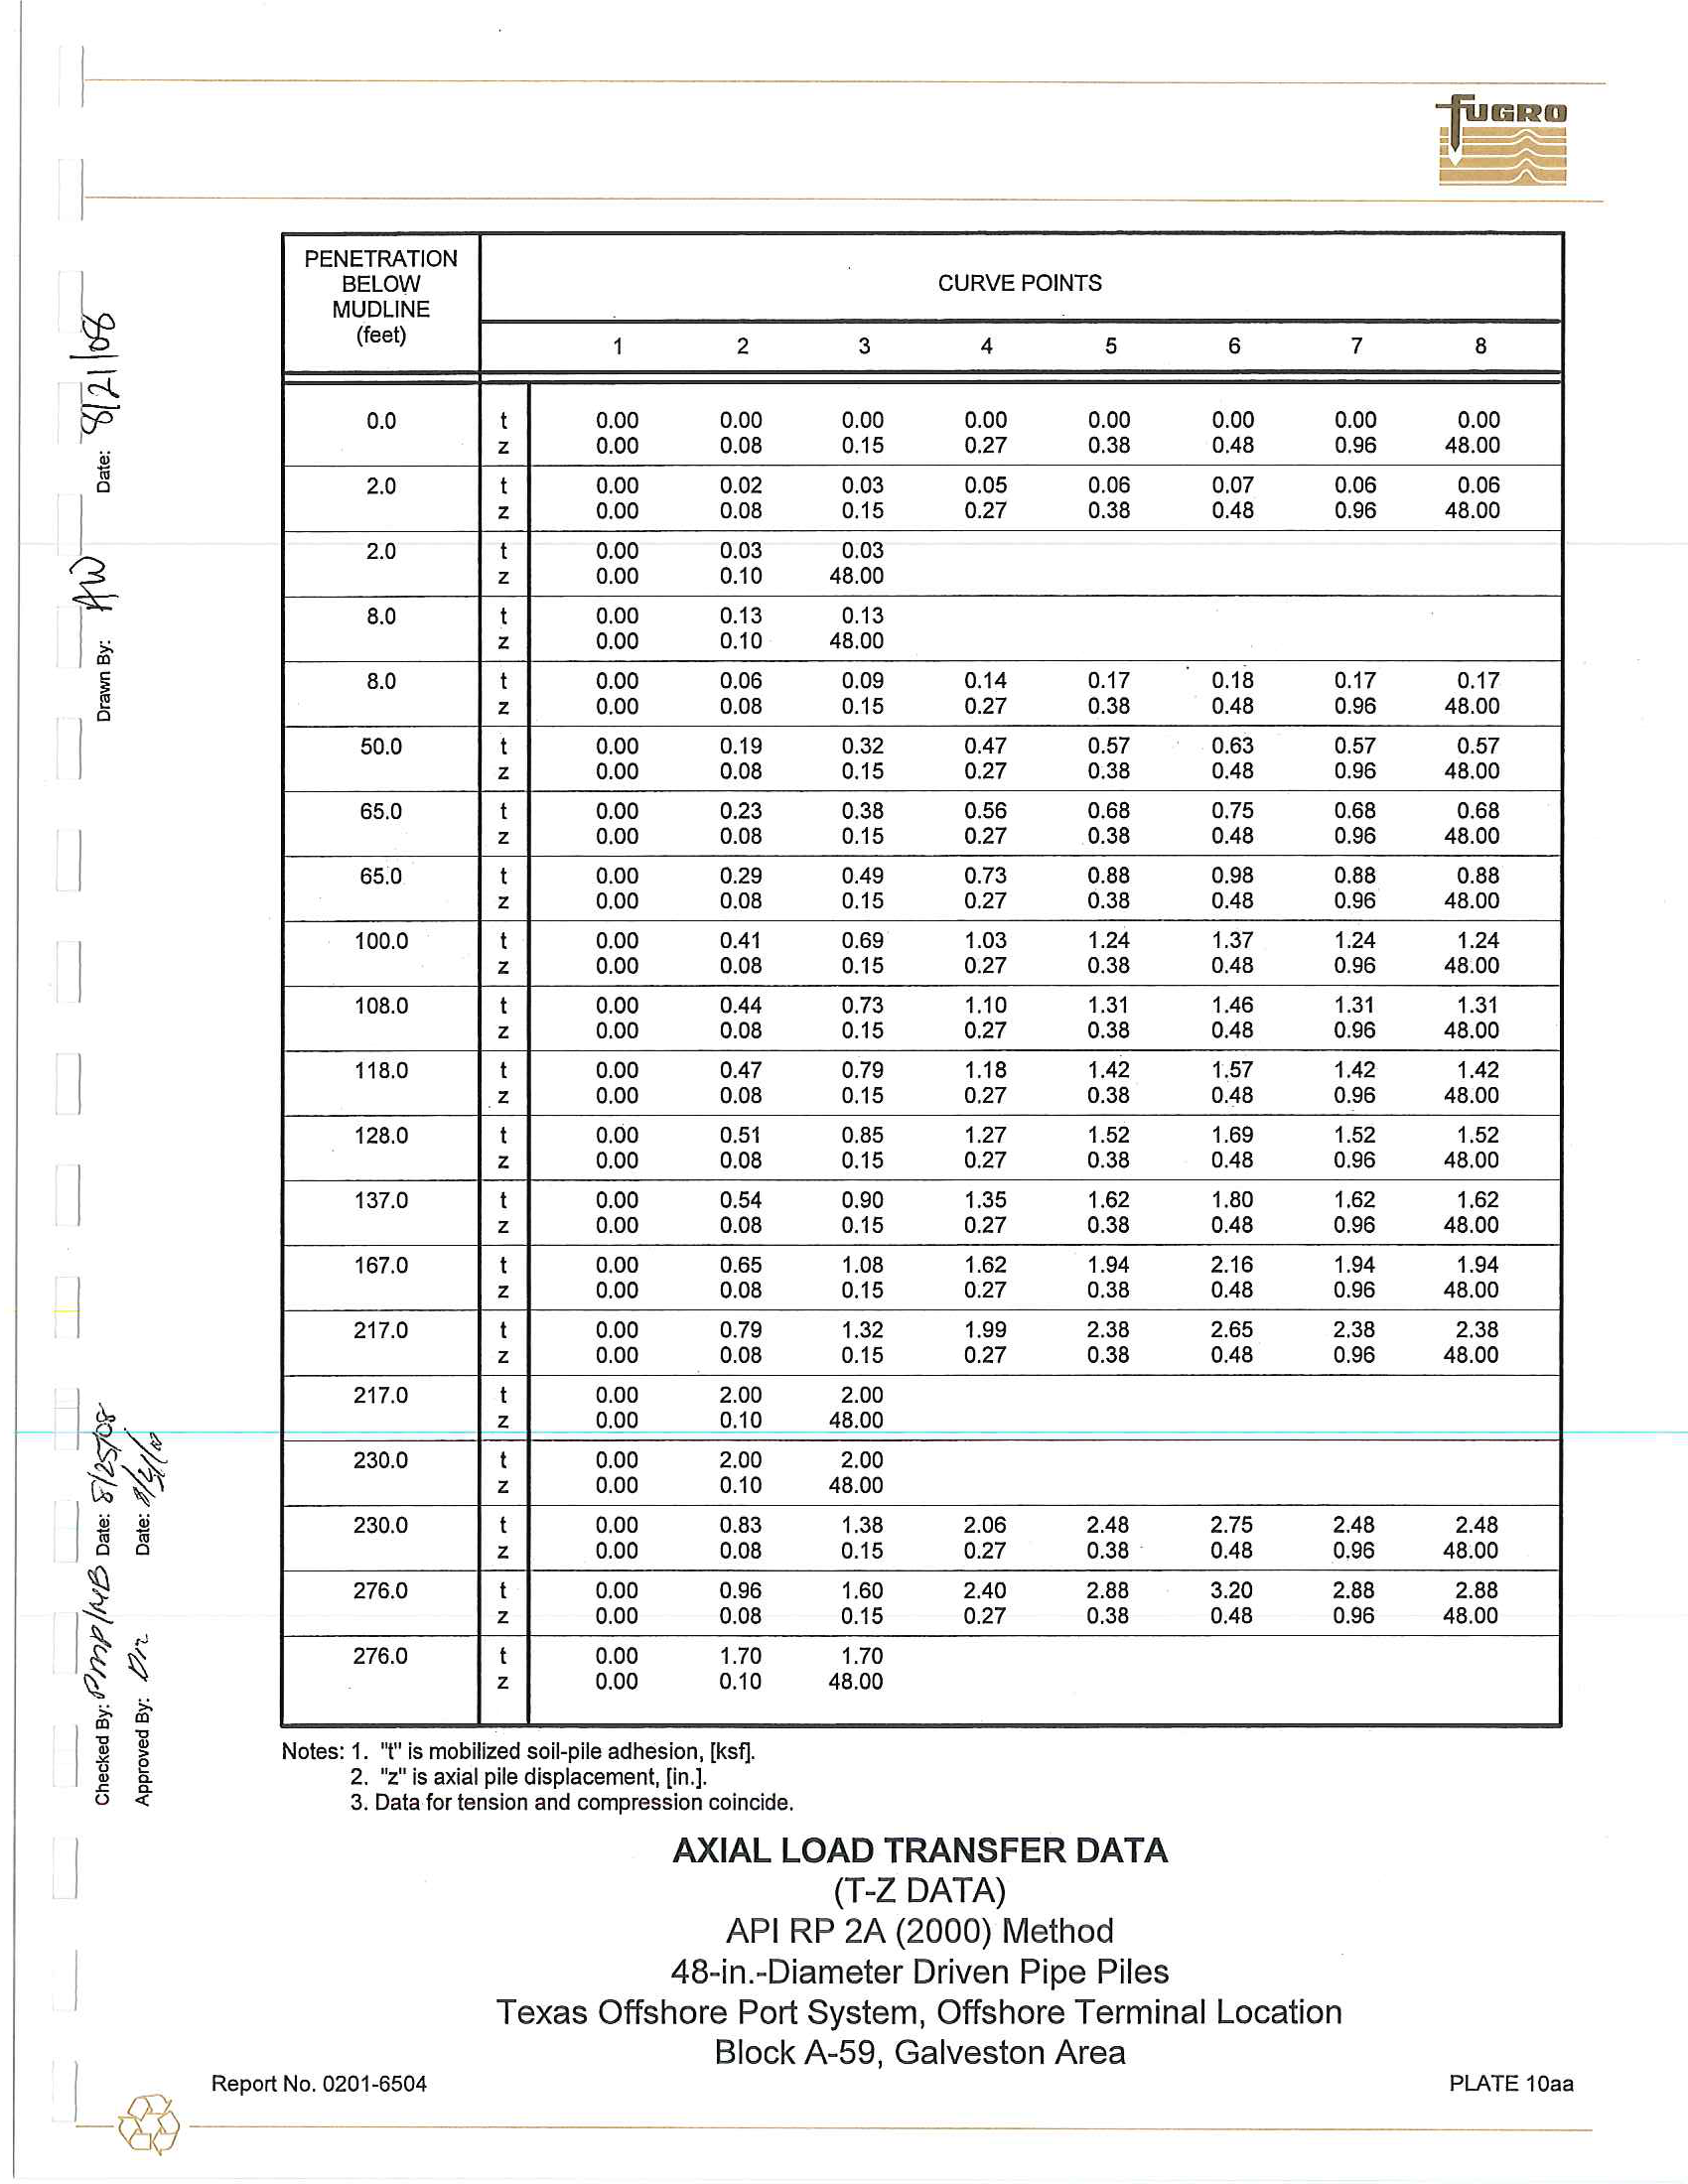
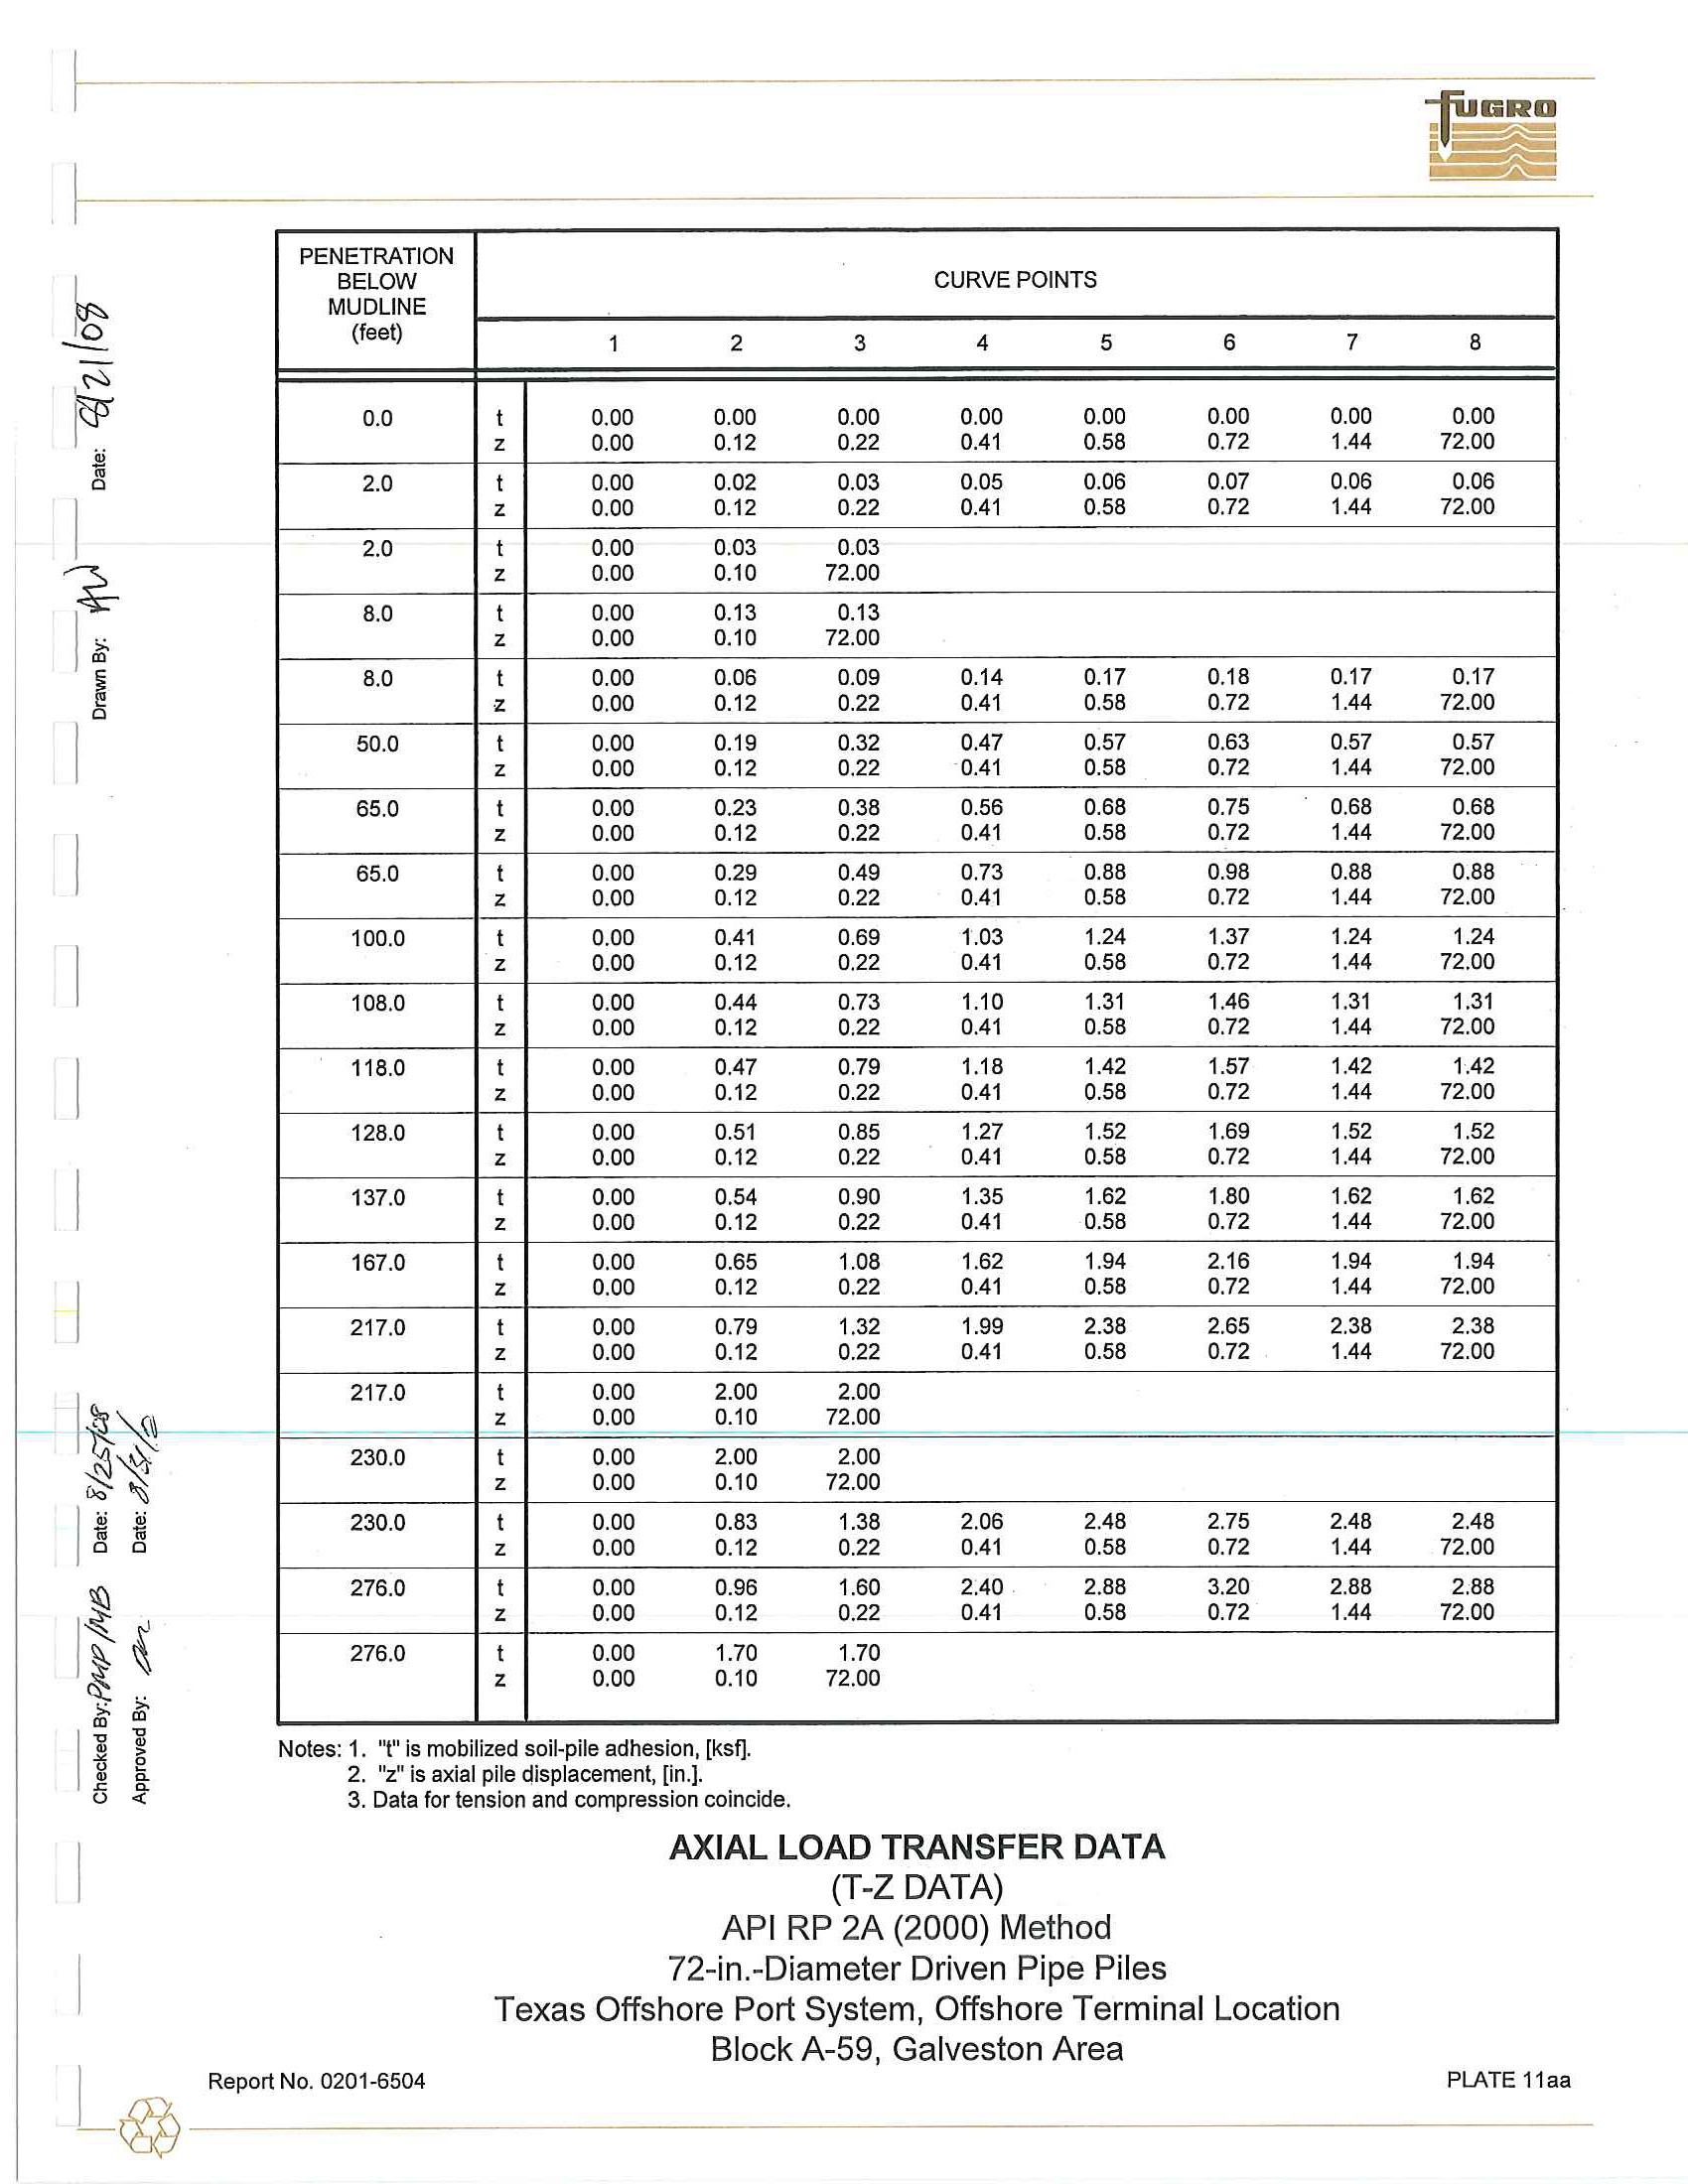
Notes: 1
.
"t"
is mobilized
soil-pile adhesion,
[
ksf]
.
2. "z" is axial pile disp
l
acement,
[
i
n
.
].
3
.
Data
for
tension and compression coin
c
ide.
AXIAL LOAD TRAN
SFE
R DATA
(T
-
Z DATA)
API R
P 2
A (
2
000)
M
e
thod
48
-
in
.
-
Diamet
e
r Driven Pipe Pi
l
es
6
7
0.00
0.00
0.48
0.96
0.07
0
.
06
0.48
0
.
96
0.18
0.17
0.48
0.96
0.63
0.57
0.48
0.96
0
.
75
0
.
68
0.48
0.96
0.98
0
.
88
0.48
0.96
1.37
1.24
0.48
0
.
96
1.46
1
.
31
0.4
8
0
.
96
1
.
57
1.42
0.48
0
.
96
1.69
1
.
52
0.48
0
.
96
1
.
80
1
.
62
0.48
0
.
96
2.16
1.94
0.48
0.96
2.65
2.38
0.48
0.96
2.75
2.48
0.48
0.96
3
.
20
2.88
0.48
0.96
Texas Offshore Port System, Offshore Terminal Location
Block A
-
59, Galv
e
ston Ar
e
a
8
0.00
48.00
0
.
06
48.00
0
.
17
48.00
0.57
48
.
00
0
.
68
48.00
0
.
88
48.00
1.24
48
.
00
1.31
48
.
00
1.42
48.00
1.52
48.00
1
.
62
48.00
1.94
48.00
2
.
38
48.00
2.48
48.00
2.88
48
.
00
PLATE
10aa
I
Report No.
0201-
6
504
-@--------------------------------
PENETRATION
BELOW
CURVE POINTS
MUDLINE
(feet)
1
2
3
4
5
315.0
t
0
.
00
1
.
70
1
.
70
z
0.00
0
.
10
48.00
315.0
t
0.00
0.90
1.50
2.25
2.70
z
0
.
00
0.08
0
.
15
0.27
0.38
356
.
0
t
0
.
00
0
.
90
1
.
50
2.25
2.70
z
0.00
0
.
08
0
.
15
0
.
27
0
.
38
356
.
0
t
0
.
00
1
.
00
1
.
00
z
0
.
00
0
.
10
48
.
00
389
.
0
t
0.00
1
.
00
1
.
00
z
0
.
00
0
.
10
48
.
00
389
.
0
t
0
.
00
1
.
11
1
.
85
2
.
77
3
.
33
z
0
.
00
0
.
08
0
.
15
0
.
27
.
0
.
38
450
.
0
t
0
.
00
1
.
20
2
.
00
3
.
00
3.60
z
0
.
00
0
.
08
0
.
15
0.27
0
.
38
-
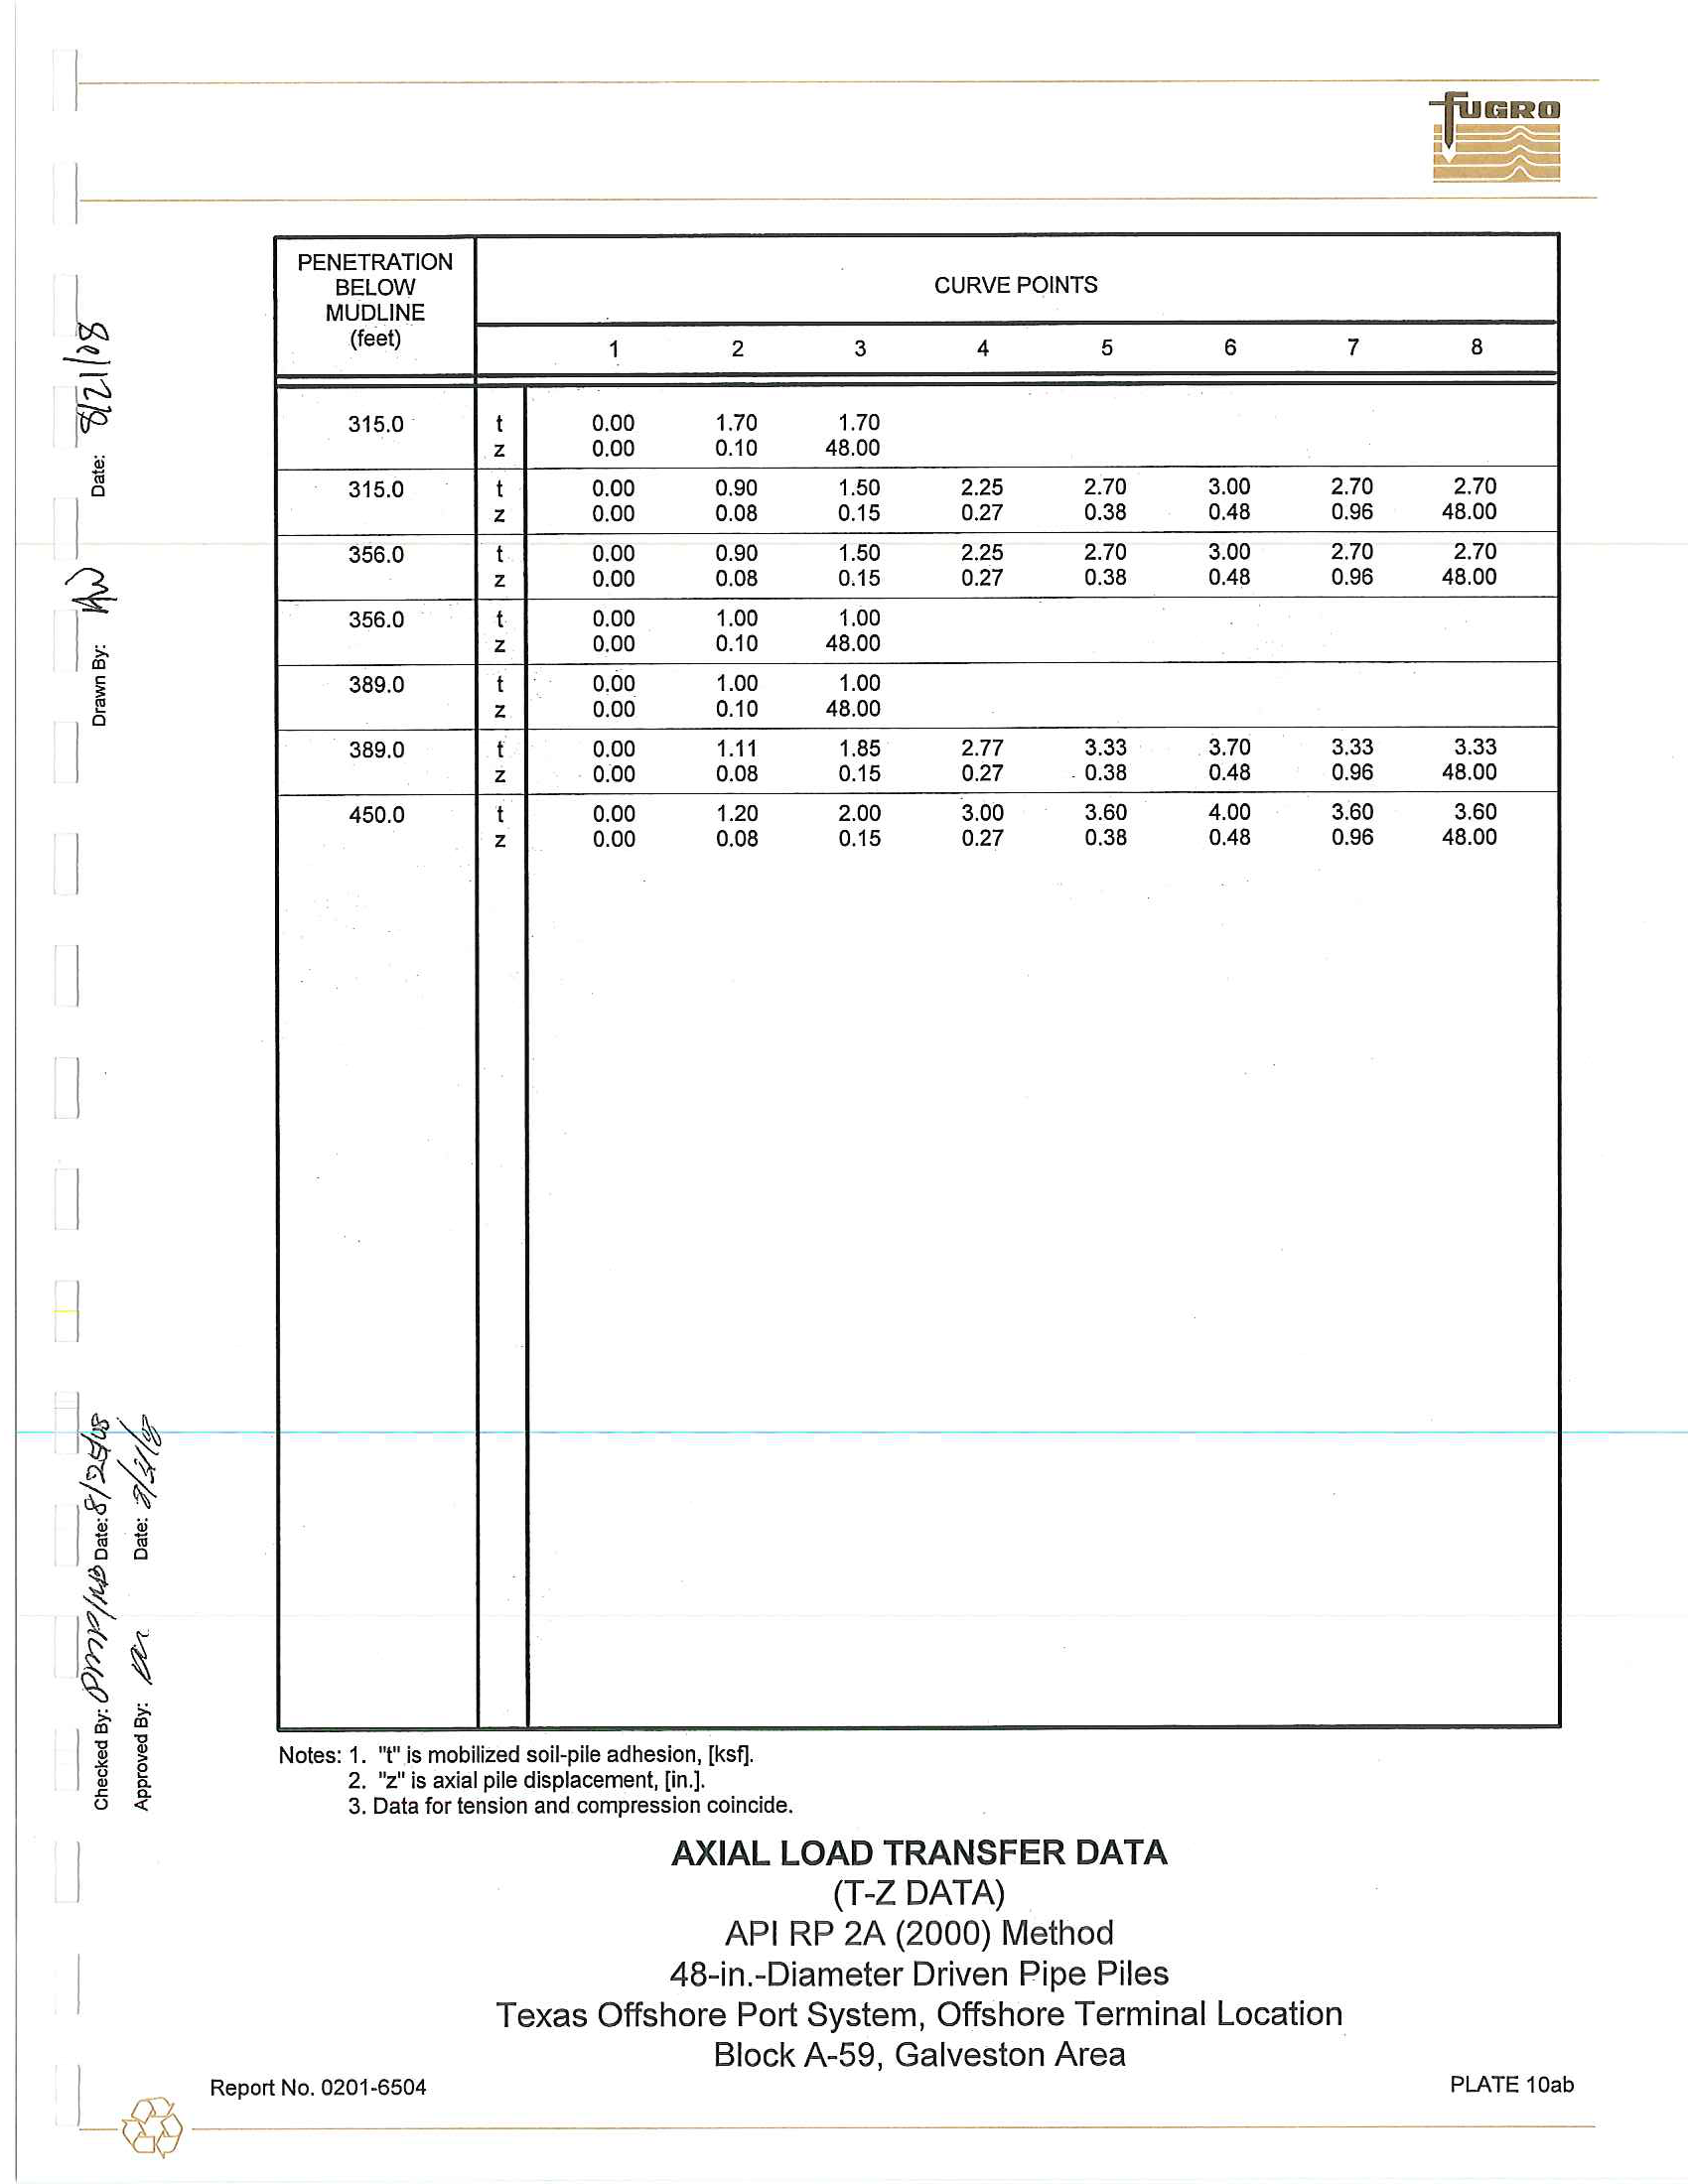
Notes
:
1
. "
t
"
is mobi
l
ized
soil-pile adhesion,
[ksf]
.
2
.
"
z" is a
xi
al
pile
displacement, [in
.
)
.
3
.
Data
for tension and compre
s
s
i
on coincide
.
AXIAL LOAD TRANSFER DATA
(T-Z DATA)
API
RP
2A (2000)
Method
48-in.
-
Diameter Driven Pipe Piles
6
7
3
.
00
2.70
0.48
0.96
3
.
00
2.70
0
.
48
0.96
3
.
70
3
.
33
0
.
48
0
.
96
4
.
00
3
.
60
0.48
0
.
96
I
Report No
.
0201-6504
Texas Offshore Port System, Offshore Terminal
Location
Block A-59, Galveston Area
-@----
8
2.70
48.00
2.70
48.00
3.33
48
.
00
3
.
60
48.00
PLATE
10ab
I
~~
;(l
~
~
~
l\;-
I
0;
0;
~
8
If)
I
1
~
~
PENETRATION
BE
L
OW
MUDLINE
(feet)
1
00
.
0
217.0
223
.
0
230
.
0
276.0
288.0
289
.
0
30
3
.0
315.0
356.0
368
.
0
377
.
0
389
.
0
450
.
0
1
2
Q
0
42
z
.
0.00
0
.
1
0
Q
0
75
z
0
:
00
0
.
10
Q
0
352
z
0
.
00
0.10
Q
0
78
z
0.00
0.10
Q
0
.
90
z
0.00
0
.
10
Q
0
314
z
0
.
00
0
.
10
Q
0
314
z
0
.
00
0
.
10
Q
0
314
z
0.00
0
.
10
Q
0
85
z
0
.
00
0.10
Q
0
85
z
0
.
00
0.10
Q
0
126
z
0.00
0.10
Q
0
126
z
0.00
0.10
Q
0
105
z
0
.
00
0
.
10
Q
0
113
z
0
.
00
0
.
10
CURVE
POIN
T
S
3
4
5
6
85
127
152
169
0
.
62
2.02
3.50
4.80
150
225
270
300
0
.
62
2
.
02
3
.
50
4.80
703
1055
1266
1406
0
.
62
2
.
02
3.50
4
.
80
156
233
280
311
0.62
2.02
3.50
4.80
181
271
326
362
0.6
2
2
.
02
3
.
50
4
.
80
628
942
1131
1257
0
.
62
2
.
02
3
.50
4
.
80
62
8
942
1131
1257
0
.
62
2
.
02
3
.
50
4.80
628
942
1131
1257
0.62
2
.
02
3
.
50
4
.
80
170
254
305
339
0.62
2.02
3
.
50
4.80
170
254
305
339
0.62
2.02
3
.
50
4.80
251
377
45
2
503
0
.
62
2.02
3
.50
4.80
251
377
452
503
0.62
2
.
02
3.50
4
.
80
209
314
377
418
0
.
62
2
.
02
3.50
4.80
226
339
407
452
0.62
2.02
3.50
4.80
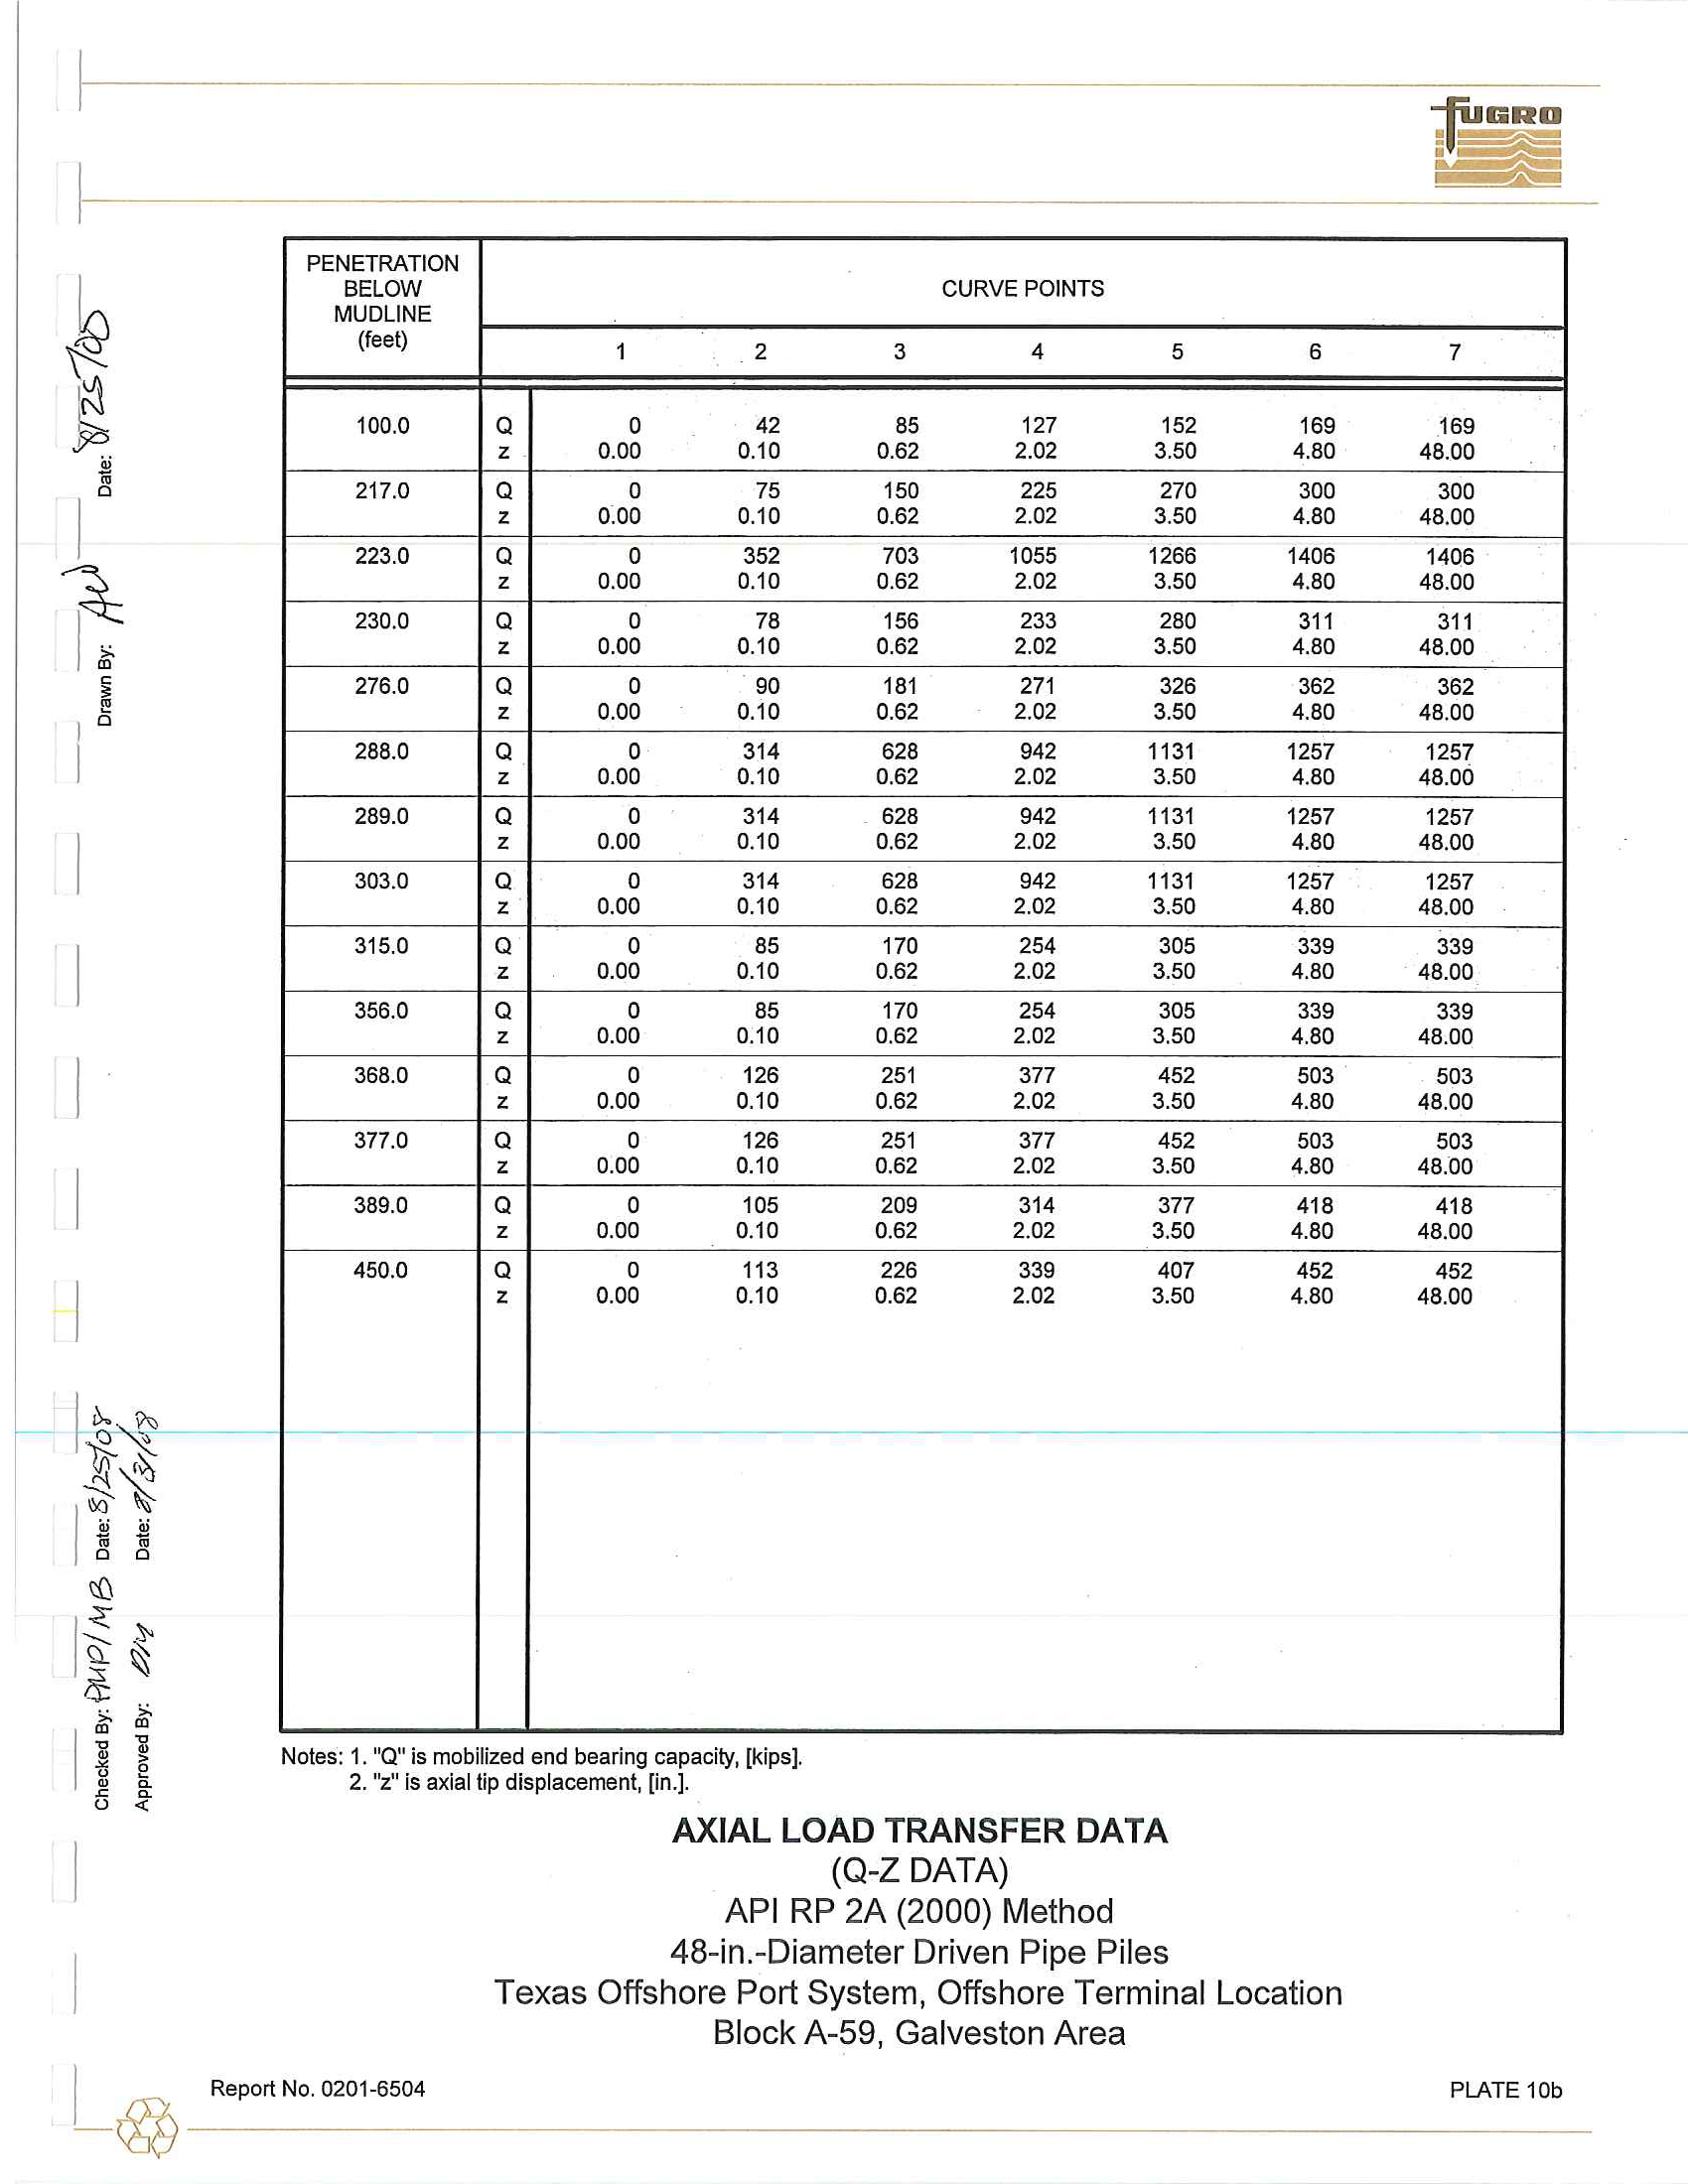
~
1
Notes
:
1
.
"a"
i
s mob
il
ized end bea
r
ing capacity, [kips
]
.
~
:i
2. liZ" is axia
l
tip disp
l
acement,
[
in.
].
U
"'
AXIA
L L
OAD
T
RAN
SFER D
A
T
A
(Q
-Z
DATA)
A
P
I
R
P
2
A
(
2
000) M
e
thod
48-
in
.
-D
i
a
m
e
t
e
r Driv
e
n
P
ip
e
Pil
es
Te
x
as Offshor
e
Port Syst
e
m, Off
s
hor
e
T
e
rmin
a
l Lo
c
ation
Block A
-
59, Galv
e
ston Area
7
169
48.00
300
48
.
00
1406
48
.
00
311
48.00
362
48.00
1257
48.00
1257
48
.
00
1
257
48
.
00
3
39
48.00
3
3
9
48
.
00
503
48.00
503
48.
0
0
418
48.00
452
48
.
00
1___
~
__
R
_
e
_
po
_
rt
_
N
_
O
_
.
0
_
2
_
0
_
1-
_
6
_
5
0
_
4
_____________________________________________________________
P
_
LA
__
T
_
E
_
1
_
0b
__
I
~
I
i;'
!
I
PENETRATION
BELOW
CURVE
PO
I
NTS
MUDLINE
(feel)
1
2
3
4
5
0
.
0
I
0
.
00
0.00
0
.
00
0
.
00
0
.
00
z
0.00
0
.
12
0
.
22
0.41
0
.
58
2.0
1
0.00
0.02
0
.
03
0
.
05
0
.
06
z
0.00
0
.
12
0.22
0.41
0
.
58
2
.0
1
0.00
0
.
03
0
.
03
z
0.00
0
.
10
72.00
8
.
0
1
0
.
00
0
.
13
0.13
z
0
.
00
0
.
10
72
.
00
8
.
0
1
0
.
00
0
.
06
0
.
09
0
.
14
0.17
z
0
.
00
0
.
12
0
.
22
0.41
0
.
58
5
0.
0
1
0
.
00
0
.
19
0
.
32
0
.
47
0
.
57
z
0
.
00
0
.
12
0
.
22
0
.
41
0
.
58
65
.
0
1
0
.
00
0
.
23
0
.3
8
0
.
56
0
.
68
z
0
.
00
0.12
0
.
22
0
.
41
0
.
58
65.0
1
0
.
00
0
.
29
0.49
0.73
0.88
z
0
.
00
0
.
12
0.22
0.41
0.58
100
.
0
1
0
.
00
0.41
0.69
1.03
1
.
24
z
0
.
00
0.12
0.22
0.41
0.58
108
.
0
1
0
.
00
0.44
0.73
1.10
1.31
z
0.00
0.12
0.22
0.41
0.58
118.0
1
0
.
00
0.47
0
.
79
1.18
1.42
z
0
.
00
0
.
12
0.22
0.41
0.58
128.0
1
0
.
00
0.51
0.85
1.27
1
.
52
z
0
.
00
0
.
12
0.22
0.41
0.58
137
.
0
1
0.00
0.54
0
.9
0
1
.
35
1
.
62
z
0
.
00
0
.1
2
0
.
22
0.41
0
.
58
167
.
0
I
0
.
00
0
.
65
1.08
1
.
62
1
.
94
z
0
.
00
0
.
12
0
.
22
0.41
0
.
58
217
.
0
1
0.00
0
.
79
1
.
32
1.99
2
.
38
z
0
.
00
0
.
12
0
.
22
0
.
41
0
.
58
217
.
0
1
0.00
2.00
2
.
00
z
0.00
0
.
10
72
.
00
230
.
0
1
0.00
2.
00
2
.
00
z
0.00
0.10
72.00
230
.
0
1
0.00
0.83
1.38
2.06
2.48
z
0.00
0.12
0.22
0.41
0.58
276
.
0
1
0
.
00
0
.
96
1.60
2.40
2
.
88
z
0
.
00
0
.
12
0
.
22
0.41
0.58
276
.
0
1
0
.
00
1
.
70
1
.
70
z
0
.
00
0
.
10
72
.
00
No
t
es
:
1
,
"t"
is
mobi
li
zed soil.pile adhesion
,
[ksf]
.
2. "z
"i
s a
x
ial
pile d
i
sp
l
acement,
[in
.
]
.
3
.
Data for
tension and compre
ss
i
o
n
co
i
ncide
.
AXIAL LOAD TRANSFER DATA
(T-Z DATA)
API
RP 2A (2000)
Method
72
-
in.-Diameter
Driven Pipe Piles
6
7
0
.
00
0.00
0
.
72
1.44
0.07
0
.
06
0
.
72
1.44
0
.
18
0
.
17
0
.
72
1.44
0
.
63
0
.
57
0
.
72
1
.
44
0
.
75
0
.
68
0
.
72
1.44
0
.
98
0
.
88
0
.
72
1.44
1
.
37
1
.
24
0
.
72
1.44
1.46
1
.
31
0
.
72
1.44
1
.
57
1.42
0
.
72
1.44
1
.
69
1
.
52
0
.
72
1.44
1
.
80
1
.
62
0
.
72
1.44
2
.
16
1
.
94
0
.
72
1.44
2
.
65
2
.3
8
0
.
72
1.44
2
.
75
2.48
0.72
1.44
3
.
20
2
.
88
0
.
72
1.44
Texas
Offshore
Port
System, Offshore
Terminal Location
Block A
-
59, Galveston
Area
8
0.00
72.00
0.06
72.00
0
.
17
72.
0
0
0
.
57
72.00
0
.
68
72.00
0
.
88
72
.
00
1.24
72.00
1
.
31
72.00
1.42
72.00
1.52
72.00
1
.
62
72
.
00
1
.
94
72.00
2
.
38
72
.
00
2.48
72.00
2.88
72.00
I
PLATE
11 aa
Report
No
.
02
01-6504
-~---------------------------------------
~------
I
~
I
~
~
I
I
PENETRATION
BELOW
CURVE POINTS
MUDLINE
(feet)
1
2
3
4
.
5
315
.
0
t
0
.
00
1.70
1.70
z
0
.
00
0.10
72.00
315.0
t
0.00
0.90
1
.50
2.25
2.70
z
0.00
0.12
0.22
0.41
0.58
356
.
0
t
0.00
0.90
1
.
50
2.25
2.70
z
0
.
00
0
.
12
0
.
22
0
.
41
0
.
58
356.0
t
0
.
00
1
.
00
1.00
z
0
.
00
0.10
72.00
389.0
t
0
.
00
1.00
1
.
00
z
0.00
0.10
72.00
.
389.0
t
0.00
1.11
1.85
2.77
3.33
z
0.00
0.12
0
.
22
0.41
0
.
58
450.0
t
0.00
1.20
2.00
3.00
3
.
60
z
0
.
00
0
.
12
0.22
0
.
41
0
.
58
-
-
-
r
-
-
--
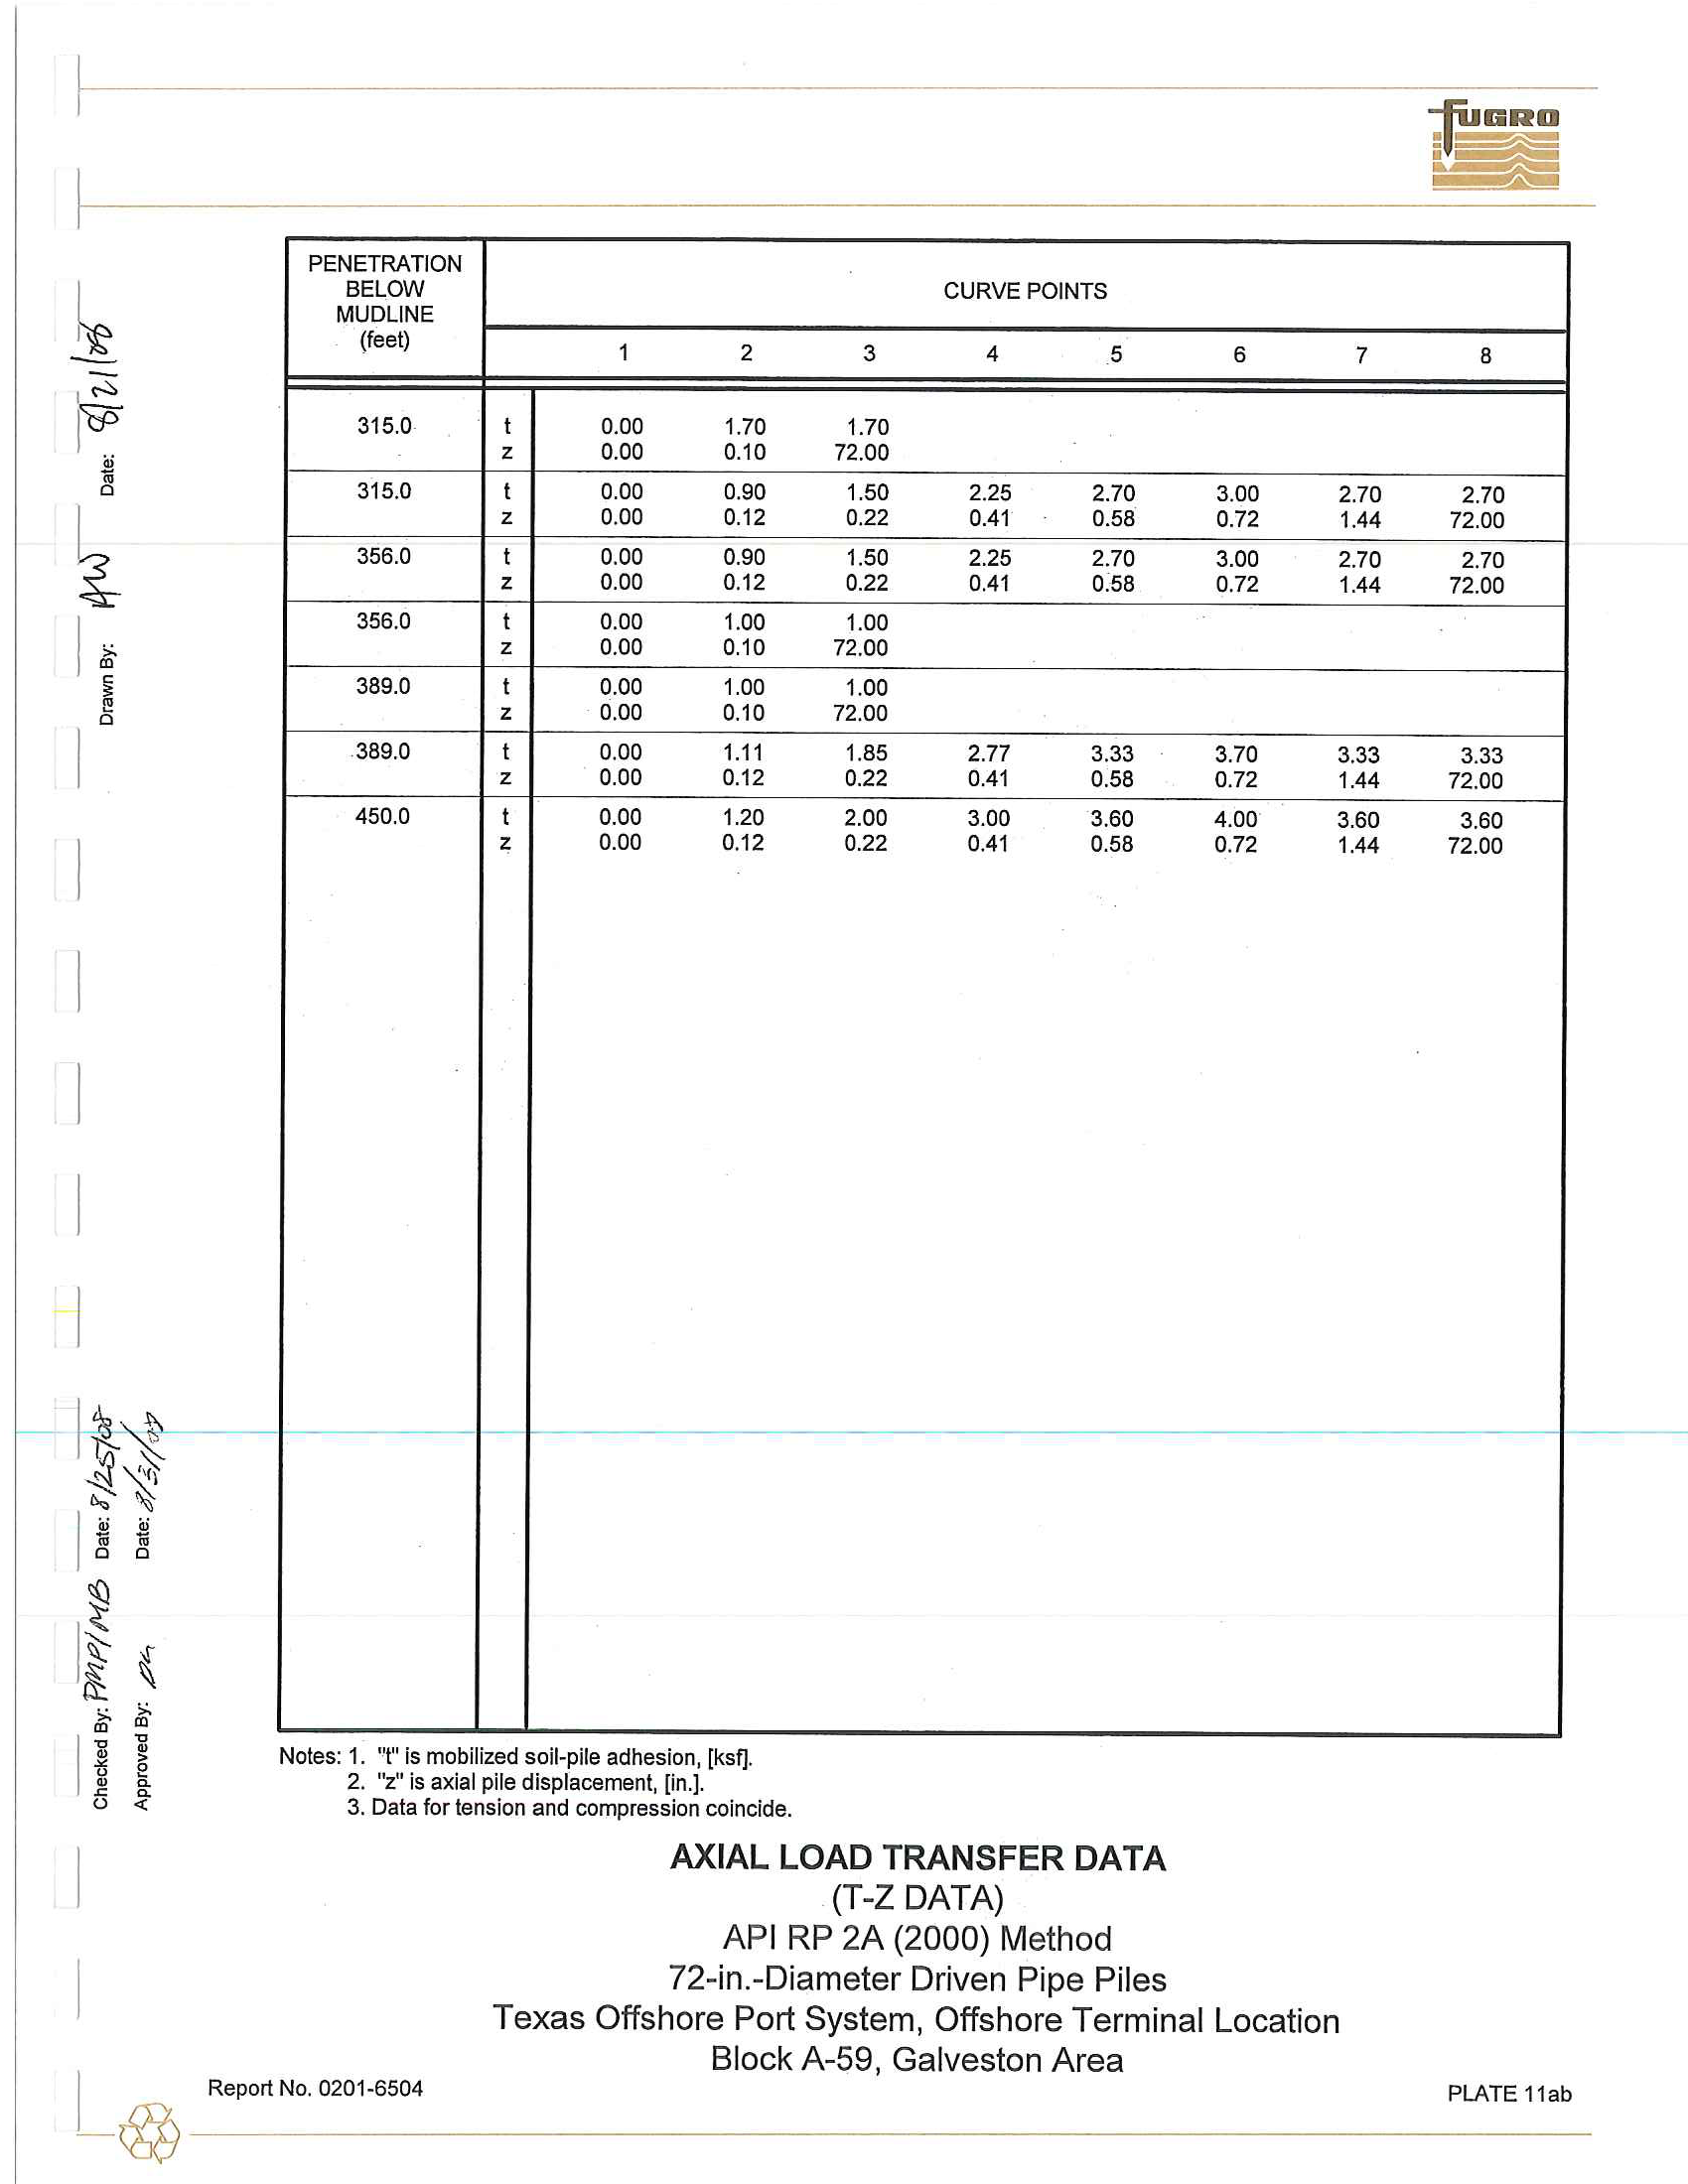
Notes
:
1
.
"t"
Is mobilized
soil~pile
adhesion,
[ksf].
2. "z" is axial pile
displa
cement,
[in.].
3
.
Data for tension and
co
mpression
coincide.
AXIAL LOAD TRANSFER DATA
(T-Z DATA)
API RP
2A
(2000) Method
72-in.-Diameter Driven Pipe Piles
6
7
3
.
00
2.70
0.72
1.44
3.00
2
.
70
0
.
72
1.44
3.70
3
.
33
0.72
1.44
4.00
3.60
0
.
72
1.44
Texas Offshore Port System, Offshore Terminal Location
Block A-59, Galveston Area
8
2.70
72.00
2
.
70
72.00
3
.
33
72.00
3
.
60
72.00
I
PLATE
11ab
Report No. 0201.6504
-
@-
-
--------------
PENETRATION
BELOW
CURVE PO
I
N
T
S
MUDLINE
(feel)
1
2
3
4
5
6
1
00
.
0
Q
0
95
1
90
2
8
5
342
380
z
0
.
00
0
.
14
0
.
94
3
.
02
5.26
7.20
217
.
0
Q
0
169
337
506
607
674
z
0.00
0
.
14
0
.
94
3.02
5.26
7
.
20
223.0
Q
0
584
1167
1751
2101
2335
z
0
.
00
0
.
14
0
.
94
3.
02
5
.
26
7
.
20
230
.
0
Q
0
175
3
50
525
630
700
z
0.00
0
.
14
0.94
3.02
5.26
7.20
276.0
Q
0
204
407
61
1
733
8
1
4
z
0.00
0
.
14
0
.9
4
3
.
02
5
.
26
7
.
20
294
.
0
Q
0
707
1414
2121
2545
2827
z
0
.
00
0
.
14
0
.
94
3
.
02
5
.
26
7
.
20
297.0
Q
0
707
1
414
2121
2545
2827
z
0.00
0
.
14
0.94
3.02
5
.
26
7
.
20
3
1
5
.
0
Q
0
191
382
573
687
763
z
0
.
00
0
.
14
0
.9
4
3.02
5
.
26
7.20
356.0
Q
0
1
91
3
8
2
573
687
763
z
0.00
0
.
14
0
.
94
3.02
5.26
7.20
372
.
0
Q
0
273
545
818
981
1090
z
0
.
00
0
.
14
0
.
94
3
.
02
5.26
7
.
20
389
.
0
Q
0
235
471
70
6
847
942
z
0
.
00
0
.
14
0
.
94
3
.
02
5.26
7.20
450
.
0
Q
0
254
509
763
916
1
018
z
0
.
00
0
.
14
0.94
3.02
5.26
7
.
20
-
-
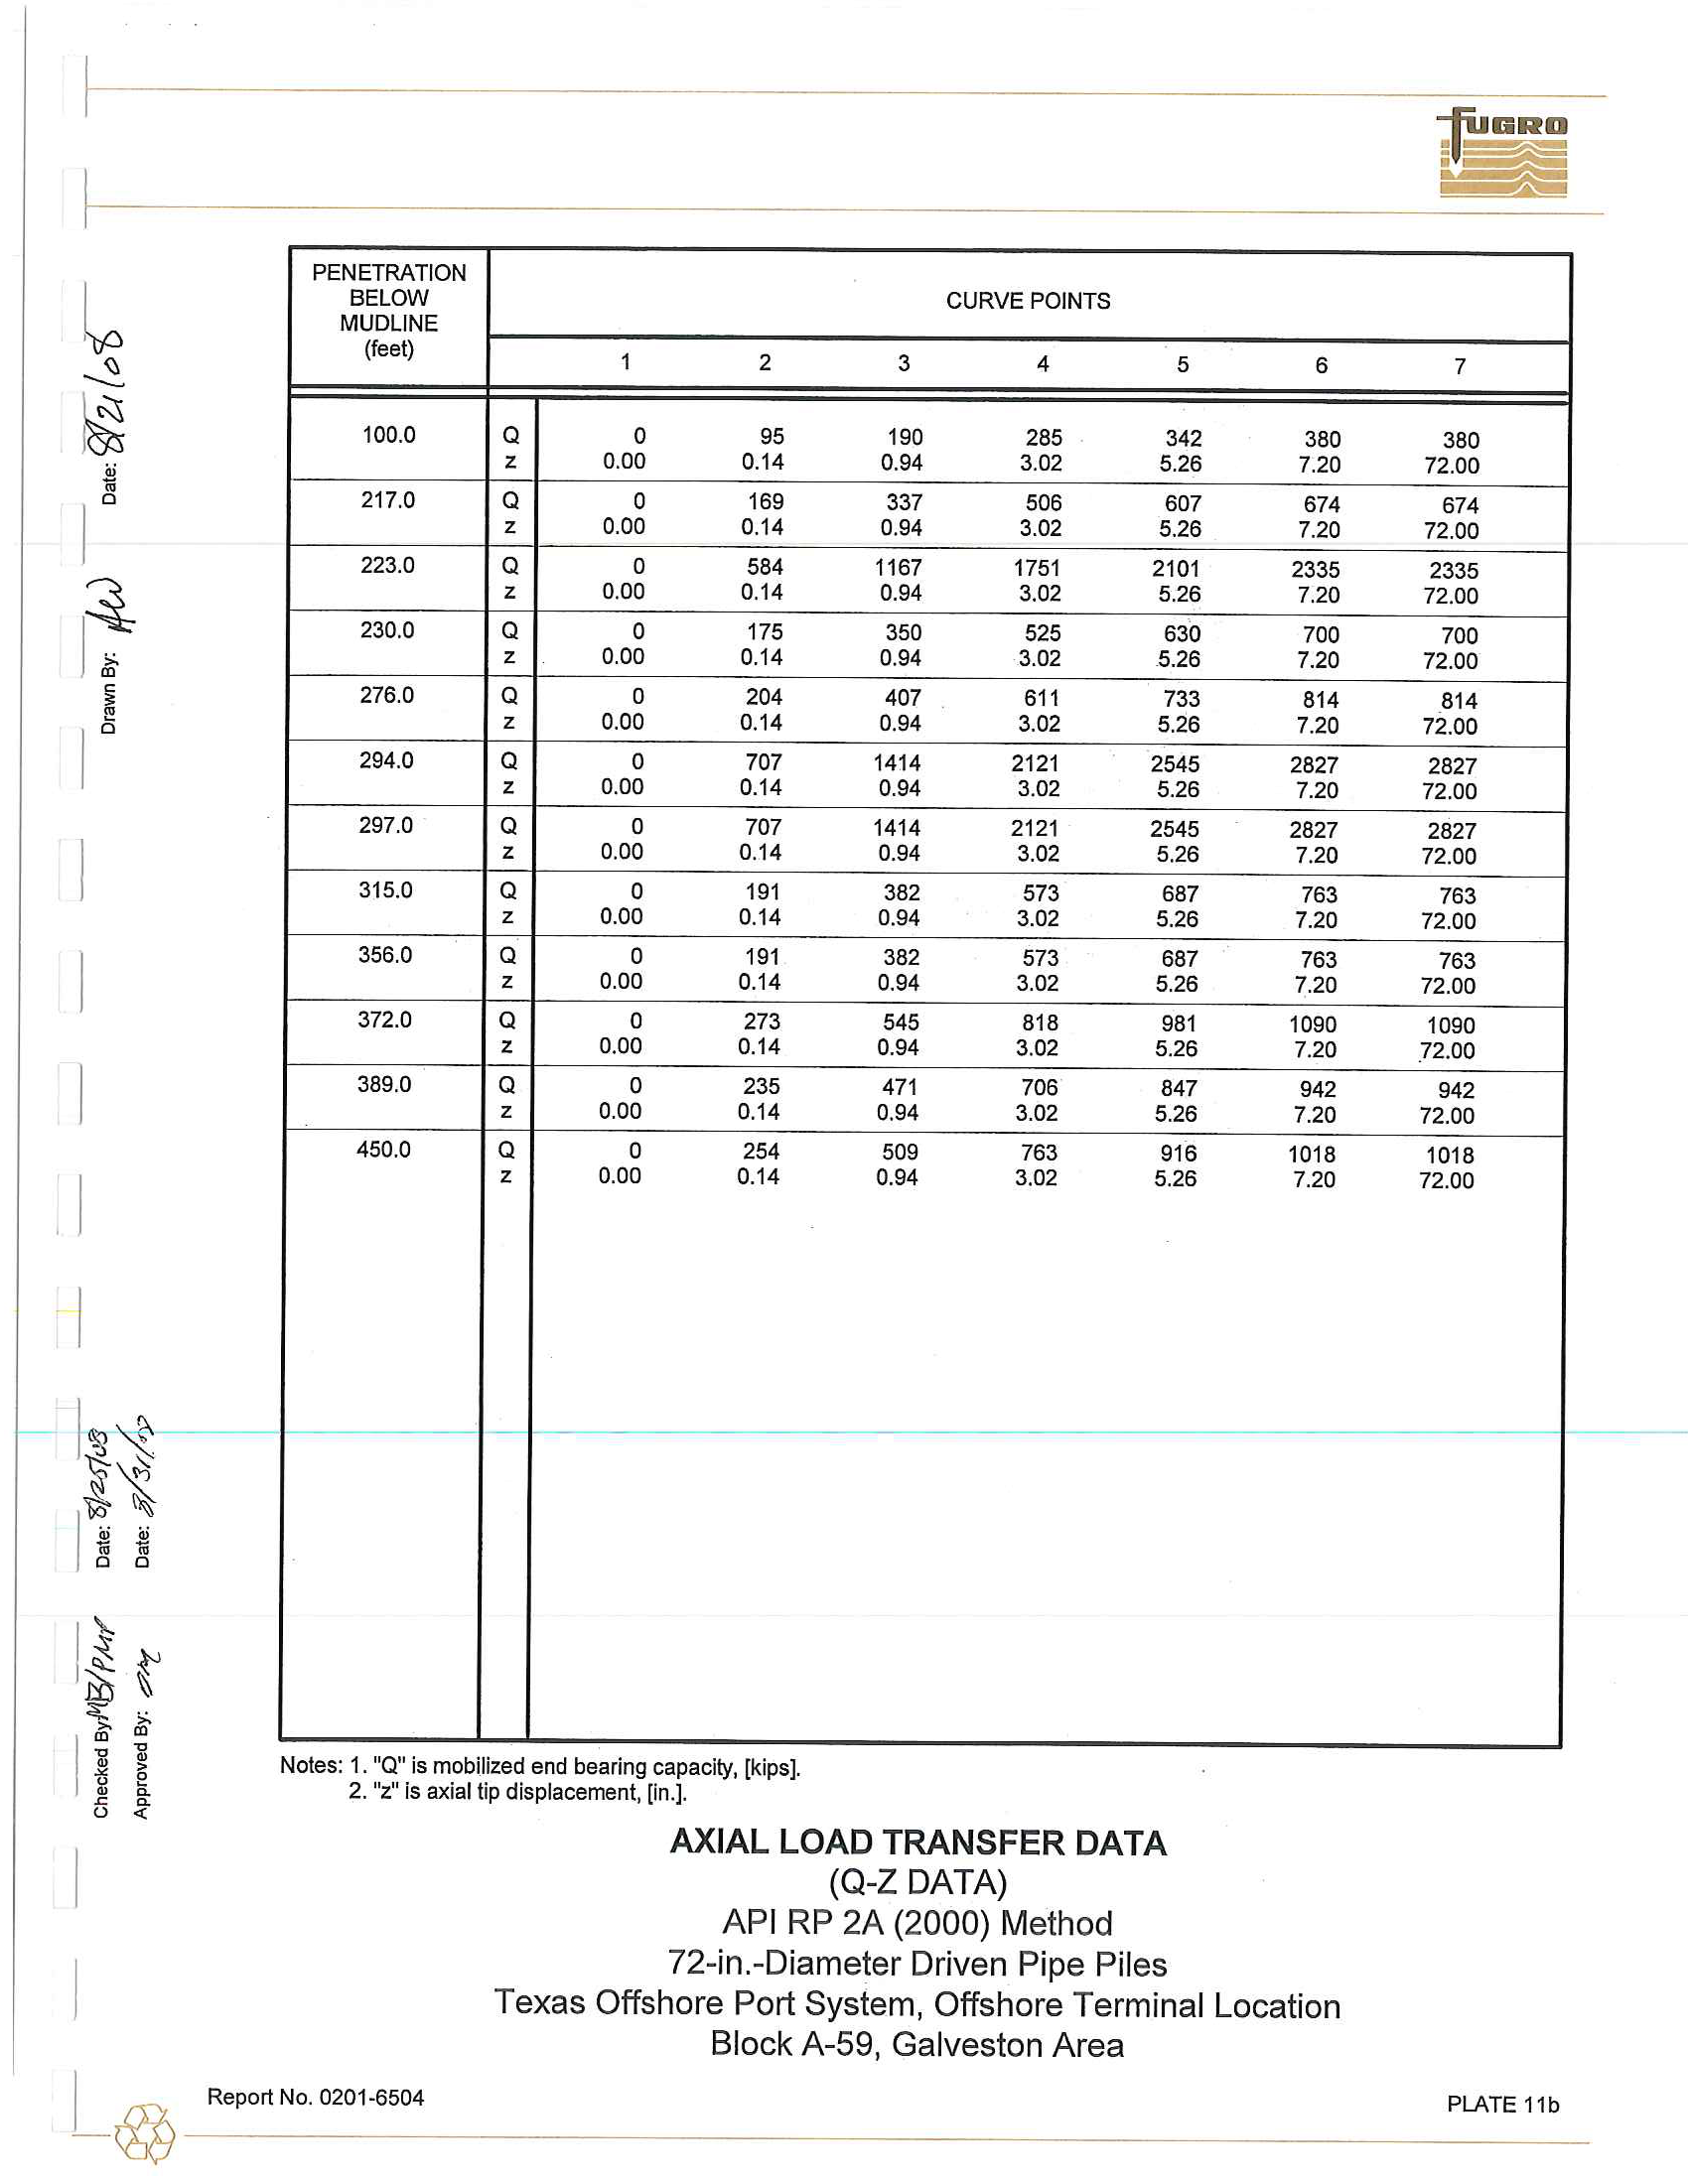
Notes
:
1
.
"Q"
is mobilized end bearing capac
i
ty, [kips]
.
2
.
"
z" Is ax
i
al l
i
p displaceme
n
t
,
[
i
n
.
J
.
AX
I
AL LOAD TRANSFER DATA
(
Q
-
Z DATA)
AP
I
RP
2A (2000) M
e
thod
72
-
i
n
.
-D
i
ameter Dr
iv
en P
i
pe Pi
l
es
Texas Offs
h
ore Port System, Offs
h
o
r
e Te
r
m
in
a
l
Locat
i
on
B
lo
ck A-59, Ga
l
ves
to
n Area
7
380
72
.
00
674
72.00
23
3
5
72.00
700
72.00
814
72
.
00
2827
72.00
2827
72
.
00
763
72
.
00
76
3
72
.
00
1090
.72
.
00
942
72
.
00
1018
72
.
00
_I
_
~
_
R
_
e
_
po
_
rt
_
N
_
O
_
.
_
0
2
_
0
_
1
_
-6
_
50
_
4
____________
_
_
__
_______________
P
_
LA
_
T
_
E
_
l
_
1
b
___
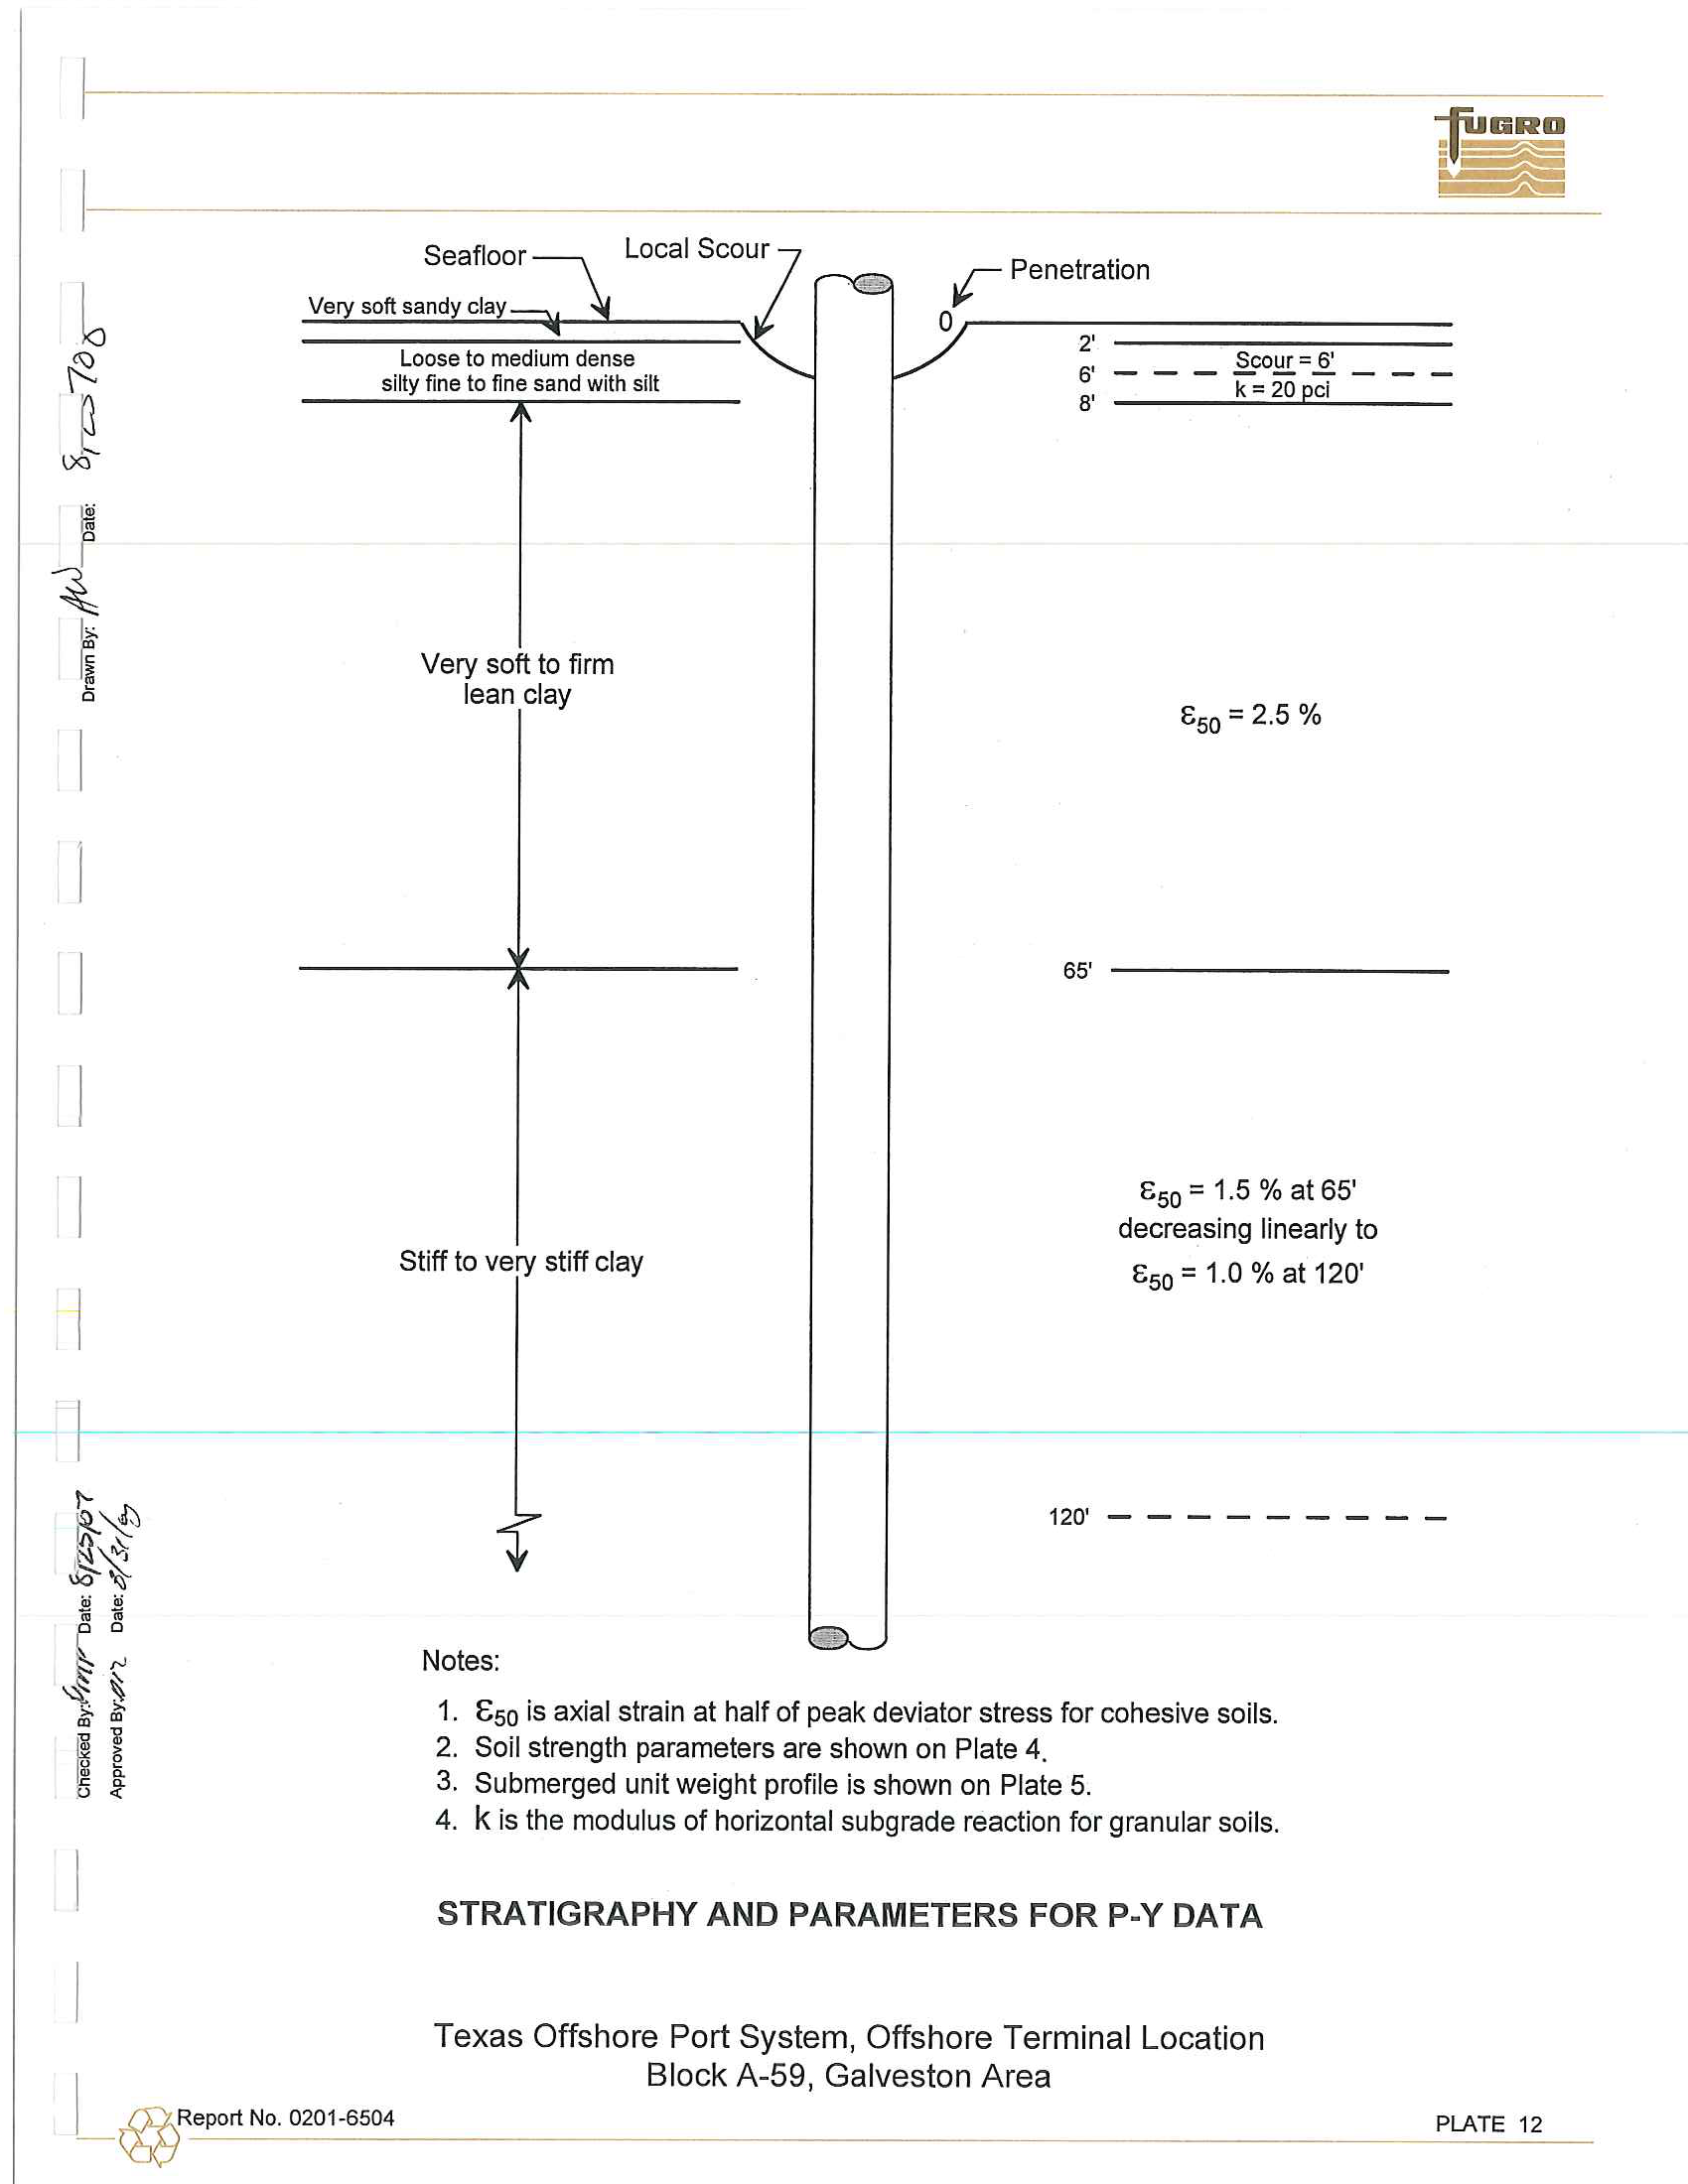
seaftoo:\
Local
scoulr
P t t
'
~~
.~
ene ra Ion
VeIV
so
ft sandy clay
_
.
"--
'C.:
/t
r
--:
2l
,
--===::;;::=:;:::===
Lo
o
se to
medium
dense
S
co
ur
=
6'
Back to top
6' ---------
silty fine to
fine
sand with silt
8'
k = 20 pel
1
_
@
Re
p
ortNo
.
0201-6
5
04
Very soft
to
firm
lean clay
St
i
ff to very
st
i
ff
clay
65'
ESO
=
2.5
%
ESO
=
1.5 %
at
65'
decreasing linearly to
Eso = 1
.
0
%
at 120'
120'
-
-
-
-
-
-
-
-
-
Notes:
1.
Eso is
axial strain at half of
peak deviator
stress for cohesive soils
.
2
.
Soil strength
parameters are shown
on
Plate
4
.
3
.
Submerged unit
weight profile
i
s shown on
Plate
5.
4.
k is the
modulus of
horizontal
subgrade
reaction for
granular soils
.
S
TRATI
G
RAPHY AND PARAM
E
T
E
R
S
F
O
R P-Y DATA
Texas Offshore Port System, Offshore Terminal Location
Block A
-
59, Galveston Area
PLATE 12
1
'
P
E
N
ET
RA
T
ION
BELOW
MUD
LI
NE
(feet)
1
0
,
0
P
°
y
0,00
6
,
0
P
°
y
0,00
8,0
P
°
Y
0
,
00
8,0
P
°
Y
0
,
00
12,0
P
°
Y
0
,
00
1
6,0
P
°
Y
0,00
20,0
P
°
Y
0
,
00
25
,
0
P
°
Y
0,00
65,0
P
°
Y
0,00
65
,
0
P
°
Y
0
,
00
1
20,0
P
°
(and below)
y
0,00
Notes:
1.
lip
" i
s soi
l r
es
i
stance
,
{lb/
in
.].
2
,
"'/'
i
s late
r
a
l
deflectio
n
,
[
in.].
CURVE PO
I
NTS
2
3
4
5
48
°
,
00
48,00
°
47
79
1
04
131
0.Q7
0
,
12
0
,
17
0,25
60
9
1
1
35
199
0
,
08
0,30
0,90
3
,
00
92
14
1
208
306
0
,
08
0
,
30
0,90
3,00
127
195
288
424
0,08
0,30
0
,
90
3,00
160
245
362
532
0,08
0,30
0
,
90
3,00
195
300
443
651
0,08
0,30
0
,
90
3
,
00
338
518
765
1125
0
,
08
0,30
0,90
3,00
518
794
1173
1725
0,05
0,18
0,54
1
,
8
0
762
11
68
1
727
2540
0,03
0,12
0,36
1
,
20
P
-
Y DATA
(CYCLIC LOAD
I
NG)
AP
I
RP
2
A (
2
000) M
e
thod
48
-
i
n
,
-
D
i
ameter D
ri
v
e
n P
i
pe P
i
les
6
7
1
50
1
56
0
,
39
0
,
56
286
46
9,00
45
,
00
441
187
9,00
45,00
610
407
9,00
45
,
00
767
650
9,00
45,00
938
938
9,00
48,00
1620
1620
9,00
48,
0
0
2484
2484
5AO
4
8,00
3657
3657
3,60
48,00
T
e
xas Offshore Port System
,
Offs
h
ore Termina
l
Locat
i
on
B
l
oc
k
A
-
59
,
Ga
lv
eston Area
8
1
58
48,00
46
48,00
1
87
48,00
407
4
8
,
00
650
48,00
--
_I
_~_
R
_
e
_
p
_
ort
__
N
O
_
'
_
02
_
0
_
1
_
-6
_
5
_
04
_______________________________
P
_
LA
_
T
_
E
_
l
_
3
___
~
I
~
~
I
~
I
I
PENETRATION
BELOW
MUDLINE
(feel)
1
0.0
P
0
y
0.00
6.0
P
0
y
0.00
8
.
0
P
0
Y
0.00
8.0
P
0
Y
0.00
14
.
0
P
0
Y
0.00
20.0
P
0
Y
0.00
26.0
P
0
Y
0
.
00
33.0
P
0
Y
0
.
00
65.0
P
0
Y
0.00
65.0
P
0
Y
0.00
120.0
P
0
(and below)
y
0.00
Notes:
1. lip" is
soil
resistance, [lblln.].
2
,
"y"
is lateral
deflection, [in.].
CURVE
POINTS
2
3
4
5
0
72
.
00
0
72.00
55
92
122
154
0.09
0
.
15
0
.
22
0
.
33
84
130
191
282
0.12
0.45
1
.
35
4.50
142
218
322
474
0
.
12
0.45
1.35
4.50
206
316
467
686
0.12
0.45
1.35
4.50
270
414
612
900
0
.
12
0
.
45
1
.
35
4.50
336
515
761
1119
0.12
0.45
1
.
35
4.50
506
776
1147
1687
0.12
0.45
1.35
4.50
776
1190
1759
2587
0.07
0.27
0.81
2
.
70
1143
1752
2590
3809
0
.
05
0.18
0.54
1.80
P-Y DATA
(CYCLIC
LOADING)
API
RP
2
A (2000) Method
72-
in.
-
Diam
e
t
e
r Driv
e
n
Pip
e
Pil
es
6
7
176
183
0.51"
0.73
405
51
13
.
50
67
.
50
683
280
13
.
50
67
.
50
988
651
13.50
67.50
1296
1111
13.50
67.50
1611
1611
13.50
72
.
00
2430
2430
13.50
72.00
3726
3726
8.10
72.00
5485
5485
5.40
72.00
T
e
xas Offshor
e
Port Syst
e
m, Offshore T
e
rminal Location
Block A
-
59, Galveston Area
8
185
72.00
51
72.00
280
72.00
651
72.00
1111
72.00
_I
_~_
_
Re
_
p
_
o
_
rt
_
N
_
O
.
_
0
_
20
_
1
_
-6
_
5
_
04
______________________________________________________________
P
_
LA
_
T
_
E
_
l
_
4
___
FIELD
OPERATIONS
Drilling Procedures
A drilling
rig mounted
on
a suitable
offshore
platform was
used to perform the
boring.
The drilling
platform
is usually
an anchored or dynamically positioned vessel or a
mobile drilling
platform.
The
borehole
is advanced with open hole, wet
rotary techniques, using
a
drag bit
attached
to the drill
pipe. A combination
of
fresh
water
gel and weight
materials mixed
with salt water are
used
as
necessary to
suspend and remove
drill cuttings and
to
prov
ide lateral pressure to
support
the
sides of
the
borehole. A
brief
chronological
Summary
of Field
Operations
is presented
on
Plate
A-1
.
Sampling Procedures
Samples are
obtained
through
the open bore
of
the drill pipe.
Cohesive samples
are generally
obtained
by the
push sampling
technique,
and
granular
samples
by the percussion
technique.
Push
samples are
taken by lowering the sample
tube
into the
soil
formation
with
the
weight
of the
drill
pipe. After
the boring
is
drilled
to the desired depth
,
the
drill bit is
raised
from
the
borehole
bottom, and
the
sampler
is
allowed
to
fall
through the drill pipe until it rests on
a catch
ring
above
the drill bit. The
sampler
is then pushed about
24
to
30
in
.
into the
soil
by lowering the drill
string.
The
sampler
is retrieved
by pulling it out
of
the
~
soil formation
with
the drill pipe
and
then raising it to the
deck
using
an
overshot
retrieving
device attached
to a
wireline.
After
retrieving
the sampler,
the boring is
advanced
and
the
sampling procedure
is repeated.
Samples
obtained in this fashion
are
noted by "PUSH"
on
the boring log.
Percussion
samples
are obtained by
advancing
the
sampler
tube
with a
hammer and slide
assembly, which
is lowered to the desired
sampling
depth.
The hammer,
a
175-lb sliding
weight,
is
repeatedly raised approximate
ly
5 ft
and
dropped, to achieve a maximum penetration
of
24 in.
or
a
ma
x
imum of
30
blows. The number of blows required to
achieve
24-in. penetration,
or the
penetration for
a
maximum
of
30
blows, is
recorded on the boring log.
Samples recovered
with
the liner sampler are advanced 24
in
.
into the formation with the
weight
of
the hammer
and slide assembly.
Liner
samples are
noted
as
"WOH" on the boring log.
Water Depth Measuring
Procedures
Tile water
aep!il
measurements are usually
t
a
k
en
at the
bO
ring location
by
one or more of
the
following methods:
(1)
the
vessel's
echo
sounder, (2)
an
electronic bottom
sensor,
(3) pressure transducer
located
in the bottom
sensor
and
(4)
the first
sample
recovery
during
the coring operation.
An
initial
water
depth
is estimated using the
vessel's
echo sounder. After the
initial water
depth
estimate
is made, a bottom
sensor
is
used to more
accurately
measure the
water
depth. The
bottom
sensor is
an electronic seafloor
sensor
that
is operated
on an electric cable and
latches into the drill bit. The drill
string
is
slowly
lowered to
the
seafloor
until the electronic sensor signals that its tip has contacted the soil. The bottom sensor
contains a
pressure
transducer that provides
an
independent
water
depth measurement. This pressure
transducer measurement
also
checks the pipe tally length used for the bottom
sensor
measurement. The
water depths
obtained
from these methods
are
then
confirmed by
recovery
of
the
first soil sample.
The
Cavins wireline counter
is used in
conjunction
with the sampling
equipment
to obtain the mudline sample.
The water depth measurement thought
to be most representative is indicated on the boring log. After
completing
the
soil
boring
,
a
confirmatory water
depth measurement
is
sometimes taken.
The
coring vessel
is repositioned,
and
the
water
depth is
confirmed. Some variations
in these procedures may
occur
due to
available equipment and conditions at the
time
of the
boring.
)
__
~
__
R
_
ep
_
o
_
rt
_
N
_
O
_
.O
_
2
_
0
_
1-
_
6
_
50
_
4
______________________________________________________________
A
_
-
_
1
_____
FIELD AND LABORATORY TESTING
A summary of
the field
and
laboratory
test
results
is presented
on
Plate
A-2.
In the field,
each
sample
is extruded from the
sampler and carefully examined,
classified,
and
tested by the
soil technician
or
field
engineer.
Representative portions
of each
recovered sample are appropriately packaged for shipment
to the laboratory in Houston. The
test
procedures
,
which are
in general
accordance with ASTM Standards
(2008), are
described
in the following paragraphs.
Classification Tests
The classification tests,
performed
to
verify
field
soil classifications,
are
assigned
to
granular and
cohesive
soils.
These data are tabulated
on
the
Summary
of Test Results, and most results are
also
ploUed on the Log of Boring and Test Results.
For
cohesive samples,
plastic and liquid limits
are determined
to provide information for
soil
classification.
Water
content
and
density determinations
are
made for
soil
compression test
specimens.
For
granular samples, classification
tests
are directed
toward determining grain
size
.
Grain-size
analyses
performed include
sieve analysis and/or
the
percent
material
passing
the No.
200 sieve.
These
values are
presented
on
the
Summary of
Test Results.
Strength Tests
The undrained
shear
strength of
cohesive samples
is obtained from Torvane,
pocket penetrometer,
miniature
vane,
and unconsolidated-undrained triaxial
compression
tests. The results
are
tabulated
on the
Summary of
Test Results
and are
ploUed
on
the boring log.
The Torvane
is a
small,
hand-operated
device consisting of a
metal
disc with
thin,
radial vanes
projecting from one face. The disc
is
pressed against a
flat
surface of
the
soil
until the
vanes are
fully
embedded
and
is rotated through a torsion
spring
until the
soil
is
sheared.
The device is
calibrated
to
indicate
shear strength of
the soil directly from the rotation of the torsion spring.
The pocket penetrometer
is
a
small,
hand-held device
consisting
of a
flat-faced
cylindrical plunger
and spring encased
in a cylindrical housing. The plunger is pressed
against
a flat
soil surface, compressing
the
spring
until the
soil experiences a punching
type bearing failure. The penetrometer
is calibrated to
----
Inalcate
snear strengtfi onne
soil
a
irectly from compression onne spring.
The miniature
vane
test
is used to measure
the
undrained
shear strength of cohesive soils.
In
this
test, a
small, 4-bladed vane
is inserted into
either
an
undisturbed or remolded
cohesive specimen.
Torque
is
applied to
the
vane
through a calibrated
spring
until
soil
shear failure occurs. The undrained
shear
strength
is determined by multiplying the rotation, in degrees,
by
the
spring constant.
In the unconsolidated-undrained triaxial
compression
test, either an
undisturbed
or
remolded soil
specimen
is
enclosed
in a thin
rubber
membrane and
subjected
to a confining pressure of at least the
computed
effective
overburden pressure. The
specimen
is then loaded axially to failure
at
a nearly constant
rate
of strain without
allowing drainage. The
undrained
shear
strength
of
cohesive soils
is computed as
one-half the maximum observed deviator
stress.
Normalized
stress-strain
curves from undisturbed UU
triaxial
compression
tests
are
presented
on
Plate
A-3.
I_
@
Report No. 0201-6504
A-2
Date
July
3,2008
I
0
'"
~
I
\
I
July4,2008
"
Time
From
To
Description
of Activities
****
1235
Arrive
in Block
A-59,
Galveston
Area onboard
th
e
vessel
RN Seaprobe.
1235
1430
Set
4-pt
anchors.
1430
1445
Rig up to drill and
sample.
****
1445
Estimate
water
depth of 120
ft
with vessel's echo
sounder
and
126 ft using
wire
lin
e
technique.
1445
1515
Perform
scanning sonar survey.
1450
1525
Run drill pipe to mudline
.
****
1525
Measure
water
depth
of
125 ft
with
the
bottom
sensor/pipe
tally and
124.6
ft
with pressure
transducer.
1525
2400
Drill and sample.
**"'*
2345
Conduct
pre-shift
safety
meeting.
0000
0640
Drill and sample. Boring terminated
at 450-ft
penetration.
0640
0810
Pull drill
pipe
above mudline
and
reposition
vessel.
****
0810
Measure supplemental water
depth
of
125 ft
with
the bottom
sensor/pipe
tally
and
125 ft
with
pressure transducer.
0810
0845
Pull drill pipe
to deck
and secure equipment
for
travel.
0845
0935
Pull
anchors.
0935
*.**
Depart location.
SU
MMARY
OF FIELD OPERATIONS
Texas
Offshore
Port
System, Offshore
Terminal
Location
Block
A
-
59, Galveston Area
_1_
~
_
R
_
e
_
po
_
rt
_
N
_
O
_
.O
_
2
_
01
_
'6
_
5
_
04
______________________
____
____________________________
____
PL
_
A
_
T
_
E
_
A
_
.1
____
I
@"
g.
ro
Z
o
2
~
~
-u
~
~
"
Approved
C
h
ecked
B
y
:
~
B
y~
/.4'''-
Summary of T
es
t R
es
ult
s
I
d
e
nt
ific
ation
Tes
t
s
L
iquid
Plastic:
Moistu
re
Submerged
Samp
N,.
l
e
Oepth
Liquidity
Li
mit
U
mlt
Con
t
i
nI
UnltWe1ll
h
\
I",
Ind
ex
('10)
{'!oj
('/0)
{pet}
1
0.30
2
1
.00
50
43
2
1
.00
4
5
2
1
.00
.96
54
1
4
53
3
5
.0
0
24
5
1
•
8.00
28
63
5
10
.
00
6
10.50
58
7
11.
00
3
.
24
25
1
9
4
1
7
1
1.00
50
8
13
.00
9
13
.5
0
9
13
.
50
10
14
.0
0
2.05
31
17
46
11
1
5.50
12
16.00
38
12
16.00
42
47
,
1
3
1
6.30
4
4
.
1
9
.
00
15
19
.50
42
16
20
.
00
4
0
16
20.00
48
N
O
TE
S
:
TYP
E
O
F TE
S
T
U
-
U
n
confi
n
ed Compression
D
ate:
D
ate"
Passi
n
g
N,.
Sieve
'"
52
10
28
55
--r:-
~
R:qM
J{f,4
I
Job
No.:
Bor
in
g:
B
l
o
ck:
Ar
ea:
Str
e
n
g
th E
s
t
i
m
at
e
I
(
ksf)
M
iniatur
e
V
a
n
e
T
ests
(ksf)
I
J:l
enatromallr
Torv..n.
Undisturbed
R
emolded
Resldu,.
r
0.
1
6
0.08
I
0.12
0.04
I
0.12
I
I
I
I
I
I
0.52
I
0.46
I
0.07
I
0
.
40
0.44
I
0.40
I
0.09
I
I
0.48
0.4
7
I
0
.
52
I
I
I
0.52
0.36
TY
PE
OF FA
IL
URE
A - B
ul
ge
U
U
-
Un
co
n
so
l
idate
d-
Und
r
aine
d Tri
axia
l
8
-
Sing
l
e S
h
ea
r
P
l
ane
C
U
- Consolidated
-
Undrained T
ri
axial
C
- Multiple Shear Plane
o
-
Vertica
l F
ractu
r
e
Drawn By:
~
............
D
ate:
'lfl<-
/
/o$
~
I
0201
-
6504
2
1
-A
ug-
2008 (Ver
.
#7)
T
exas Offsho
r
e
P
art System, Offshore Terminal
L
ocation
A
-
59
GA
L
VESTDN
Co
mp
r
essi
on T
es
t
s
Molstur.
Connning
Undisturbed
RemohStd
E.
Submerged
F~llur.
Type
Content
PftSI
1
WI
Strength
Strength
SIr;.ln
Unll
Weight
Strain
Type
of
resl
("!oj
(psi)
I"'"
(k
sf)
('10)
(per)
I"'
F
~
ilur
.
UU
44
38
0.14
2.2
47
14
A
U
U
43
120
0
.
30
1.8
47
13
A
Plu
s
Signs
(
+1 denote tests wh
ic
h
exceeded
the
capacity of the measu
r
i
ng device.
NP
=
Non Plastic Material
1-
~
"0
o
..
-
"
Z
o
o
Sum
m
ary of T
es
t R
es
ult
s
'"
~
'"
o
".
~
"
Samp
l
e
Depth
N•
.
(
ft
,
17
2
2
.
00
18
2
2.50
18
2
2
.50
1.
23.00
2.
24.50
21
25
.00
21
25.00
22
25.50
23
2
8.00
2.
28.50
2
5
29
.0
0
2
6
31.
0
0
2
7
31
.
5
0
2
7
31.50
28
32.00
2.
33.50
3.
34.00
3.
34.00
31
34.50
32
3
7
.00
3.
37.50
35
38.00
N
O
T
ES:
Liqu
i
dit
y
I
nd
ex
1
.
06
2.
1
8
I
d
entific
a
ti
o
n Tes
t
s
liqu
i
d
Pl
ast
ic
Moi
s
tu
r
e
Subme
r
lled
L
imit
Li
m
it
Co
n
l,nl
UnltW,llI
h
t
(
%
,
(
'/o
j
('!oj
{
pet}
3
5
1
1
37
40
52
33
39
37
51
33
35
35
49
3
6
27
1
9
3
7
53
3
7
T
YP
E
O
F TE
S
T
U
•
Unco
nfin
ed Compression
-L
~
-(.(
-
,
J
o
b No
.
:
B
o
rin
g:
I
Bl
o
c
k:
Area:
I
stren
gt
h
E
sti
m
ate
Mi
ni
a
tu
r
e V
ane
Te
st
s
Pas&ln
g
(
ksf)
(
ksf)
,
•
.
S
'"
I
P
e
n
e
trome
t
er
i
eve
T
o
rvan
.
Undlsturb
t
d
R
,
mO
l
de
d
R
e
s
i
dua
l
I
0.50
I
I
0
.
08
0.42
0
.
52
0
.
44
I
I
0.07
I
0
.
50
0
.
31
I
0
.
56
I
I
0.46
0.42
I
0.
56
I
I
0
.
07
I
0.4
8
0
.
80
0
.
18
0
.
72
28
I
I
0
.
40
I
TYPE OF FAILURE
A -
B
u
l
ge
UU
-
Un
co
n
so
lid
ate
d.U
n
d
ra
ined Tri
axial
B
•
Sing
l
e S
h
ea
r Pl
ane
m
it:
C
U
-
Con
s
olidated
-
U
n
drained
Tr
iaxia
l
C
- Mu
l
tiple Shea
r
Pla
n
e
0- Vertical
Fr
actu
r
e
tr
02
0
1
-
6
504
2
1
-A
u
g
-
2008
(V
e
L
#7)
T
exas
O
ffs
h
o
r
e
Port S
y
s
t
em, Offs
h
o
r
e
T
e
rm
ina
l L
o
ca
ti
o
n
A
-5
9
GA
LV
ESTON
C
omp
r
essio
n T
ests
Mo
istur
e
Con
n
n
i
ng
Undi
s
turb
e
d
R
e
molde
d
"
"
Submerged
Fa
i
lur
e
T
yp
e
Contini
Prl$
s
urt
Strength
S
tre
n
gth
5
1
",
;n
Uni
t
Weight
S
tra
i
n
Typ
e
of
T
lS
t
(
%
(
(
pS
i)
(k
s
fj
(ko,
('/o
j
(pel)
(
%
,
F
a
i
l
u
r
.
UU
3
9
38
0
.
2
8
2
.
5
53
14
A
UU
33
1
20
0
.
26
2
.
2
52
1
4
A
UU
3
9
40
0
.
26
3.8
50
1
6
A
U
U
37
1
2
0
0.42
1
.8
50
1
3
A
Pl
u
s S
i
gns
[
+
]
de
n
ote tests which
ex
ce
e
d
ed
th
e
capacity o
f
the measur
in
g dev
i
ce.
N
P ;:
N
o
n P
l
ast
i
c Mate
r
ia
l
1
-
@
il'
"0
o
;>
Z
P
o
m
S!
'"
'"
o
...
--
--
--
---
-
-:r.;-
-
Checke
d
B
y:
~
Date
:
'i!j"-llor
Approved
By:
.?i''L
D
ate:
.?'
,4;;--h
Sum
m
ary
of Test
Results
--
--
-
-
Job No.:
Boring:
Bloc
k:
Area
:
Identification Tests
Str
e
ngth Estimate
Miniature
Vane Tests
r
(ks!)
Passing
(ks!)
Liquid
Plastic
Mol
$l
ur
.
Submerged
No.
I
Sample
Deptll
L
i
quidity
Lim
it
Limit
Conlenl
U
nit
W,lght
'"
No.
'ft,
In
dex
(
"/0)
("to)
("to)
(pcI')
Sievi
I1'ln
e
tromlt.r
Torvan,
Undisturb
ed
R
,
molded
RastdLl;!.1
3S
38.00
33
I
0.62
36
40.00
0.13
36
40.00
37
40.50
38
41.00
39
I
0
.
52
3.
43.00
I
0.74
40
43.50
44
I
41
44.00
42
I
0
.68
0.72
41
44.00
45
42
46.00
0.60
43
46.50
34
I
0
.
22
43
46.50
53
I
44
47.00
36
I
44
47
.00
35
I
0.48
0.46
45
48.50
0
.
64
45
48.50
0
.
11
46
49.00
.
96
37
11
35
I
47
58
.00
36
54
I
0.
62
48
58
.50
I
4.
59.00
3
7
I
0.80
0.96
50
67.40
I
1.25
50
67.40
4
1
1.24
1
.
43 +
N
OTES
:
T
YP
E
O
F
TEST
T
Y
PE
OF
F
A
ILU
RE
U
-
Unconfined
Co
m
pression
A
- Bulge
UU
-
Unconsolidated-Undrained
Tria
xia
l
B
-
Single
Shear Plane
CU-
Consolidated-Undrained
Tria
xia
l
C
-
Multiple Shear
Plane
o
-
Vertical
Fra
ct
ur
e
'0
m
~
o
~
--
--
--
-- --
--
-
D
rawnBy:~
Dat
e:
<t/utor;
0201-6504
2
1-Au
g
-
2008
(Ve
r
.
#7)
Te
xas
Offshore
P
ort System. Offshore
Te
r
minal L
ocation
A-59
GA
L
V
E
S
T
ON
Compr
essio
n Tests
Molstur.
Confining
Un
dlsturb,d
Remolded
E"
Submlrg,cI
FaUllr.
Typ
.
Content
Pressure
Str,nglll
Stre
ngth
Strain
Unit
Weight
511"111'1
Type
of
T
nt
("to)
(psi)
{k
ill
,
..,
('10)
(per)
('10)
Fallur.
UU
39
40
0.43
3.2
4
8
18
A
UU
33
12
0
0
.
51
3.6
54
20
A
UU
36
51
0
.38
4
.
1
52
21
A
Plus
Signs
[+} denote
t
ests which exceeded the
capacity of
t
he measur
ing
de
vice.
NP
=
Non Plastic
Material
1-
@
;o
ro
'C
g,
Checke
d B
y
:
Approve
d
By:
T--:-
-
;1W
D
ate: W
ij,lag
/-?A.
Date:
j..
~/h
Job
No.:
Z
~
Summary of Test Results
Boring:
8
01
in
'"
~
'U
S
m
{>
~
Sam
p
le
D
e
pth
N,.
(ft,
51
68.
SO
52
69
.00
52
6
9
.
0
0
53
69
.
5
0
54
7
8.
00
55
78.50
56
79
.
00
50
79
.0
0
57
88
.
00
58
88
.
5
0
58
88
.
5
0
59
89.00
60
98
.
0
0
61
98.50
62
9
9.00
62
99.
00
63
108
.0
0
64
108.50
64
108
.
50
65
1
0
9
.00
66
1
17.
5
0
67
1
1
8
.
0
0
N
OTES:
Liquidity
tndf)(
.
60
.47
Bloc
k:
Area:
Identification
Tests
I
St
re
ngth Estimate
Miniature Vane Tests
Passing
(ksf)
(ksf)
U
ql.l
id
Plasti!;
MolslullI
Subll10lrged
N,.
I
Ptn,lroma!
l
t
Limit
Limit
Conlanl
Un
ltWelll1ll
(%)
('t.)
w.)
(pel)
5i,vI
'"'
Torv
ane
Und
istu
rb
e
d
R
e
m
o
ld
.d
Residll4l1
I
1.15
I
0.46
44
I
1.20
1
.
14
I
1.35
55
I
37
I
1.60
1
.13
54
16
39
I
1.4
0
I
I
40
I
1.40
1.
34
I
1.55
50
I
43
39
1
.60
2.06
I
1
.
70
I
I
80
20
48
I
1.70
2.2
5
30
53
TYPE
O
FTEST
TYP
E
O
F F
AILURE
U
- Unconfined
Compression
A
-
Bulge
UU- Unconsolid
ate
d
-U
nd
ra
ined Triaxi
a
l
B
-
Sing
l
e
Shear Plane
CU
-
Consolidated-Undrained
Tr
iaxial
C
-
Multiple
Shea
r
Plane
0
-
Vert
i
cal
Fra
cture
-
D
rawn
B
y:
'r-
___.
Da
t
e:
t,
/
...
,/o~
T
0201-6504
21-Aug-2008 (Ver.
#7)
T
exas Offshore
Port
System,
Offs
hore Termin
a
l Lo
cation
A
-
59
GALVESTON
Compress
i
on Tests
Moisture
Confining
Undl$lurb.d
Rlmo
ld
ed
6.
$ubmlrged
F~l1ul1l
Typ'
Co
ntant
Pressure
Strength
S
t
reng
th
Strain
Unit W,lght
Strain
T
ype
of
T
nt
('I.)
(psi)
(
hI)
("'"
('Y.)
(pef)
('I.)
F
ai
lure
UU
42
70
0.68
1.
4
48
1
2
A
B
UU
37
12
0
0.85
1
.3
52
11
AB
UU
40
gO
1.41
1
.
1
49
3
B
UU
1
1
8
0.47
50
UU
48
112
2.10
0.8
43
3
B
UU
121
0
.
54
45
Plus
Signs
.
[+1 denote tests
which
exceeded
the
capacity of the
measuring device.
NP
=
Non Plastic Mater
i
al
1-
@
?;'
"C
o
;+
Z
P
o
N
::l
'"
o
".
."
m
~
~
m
--
-
-
---
-r-:-
-
--
-- --
C
h
ecked
B
y
:
!jt»
Da
t
e:
W
uioe
Approved
By:
/.?/"I.
Date:
.l?
h
/o9
Jo
b
No
.
:
Summary of Test Results
Bor
in
g:
B
lock:
Area:
Identification Tests
S
t
r
ength Esti
m
ate
Minia
tu
re
V
ane
T
ests
Pusl"1I
(ksf)
(ksf)
Liquid
Pintle
Moisture
Subm
t
tgod
N,.
Sample
Oepth
Liquidity
Limit
Llmll
Co
n
te
n
t
Unit Weight
...
N,.
Ihi
Index
(
'!o
)
(%)
('!o)
(pel)
SI,v
,
P
e
netrometer
Torvanl
Undisturbed
Remolded
Resldu~1
68
118
.
3
0
32
1.50
1.50
1.96
69
127
.
5
0
I
69
127.50
I
7
0
1
2
8.0
0
40
I
2.00
1.55
2
.
08
71
13
8
.0
0
24
57
36
I
7
2
148
.
00
1.01
37
19
37
I
1
.28
72
148
.00
I
73
148
.50
I
74
157
.
50
I
75
1
58
.0
0
3
1
50
I
75
1
58.0
0
76
158
.
30
I
2.25
2.25
2.13
77
168
.
0
0
I
2.50
2.00
78
168.
50
78
168.50
I
79
1
69
.00
43
I
1.50
1.45
1.66
80
178.0
0
2.75
2
.
25
81
178.50
I
82
179
.00
.37
66
18
35
I
2.75
2.40
2.42
83
188
.00
2
.
25
84
188
.
50
42
I
85
1
8
9.
0
0
42
I
2.75
2.00
2.55
NOT
ES
:
TYP
E
O
F TE
S
T
T
YPE
O
F F
AILUR
E
U
-
Unconfined Compression
A
-
Bulge
UU-
Un
consolidated
-
U
n
dra
i
ne
d Tr
iaxial
B
-
Si
n
gle Shea
r
Plane
CU-
Consolidated
-
Undrained
T
riaxia
l
C -
Muttiple
Shear
P
lane
D
- Ve
rt
ical Fracture
-
--
-
-
-
--
-- --
--
--
--
-
-
-
,--
D
r
aw
n
By:
-
~
Date:
g('l-i/oS
0201-6504
2
1
-Aug
-
2008
(Ve
r
. #7)
Texas
Offshore
Port
System,
Offshore Terminal
L
ocation
A-59
GALVESTON
C
ompress
i
on Tests
Mol$ll,lr
l
Conlln
l
ng
Undisturbed
R
e
mold
,
d
E"
Subm
e
rg
e
d
F~[Iu
..
Type
Conl9nt
Pressure
Strength
Strlnu
th
StrOIin
Unit W
e
ight
Strain
Type
of
Test
1%1
(psi)
''''
(ksl)
(%)
(pef)
('10)
F
a
l1urv
UU
41
121
1.91
1
.
5
50
4
B
UU
121
0.49
49
UU
121
0.2
7
52
UU
32
119
1
.
20
4.9
52
16
AC
UU
33
120
0
.
64
53
UU
32
120
1.85
1
.
2
51
6
AS
UU
34
12
1
2
.
5
1
1.5
49
5
S
UU
1
20
0
.
75
53
UU
34
1
19
2.95
1.0
47
3
S
1
P
tu
s
Sig
n
s [
+)
de
n
ote tests whic
h
exceeded the
capacity of
the
measuring device.
NP = Non Plastic Materia
l
1-
~
'/-
-
-g
ro
"-
z
?
o
N
Sum
m
ary of Te
s
t Re
s
ult
s
~
in
"'
o
"'
-u
~
S;t
mple
De
p
th
No~
1
'1
85
189
.
00
86
1
9
8
.
0
0
87
198
.
50
87
1
98.5
0
88
1
99.00
89
207
.
50
9
0
208.30
90
208
.
3
0
91
218
.
00
9
2
227.40
93
238.
0
0
9'
238
.50
9
'
238
.
50
95
2
3
9
.00
96
248
.
00
97
248.50
98
2
4
9
.
00
9
8
2
4
9
.
00
9
9
257
.
50
99
257
.
50
100
258.00
101
26
7
.
5
0
NOTE
S:
L
iq
uidit
y
Indell
.36
.31
Ident
i
fication Tests
liqu
i
d
P
las
tlc
Mol
s
tur
.
Sub
mtl
r
g
ld
L
imit
L
imit
Con
te
nt
Un
i
t Wei
g
ht
(
%)
,
%
)
(
"I.
,
,,'
3
3
45
46
86
22
45
43
61
24
52
77
2
1
38
49
40
38
39
47
TYPE O
FTE
S
T
U
- Unco
n
fine
d
Co
m
p
r
essio
n
T
-
""
~
I
""'
r
~
r.
Jo
b
No
.
:
B
oring
:
B
lock:
Ar
ea
:
1
S
tren
g
th Est
im
ate
Mi
n
iat
ur
e
V
a
n
e
T
ests
Pa
ss
ing
(ksf)
(ksf)
N
o
.
I
,OO
Sl
,vI
f.an
l
t
rome
t
e
r
T
orvan.
Un
dist
u
rbe
d
Re
mo
l
de
d
R
esi
du
a
l
I
I
3.
00
I
I
I
2
.
75
2.76
I
3.
00
3
.
42
7
I
2
I
I
3
.
25
I
I
3.
00
3.0
8
I
3.
00
I
I
3
.0
0
3
.
06
1
3
~
50
3
.
2
5
3.70
1
3
.
00
3.00
TYP
E
O
F F
A
ILU
RE
A - Bulge
UU
-
U
n
consolidated
-
U
n
drained
Tr
iaxia
l
B
- Si
n
gle Shea
r
Plane
m
~
CU- Cons
o
lidat
e
d-
Un
dra
i
n
e
d
T
riaxi
a
l
C - Mul
ti
ple Shear P
l
ane
o
-
V
ertical
F
ra
c
ture
020
1
-6504
21-A
u
g-2
0
08 (Ve
L
Ifl
)
T
e
x
a
s
Off
s
ho
r
e P
o
rt Syst
e
m, Offshore Te
r
m
i
n
a
l L
ocation
A-5
9
G
A
L
V
ESTON
C
om
pression Tests
Moist
u
re
Confining
Und
ls
tu
rbl
d
Re
m
ol
d
ll
~
E
"
S
ub
m,
r
lle
d
F
a
ll
ur
.
Typ.
Co
nt
e
nt
P
relS
u
re
Stren
g
th
Stren
g
th
Str:aln
Un
i
t Wllllht
S
t
f1l
ln
T
YPI
of
T
is
l
1%)
IPsl
)
,
..
,
(ks
f)
(
'/0)
(pel)
,
%)
Fa
ll
u
rt
UU
44
121
2
.5
2
0.7
5
6
2
C
UU
120
0.91
48
UU
121
1.37
51
U
U
37
1
18
2.82
0
.8
47
3
B
UU
39
1
21
3.
91
2.4
51
7
B
UU
12
1
1
.5
1
50
Plu
s Signs
[
+
] d
enote tests
w
hic
h
e
x
c
ee
d
ed
the
capacity of the m
e
asuring de
vice.
NP
=
No
n
Plastic
Ma
terial
1-
r
-
00
Checked
By:
~
Date:
f61Zf
W
~
r
________________
~
A
~
P~p
~
ro~v=ed
~
B~y:~~~~~
__
~
D~a:te~:~~~
'
~~~~r,1~~p~d'~
________________________________________________________________•
;;:01
-
ro
"
Drawn
By:
"--~
Date:
8/UI.Z
,.
a
a
Z
2
~
Summary of Test
Results
Job
No,: 0201-6504
21-Aug-2008
rver
#7)
Boring: Te
xas
Offshore
Port
System, Offshore
Terminal
L
ocation
Block:
A-59
&,
'"
~I
!---lI----~------~~~~~~
__
--------
~
I
I
~s=tr=e=ng=t=h:E~s~ti~m=a~te-r~~~~~~----_r--~~~~----------------------------------J
(ksf)
Area:
GALV
E
STON
Miniature Vane Tests
(ksf)
Identification Tests
P~sslng
No,
Compression Tests
S;lmple
""
Depth
lhi
1021
268
.00
L.llluldity
Ind.
x
1021 268
.
001
.30
1031
279
,00
1041
288.
00
1051 288.50
1061
289,001
.67
1061
289
,00
1071
297.50
1081 307.5
0
1091
308
.00
1101
317.50
1101 317.50
1111 318.00
1121
328.00
1131 328.5
0
1141
329,001
-42
1141 329
.00
1151
338.00
1161
338.50
11
6
1
33
8.50
1171
339
.00
1171
~::lt:lno
llquld
Limit
(%1
88
26
34
Plastic IMoisture ISubmerged
LImit
Content
Unit WeIght
('/oj
('!oj
(pet)
41
22
42
24
60
64
16
22
21
23
54
67
19
70
34
18
25
52
32
Sl.ve
""
I
Penetrom.ter
1
3,25
22
I
81
I
3
I
7
I
1
2
,
50
I
2,50
I
3
,
50
1
3
,
00
2,50
Torvana
Undisturbed
I Remolded
I
Re$ldu~1
2,75
3,61
0,50
0
,50
0]4
2,70
2-45
3,83
+
2,25
2,95
2
,
00
2
,7
5
34
I
I
2,50
2,60
J
2,19
Typ
e
Test
UU
Moisture
Conttnt
1%)
uu
I
32
uul
22
uu
uu
I
29
uu
I
30
C!;Innninll
Pressur
e
(ps1)
121
121
120
121
120
120
Undisturbed
I
RemOlded
IE,"
I
Submerged
Strength
Strollgth
Slr~ln
UnIC W
ill/hi
(ksf)
(ksf)
(%)
(pet)
U6
54
3,96
1-7
50
2.61
2,0
56
1
.
77
62
3,08
2,0
53
1-17
56
F3l1ur.
Strain
('/oj
5
14
11
Type
o
f
Fa
ilure
AB
B
A
C
~
NOTES
:
TYPE
OF
TEST
I
TYPE
OF
FAILURE
Plus
Signs
[+]
denote
tests
which exceeded the
-i
U
- Unconfined
Compression
A _ Bulge
capacity of the measunng deVice.
~
UU- Unconsolidated-Undrained
Tri
axial
B
-
Single Shear
Plane
Ii:i
CU- Consolidated-Undrained
Triaxial
I
C
-
Multiple Shear
Plane
D
- Vertical
Fracture
NP
=
Non Plastic Material
T
1-
@
;0
m
"0
o
;+
z
?
o
::1
'"
in
'"
'R
--
--
-- --
--
,--
--
Checked By
:
~
Date:
~2i
(0'6
Ap
p
roved
By
:
/.7'~
D
ate:
4rh
Summary of Te
s
t Results
I
--
--
--
J
o
b No
.
:
B
o
ri
ng:
B
loc
k:
Ar
ea:
I
d
e
ntific
at
io
n Te
st
s
S
tren
g
th
Estim
a
t
e
Mi
ni
a
t
ure
V
a
n
e
T
es
t
s
I
(ksf)
Pass
i
ng
(k
s
f)
LIqui
d
P
I
~s
t
le
M
o
i
sture
Submerged
N,.
I
S~mpl8
Olpll1
Liquidity
I..
l
mli
Ll
m1t
Conten
t
Unit
Weight
'"
No
.
Iftl
Indu
("!o)
(
"!oj
(01.
)
(
p
el)
Sieve
P.
!'Iftrometer
T
arvana
Undistu
r
bed
Remolded
Residua
l
".
358.00
24
59
119
358
.
50
119
358.50
1.23
26
1
8
28
99
3.00
1
.2
5
1.
55
1
2
.
369
.
00
25
58
77
121
379
.
00
25
50
52
122
388.00
122
388
.
00
.
70
30
1
6
26
123
388.50
24
57
85
12.
398.00
2.75
125
398.50
125
398.50
126
399
.
00
3
1
127
408.00
3
.
25
128
408
.
50
46
129
409.00
.
22
67
18
29
3.50
3.83
+
13
.
4
1
8.00
3.00
2.
95
131
4
1
8.50
131
418.50
132
419.00
3
1
3.50
3
.
83
+
133
428.00
133
428
.00
3.50
13.
428
.
50
5
0
NOTE
S
:
TYP
E
O
F TE
S
T
TY
PE
O
F F
A
IL
UR
E
U
-
U
n
co
n
fi
n
e
d
Compress
i
o
n
A
-
Bulge
UU
-
Unconso
li
da
t
ed
-
U
n
dra
i
n
e
d
T
riaxia
l
B
-
Si
n
g
l
e S
h
ea
r P
lane
C
U
- Consolidate
d-
Und
r
ained
T
riaxia
l
C
-
Mult
i
ple Shear Pla
n
e
"0
~
m
~
"
o
-
Vert
i
ca
l Fr
actu
r
e
-- --
-- --
--
--
--
--
-r
Drawn
By:
~~
Date:
"6/Z.f/c5
020
1-
6
5
04
2
1-
Aug
-
2008 (Ve
r
. #7)
T
e
x
as
Offs
h
ore
P
ort
Syste
m
, Offs
h
ore
T
erm
i
na
l L
oca
ti
on
A
-
59
GALV
E
S
T
ON
Co
m
p
r
ess
i
o
n Tes
ts
Molstu
r
e
Confining
U
n
di
sturbed
Remo
l
ded
E"
Submerged
F
ai
lu
r
e
Ty
pe
Con
t
en
t
Pressure
Strength
Streng-Ih
51",ln
Uni
l
Weight
51",ln
Type of
T
.~
("!o)
(ps
i
)
(
ks
f)
I""
('!oj
I",
("!o)
Fa
il
ure
U
U
24
1
21
3.3
7
6.3
20
A
UU
1
21
1
.04
59
UU
1
20
0
.
8
1
58
UU
36
1
21
1.
96
2.4
16
A
UU
30
1
20
4
.38
2.3
50
9
AB
UU
1
21
1.66
56
UU
32
12
1
3
.42
2.5
49
7
B
UU
30
1
2
1
5.99
1.8
4
4
5
B
U
U
121
1
.80
54
U
U
25
1
2
0
1
.25
6
1
U
U
30
1
1
8
3
.
11
2
.
2
54
9
B
Plu
s
Signs [
+
]
denote
tes
t
s whic
h
exceeded
the
ca
p
acity o
f
the
measuri
n
g
d
ev
i
ce
.
NP
=
No
n
P
l
ast
i
c
Ma
t
e
r
ia
l
~
"0
o
"
z
?
o
~
in
'"
o
""
"
m
~
t
-
--
--
-- --
- -r:- -
--
-- --
Checked
By:
~
D
ate:
'/4z..
t
!o y
Approved
By
:
?,
k-
Date:
?.&;r,0
J
ob
No.:
Summary of Test Results
B
o
rin
g:
B
lock:
Area:
Identification Tests
Strength Estimate
Miniature Vane
T
ests
Passing
I
(ksf)
(ksf)
LI
q
u
i
d
Pluth:
Mol5\u",
Submerged
No.
I
Sarnpls
Ollptll
L
l
qul(!lty
Llmlt
Limit
Conllnl
UnltW.lgtil
'"
No.
Iftl
Index
(%)
(%)
(~.)
(pcfl
Sieve
~in
.
!rom.t.r
Torvana
Undisturbed
Remolded
Rasldu;r.1
135
429
.
0
0
33
I
4.25
2.95
3.83
+
13.
438
.0
0
4.50
3.50
137