I
I
Appendix B contains discussions of analytical procedures used in our engineering analyses. Appendix C
contains a positioning report by Fugro Chance, Inc.,
of Lafayette, Louisiana.
For the purposes
of discussion and presentation, "driven pipe pile" is used in this report to represent
foundation piles, caissons and conductors, unless otherwise specified.
2.2 FIELD AND LABORATORY INVESTIGATIONS
The field investigation was performed
on June 26 through 28, 2008, from the RN
Seaprobe.
The
soil conditions were determined by performing four exploratory borings, two at each SPM location with one
boring at a selected anchor leg location, and one boring at the proposed PLET location. Enterprise Field
Services selected the boring locations. These borings were drilled to a penetration of 131-ft below mudline.
The water depths
at the boring locations ranged from 110 to 113 It. A chronological summary of field
operations is presented
in Appendix A.
2.2.1
Exploratory Borings
FMMG personnel drilled the soil borings with a DMX drill rig positioned over the centerwell of the
RN
Seaprobe.
The vessel was anchored at the boring location by a 4-point mooring system.
Soil
conditions
at the site were explored by drilling a group of four soil borings to 131-ft penetration below the
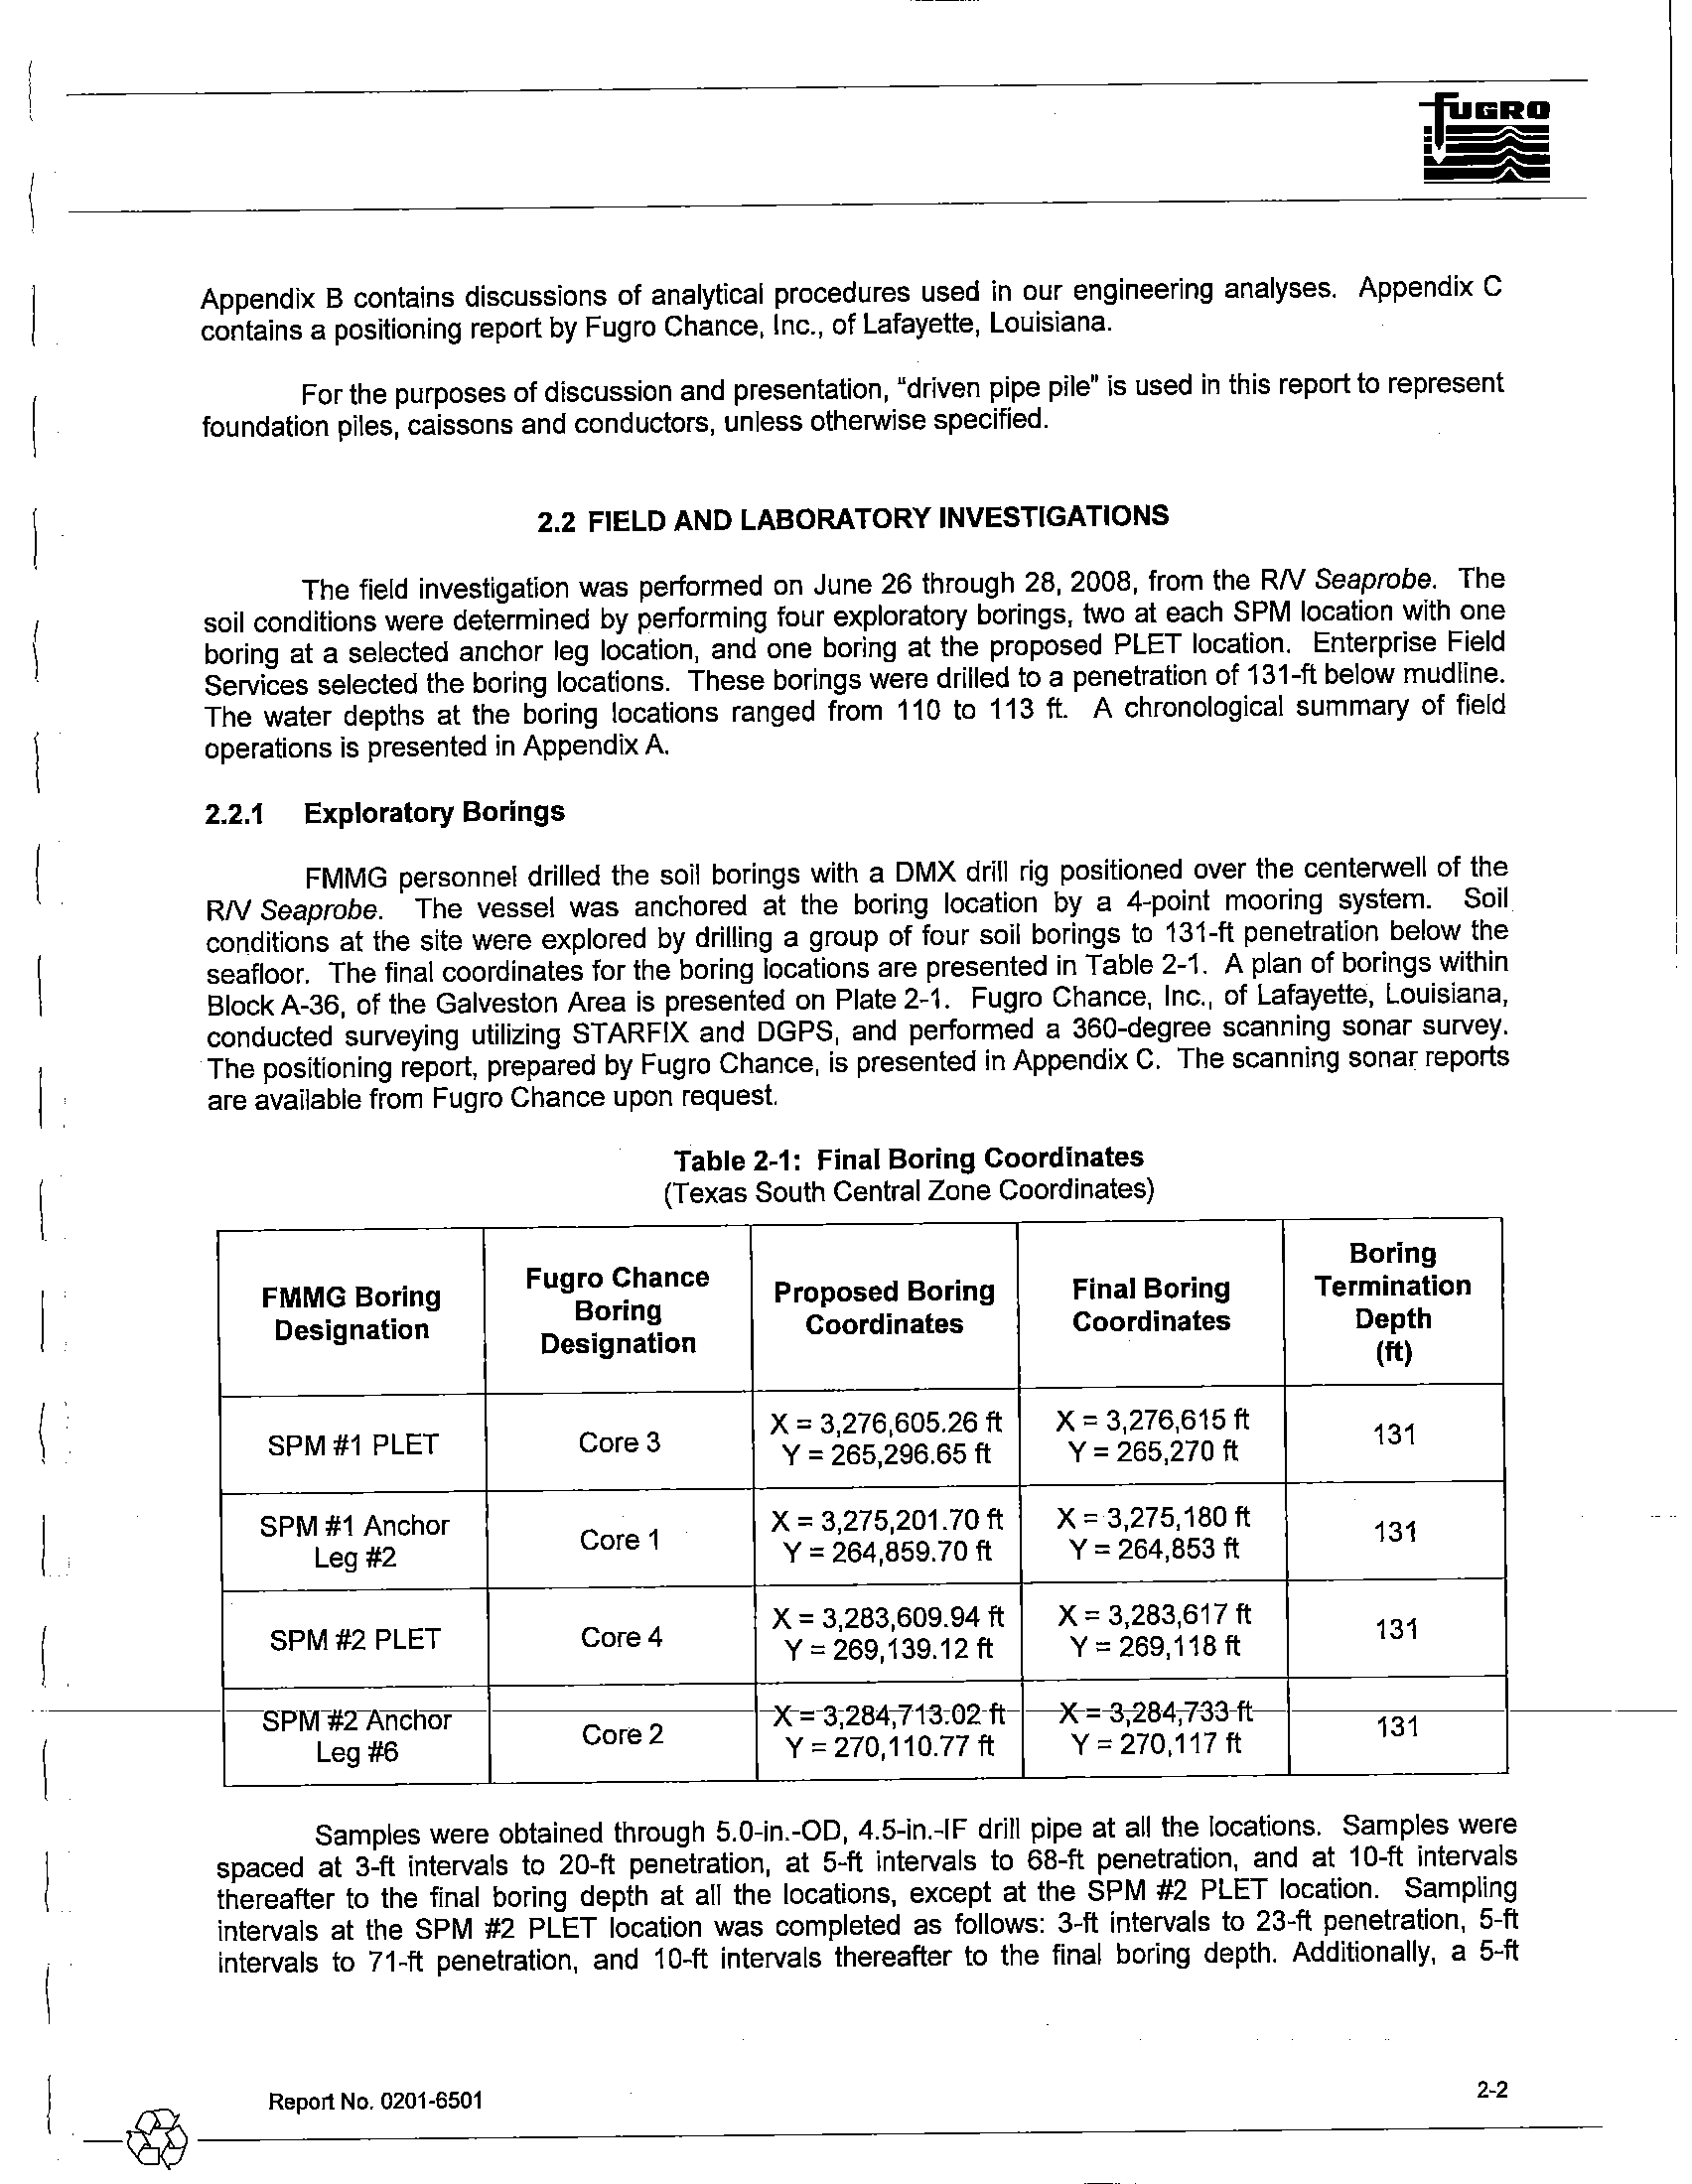
seafloor. The final coordinates
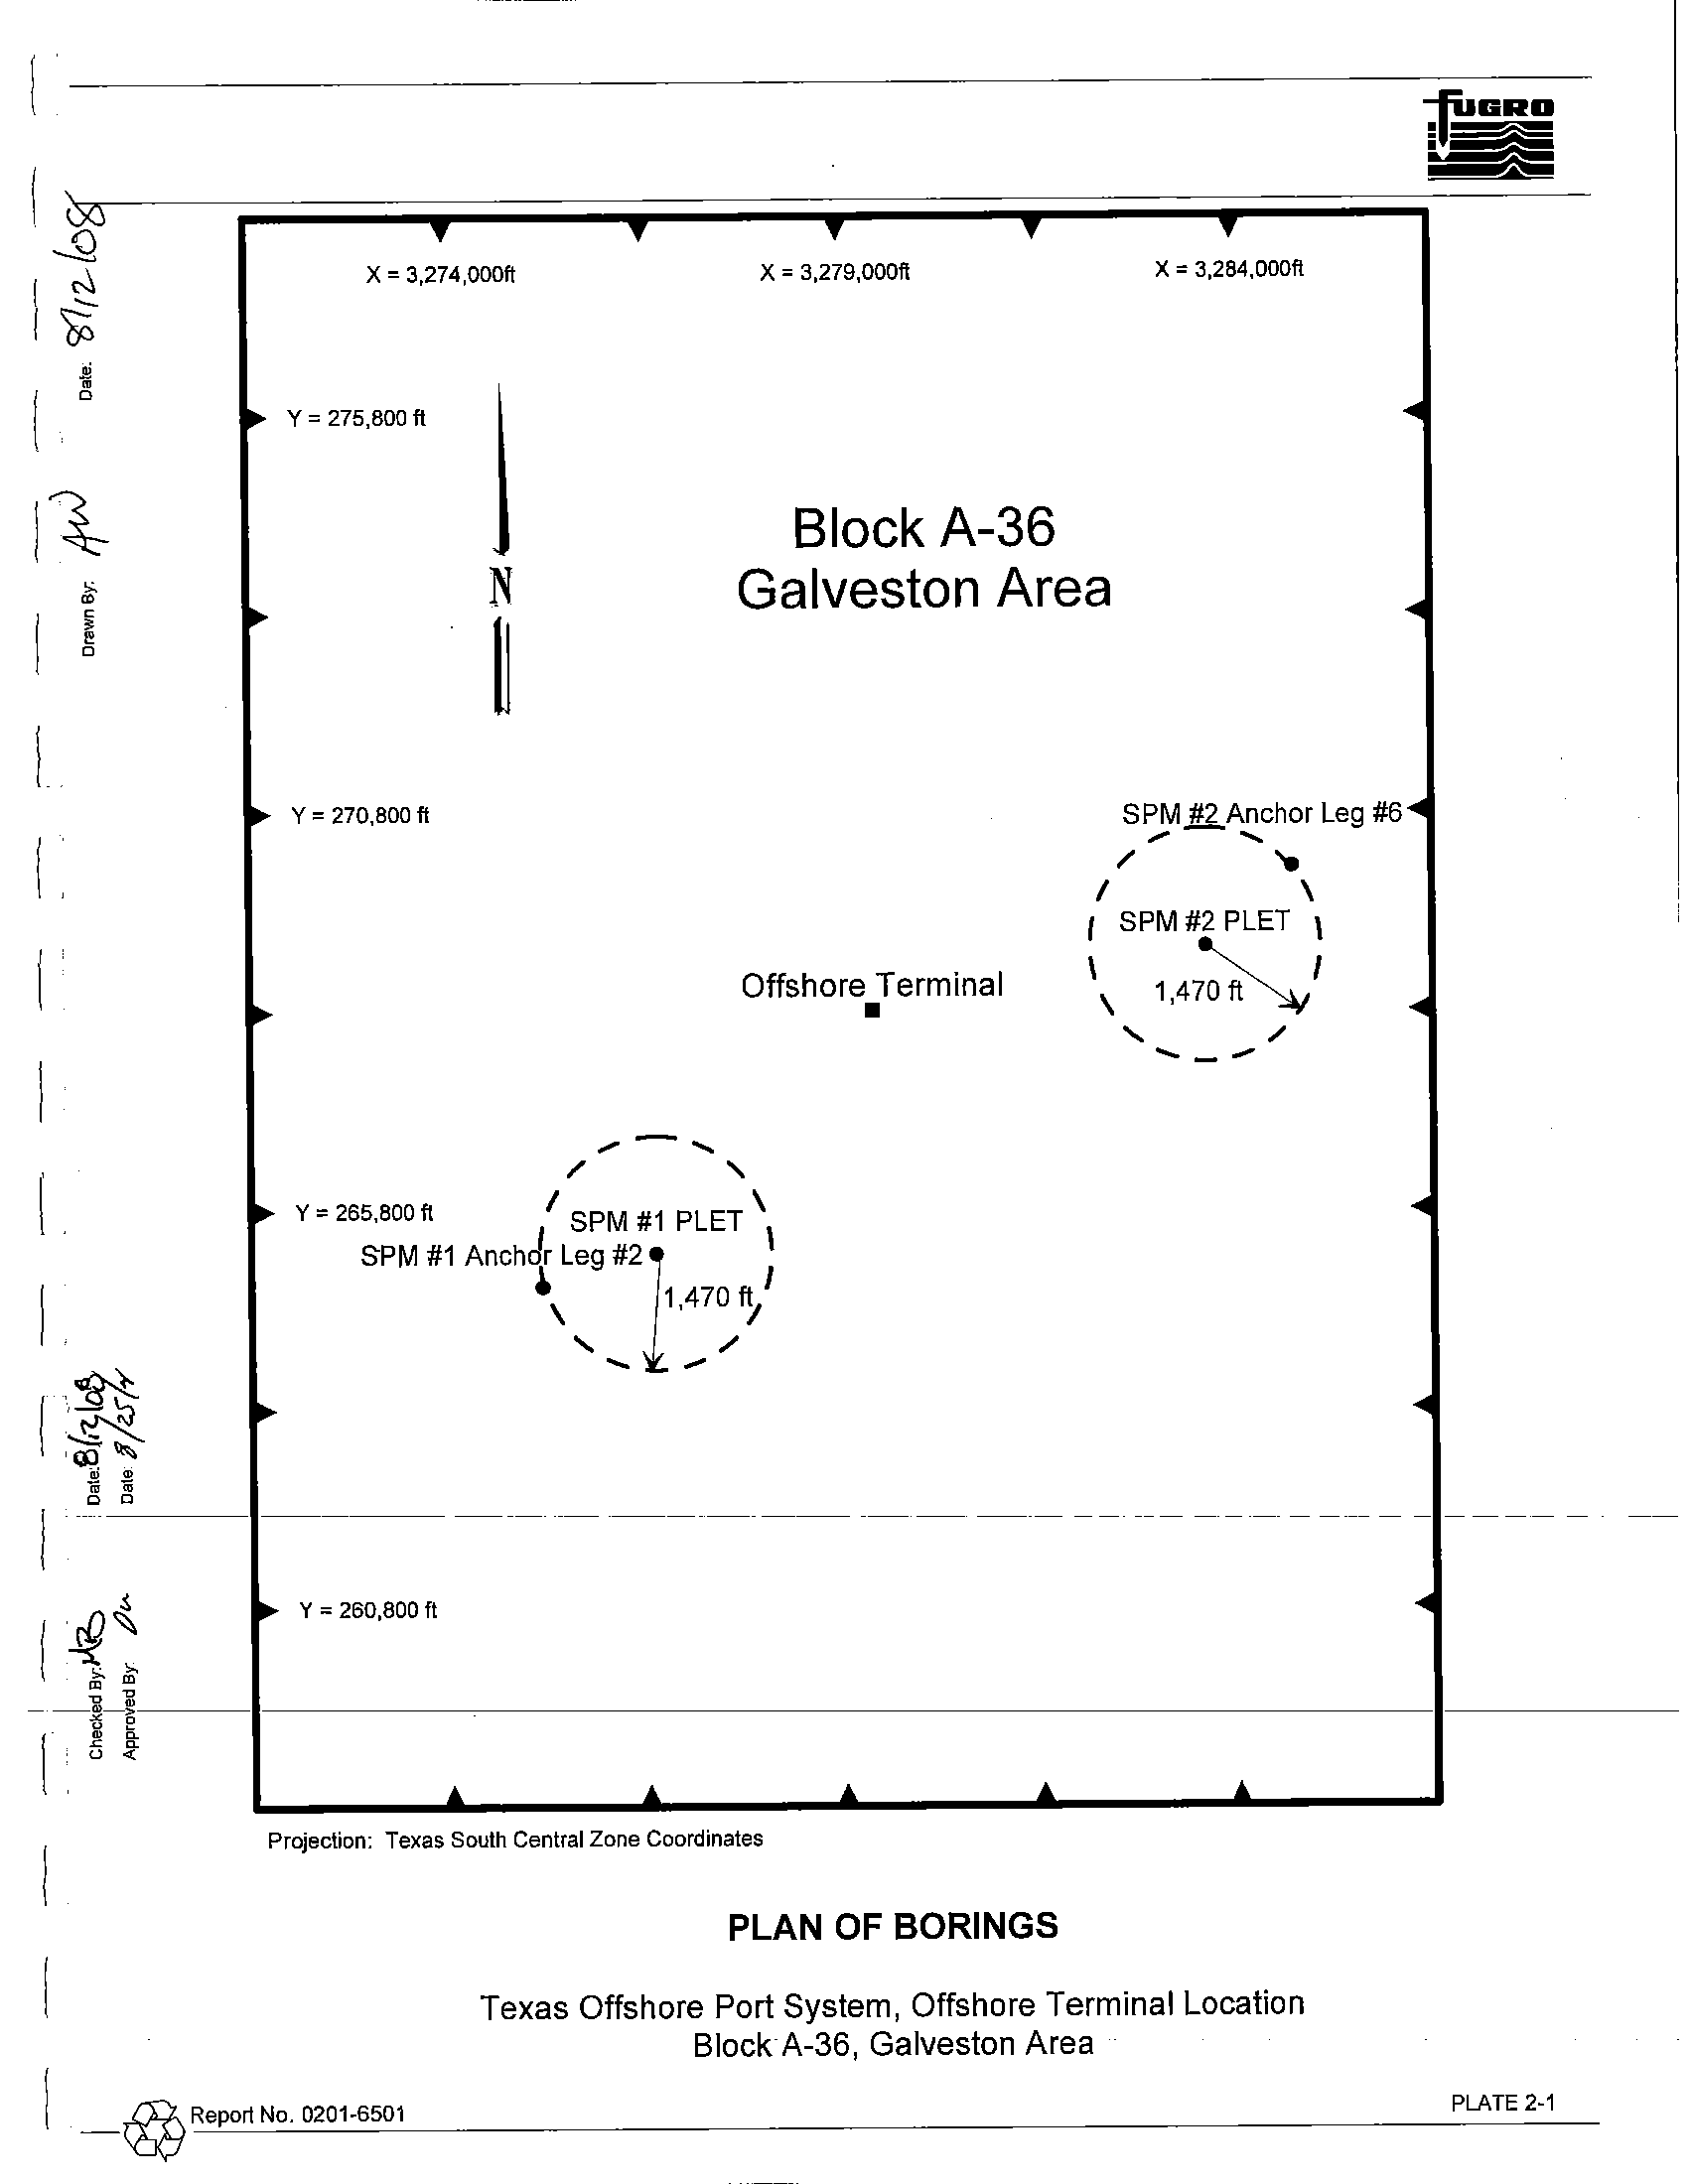
for the boring locations are presented in Table 2-1. A plan of borings within
BlockA-36, of the Galveston Area is presented on Plate 2-1. Fugro Chance, Inc., of Lafayette, Louisiana,
conducted surveying utilizing STARFIX and DGPS, and performed a 360-degree scanning sonar survey.
The positioning report, prepared by Fugro Chance, is presented in Appendix
C. The scanning sonar reports
are available from Fugro Chance upon request.
FMMG
Boring
Designation
SPM #1 PLET
SPM
#1 Anchor
Leg #2
SPM#2 PLET
SPM-#TAncnor
Leg
#6
Table 2-1: Final Boring Coordinates
(Texas South Central Zone Coordinates)
Fugro Chance
Boring
Proposed Boring
Final Boring
Designation
Coordinates
Coordinates
Core 3
X = 3,276,605.26 ft
X = 3,276,615 ft
Y = 265,296.65 ft
Y = 265,270 ft
Core 1
X = 3,275,201.70 ft
X = 3,275,180 ft
Y = 264,859.70 ft
Y
=
264,853 ft
Core 4
X = 3,283,609.94 ft
X = 3,283,617 ft
Y
=
269,139.12 ft
Y = 269,118 ft
Core 2
X-=-3;284~7t3:02-ft-
-X-=-3;-284;-7-33-ft
Y = 270,110.77 ft
Y = 270,117 ft
Boring
Termination
Depth
(ft)
131
131
131
131
Samples were obtained through 5.0-in.-OD, 4.5-in.-IF drill pipe at all the locations. Samples were
spaced
at 3-ft intervals to 20-ft penetration, at 5-ft intervals to 68-ft penetration, and at 10-ft intervals
thereafter to the final boring depth at all the locations, except at the SPM #2 PLET location. Sampling
intervals at the SPM #2 PLET location was completed as follows: 3-ft intervals to 23-ft penetration, 5-ft
intervals to 71-ft penetration, and 10-ft intervals thereafter to the final boring depth. Additionally, a 5-ft
I
_~
____
R_ep_o_rt_N_O._O_20_1_-6_50_1____________________________
2_~
____
I
shallow boring, designated as Core 4A by Fugro Chance, was drilled at the SPM #2 PLET location to allow
re-sampling. The drilling and sampling techniques used to complete these borings are explained
in detail in
Appendix A.
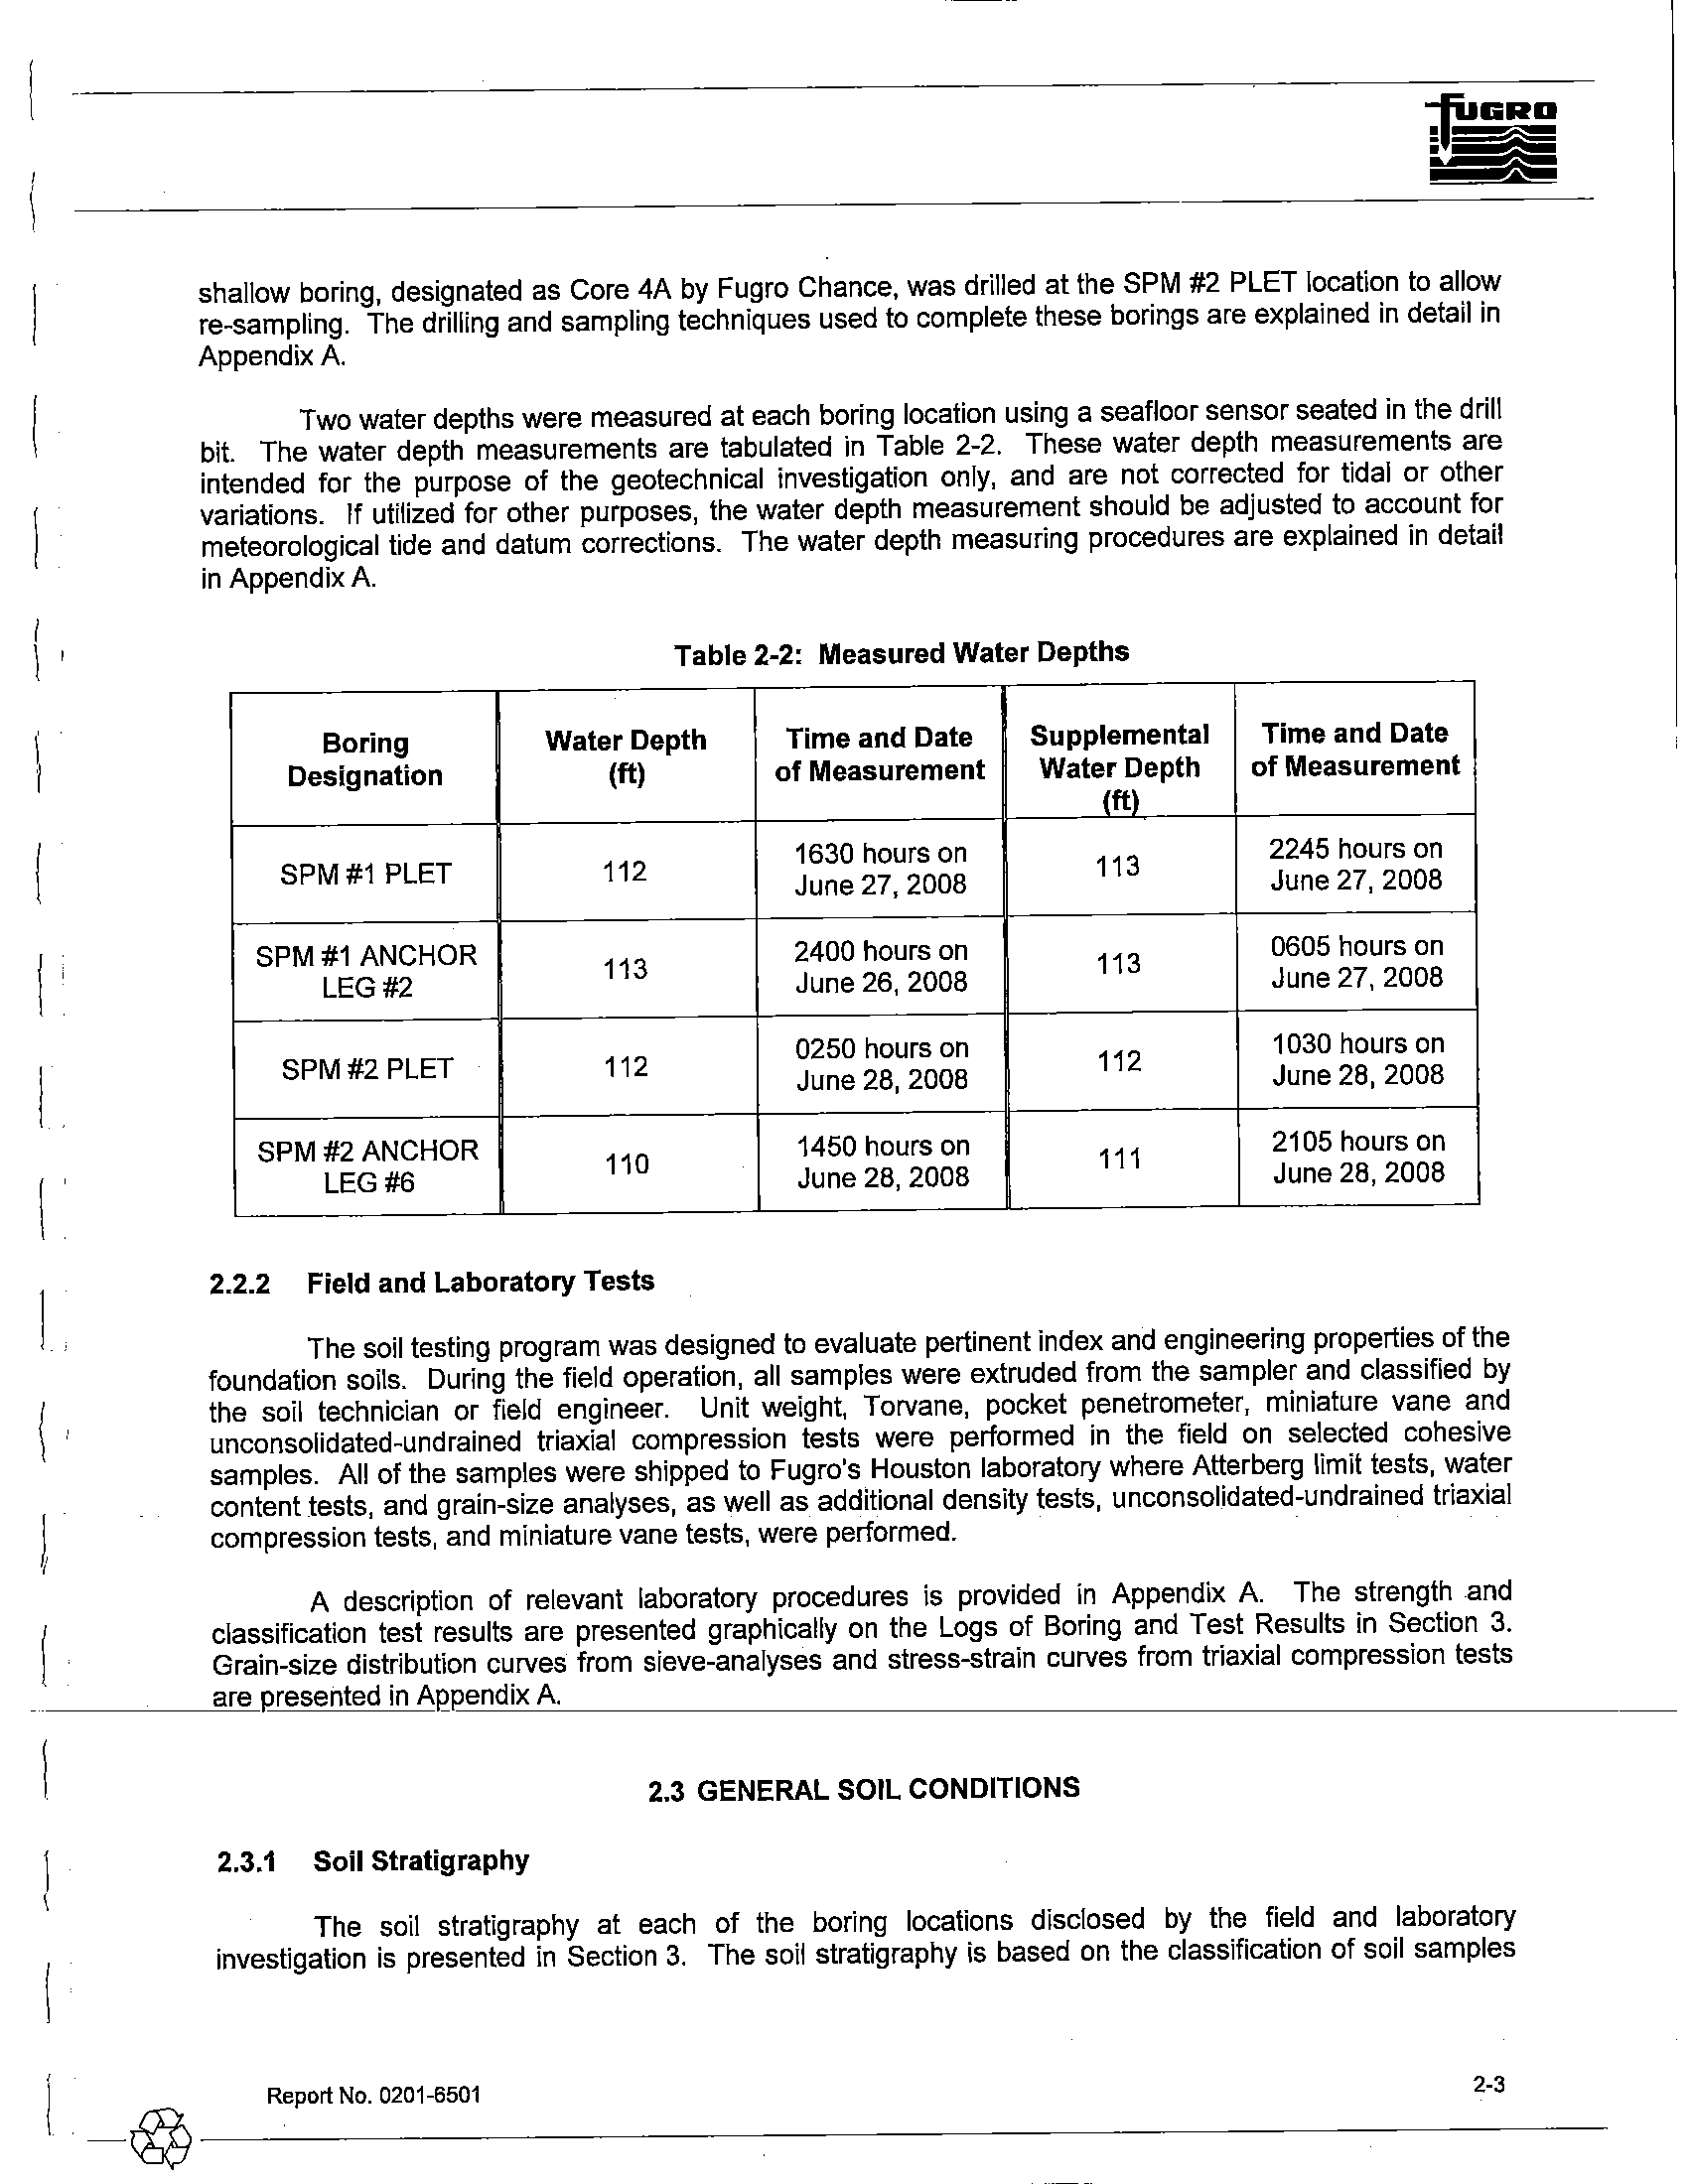
Two water depths were measured at each boring location using a seafloor sensor seated in the drill
bit. The water depth measurements are tabulated in Table 2-2. These water depth measurements are
intended for the purpose
of the geotechnical investigation only, and are not corrected for tidal or other
variations.
If utilized for other purposes, the water depth measurement should be adjusted to account for
meteorological tide and datum corrections. The water depth measuring procedures are explained in detail
in Appendix A.
\ '
Table 2-2: Measured Water Depths
Boring
Water Depth
Time and Date
Supplemental
Time and Date
Designation
(ft)
of Measurement
Water Depth
of Measurement
(ft)
SPM#1 PLET
112
1630 hours on
113
2245 hours on
June 27,2008
June 27, 2008
SPM
#1 ANCHOR
113
2400 hours on
113
0605 hours
on
LEG #2
June 26, 2008
June 27, 2008
SPM#2 PLET
112
0250 hours
on
112
1030 hours
on
June 28, 2008
June 28, 2008
SPM #2 ANCHOR
110
1450 hours on
111
2105 hours on
LEG #6
June 28, 2008
June 28, 2008
2.2.2 Field and
Laboratory Tests
The soil testing program was designed to evaluate pertinent index and engineering properties of the
foundation soils. During the field operation, all samples were extruded from the sampler and classified by
the soil technician or field engineer.
Unit weight, Torvane, pocket penetrometer, miniature vane and
unconsolidated-undrained triaxial compression tests were performed
in the field on selected cohesive
samples. All
of the samples were shipped to Fugro's Houston laboratory where Atterberg limit tests, water
content tests, and grain-size analyses, as well as additional density tests, unconsolidated-undrained triaxial
compression tests, and miniature vane tests, were performed.
A description
of relevant laboratory procedures is provided in Appendix A. The strength and
classification test results are presented graphically
on the Logs of Boring and Test Results in Section 3.
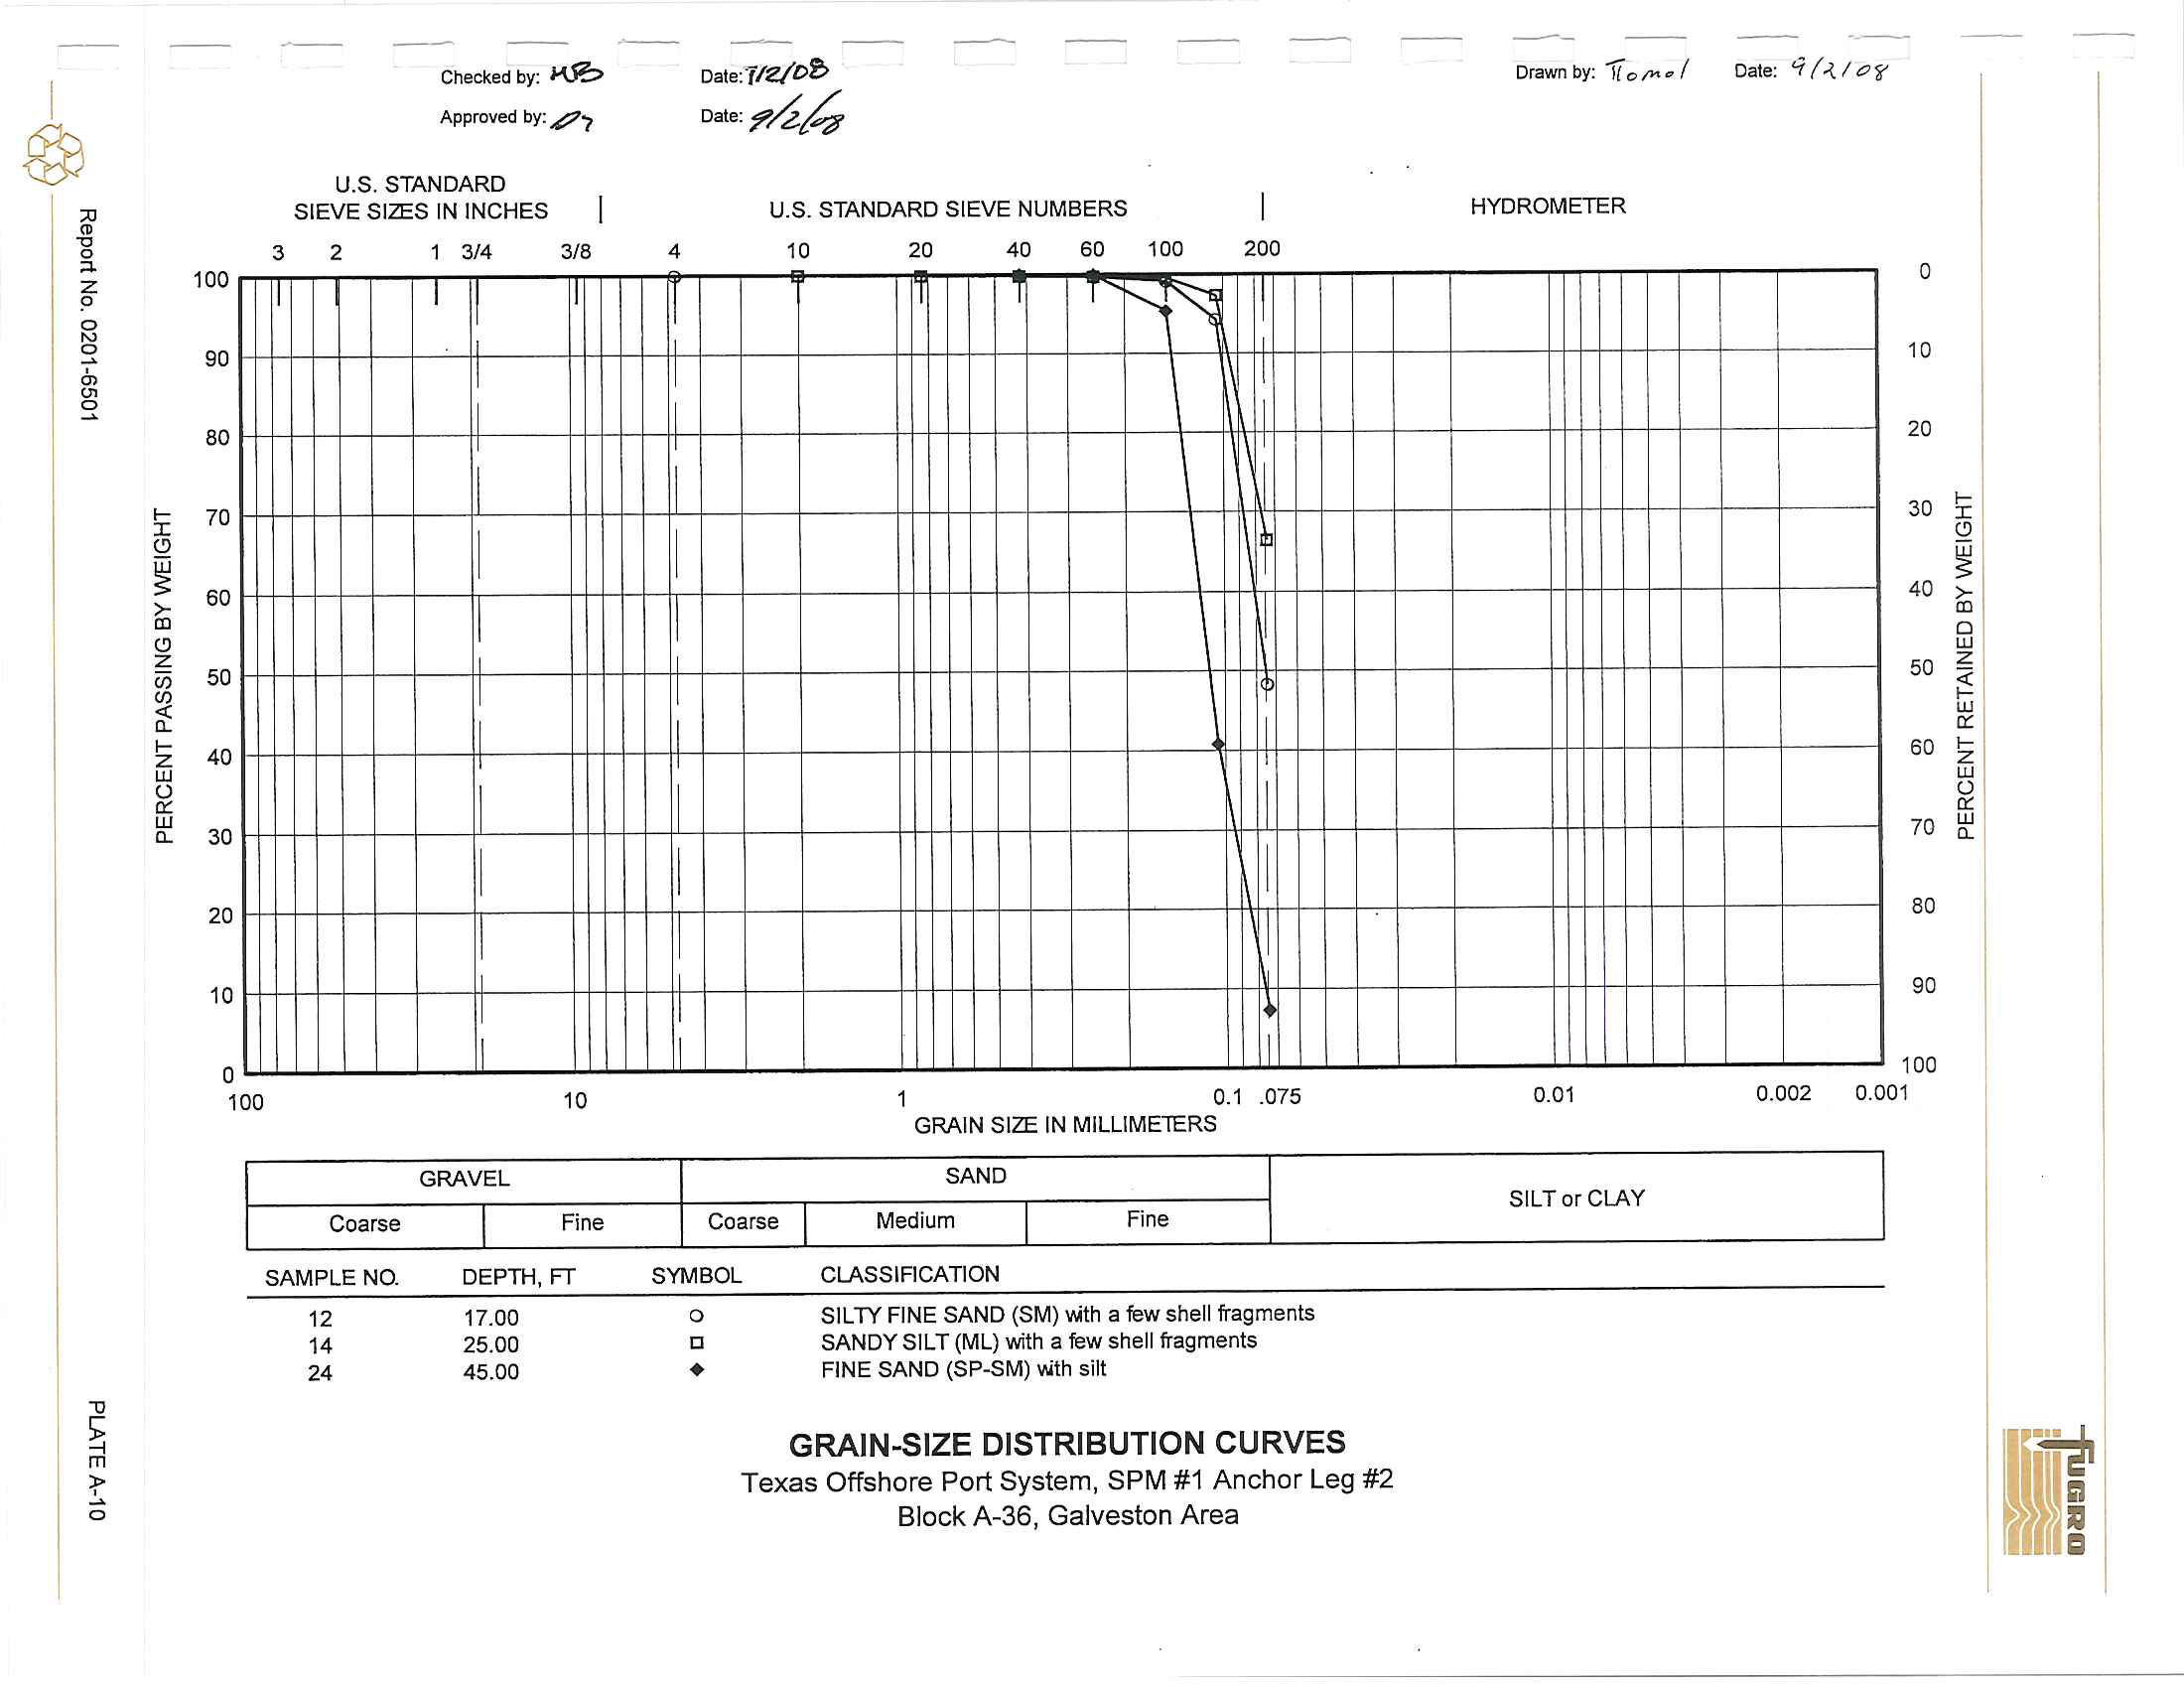
Grain-Size distribution curves from sieve-analyses and stress-strain curves from triaxial compression tests
____--'a"re
___llresented in
AflP~e~n~d~ix~A~.
______________________________
2.3 GENERAL SOIL CONDITIONS
2.3.1
Soil Stratigraphy
The soil stratigraphy at each of the boring locations disclosed by the field and laboratory
investigation
is presented in Section 3. The soil stratigraphy is based on the classification of soil samples
I __
~
___
R_ep_o_rt_N_O_.O_2_01_-_65_0_1______________________________2_.3_____
~
(
D
11-
I
l
1
~
(~:
...
x =
3,274,000«
~
Y =
275,800
It
N
~
...
X
=
3,279,000ft
Block A-36
Galveston Area
...
X
=
3,284,000ft
~
Y =
270,800
It
SPM.!2,.Anchor Leg #6'"
-
.....
Offshore
•
Terminal
/
,
~
Y =
265,800
It
I
SPM #1 PLET \
SPM
#1 Anchclr Leg
#21
\
•
I
\
1,470f!,
"
/
....
-
~
Y =
260,800
It
,.
.....
/
'e
I
\
...
I SPM #2 PLET \
\
1,47~1
"
.... _-
"
...
~
m
~
1l
---~-~------I---------~~----------------------------------------------I-----------
Ii!
15..
u
~
«
~
Projection: Texas South Central Zone Coordinates
__@
Report No.
0201-6501
PLAN OF BORINGS
Texas Offshore Port System, Offshore Terminal Location
BlockA-36, Galveston Area
PLATE
2-1
'"
,.
."
Report No. 0201-6501
,
,
,
,
,
j
,
LINe
82212
»>
'.00
;;::
'00
,
,
N
.00
~
~
,.
-<'","~UNeS22H
,
,
,
~
<i.e.<UHE
S22trJ
il
li!
,
!il:
+,
,
,
+
+
-,
+
•
SPM#2 Anchor Leg #6
,
~
,
, ,I,
::-+--+---'-------"'4------ll.....----+--..::..------t"---...c-----'----+---..::.-----
+,L.--<;i(,dINESlP:M
l"A;Sr
.. SPM#2 PLET
l
'"
~~~~_~
____!_________
~~~--------JL--_t----l.....l.....---------~,,------------l--_t------!0---------4-2~~-
~
_u~s~~»~sr
+
.. SPM#1 PLET
,
,
,
•
J
+
+
SPM#1 Anchor Leg #2 ,
,
,
I
1
'"
+
,
,
,
,
,
.•
..
,
,
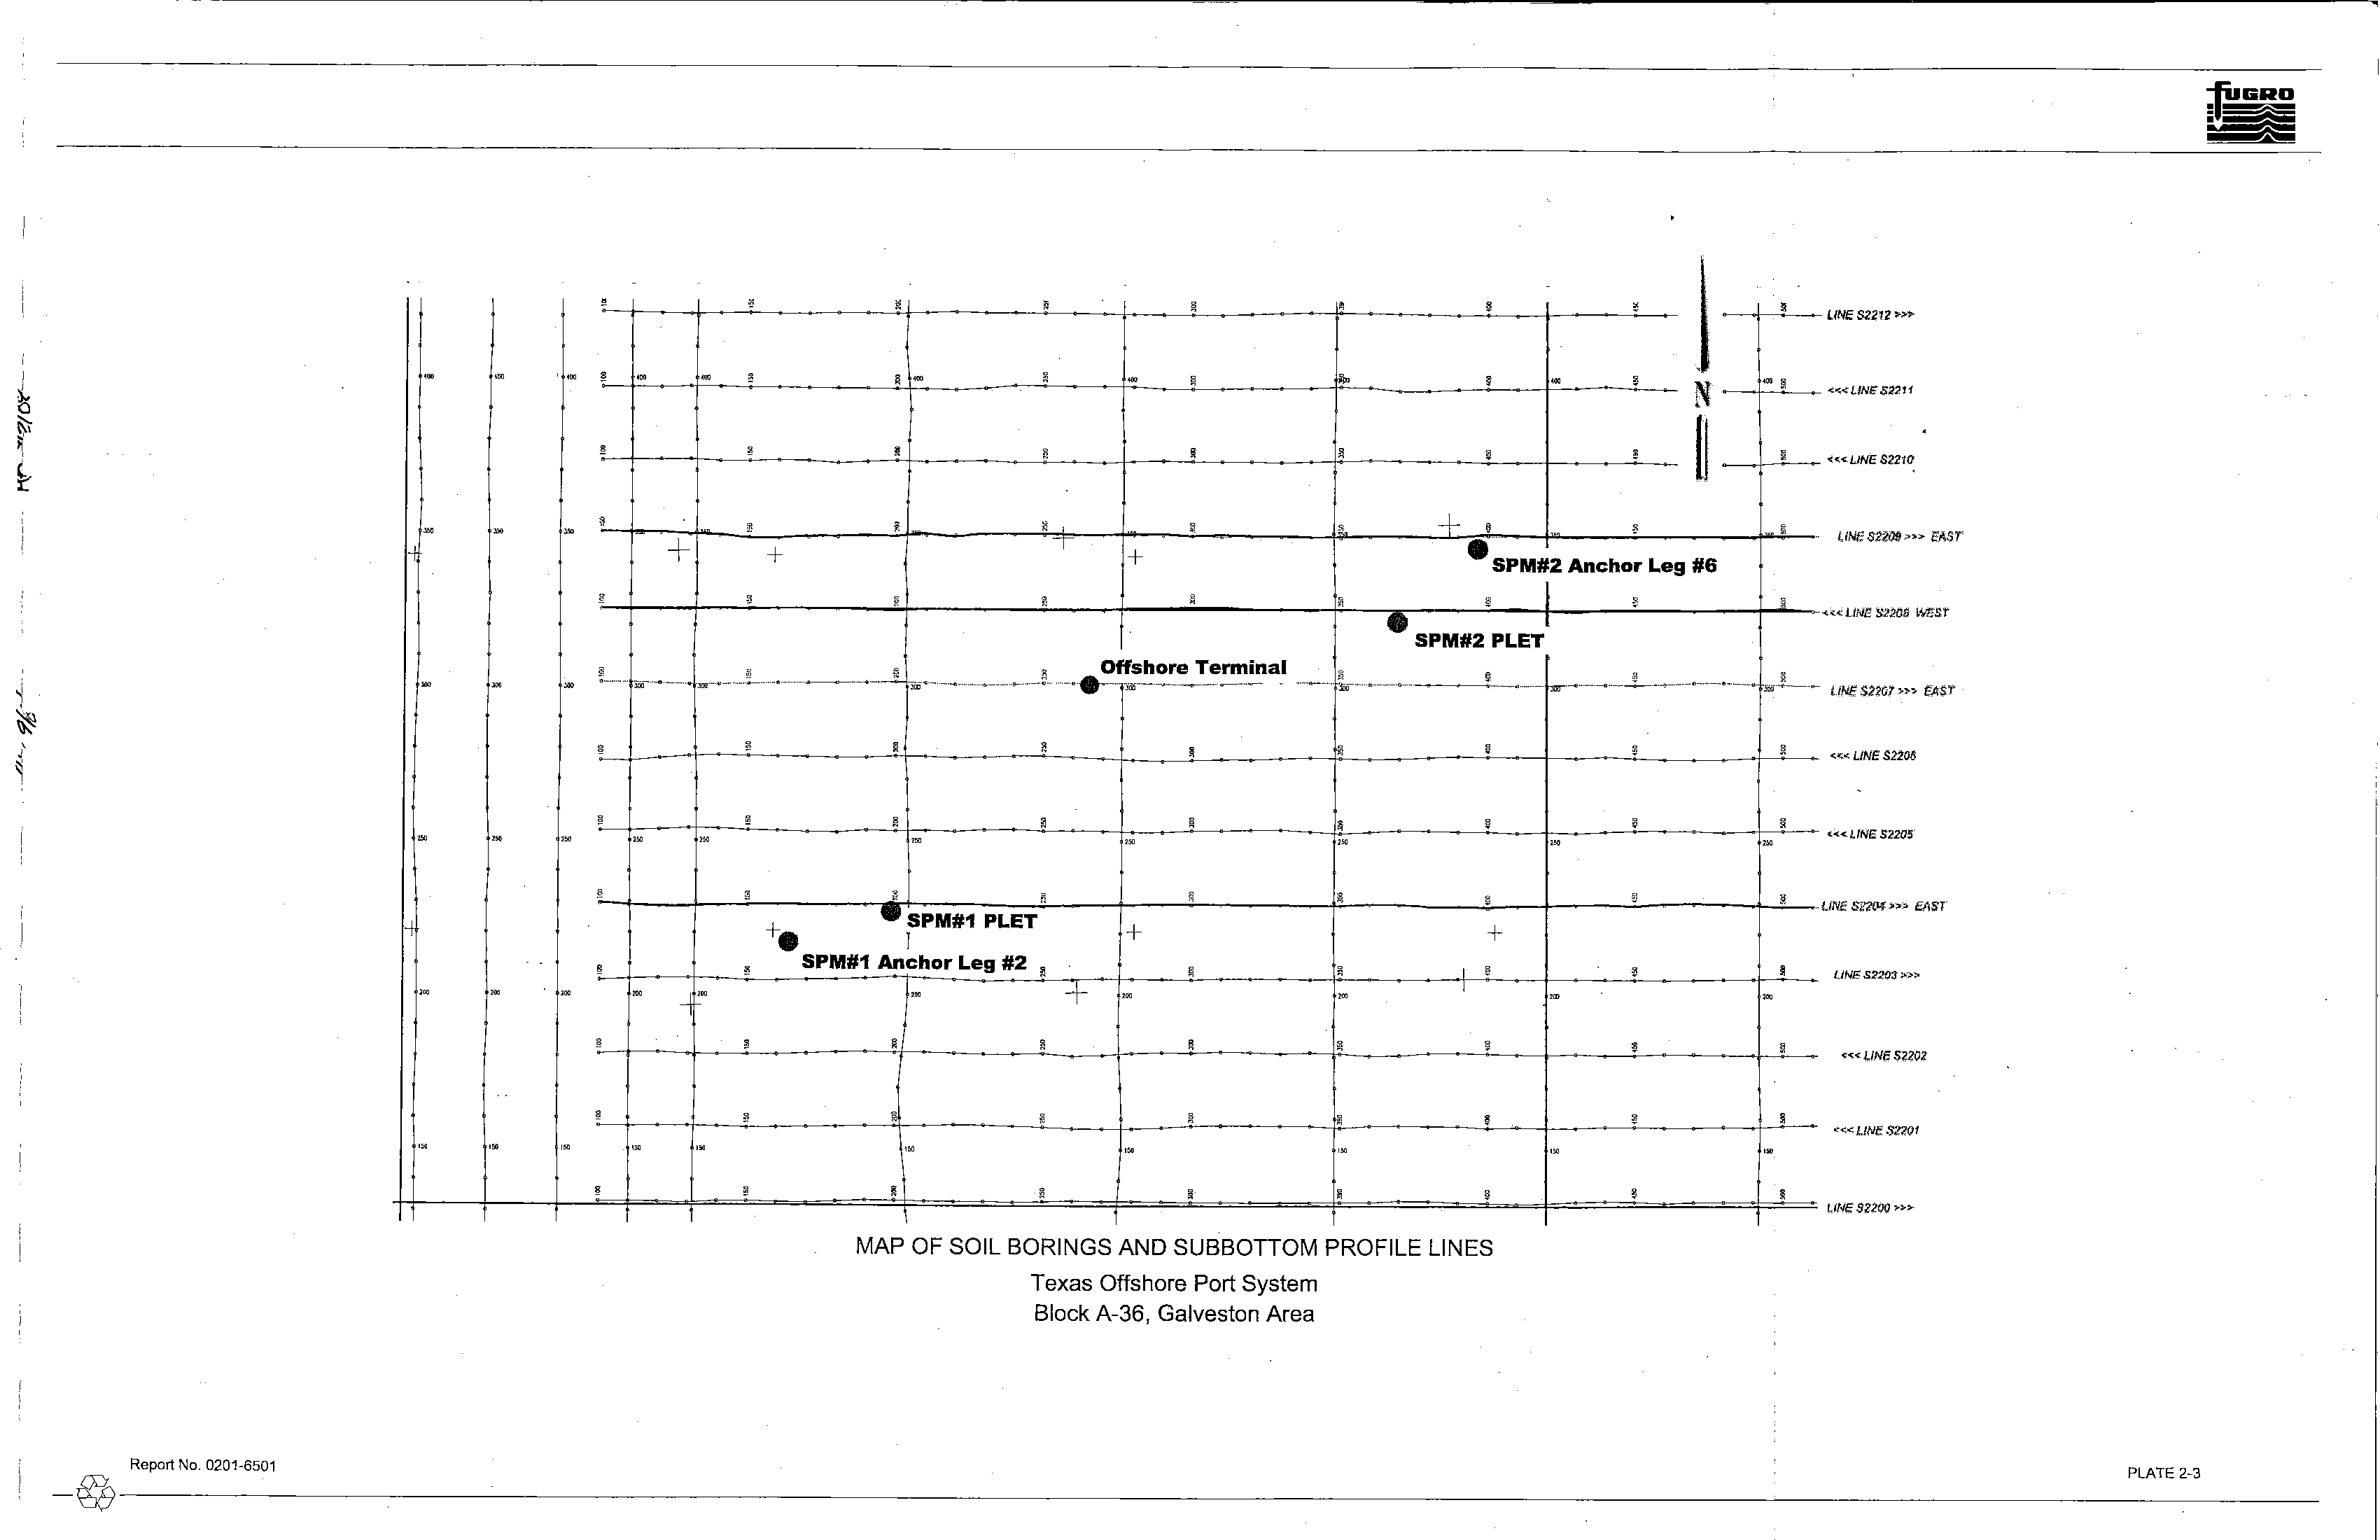
MAP OF SOIL BORINGS AND SUBBOTTOM PROFILE LINES
Texas Offshore Port System
Block A-36, Galveston Area
,
'"
,
,
....«
LINE .'5;,,'201
IJM~
$Z2Qt)
,..»
PLATE 2-3
-@-------------------------------------------------------------------------------
[
1-
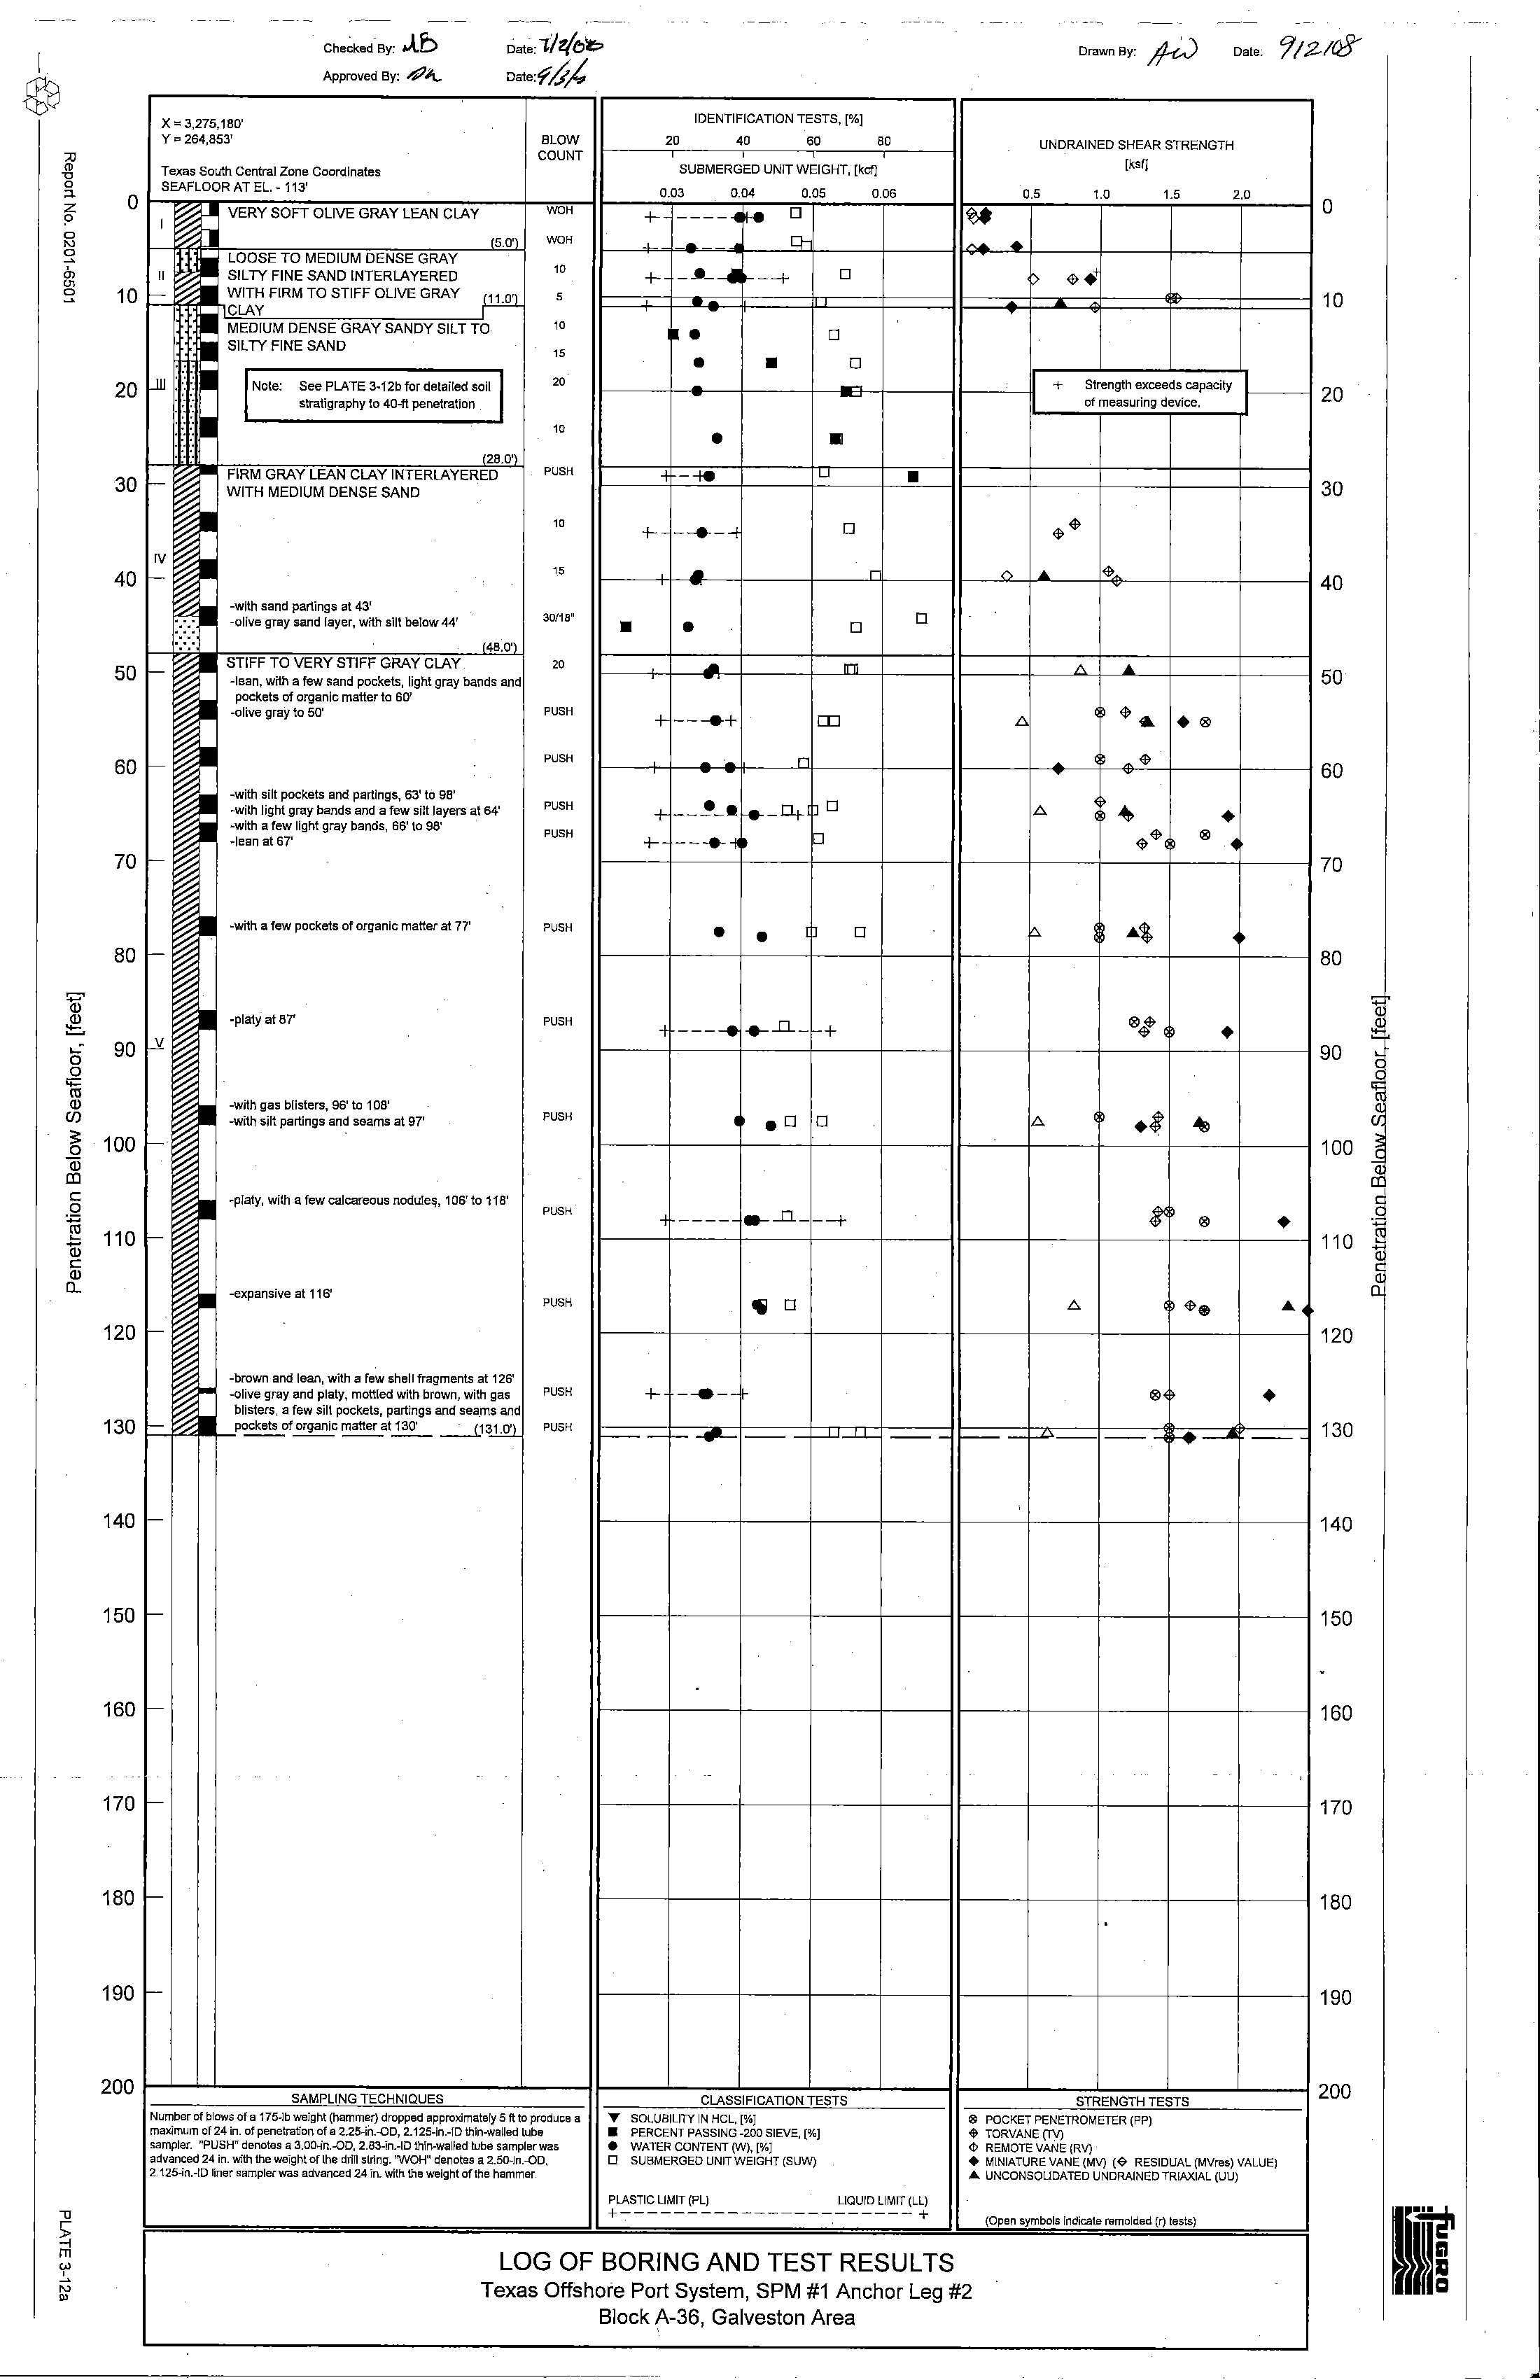
3.2 SPM #1 ANCHOR LEG #2 LOCATION
3.2.1
Introduction
The field investigation at the location designated as SPM #1 ANCHOR LEG #2 was performed on
June 26 and 27,2008. Soil sampling was performed to 131-ft penetration at Texas South Central Zone
Coordinates X
=
3,275,180 ft and Y
=
264,853 ft. The measured water depth was 113 ft.
3.2.2
Soil Stratigraphy
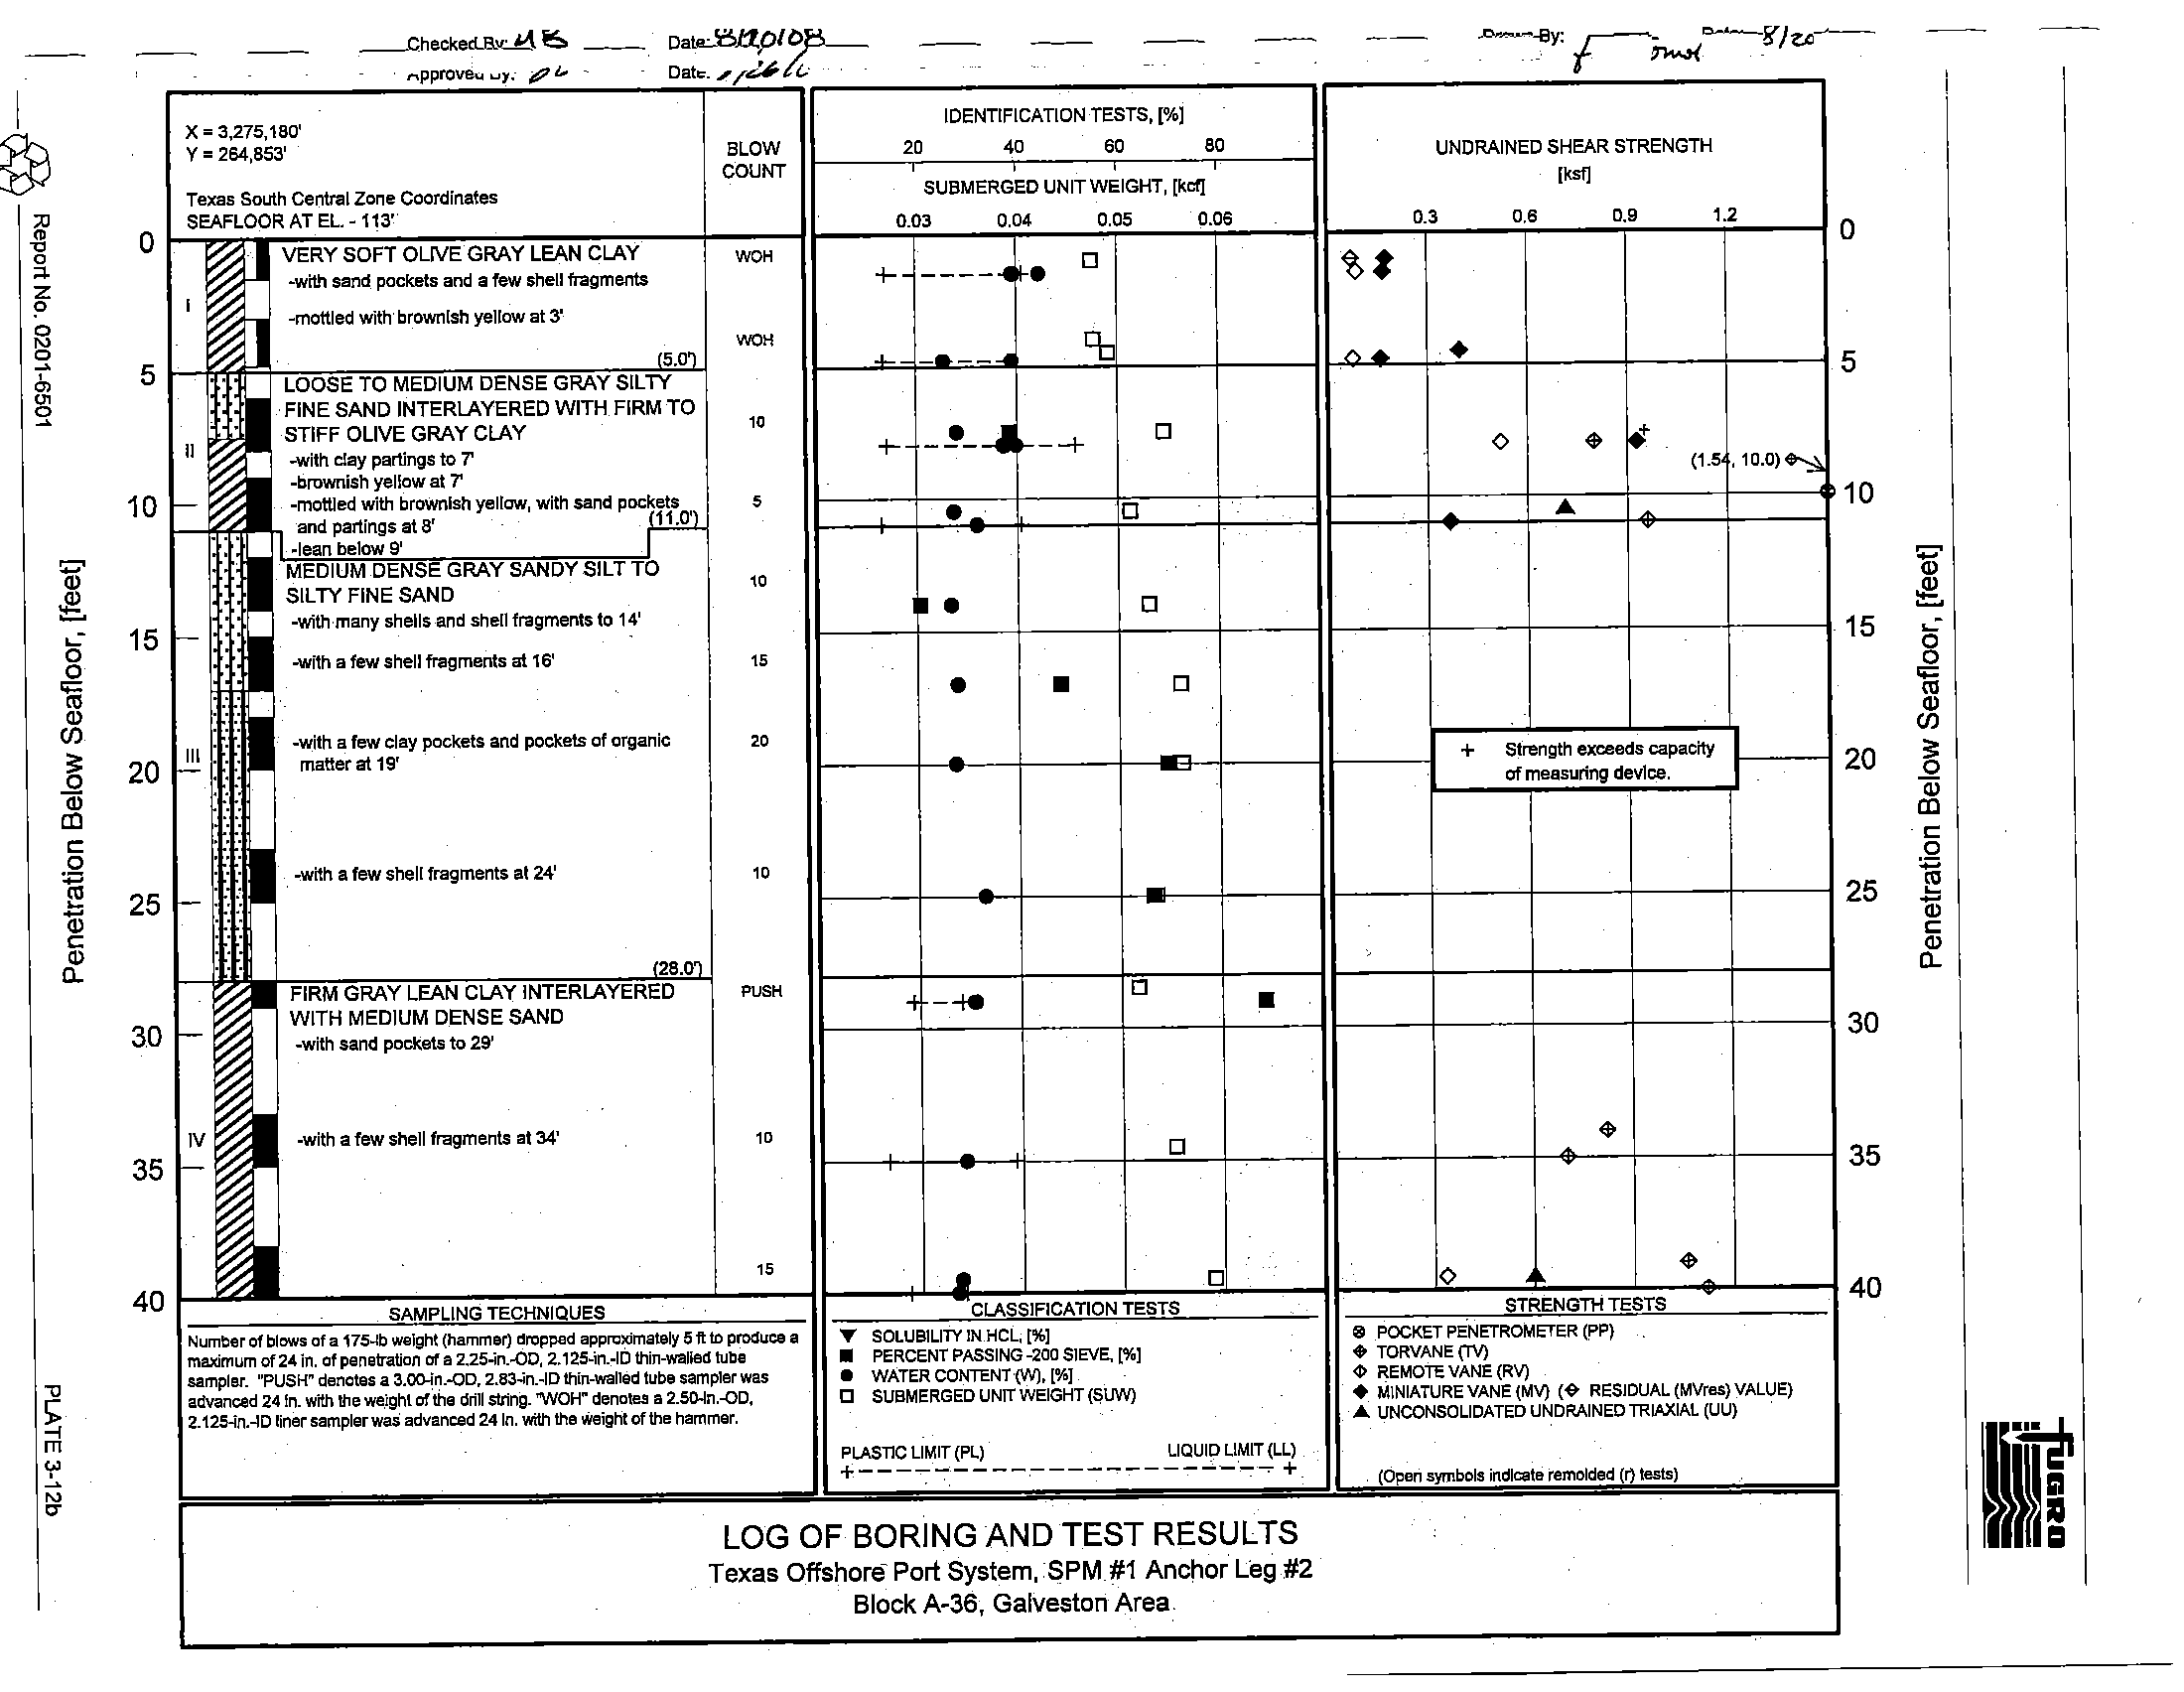
The soil stratigraphy disclosed by the field and laboratory investigations is presented on the boring
log, Plate 3-12
.. The soil stratigraphy is based on the classification of soil samples recovered from the
boring and observations made during drilling operations. A generalized summary of the major soil strata is
tabulated below.
Penetration, ft
Stratum
From
To
Description
I
0
5
Very soft lean clay
II
5
11
Loose to medium dense silty fine sand
interlayered with firm
to stiff clay
III
11
28
Medium dense sandy silt to silty fine sand
IV
28
48
Firm lean clay interlayered with medium
dense sand
V
48
131
Stiff to very stiff clay
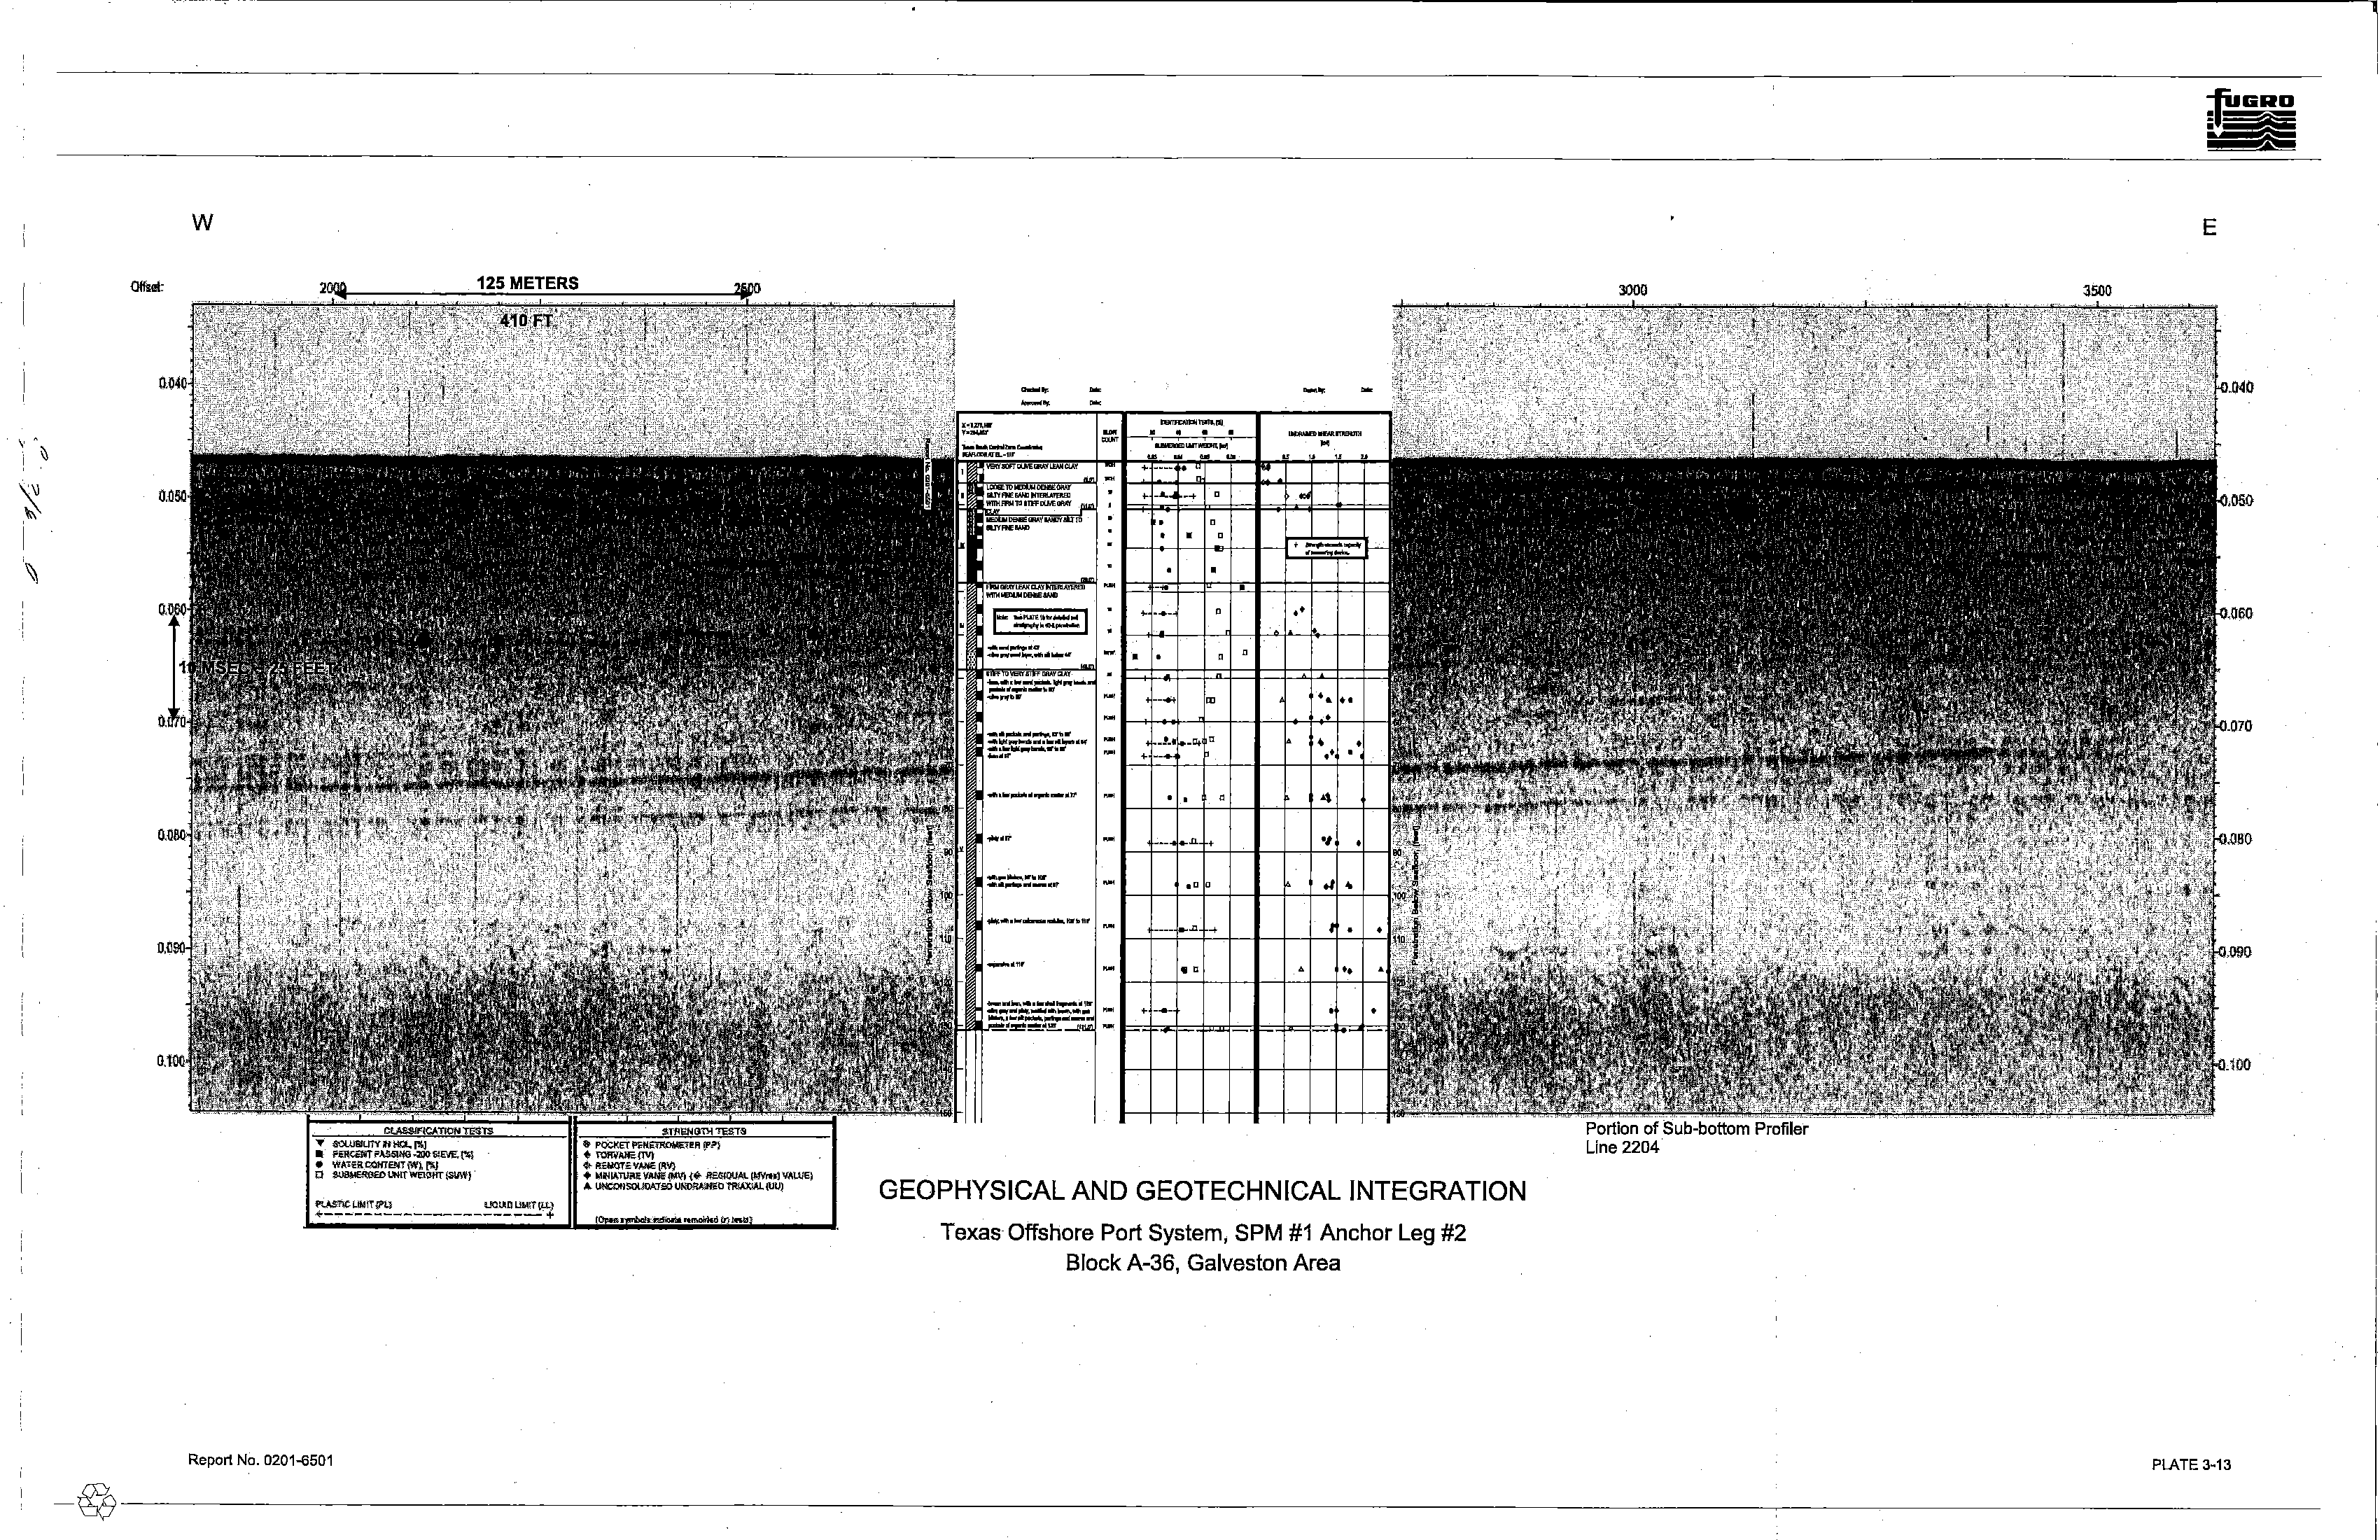
Detailed soil descriptions that include textural variations and inclusions are noted
on the boring log.
A key to the terms and symbols used
on the boring log is presented on Plate 2-2. The Roman numeral
representing each stratum is also shown on the boring
log and on relevant plates. The variation in soil
stratigraphy across this site is indicated
in a comparison (integration) of the geophysical and geotechnical
soil information presented
on Plate 3-13.
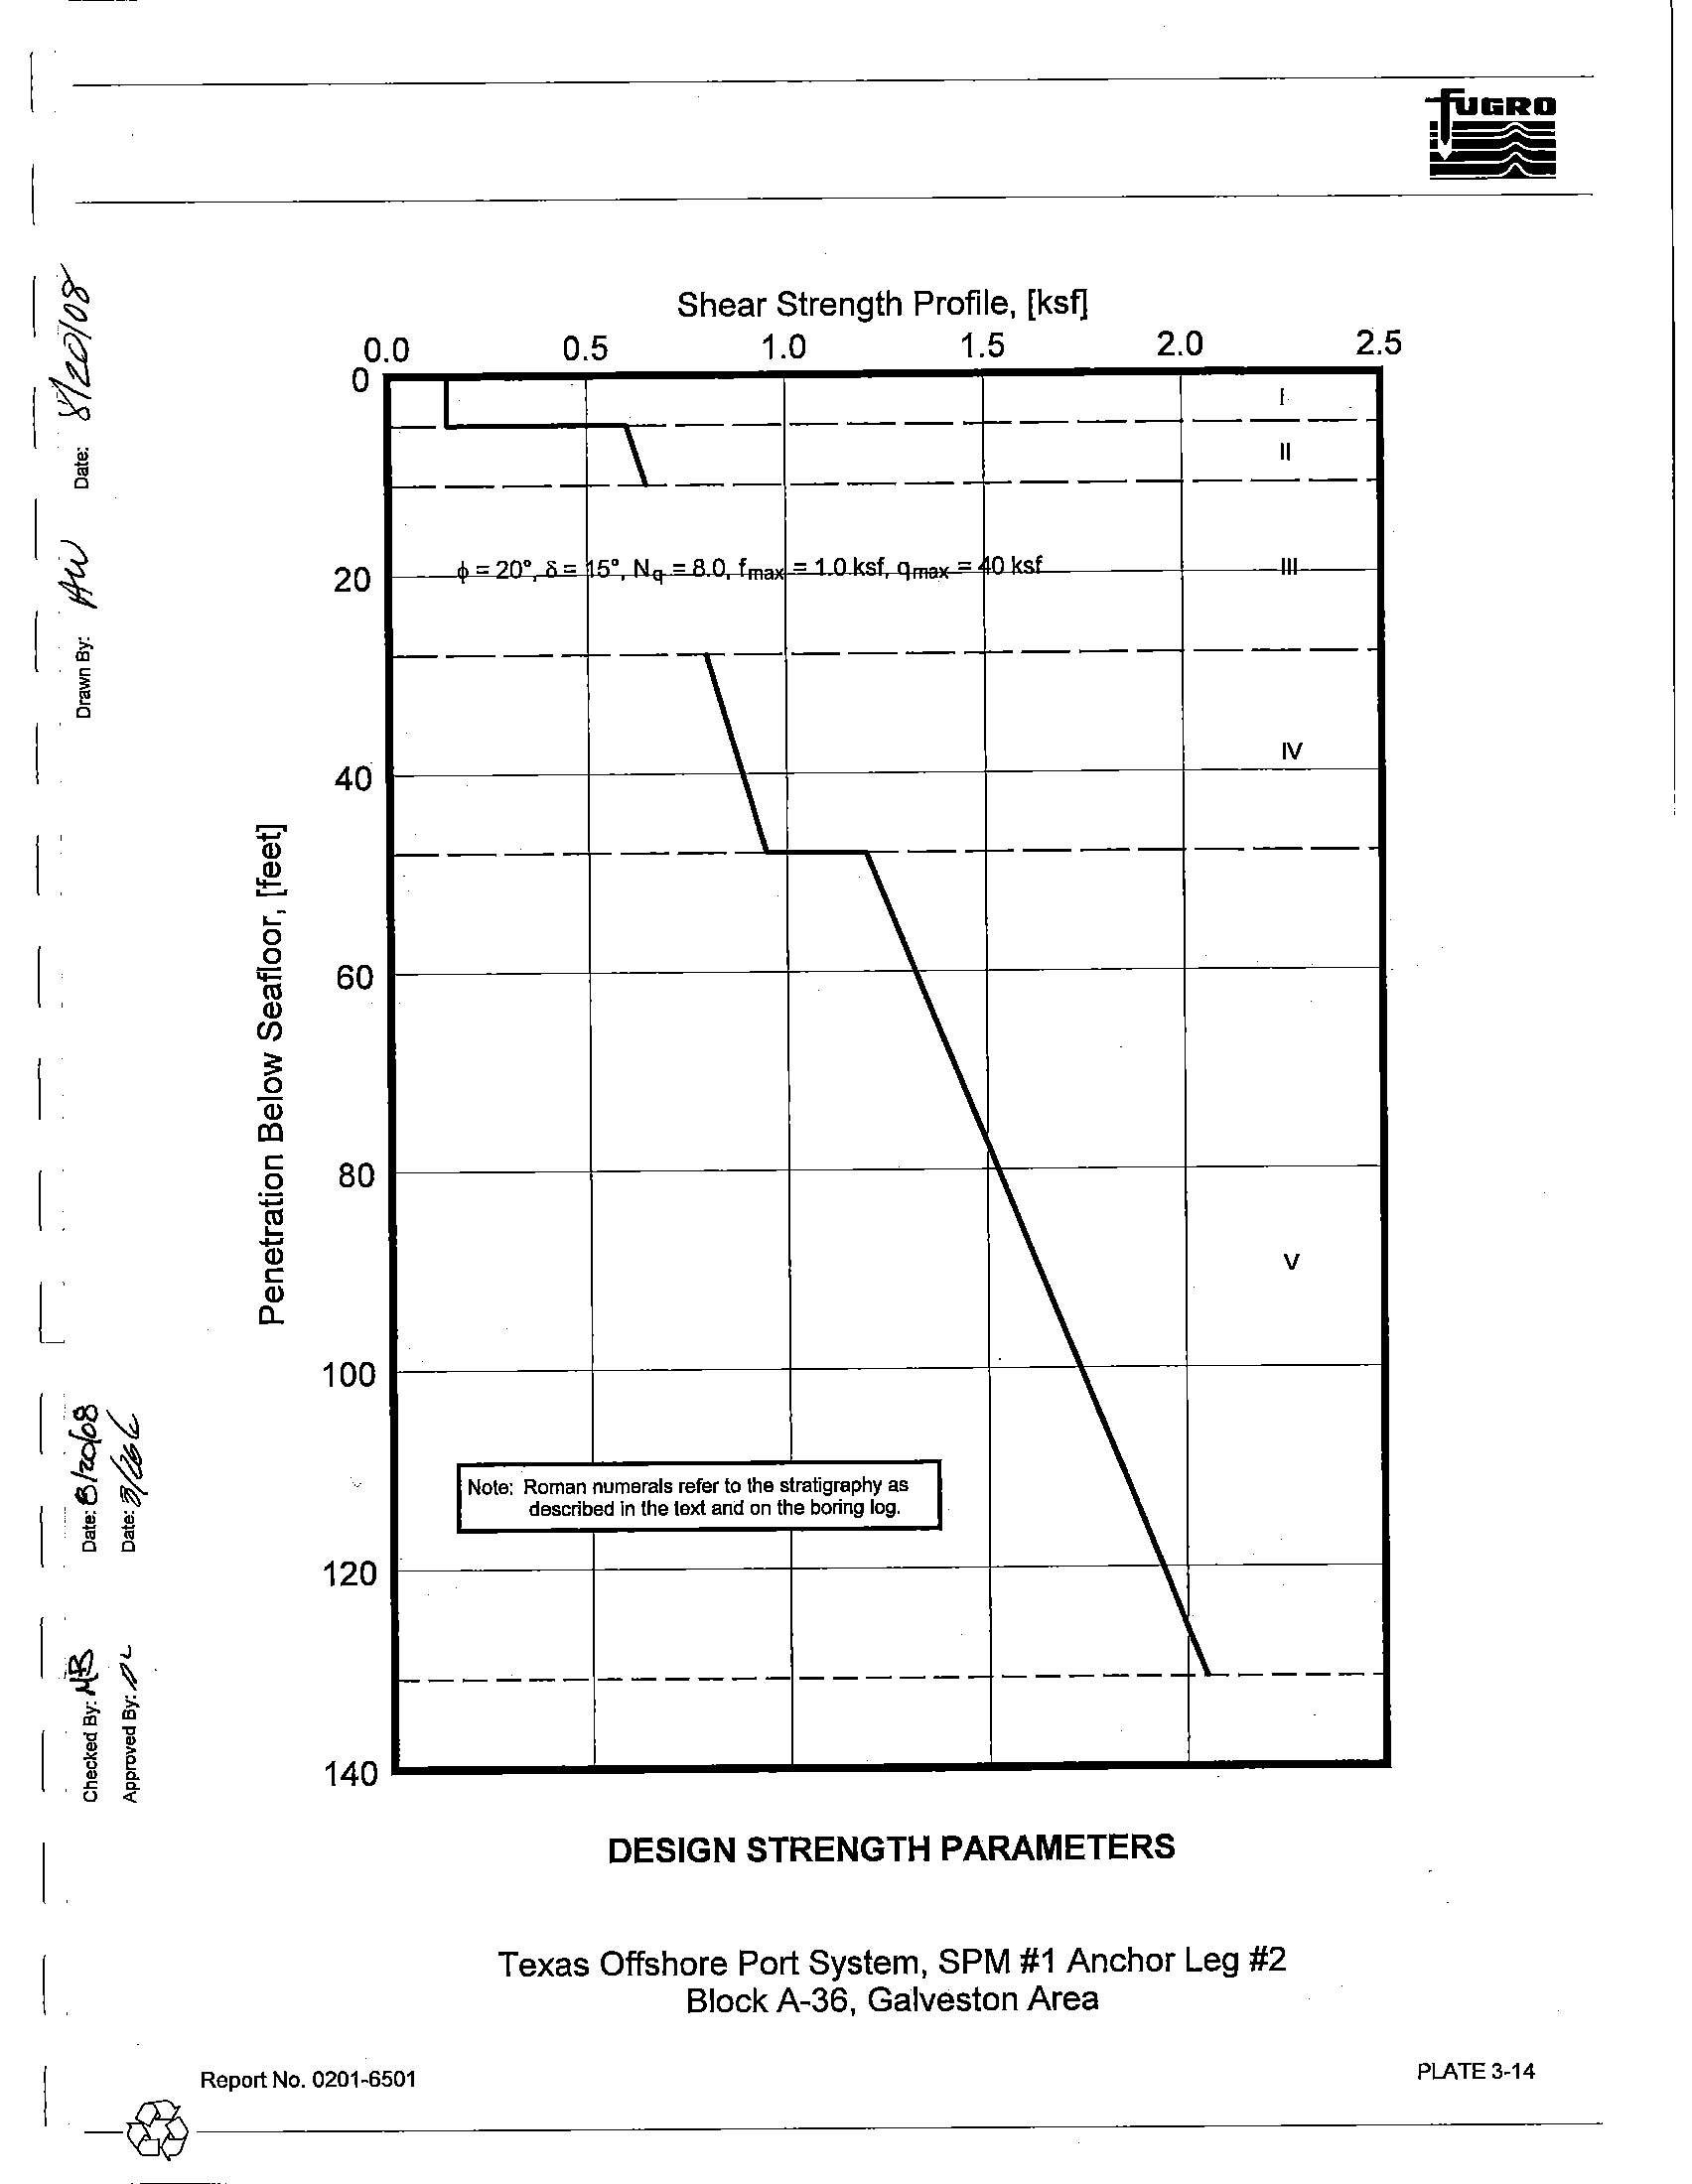
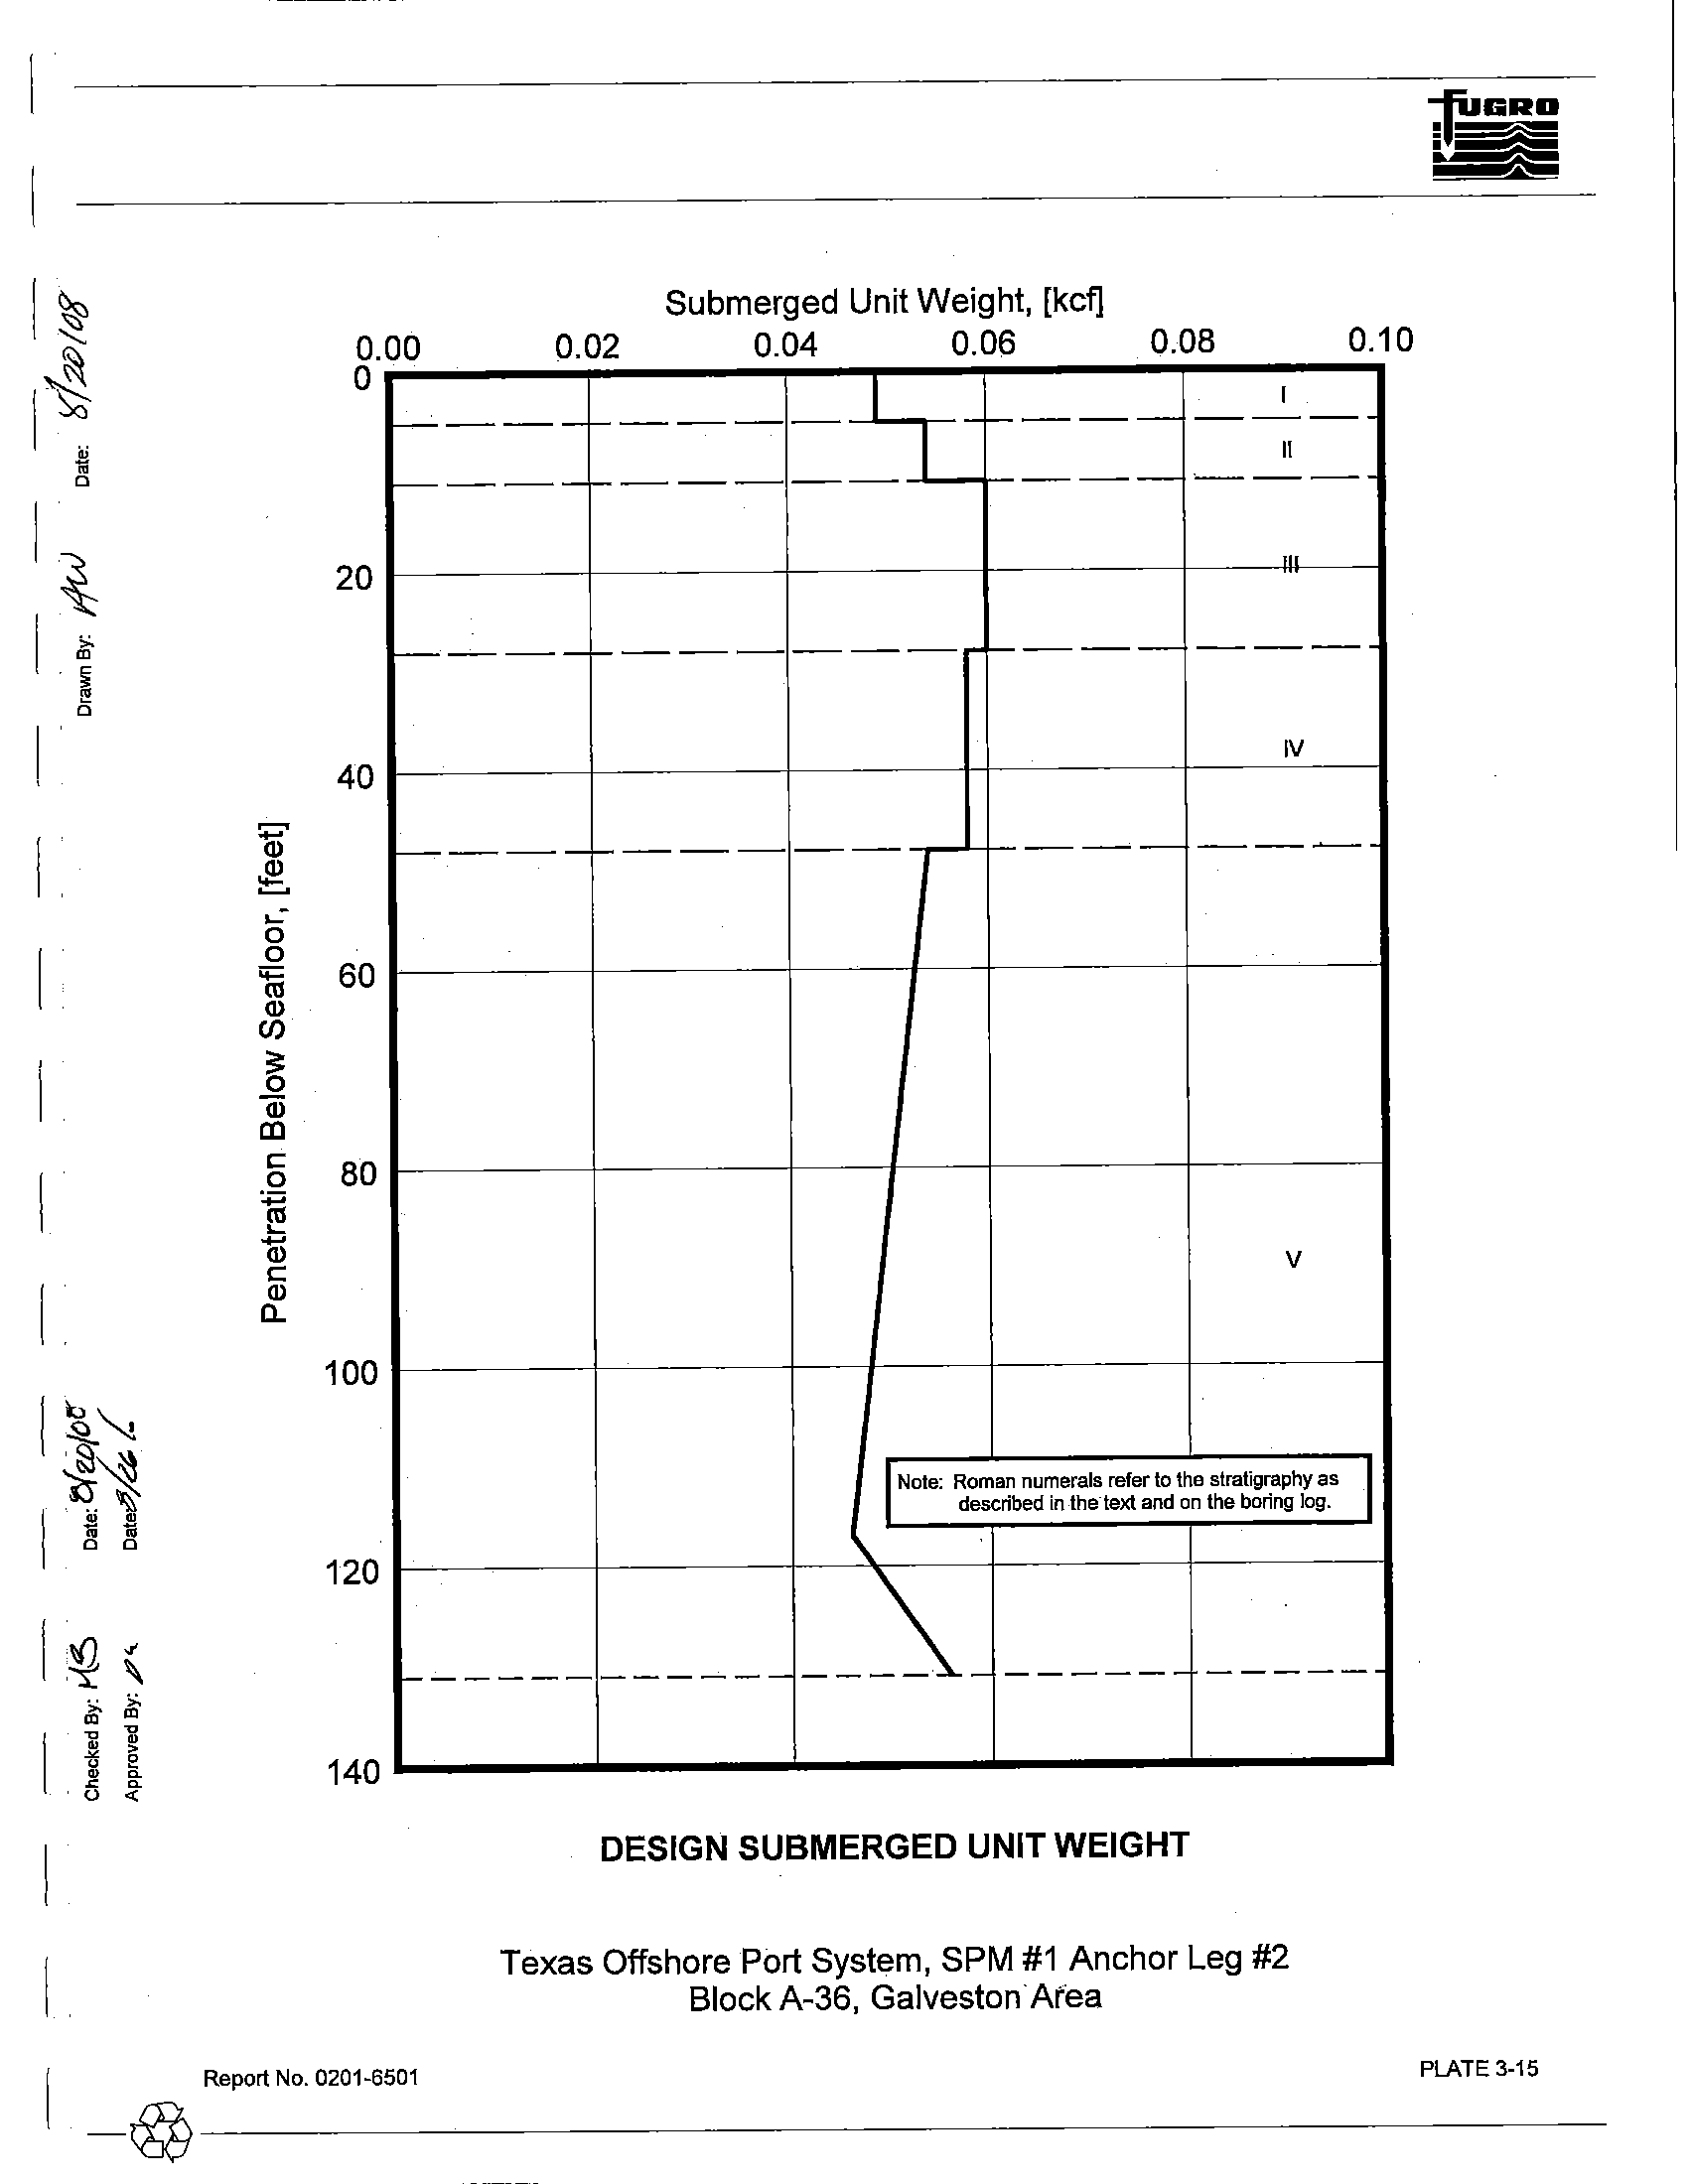
3.2.2.1 Interpretation
of Soil Properties
The shear strength and submerged unit weight profiles shown
on Plates 3-14 and 3-15,
respectively, best represent the assembled test results plotted
on the boring log. These profiles were used
in the engineering analyses.
3.2.3
Pile Design Information
The pile design information developed for this study includes ultimate axial capacities, axial load-
pile movement data, and lateral soil resistance-pile deflection (p-y) characteristics. The analytical methods
used to develop this information are presented briefly
in Section 2.5 and in more detail in Appendix B.
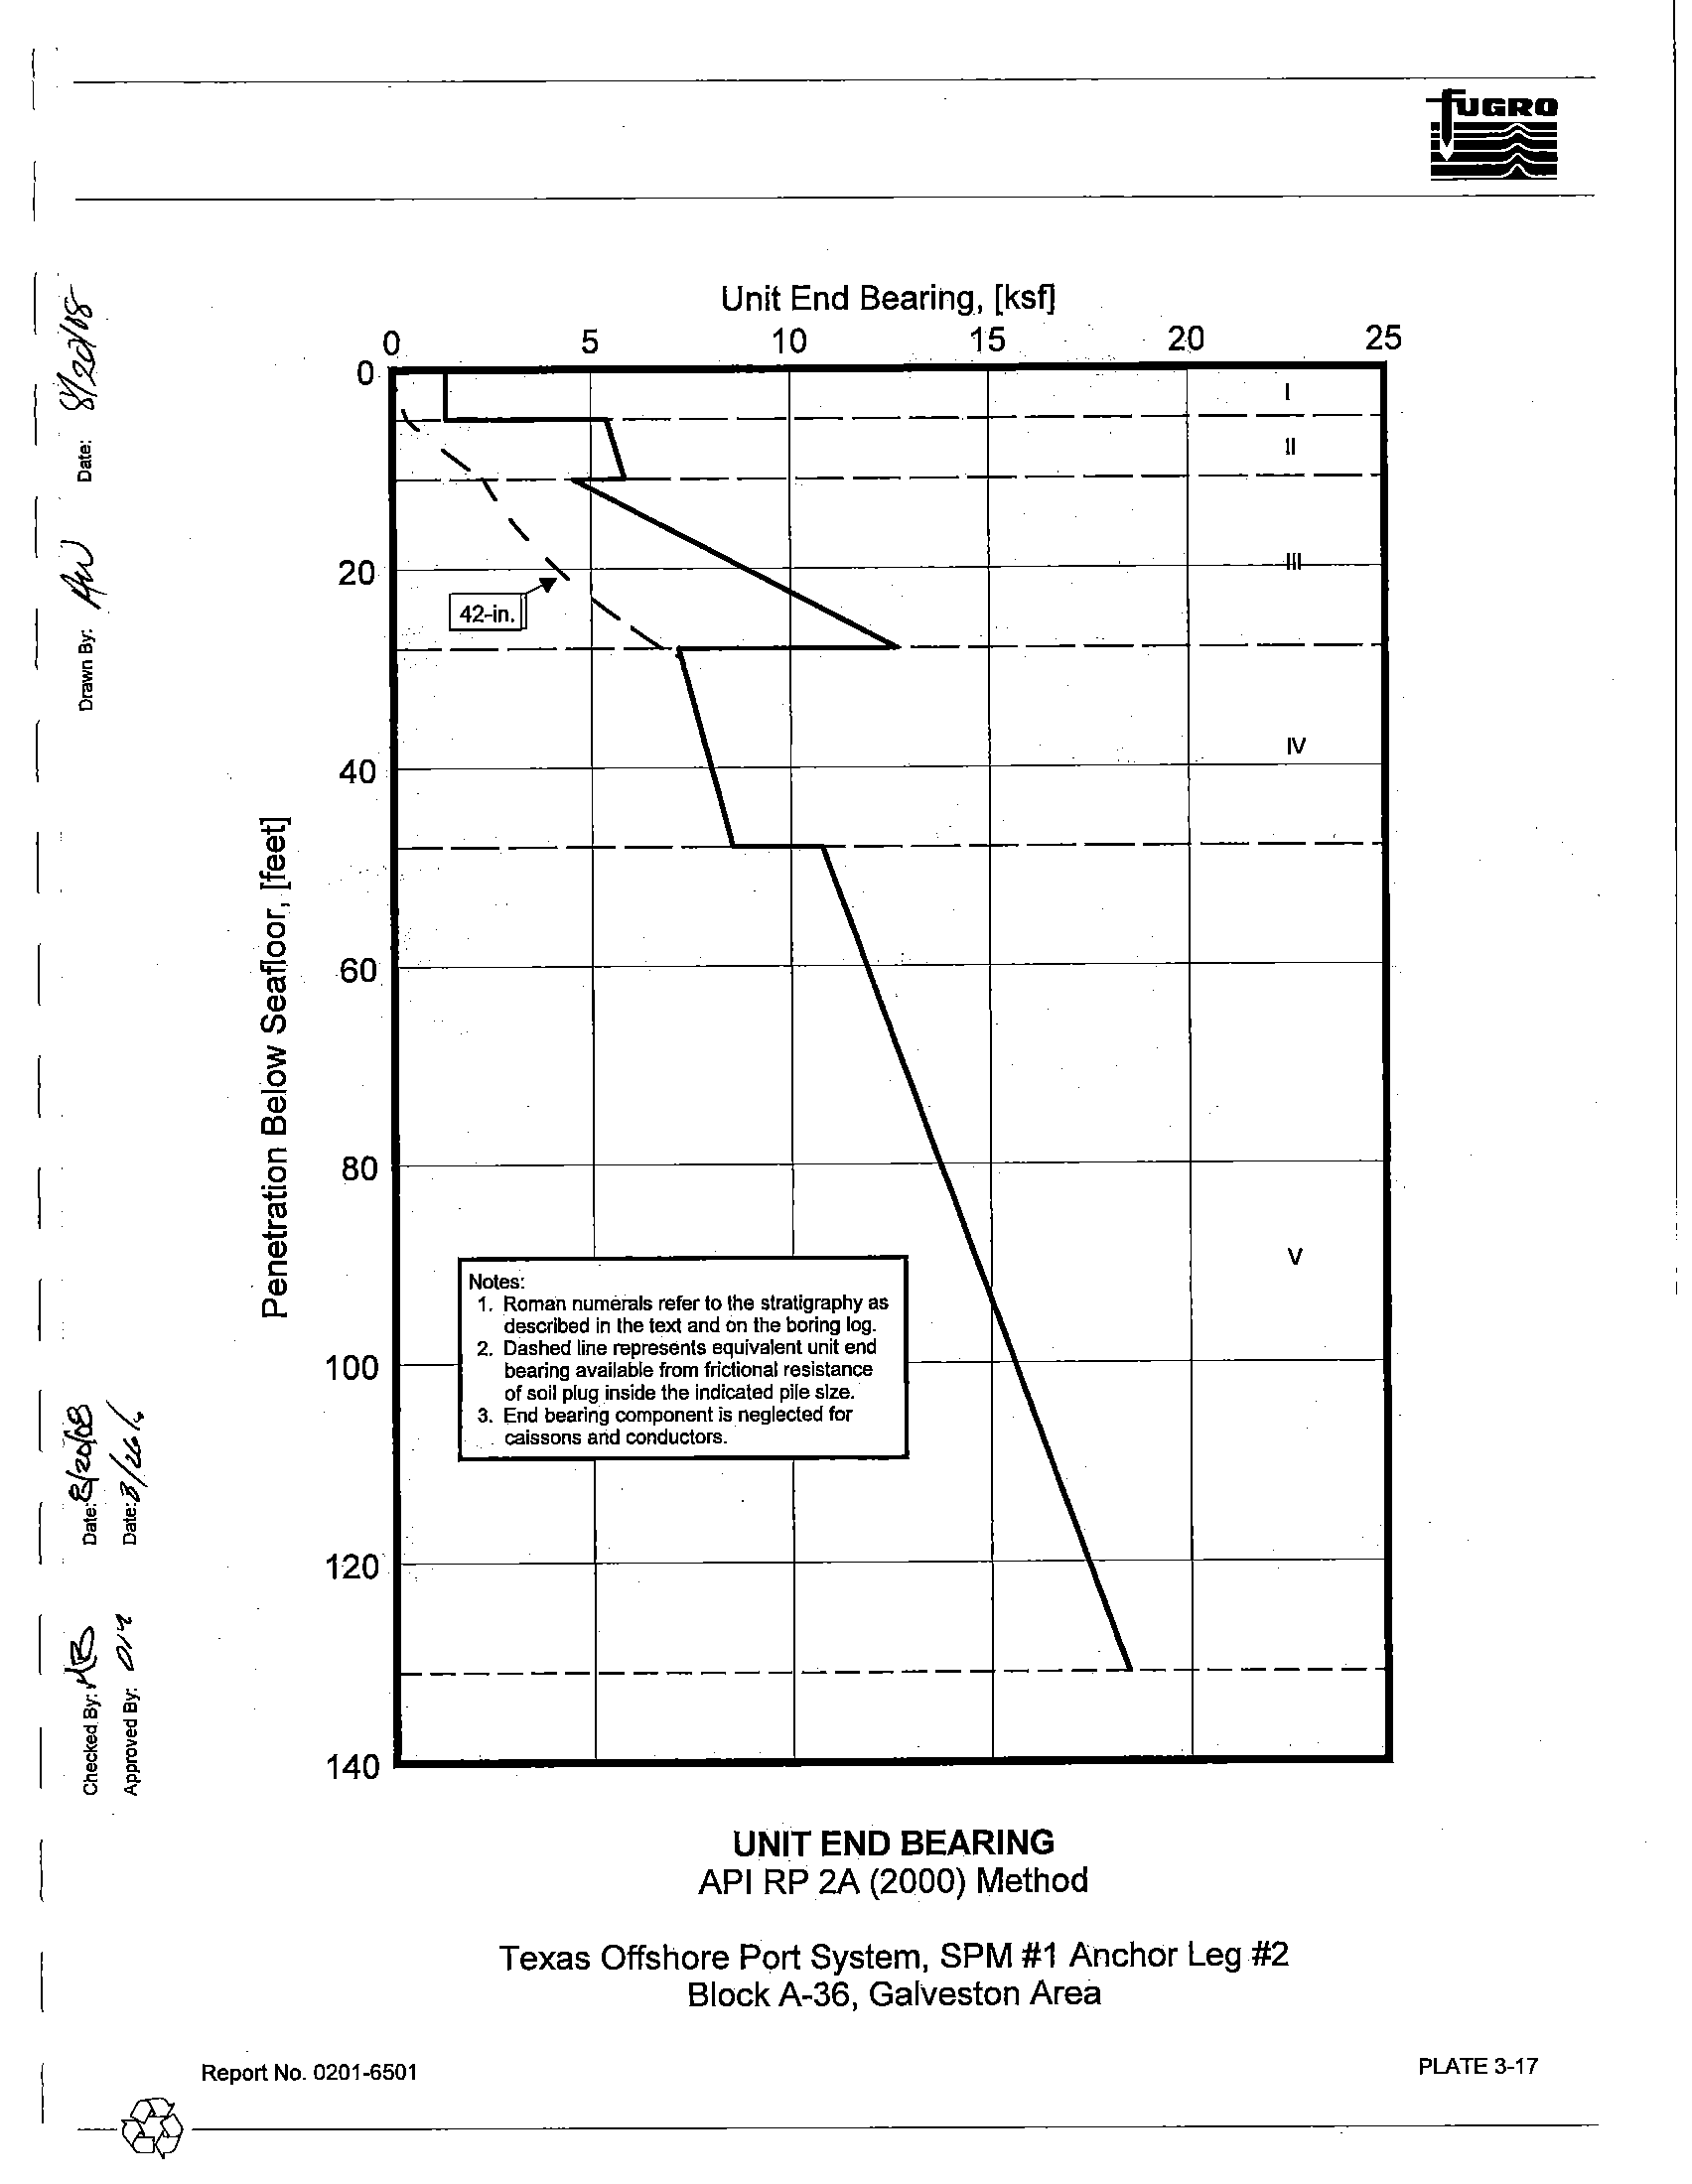
3.2.3.1 Axial Pile Design
Ultimate Axial Capacity. The unit skin friction and unit end bearing values plotted on Plates 3-16
and 3-17, respectively, was calculated using the API
RP 2A methods described in Appendix B.
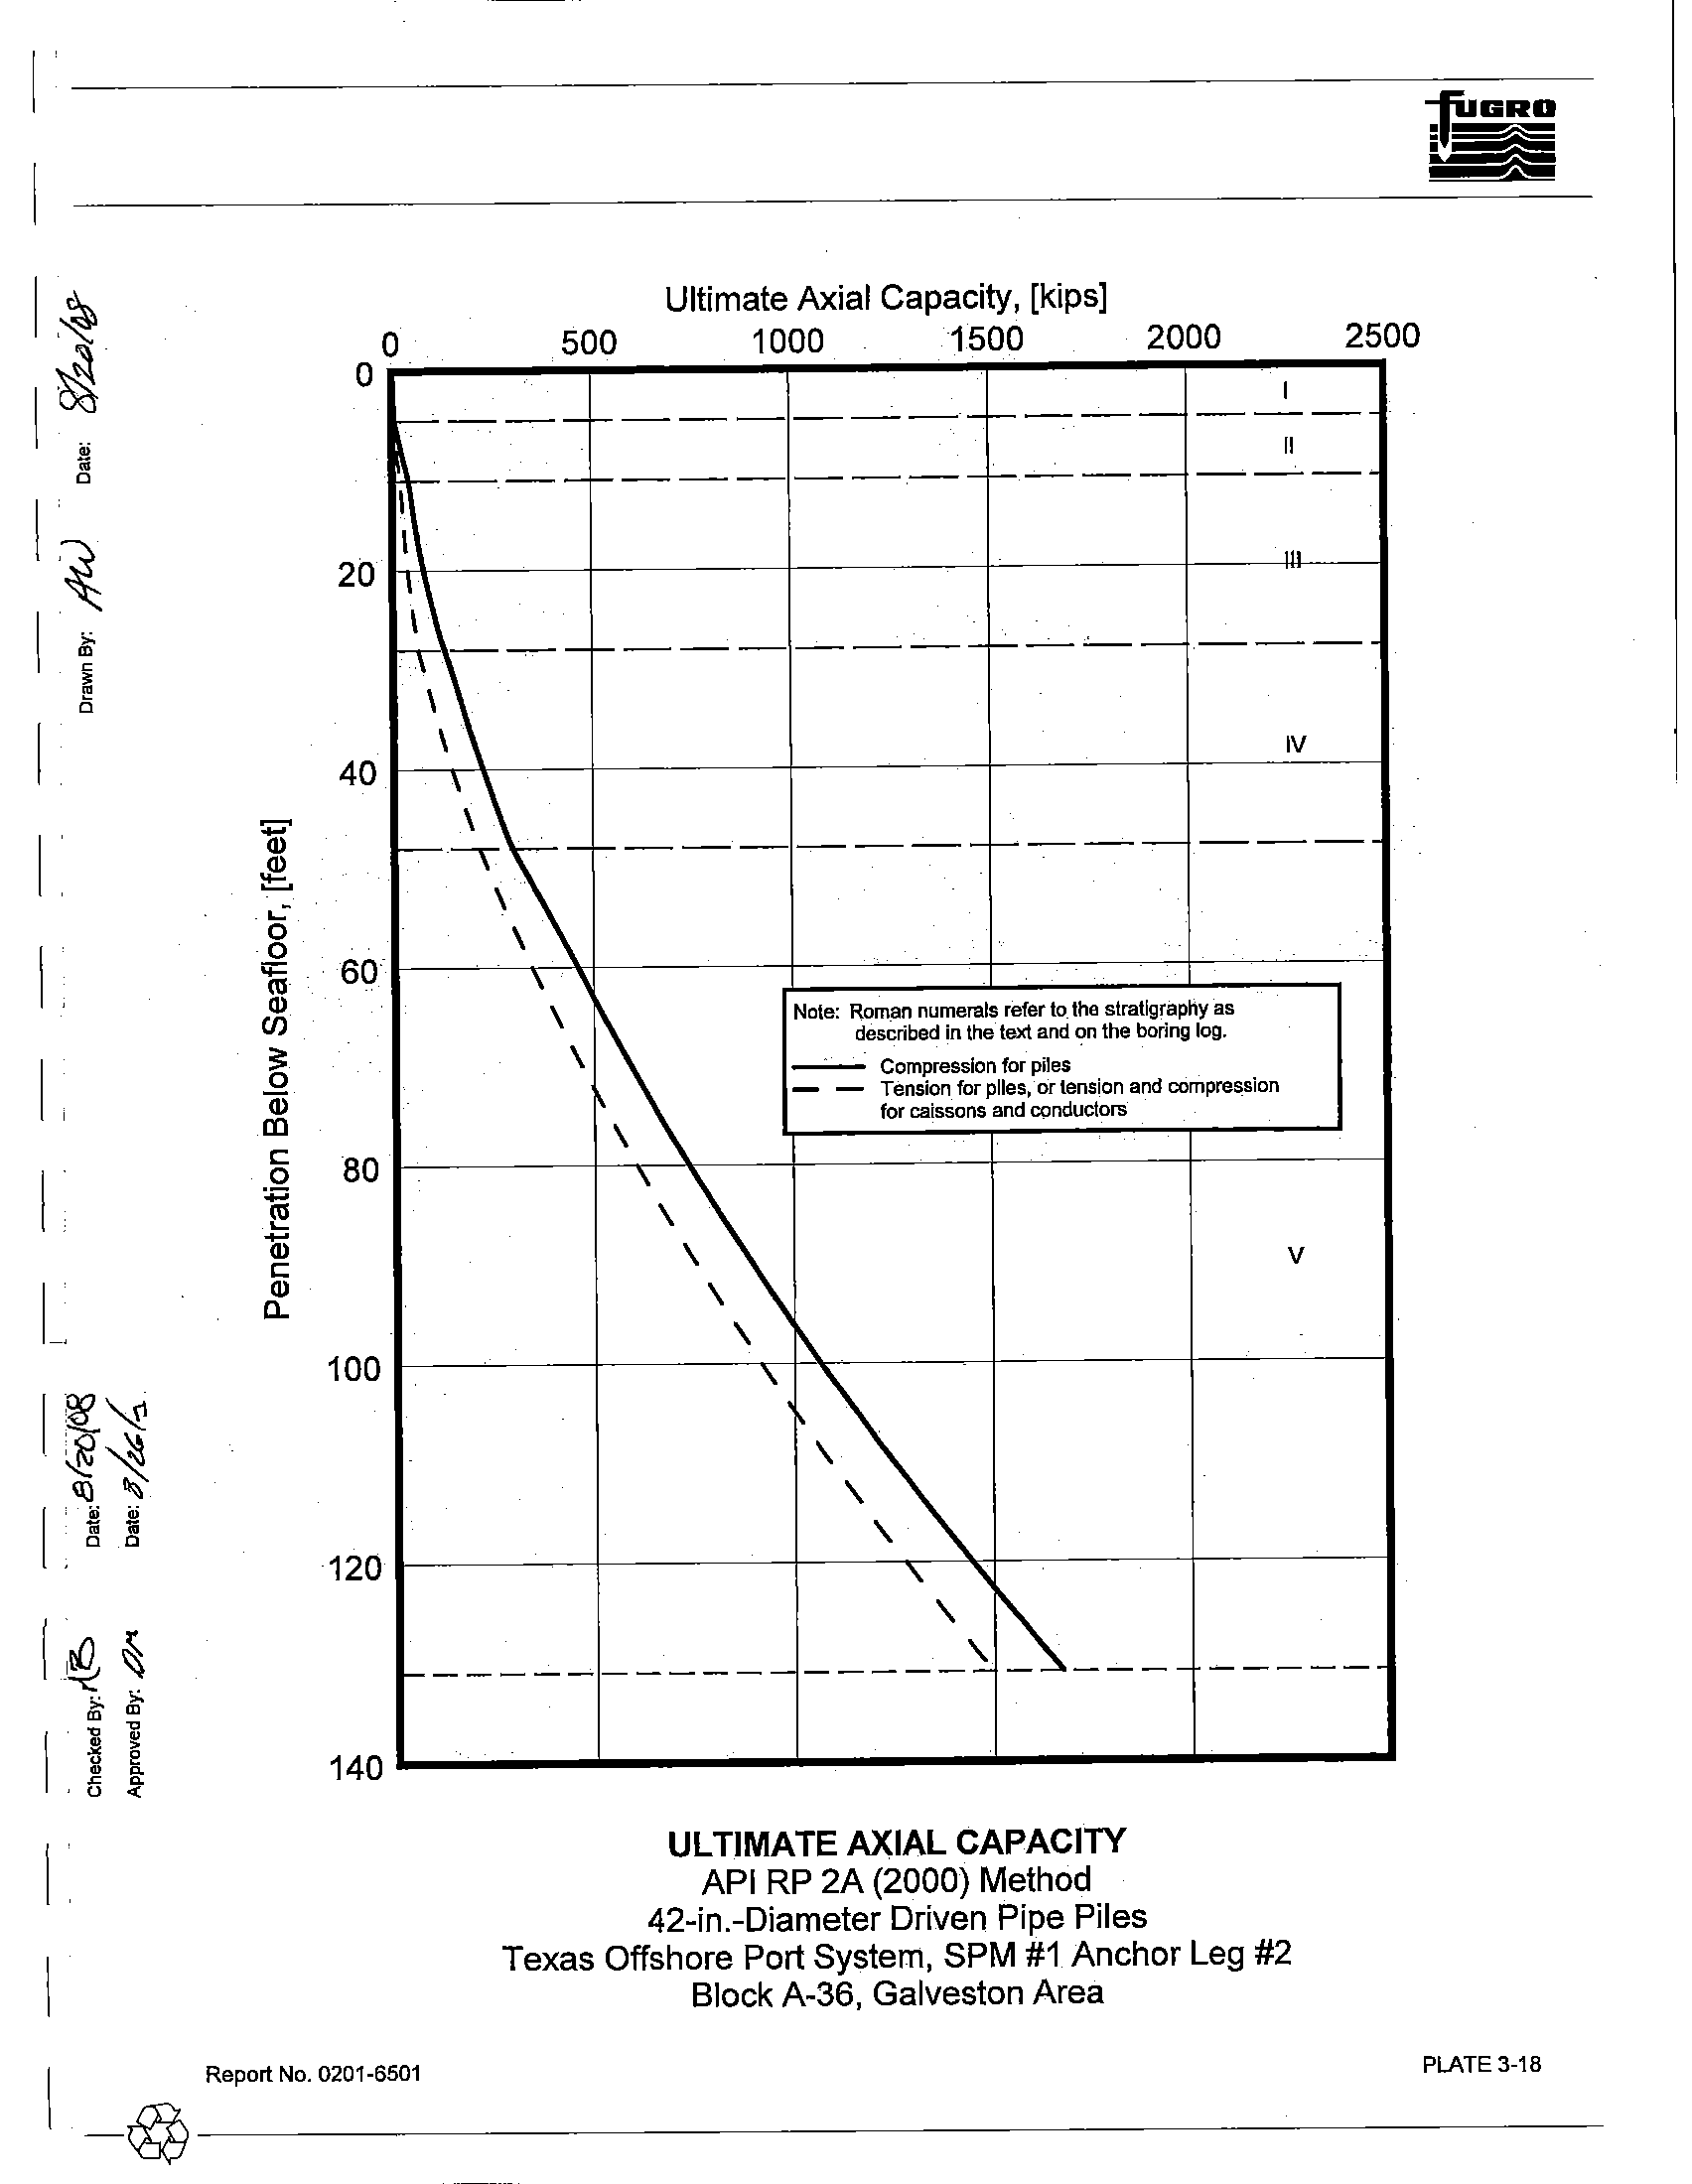
These
values were used
to calculate the ultimate axial compressive and tensile capacities for 42-in.-diameter pipe
piles, driven to final penetration at the boring location. Capacity curves for driven pipe piles (conductors,
caissons and foundation piles) are presented
on Plate 3-18.
[ ___
~
_____
R_e_po_rt_N_O_._02_0_1'_6_50_1___________________________________________________________3_,_4______
I-
I
API RP 2A recommends that pile penetrations be selected using appropriate factors of safety or
pile resistance factors. These factors are discussed
in Section 2.5.1 of this report.
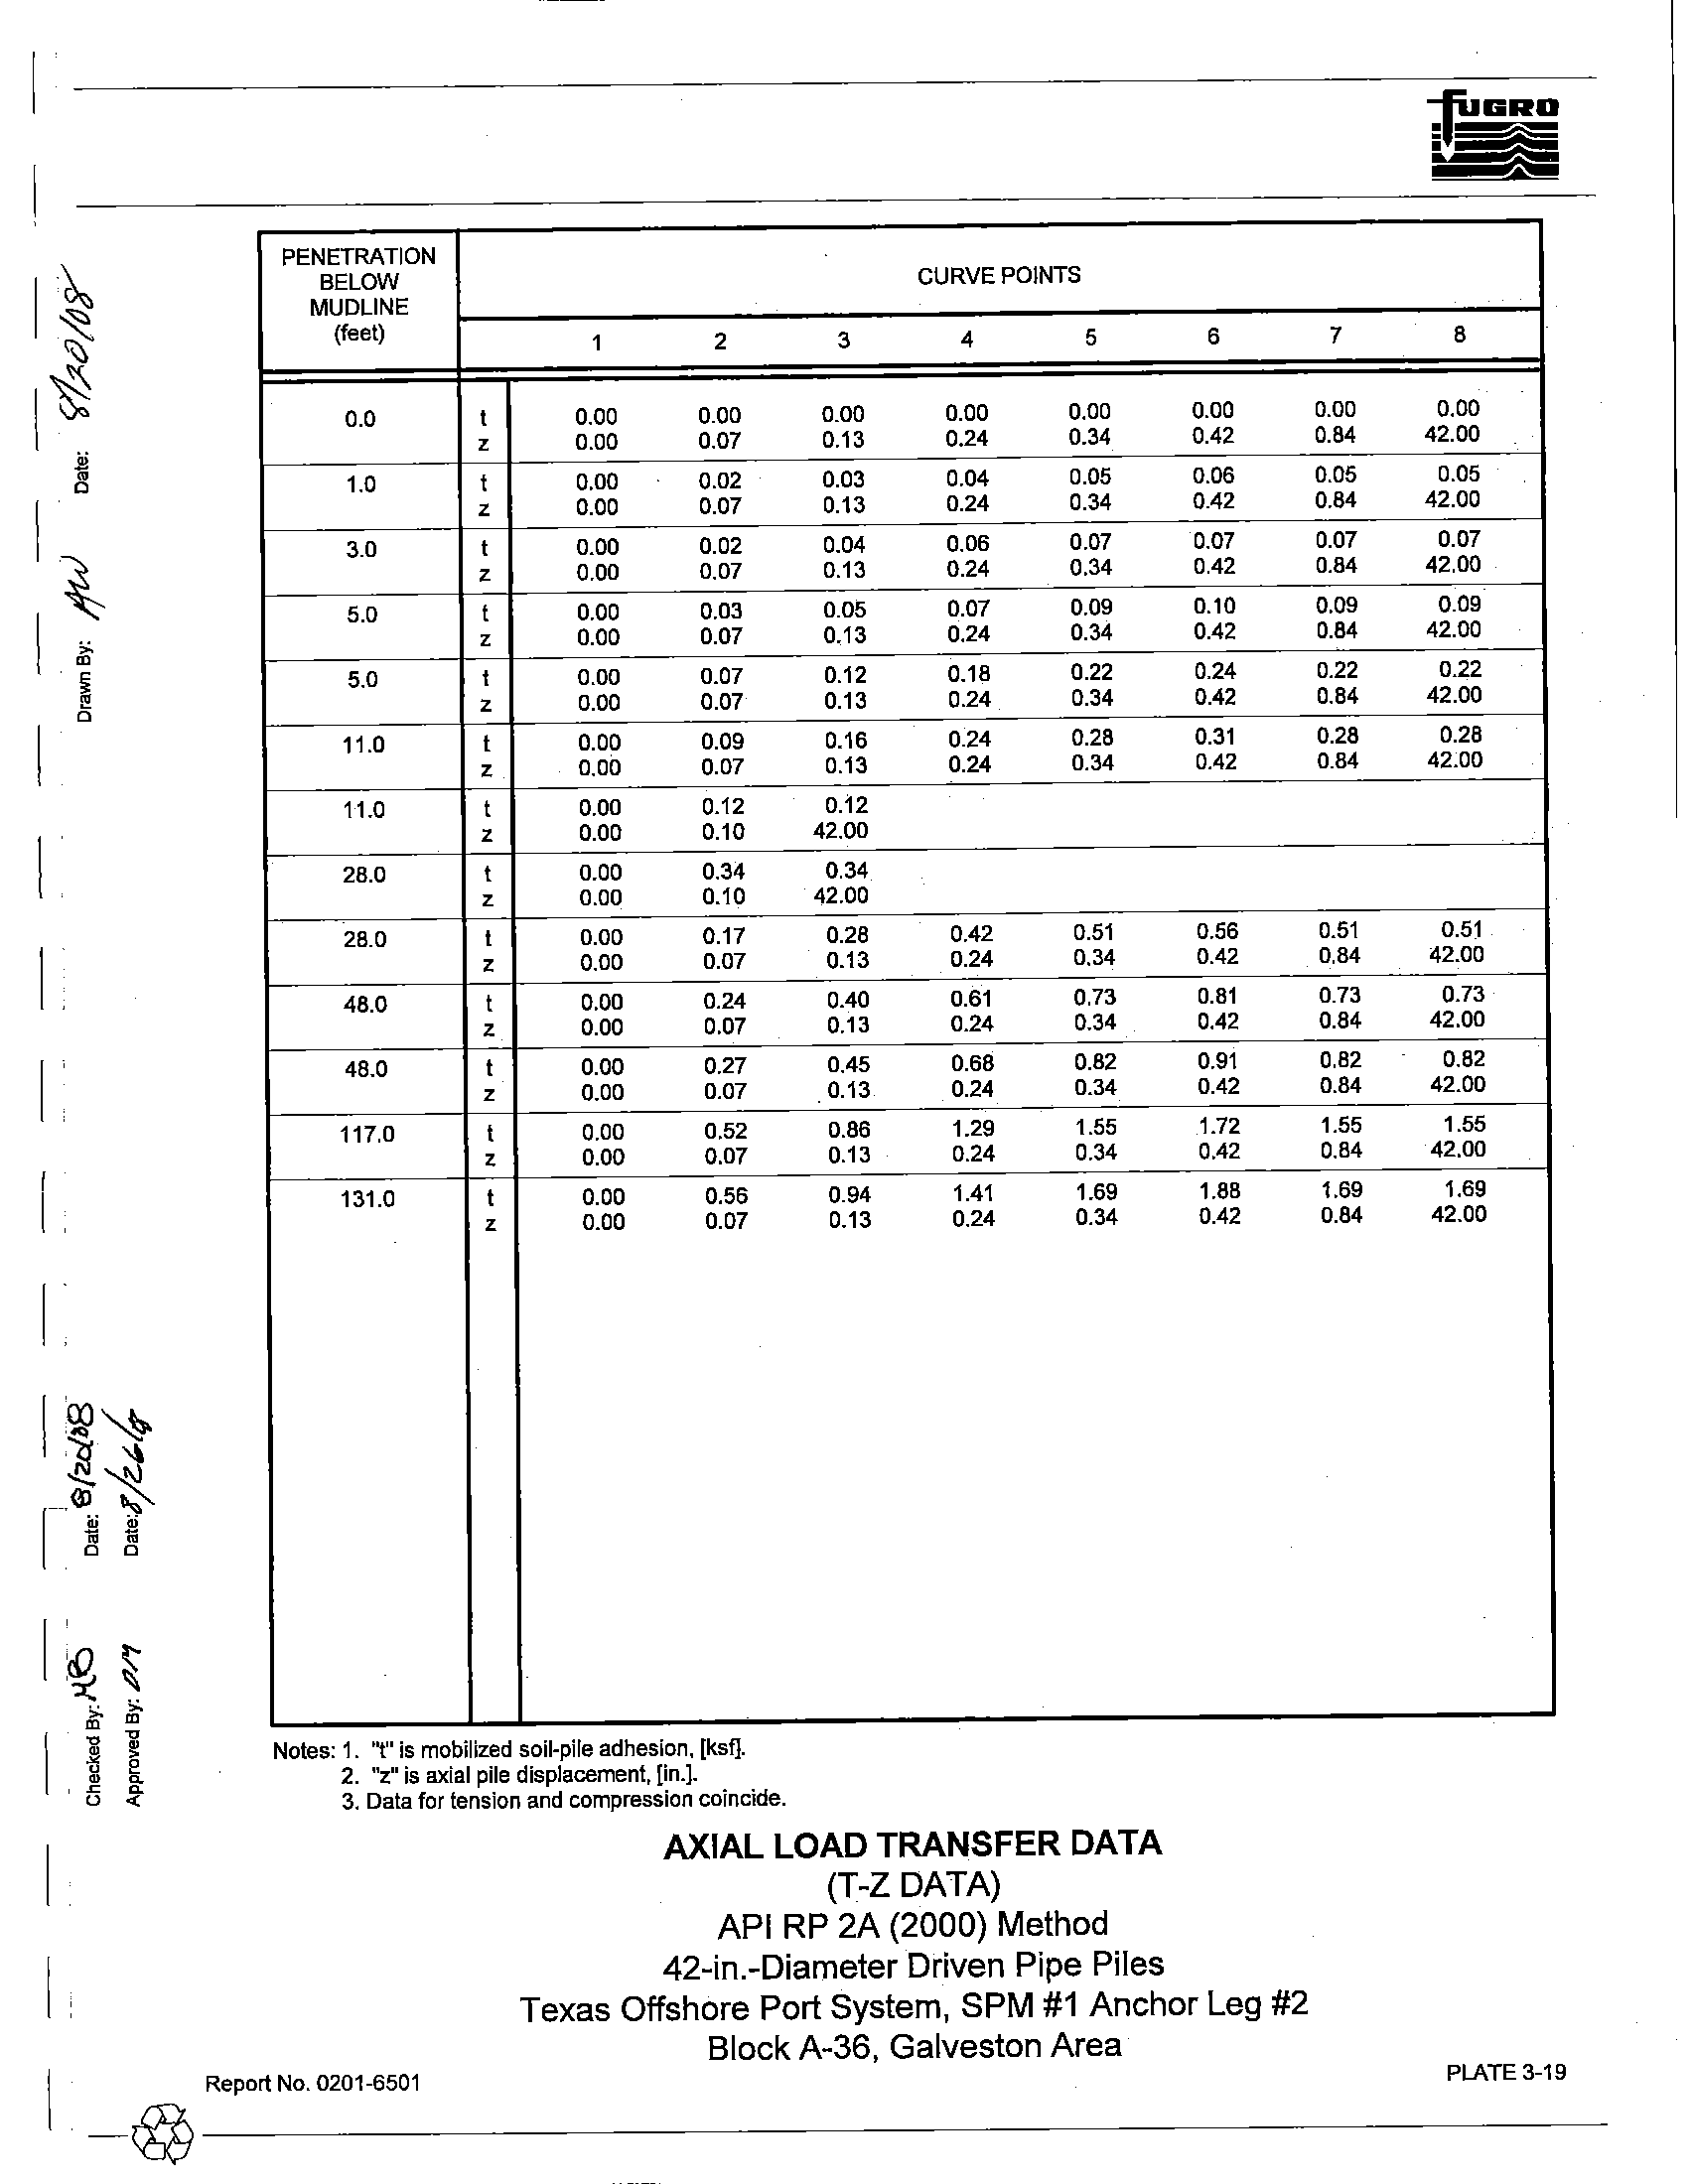
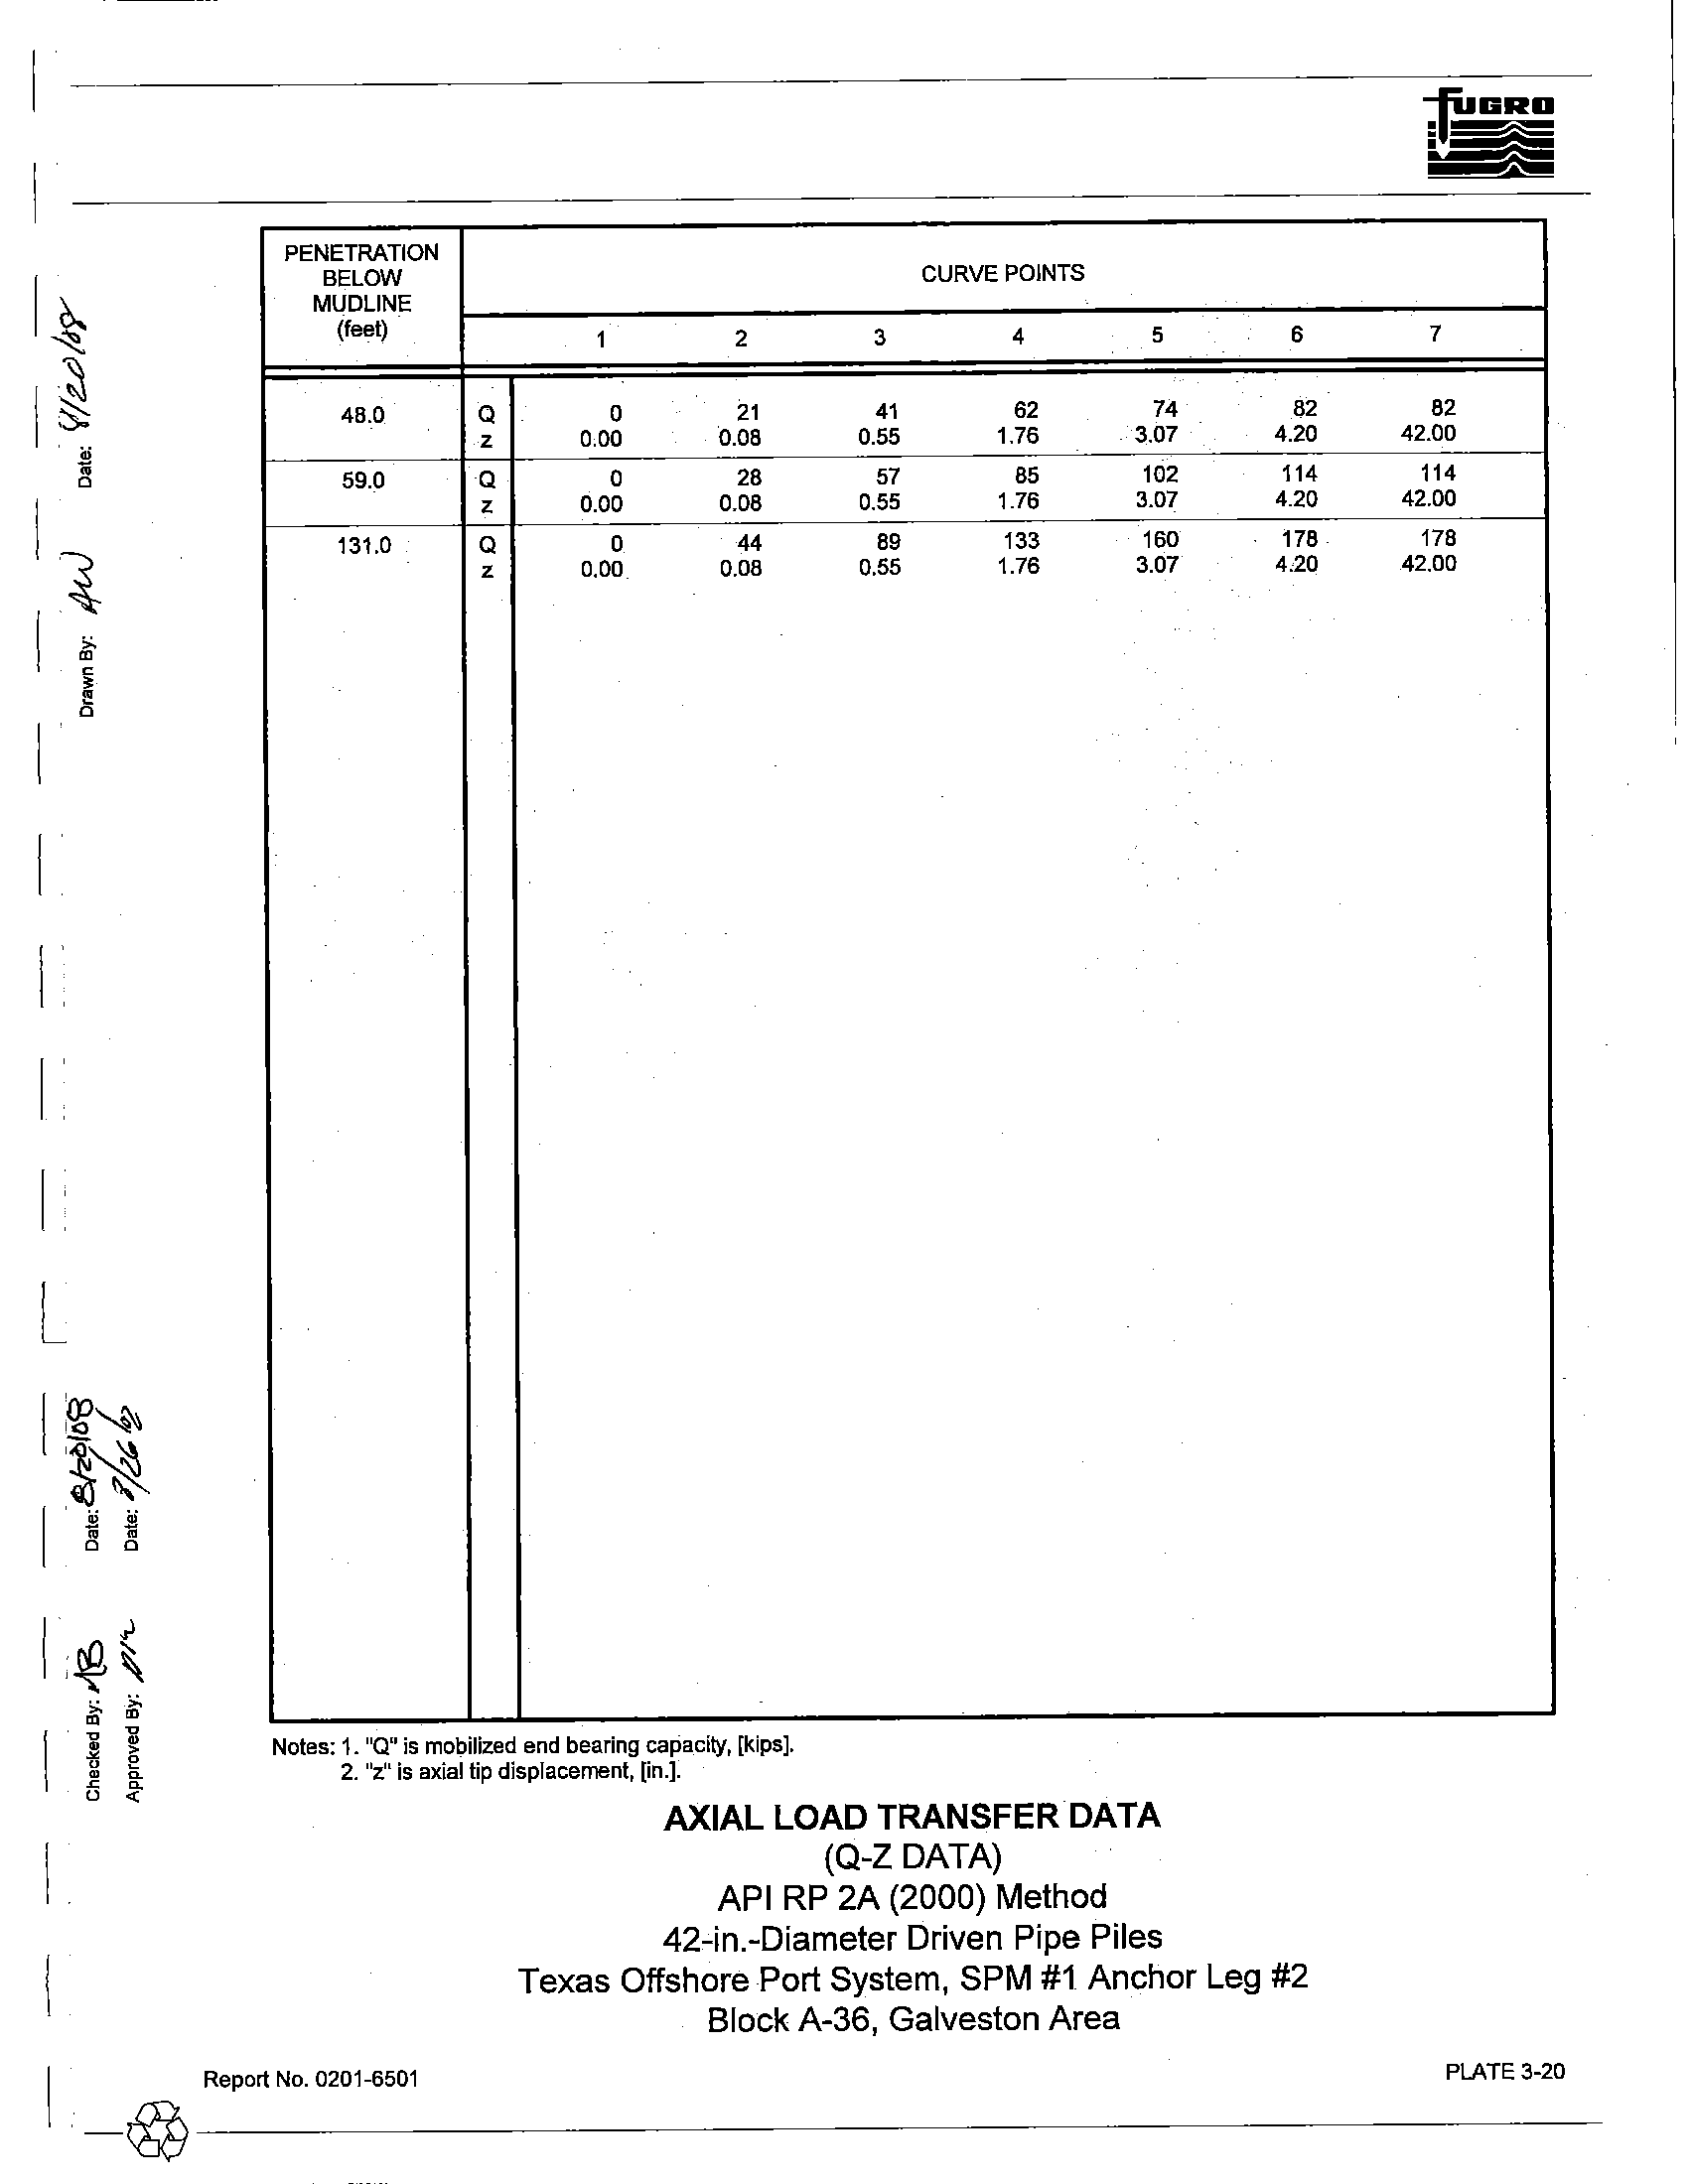
Axial Load Transfer Data.
Axial load-pile movement analyses are usually performed using a
computer solution based on methods developed
by Reese (1964) or Matlock, et al. (1976). Plates 3-19 and
3-20 present the results as side load-side movement (t-z) and tip load-tip movement (Q-z) data for 42-in.-
diameter driven pipe piles, respectively. The Q-z data should
be used for foundation piles and neglected for
caissons and conductor design.
In developing the axial load transfer data in the cohesive soils, a post-peak
adhesion ratio of 0.90 was utilized.
3.2.3.2 Lateral Pile Design Data
The soil resistance-pile deflection (p-y) characteristics of the soils at the boring location were
developed for individual 42-in.-diameter driven pipe piles. These data may
be used in lateral load analyses
of driven piles, conductors and caissons.
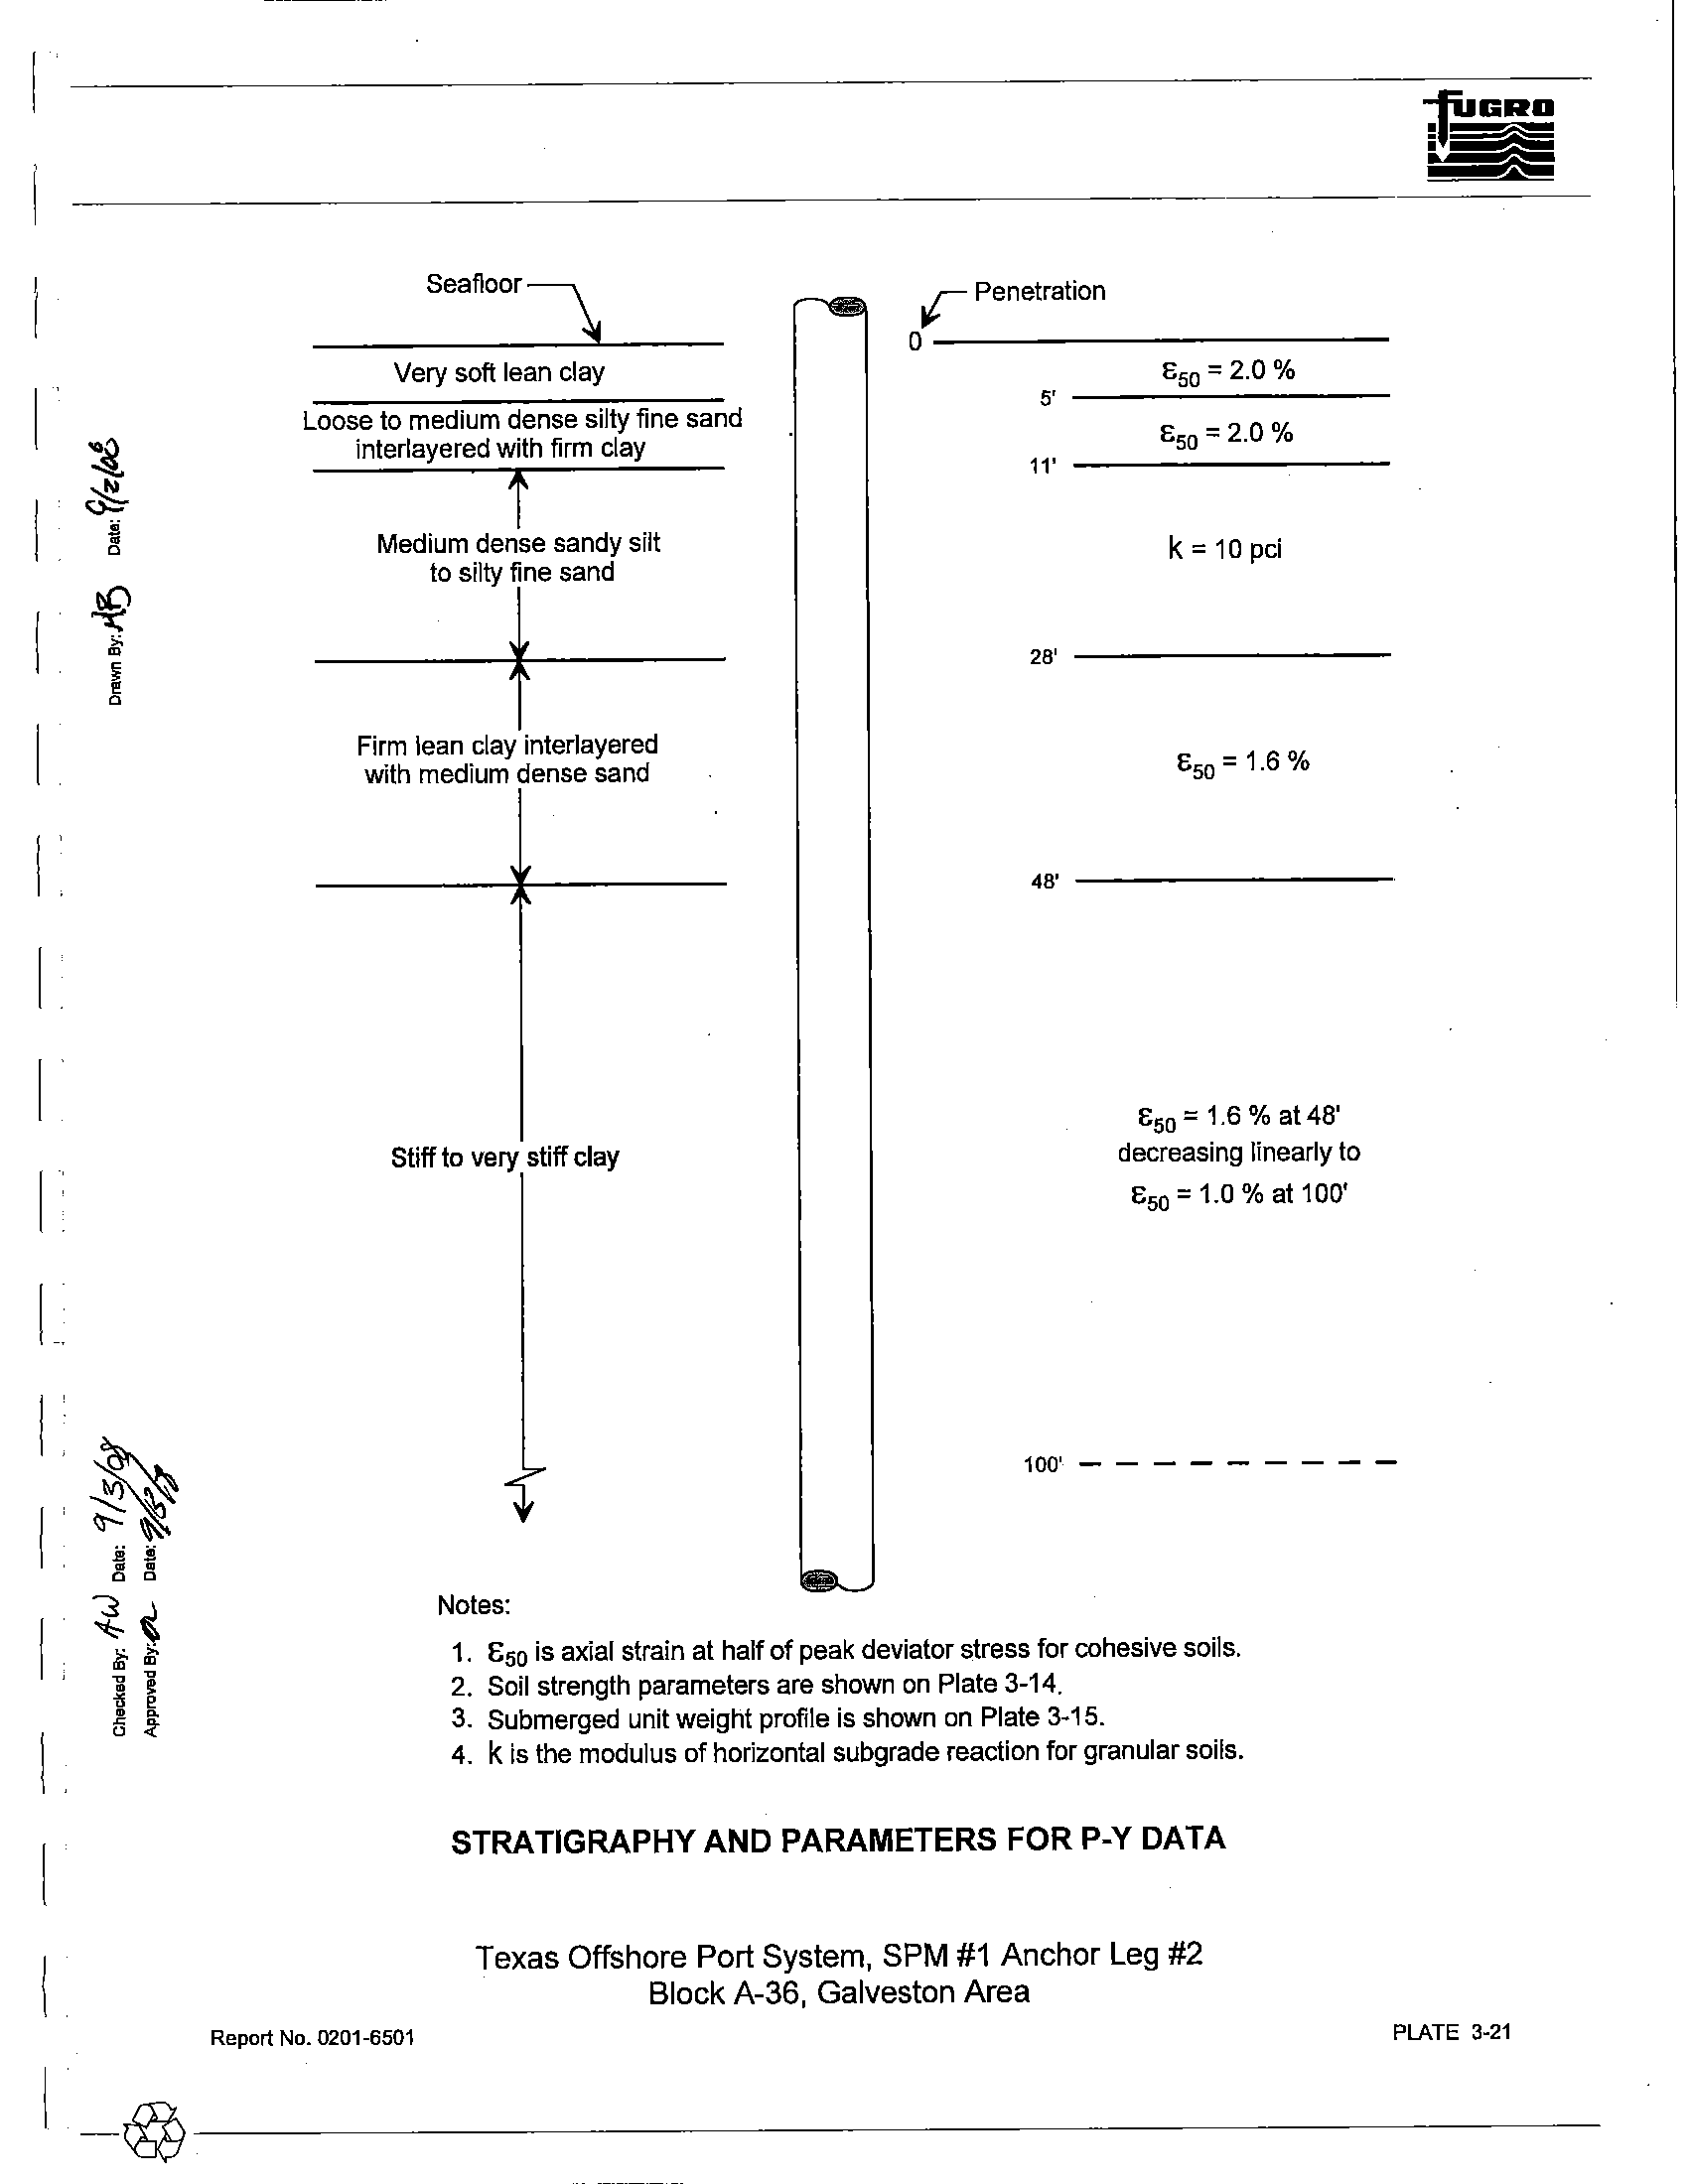
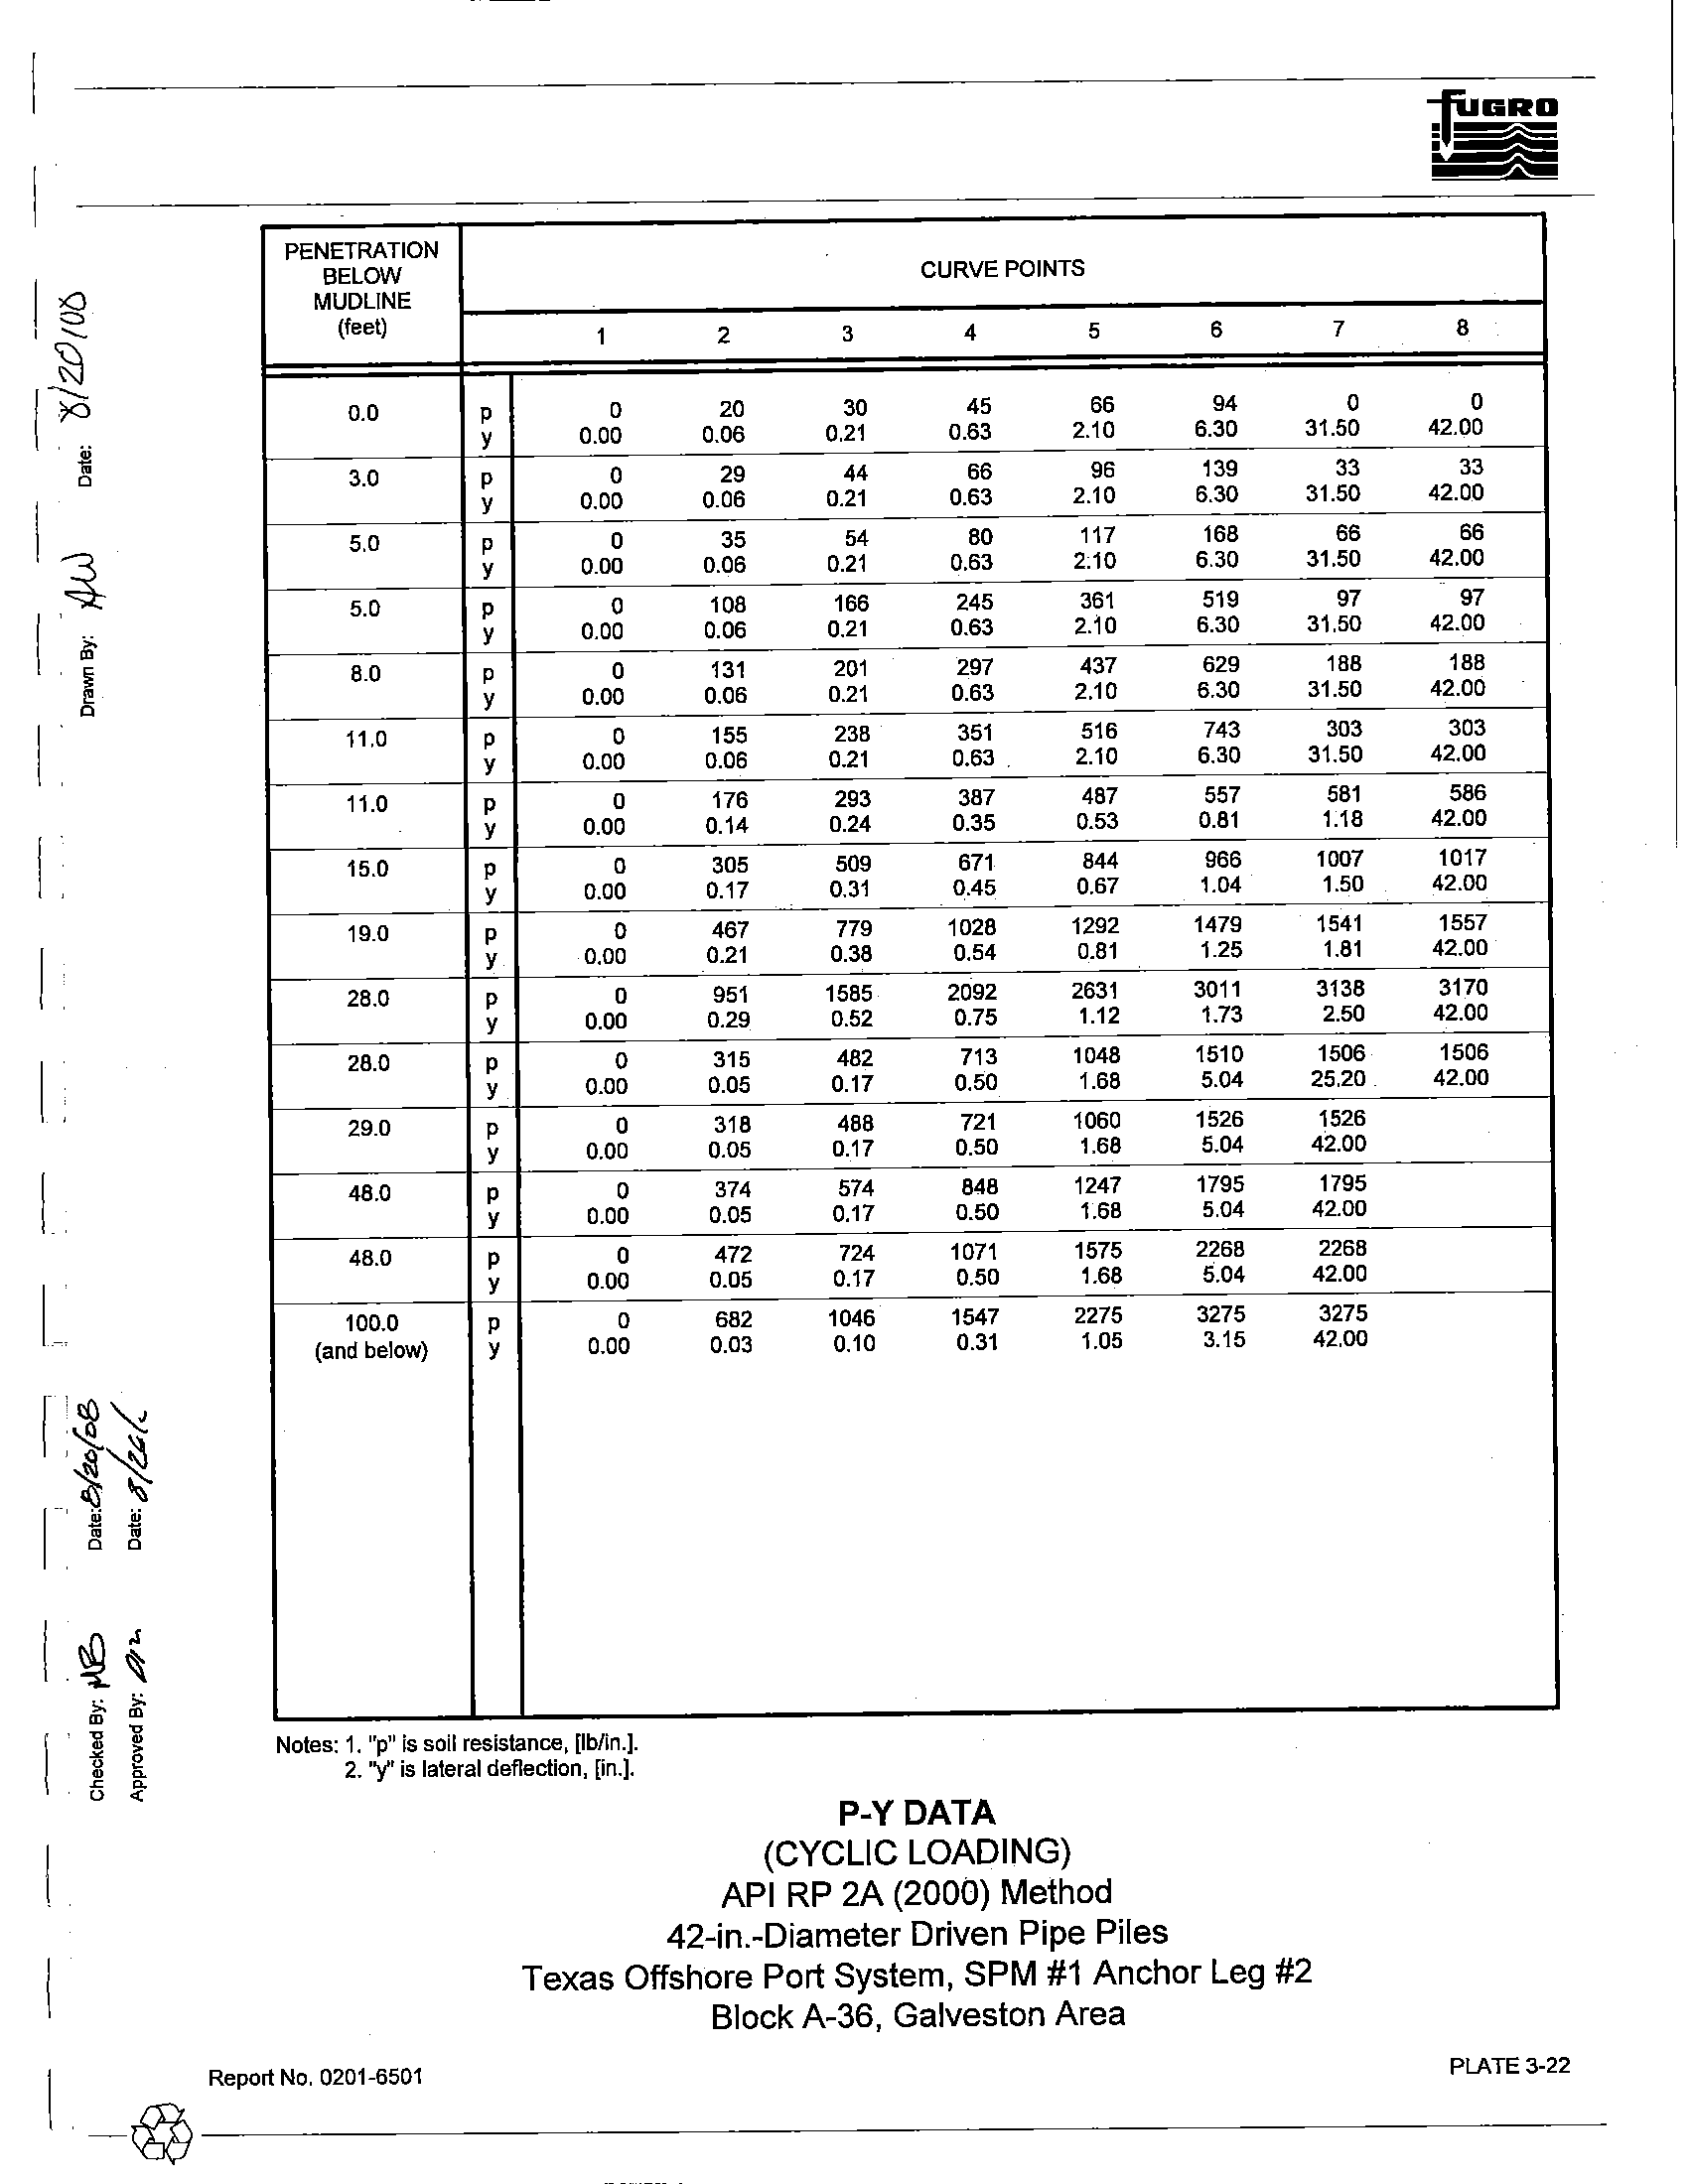
The p-y data for cyclic loading were developed to
100-1t
penetration using procedures that have been outlined in API RP 2A and briefly explained in Appendix B.
The stratigraphy and parameters used to develop the p-y data are presented on Plate 3-21. The p-y data
for 42-in.-diameter driven pipe piles are presented
on Plate 3-22. P-y values presented at 100-1t penetration
may
be used for lateral load analyses at greater depths.
I __
~
_____
R_e_po_rt_N_O_._02_0_1-_6_50_1___________________________________________________________3_-_5______
I
@
;u
ro
"C
Q
"-
Z
~
o
'"
m
'"
o
~
~
.:
o
'iii
Q)
(J)
Qj
~
III
o
c
~
ru
c
Q)
D..
"1J
~
~
'"
~
x=3,275,180'
y",
264,853'
Checked
By:
J.b
Approved By: 47A..
Oat" 1/t/O'e>
Daterl.lfo
BLOW
COUNT
IDENTIFICATION TESTS,
[%J
20
40
60
Texas South Central Zone Coordinates
SUBMERGED UNIT WEIGHT, [kcfl
80
SEAFLOOR AT EL. - 113'
0.03
0.04
0.06
o
VERY SOFT OLIVE GRAY LEAN CLAY
WOH
+
I~
10
20
!-J!i
30 I-
%'
(5.0')
WOH
...I..-
LOOSE TO MEDIUM DENSE GRAY
SILTY FINE SAND INTERLAYERED
WITH FIRM TO STIFF OLIVE GRAY
11.0'
CLAY
MEDIUM DENSE
GRAY SANDY SILT TO
SILTY FINE
SAND
I
Note:
See PLATE 3.12b for detailed soil I
stratigraphy 10 40-ft penetration
J
(28.0')
10
5
10
15
20
10
PUSH
10
+-1------41
•
•
•
*--te
++--..,
-+
o
o
•
o
III
IW
•
o
•
Drawn By:
~
UNDRAINED SHEAR STRENGTH
[kstl
1.5
1.0
1.5
1>
$~
+
$$
Strength exceeds capacity
of measuring device.
Date.
'l1:uQJ-"
~.O
o
10
20
30
I
IV
40
I-
~
FIRM GRAY LEAN ClAY INTEru.f-\,Tt:.1
WITH MEDIUM DENSE SAND
15
II
II. I
01
II
0].
]$$
I
40
50
~
-with sand partings at 43'
-olive gray sand layer, with silt below
44'
1-1
STIFF TO VERY STIFF GRAY CLAY
-lean, with a few sand pockets, light gray
pockets of organic matter to
60'
-olive gray to
50'
60
I-
~
r=
-with silt pockets and partings,
63'
to
9B'
-with light gray bands and a few silt layers at
64'
-with a few light gray bands,
66' \0 9B'
-lean at 67'
70
I-
~
-with a few pockets of organic matter at
77'
80
I-
90 f-y
~
-platyatBT
.1
-with gas blisters, 96' 10
1
DB'
-with silt partings and seams at
97'
100
I-~
1101-
120
I-
130~
140
I-
150 I-
160
I-
170
I-
180
I-
190
I-
•
-platy, with a few calcareous
nodu!e~,
106'
to
11 S'
~
-expansive at
116'
?-
-brown and lean, with a few shell fragments at 126'
-olive gray and platy, mottled with brown, with gas
blisters, a
few sill pockets, partings and seams am
pocketsoforganicmatterat~ ~13m
30/1B"
•
•
o
20
----
--.UJL
PUSH
+1---+
DO
PUSH
r
PUSH
+-~-t-D.t-¢
0
+-j---e-
]0
PUSH
PUSH
•
•
o
PUSH
*___
-ej..-n++
PUSH
.0 10
PUSH
Ij- ____
~
__
fl+-+
PUSH
'Ii
0
PUSH
++-----
PUSH
I--- -+-
o
--":.
-.A
iC
$.
.®
,$
A
~
•
$$
®
f"
...t
®,j
•
IA
.$
.0\1
$
®
•
A
$.
...
®
•
-
...,..-"
I
00
I
I
/-__
.1-
1-;::-:::;I~;;::::::-:::::::7~~~-~.I----I ~
__-L__
~:;::::~::::;::=
__
.l-_-j
2
I,
SAMPUNGTECHNIQUES
CLASSIFICATION TESTS
STRENGTH TESTS
I
Number of blows ofa 175-lb weight (hammer) dropped approximately 5 ftto
produ~e
a
T
SOLUBILITY IN HCL,
[%J
18 POCKET PENETROMETER (PP)
maximum of 24 in. of penetration of a 2.2S-ii'l.-OD, 2.12S-in.-ID thin-walled lUbe
•
PERCENT PASSING -200 SIEVE,
[%]
<$
TORVANE (TV)
samplar. "PUSH" denotes a 3.DO-in.-OD, 2.83-in.-ID thin-walled tube sampler was
•
WATER CONTENT ryv),
['!oj
<D
REMOTE
VANE (RV)
advanced 24 in. with the weighl of the drill string. 'WOH" denotes a 2.S0-ln.-OD,
0
SUBMERGED UNIT WEIGHT (SUW)
•
MINIATURE VANE (MV)
(~
RESIDUAL (MVres) VALUE)
212S-in.-ID liner sampler was advanced 24 in. with the weighloflhe hammer
.. UNCONSOUDATED UNDRAINED TRIAXIAL (UU)
PLASTIC LIMIT (PL)
+---------
UQUID LIMIT (LL)
+
LOG OF BORING AND TEST RESULTS
Texas Offshore Port System, SPM #1 Anchor Leg #2
Block A-36, Galveston Area
(Open symbols
50
60
70
80
90
;
100
j
110
120
130
140
150
160
170
180
190
200
,
.g
~
1
i
I
~
;0
~
"C
0
""
z
?
0
N
a,
:l
<.n
:l
"U
m
~
'!:.
N
C"
0
5
10
'as
~
~-
15
0
0
'jij
Q)
(/)
..Q
;=
20
Q)
tIl
.:::
0
:;::;
'"
25
~
Qj
.:::
Q)
a..
30
35
40
npprove... u)',-
iP
t..-
DatJ':>rt.p1
If--
Dab;-
"/~
(...:
X'" 3,275,180'
IDENTIFICATION TESTS,
[%]
Y =264,853'
BLOW
20
40
60
80
COUNT
SUBMERGED UNIT WEIGHT, [kcfJ I
Texas South Central Zone Coordinates
SEAFLOOR
AT
EL
~
113'
0.03
0.04
J
VERY SOFT OLIVE GRAY LEAN CLAY
WOH
0
0.05
0.06
.with sand pockets and a
few
shell fragments
+-
-----t
11-.
I
]
~mottled
with brownIsh yellow at 3'
15.01
WOH
%
-I-
-.
LOOSE TO MEDIUM DENSE GRAY SILTY
FINE SAND INTERLAYERED WITH FIRM
TO
STIFF OLIVE GRAY CLAY
10
-~---tI
0
((
-with clay partings to
7'
+
,"""--I-
-brownish yellow at
7'
f-
-mottled
with
brownish yellow, with sand POC
F
5
-
.. ,
hand partings
at
8'
11.0'
•
0
.
•Iean below 9'
MEDIUM DENSE GRAY SANDY SILT TO
SILTY FINE SAND
10
•
0
-with,many shells and shell fragments to 14'
-
-with
a few
shell fragments al16'
15
•
•
0
...
III': :
-with
a
few clay pockets and pockets of organic
20
matter
at 19'
-
..
.....
-with a few shell fragments at 24'
10
-.;
-
...
FIRM GRAY LEAN CLAY INTERLAYERED
128.0'
PUSH
0
WITH MEDIUM DENSE SAND
1
--Ie
•
-
-with sand pock,ets to 29'
IV
~
-w;,h
a
few
shellhgrn.nis
"34'
10
0
-
[I
-
15
•
0
SAMPLING TECHNIQUES
CLASSIFICATION TESTS
Number of blows of a 175-lb weight (hammer) dropped approXimately 5 'It
to
produce a
T
SOLUBILITY IN Hel,
['*']
maximum of24 in. of penetration or a 2.25-in...QD, 2.125-1n.-10 thin-walled tube
•
PERCENT PASSING -200 SIEVE,
[%]
sampler. "PUSH" denotes a 3.00-in.-oD. 2.B3-in._ID thin-walled tube sampler was
•
WATER CONTENT'(W),
[%]
advanced 24 In. with !he we,ighl of the drill string. 'WOW denoles a 2.5O-In.-oO.
o
SUBMERGED UNIT WEIGHT (SUW)
2.125-1n.-10 liner sampler waS advanced 24 In.
with
the Weight of !he hammer.
PLASTIC LIMIT (PL)
LIQUID LIMIT (LLl
+---------~--------~-~~+
LOG OF BORING AND TEST RESULTS
Texas Offshore Port System,SPM#1 Anchor Leg #2
Block A-36, Galveston Area.
6
UNDRAINED SHEAR STRENGTH
I
Iksf]
0.3
0.6
D••
1.2
o
tf
". •
5
0
$
•
(1.5
,1O.0)~
'"
10
.
,.,.
~
'"
15
.:
.g
0
'"
Q)
(/)
+
Strength exceeds capacity
of measuring devIce.
20
;=
..Q
Q)
tIl
.:::
~
25
'"
~
-
Q)
.:::
a..
Q)
30
$
35
0
$
STRENGTH TESTS
40
o
POCKET PENETROMETER (PP)
•
TORVANE
(TV)
4>
REMOTE VANE (RY)
•
MINIATURE VANE (MY)
(-e-
RESIOUAl(MVreslVAlUE)
.&. UNCONSOLIDATED UNDRAINED TRIAXIAL (UU)
(Open symbols indicate remolded (I') tests)
\'
.
!
"
~
I
\
w
.----------------------+
~UN\T?U
UIllliDUMITtu.)
Report No. 0201-6501
-.
-.
••_ .._ ...bllf
_I0Il ..._ ...............
...........
•..
-
....
............_-
..".
,..
..
GEOPHYSICAL AND GEOTECHNICAL INTEGRATION
Texas Offshore Port System, SPM #1 Anchor Leg #2
Block A-36, Galveston Area
E
3000
3500
PLATE 3-13
-~--------------------------~--------------------------------~-------------------
I
!;J'
Q)
~
..:
I
0
0
t;::
!II
Q)
(f)
:;:
0
Qi
to
I
c
0
:;:;
-
...
!II
Q)
L
c
Q)
0..
~~
11
u:J
~
, iii
0;
"
"
0
0
I,~
J
\
>.
>.
m
m
~
•
~
•
~
•
u
~
. t3
~
'"
Shear Strength Profile, [ksf]
o
0.0
r-I
0.5
1.0
1.5
2.0
2.5
20
40
60
80
100
120
140
I
-~-=
----
---'-
---
II
r---'-
----
---'-
---
~?n'
"=
1~'
N. _
A n L
- 1
n ••
f
In of
1---_.-
--\-
--_.-
---'-
--_.-
IV
1---_.-
---
\
\--
---'-
---
\
V
Back to top
l
Note: Roman numerals refer to the stratigraphy as
I
described In the text and on the boring log.
\
------
------
------ ------
\.._----
DESIGN STRENGTH PARAMETERS
Texas Offshore Port System, SPM
#1 Anchor Leg #2
Block A-36, Galveston Area
I
Report No. 0201.6501
PLATE 3.14
-@----------------------
~
Q)
~
..:
0
0
'iii
Q)
rJ)
"iii
~
III
c
0
15
....
Q)
c..
Q)
I~~
~~
I
"
~ ~
"
.~
'"
>.
'"
~
~
•
•
~
>
u
e
•
~
.0
~
"
~
Submerged Unit Weight, [kcf]
o
0.00
o.~
O.~
0.00
0.08
0.10
20
40
60
80
100
.
120
140
I
----
1----
-
I
.-r-----.-
---
--_.-
\----
--
_.-
._--
"
'"
--_.-1----
---
r---.-
---
IV
----
1----
--
_.-
---
.
V
Nole: Roman numerals refer to the
stratigraphy as
I
described in the-text and on the bOring log.
\.
------------
--~-
------
-----
DESIGN SUBMERGED UNIT WEIGHT
Texas Offshore Port System, SPM
#1 Anchor Leg #2
Block A-36, Galveston Area
I
Report No. 0201.6501
-~---------------------------------
PLATE 3.15
!i:7
Q)
~
.:
0
0
<;::
(II
Q)
(/)
:::
0
Q)
[D
c
0
:;::;
(II
~
....
Q)
a.
c
Q)
I
()(J"-t
.'Z
~
[-
~~
"
•
0
0
[
~~
m
'"
m
'"
~
~
[
11
•
>
•
u
~
~
~
~
.0
'"
I
[
Unit Skin Friction, [ksf]
o
0.0
0.5
\ -'-
1.0
1.5
2.0
2.5
20
40
60
80
100
120
140
1----
---.-
;-'---'-
\
'~
1--.-----
--_.-
;-'----
\
-~\
.
\--
--_.-
---'-
---'-
1--\
-_.-
;-'----
\
1\
\
Notes:
1;
'Roman numerals refer to the stratigraphy as
described in the text arid on the boring tog.
2. Tension and compression curves coincide.
------------------
__
~i_
UNIT SKIN FRICTION
API
RP 2A (2000) Method
I
---
II
---
'"
---'-
IV
---'-
V
Back to top
-----
Texas Offshore Port System, SPM #1 Anchor Leg #2
Block A-36, Galveston Area
[ __
~_R_e_po_rt_N_O._02_0_1-_65_0_1
__________________________________________________
P_~
__
TE_3_-1_6___
[~
I
;i;
~
I
Unit End Bearing, [ksf)
o
o
I
5
10
15
20
If
g
..:
o
20
40
'iii'
60
Q)
en
Q)
~
III
§
80
~
Q)
c
'Q)
a.
100
120
140
\
--
---',-
1---'-
f-'--~
~-
--_.-
1--'-.-
"-
" 142-;n.I('
i'~
........
~
.,..--_.-
,-
1---"-,-
r
\
--_.-
r-
\
-,-
1---,-
\
Notes:
\
1. Roman numerals refer to the stratigraphy as
\
described in the text and on the boring log.
2. Dashed line represents equivalent unit end
-
bearing available from frictional resistance
of soil plug inside the indicated pile sIze.
3. End bearing component is neglected for
caissons and conductors.
------
------
------
---
--
UNIT END BEARING
API RP
2A (2000) Method
I
---
II
---
'"
---
IV
---
V
-----
Texas Offshore Port System, SPM #1 Anchor Leg #2
Block A-36, Galveston Area
25
I
_~_R_e_p_ort
__
NO_._O_20_1_~_5_01
______________________________________________________
~----P-LA--T-E-3--1-7---
I~
I~
l.l
o
I~
I
~
g
I
I
I
Ultimate Axial Capacity, [kips]
o
o
500
1000
1500
2000
2500
'af
~
.....
o
-
20
40
'Iii
60
Ql
(f)
~
Ql
m
580
~
1ii
c
Ql
0..
100
120
140
l----'--.-
1----
--_.-
I
f---.-
---
II
,.-_.-
1----
--.-'-
t---.-
---
,n
I \
\
,
--,--
1----
---.-
f--'--'--
---
\
\
IV
\
\
-""T
-
1----
---.-f---.-
--_.-
\
\
\
\
\
f\
Note: Roman numerals refer
to.
the stratigraphy as
\
described in the
text
and <?n the boring log.
~
Compression for piles
-
-
Tension for plies, or tension and compression
for caissons and conductors
\\
V
\
"
'\
\
\
\
"\
"\
\
1------------
------'
\
~----
-----
ULTIMATE AXIAL CAPACITY
API
RP 2A (2000) Method
42-in.-Diameter Driven Pipe Piles
Texas Offshore Port System, SPM #1 Anchor Leg #2
Block A-36, Galveston Area
"
I
Report No. 0201-6501
-~---------------------------------
PLATE 3-18
.~
~
m
>.
m
'"
~
~
~
~
•
~
~
~
~
"
..
PENETRATION
BELOW
CURVE POINTS
MUDLINE
(feel)
1
2
3
4
5
0.0
I
0.00
0.00
0.00
0.00
0.00
z
0.00
0.07
0.13
0.24
0.34
1.0
I
0.00
0.02
0.03
0.04
0.05
z
0.00
0.07
0.13
0.24
0.34
3.0
I
0.00
0.02
0.04
0.06
0.Q7
z
0.00
0.07
0.13
0.24
0.34
5.0
I
0.00
0.03
0.05
0.07
0.09
z
0.00
0.07
0.13
0.24
0.34
5.0
I
0.00
0.07
0.12
0.18
0.22
z
0.00
0.07
0.13
0.24
0.34
11.0
t
0.00
0.09
0.16
0.24
0.28
z
0.00
0.07
0.13
0.24
0.34
11.0
I
0.00
0.12
0.12
z
0.00
0.10
42.00
28.0
I
0.00
0.34
0.34
z
0.00
0.10
42.00
28.0
I
0.00
0.17
0.28
0.42
0.51
z
0.00
0.07
0.13
0.24
0.34
48.0
I
0.00
0.24
0.40
0.61
0.73
z
0.00
0.07
0.13
0.24
0.34
48.0
t
0.00
0.27
0.45
0.68
0.82
z
0.00
0.07
0.13
0.24
0.34
117.0
I
0.00
0.52
0.86
1.29
1.55
z
0.00
0.07
0.13
0.24
0.34
131.0
t
0.00
0.56
0.94
1.41
1.69
z
0.00
0.07
0.13
0.24
0.34
Notes: 1. ''til is mobilized sOil-pile adhesion. [ksf].
2.
liZ"
is axial pile displacement, [in.].
3. Data for tension and compression coincide.
AXIAL LOAD TRANSFER DATA
(T-Z
DATA)
API
RP 2A (2000) Method
42-in.-Diameter Driven Pipe Piles
6
0.00
0.42
0.06
0.42
0.07
0.42
0.10
0.42
0.24
0.42
0.31
0.42
0.56
0.42
0.81
0.42
0.91
0.42
1.72
0.42
1.88
0.42
Texas Offshore Port System, SPM #1 Anchor Leg #2
Block A-36, Galveston Area
7
8
0.00
0.00
0.84
42.00
0.05
0.05
.
0.84
42.00
0.07
0.07
0.84
42.00
0.09
0.09
0.84
42.00
0.22
0.22
0.84
42.00
0.28
0.28
0.84
42.00
0.51
0.51
0.84
42.00
0.73
0.73
0.84
42.00
0.82
0.82
0.84
42.00
1.55
1.55
0.84
42.00
1.69
1.69
0.84
42.00
PLATE 3-19
I
Report No.
0201-6501
-@----------------------
L
PENETRATION
BELOW
CURVE POINTS
MUDLINE
(feet)
1
2
3
4
5
6
48.0
Q
0
21
41
62
74
82
z
0.00
0.08
0.55
1.76
3.07
4.20
59.0
Q
0
28
57
85
102
114
z
0.00
0.08
0.55
1.76
3.07
4.20
131.0
Q
0
44
89
133
160
178
z
0.00
0.08
0.55
1.76
3.07
4,20
Notes: 1.
"Q"
is mobilized end bearing capacity, [kips].
2. "z" is axial tip displacement, [in.].
AXIAL LOAD
TRANSFER DATA
(Q-Z DATA)
API
RP 2A (2000) Method
42-in.-Diameter Driven Pipe Piles
Texas Offshore
Port System, SPM #1 Anchor Leg #2
Block A-36, Galveston Area
l_@
Report No.
0201-6501
7
82
42.00
114
42.00
178
42.00
PLATE 3-20
..
~
<>='
~
""
0
~
S€'
m
~
0
~
I
seafloor~
r
Penetration
0
Very soft lean clay
Eso = 2.0
%
Loose to medium dense silty fine sand
5'
interlayered with firm clay
Eso = 2.0
%
t
11'
Medium dense sandy silt
k=10pci
to silty fine sand
,
28'
Firm lean clay interlayered
Eso = 1.6
%
with medium dense sand
48' -------------------
Stiff to very stiff clay
ESO =
1.6
%
at
48'
decreasing linearly to
Eso = 1.0
%
at 100'
100' -
-
-
-
-
-
-
-
-
Report No. 0201-6501
Notes:
1.
Eso is axial strain at half of peak deviator stress for cohesive soils.
2. Soil strength parameters are shown on Plate 3-14.
3. Submerged unit weight profile is shown on Plate 3-15.
4. k is the modulus
of horizontal subgrade reaction for granular soils.
STRATIGRAPHY AND PARAMETERS FOR P-Y DATA
Texas Offshore Port System, SPM #1 Anchor Leg #2
Block A-36, Galveston Area
PLATE 3-21
I_@______________________
~
0
I~
I
~
0
~
I
~
..
I'l
~
I~
I
on
'"
;;
"
0
.s
~
on
"-
~
PENETRATION
BELOW
MUDLINE
(feet)
1
0.0
P
0
y
0.00
3.0
P
0
Y
0.00
5.0
P
0
Y
0.00
5.0
P
0
Y
0.00
8.0
P
0
Y
0.00
11.0
P
0
Y
0.00
11.0
P
0
.
Y
0.00
15.0
P
0
Y
0.00
19.0
P
0
Y
0.00
28.0
P
0
Y
0.00
28.0
P
0
Y
0.00
29.0
P
0
Y
0.00
48.0
P
0
Y
0.00
48.0
P
0
Y
0.00
100.0
P
0
(and below)
y
0.00
Notes: 1. lip" is soil resistance, [Ib/in.].
2.
'Y'
is lateral deflection, [in.].
CURVE POINTS
2
3
4
5
20
30
45
66
0.06
0.21
0.63
2.10
29
44
66
96
0.06
0.21
0.63
2.10
35
54
80
117
0.06
0.21
0.63
2:10
108
166
245
361
0.06
0.21
0.63
2.10
131
201
297
437
0.06
0.21
0.63
2.10
155
238
351
516
0.06
0.21
0.63 .
2.10
176
293
387
487
0.14
0.24
0.35
0.53
305
509
671
844
0.17
0.31
0.45
0.67
467
779
1028
1292
0.21
0.38
0.54
0.81
951
1585
2092
2631
0.29
0.52
0.75
1.12
315
482
713
1048
0.05
0.17
0.50
1.68
318
488
721
1060
0.05
0.17
0.50
1.68
374
574
848
1247
0.05
0.17
0.50
1.68
472
724
1071
1575
0.05
0.17
0.50
1.68
682
1046
1547
2275
0.03
0.10
0.31
1.05
P-YDATA
(CYCLIC LOADING)
API
RP 2A (2000) Method
42-in.-Diameter Driven Pipe Piles
6
94
6.30
139
6.30
168
6.30
519
6.30
629
6.30
743
6.30
557
0.81
966
1.04
1479
1.25
3011
1.73
1510
5.04
1526
5.04
1795
5.04
2268
5.04
3275
3.15
Texas Offshore Port System, SPM #1 Anchor Leg #2
Block A-36, Galveston Area
-1'0,
~
7
8
0
0
31.50
42.00
33
33
31.50
42.00
66
66
31.50
42.00
97
97
31.50
42.00
188
188
31.50
42.00
303
303
31.50
42.00
581
586
1.18
42.00
1007
1017
1.50
42.00
1541
1557
1.81
42.00
3138
3170
2.50
42.00
1506
1506
25.20.
42.00
1526
42.00
1795
42.00
2268
42.00
3275
42.00
PLATE 3-22
I
Report No. 0201-6501
.~@-----------
t
o
c
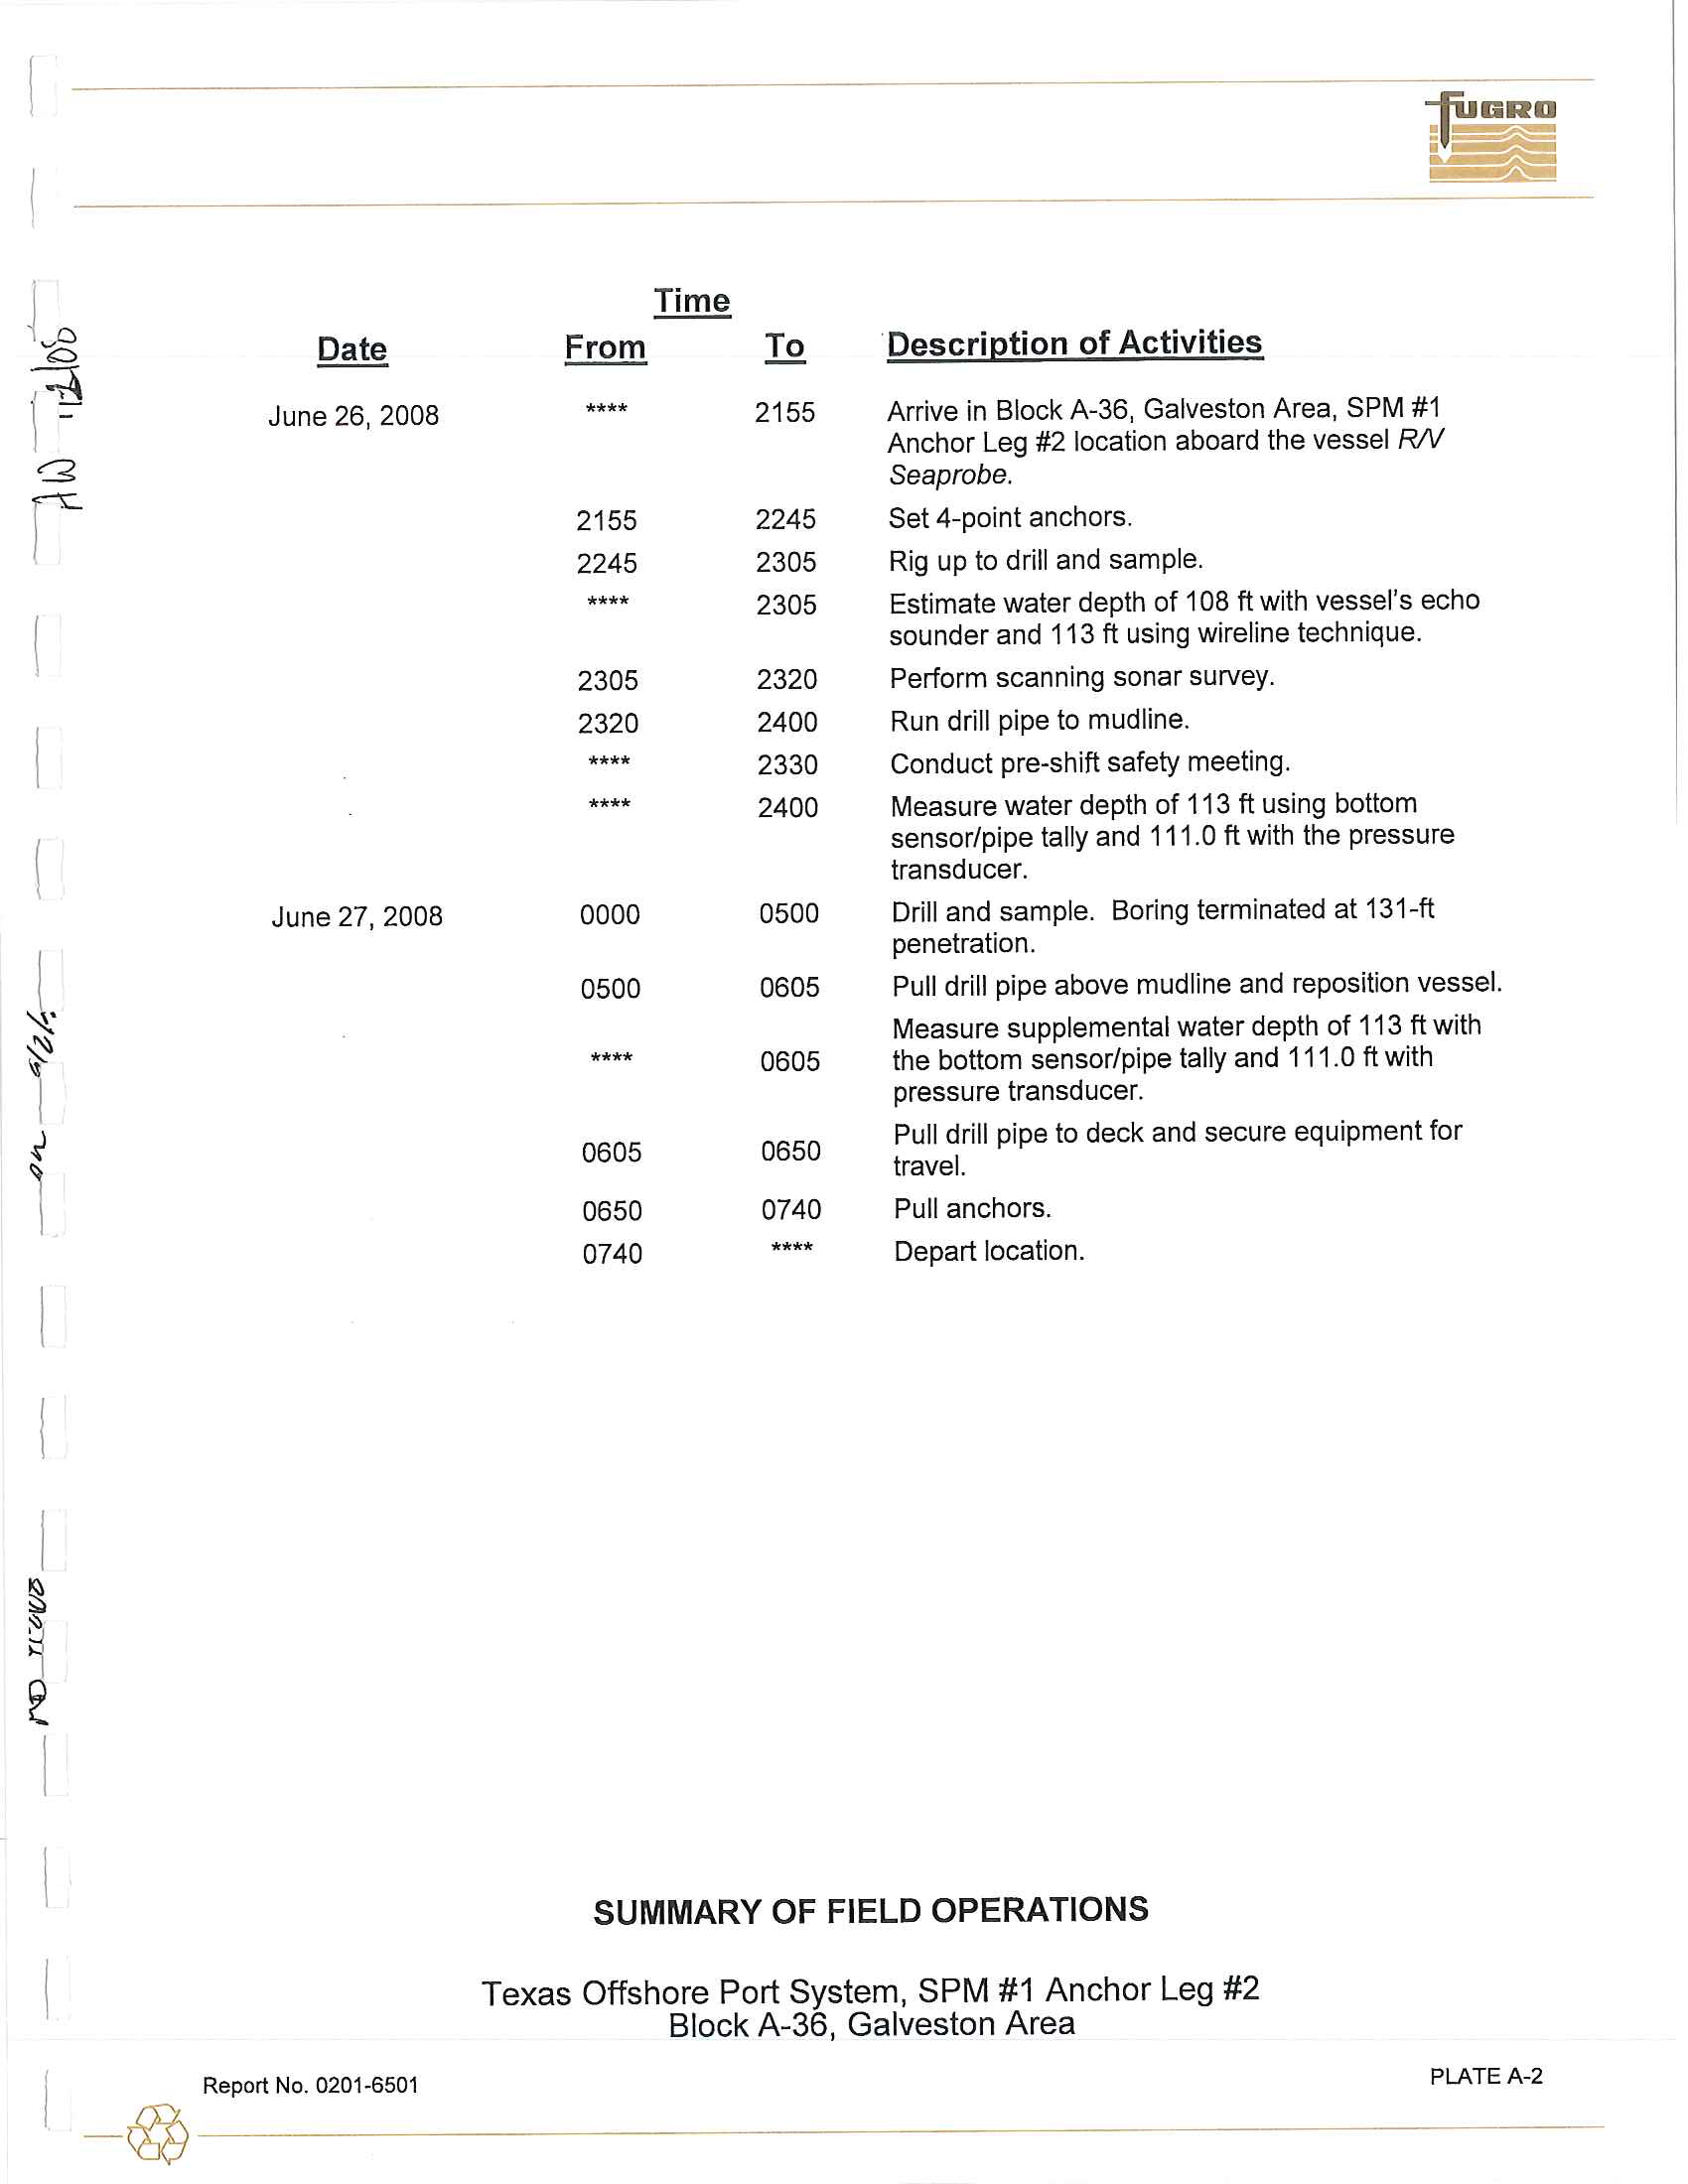
Date
r
June 26
,
2008
<3
r
June 27, 2008
~
~
~
I
<
Time
From
To
Description
of
Activities
"'***
2155
Arrive in Block A
-
36
,
Galveston Area, SPM #1
Anchor Leg
#2 location aboard
the
vessel
RN
Seaprobe.
2155
2245
Set 4-point anchors.
2245
2305
Rig up to
drill
and sample
.
*"'••
2305
Estimate
water depth of 108 ft with vessel's echo
sounder
and
113 ft using wireline
technique.
2305
2320
Perform
scanning sonar survey.
2320
2400
Run
drill
pipe
to mudline
.
****
2330
Conduct
pre-shift
safety
meeting.
****
2400
Measure water depth of 113
ft
using bottom
sensor/pipe tally and
111
.
0 ft w
i
th
the
pressure
transducer.
0000
0500
Drill and sample
.
Boring
terminated at 131-ft
penetrat
i
on
.
0500
0605
Pull
drill
pipe above mudline
and
reposit
i
on vessel.
Measure
supplemental water
depth
of
113 ft
with
****
0605
the
bottom
sensor/pipe tally and 111
.
0 ft with
pressure transducer.
0605
0650
Pull
drill
pipe
to
deck and secure equipment
for
travel.
0650
0740
Pull
anchors.
0740
****
Depart
location
.
SUMMARY
OF
FIELD
OPERATIONS
Texas Offshore Port System, SPM
#1 Anchor Leg
#2
Block A-36, Galveston Area
PLATEA-2
I
Rep
o
rt
No
.
0201-6501
-
@
----------------------
~
'0
,.
0
z
p
0
'"
s:
'"
s:
'"
"
~
m
'"
<'
_ •• __
•
•
_-
-J'
f{~
Approved By:
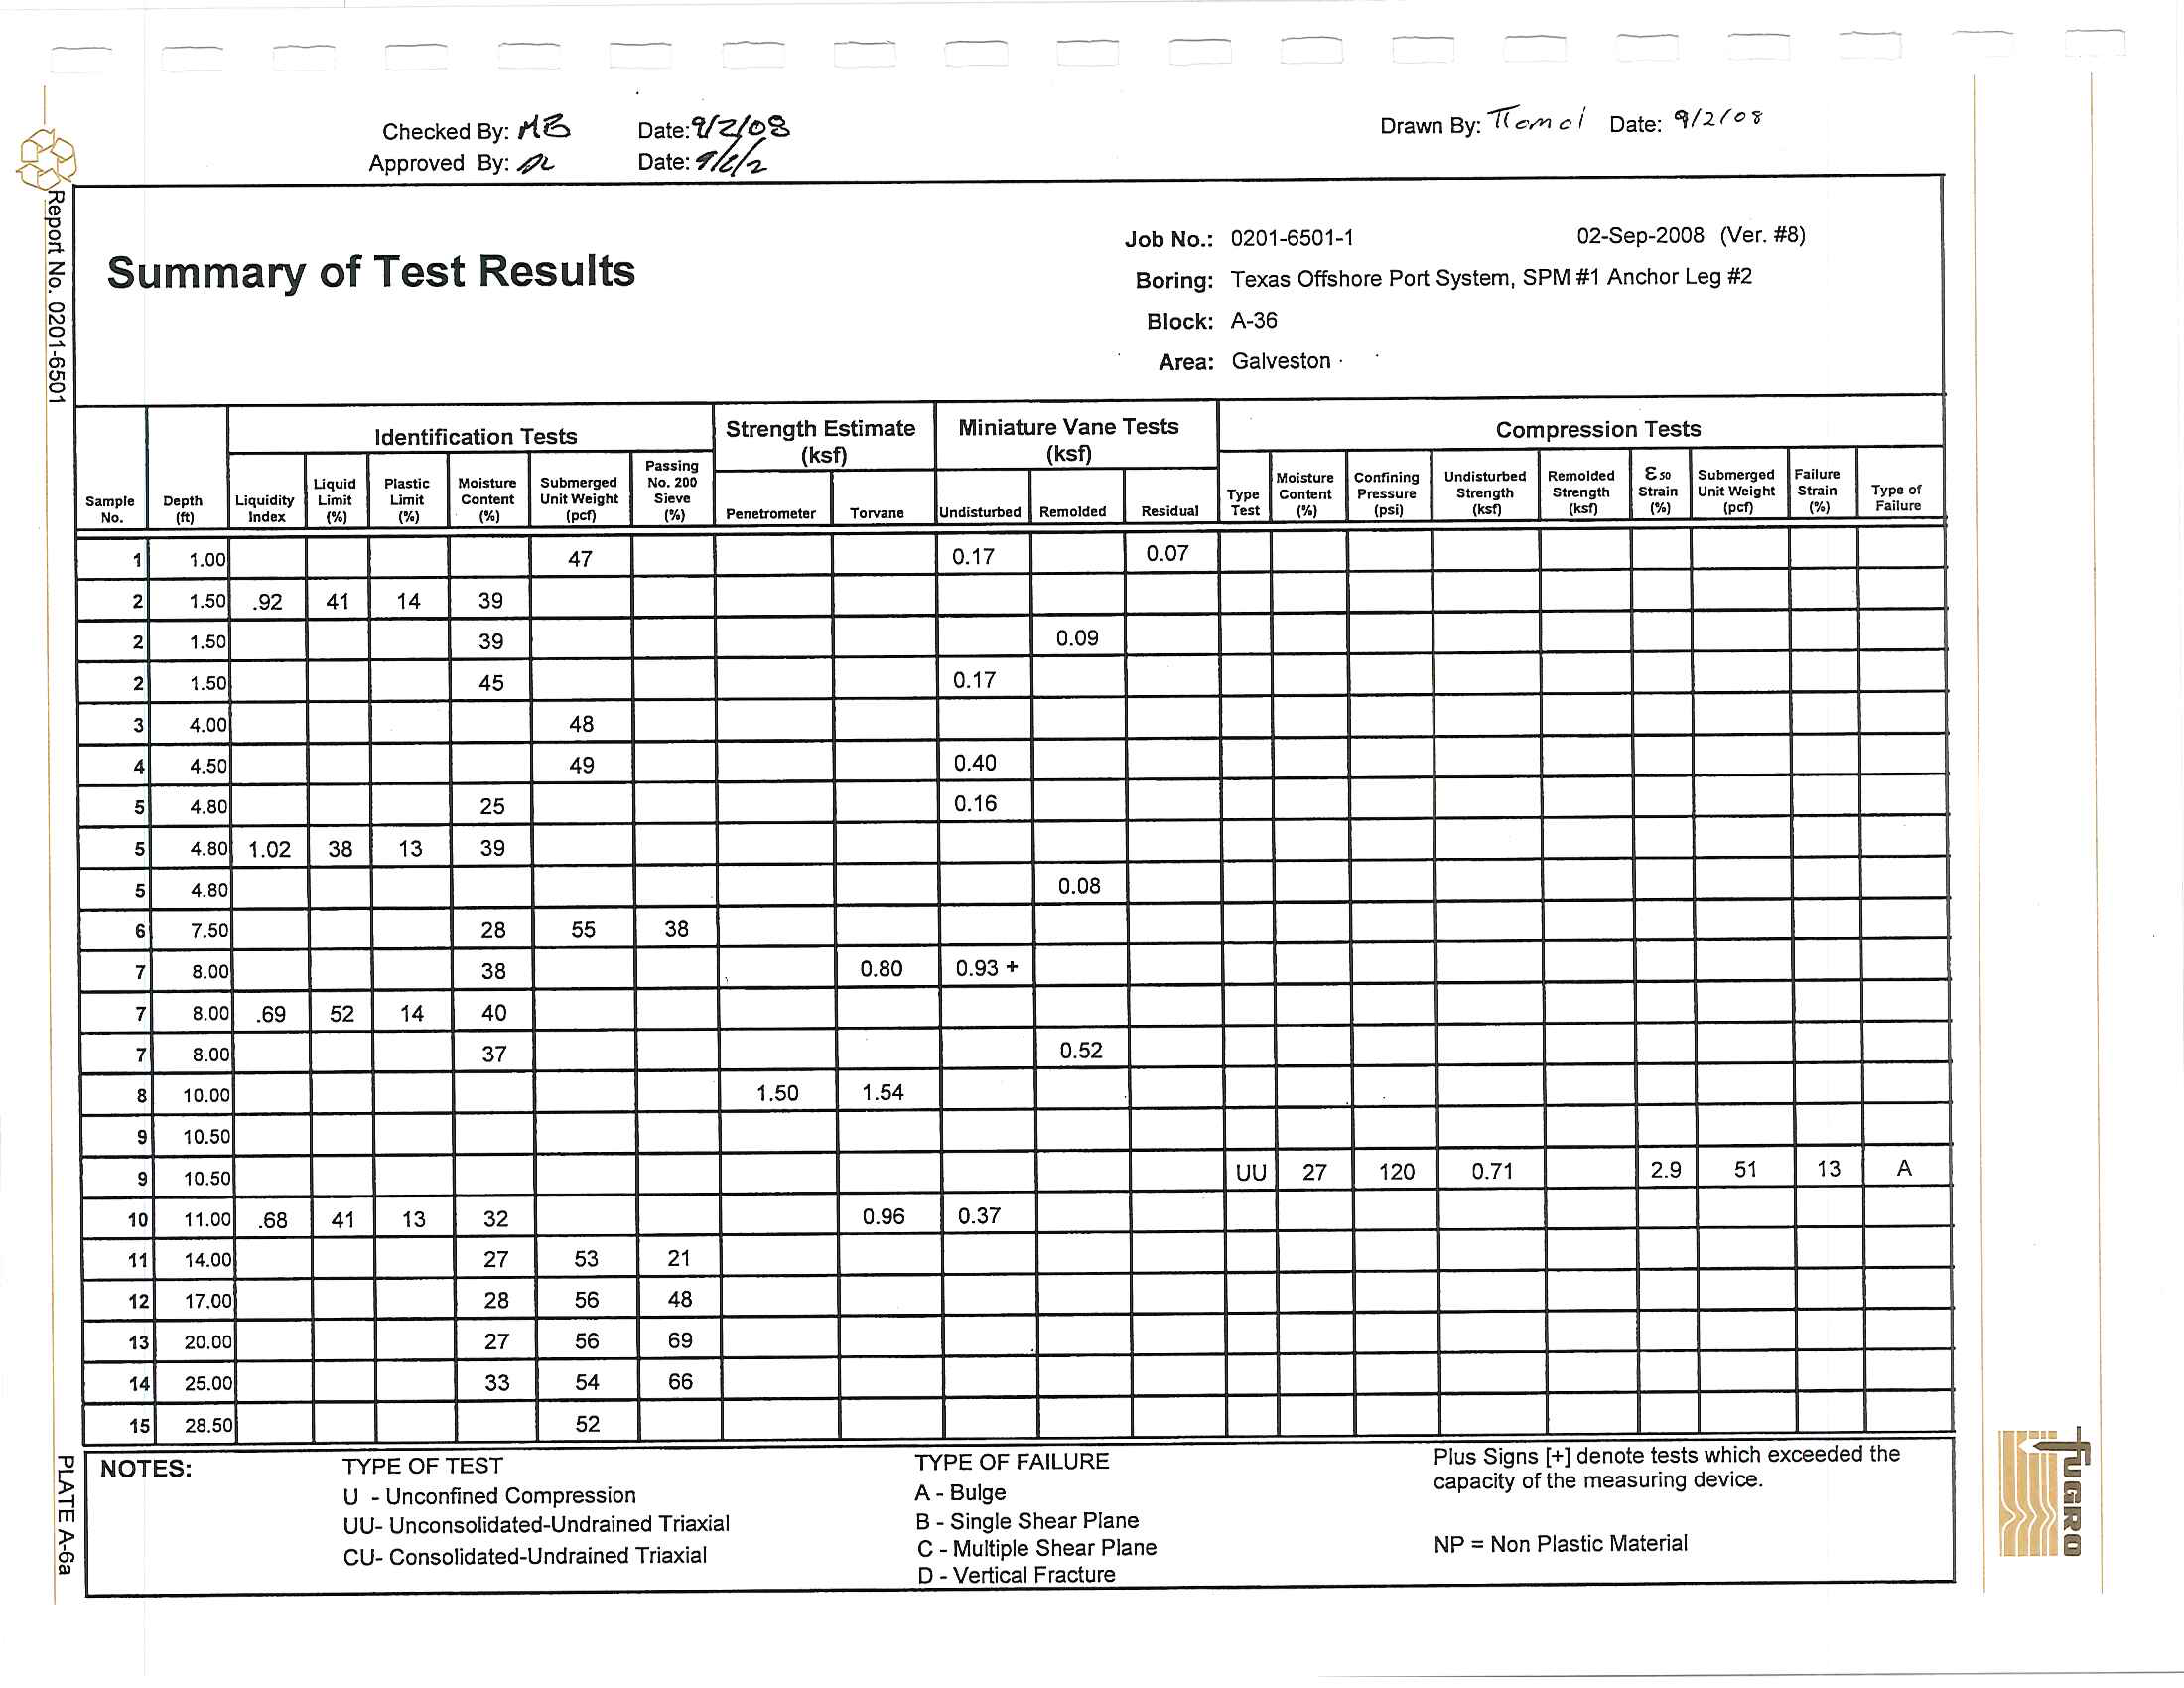
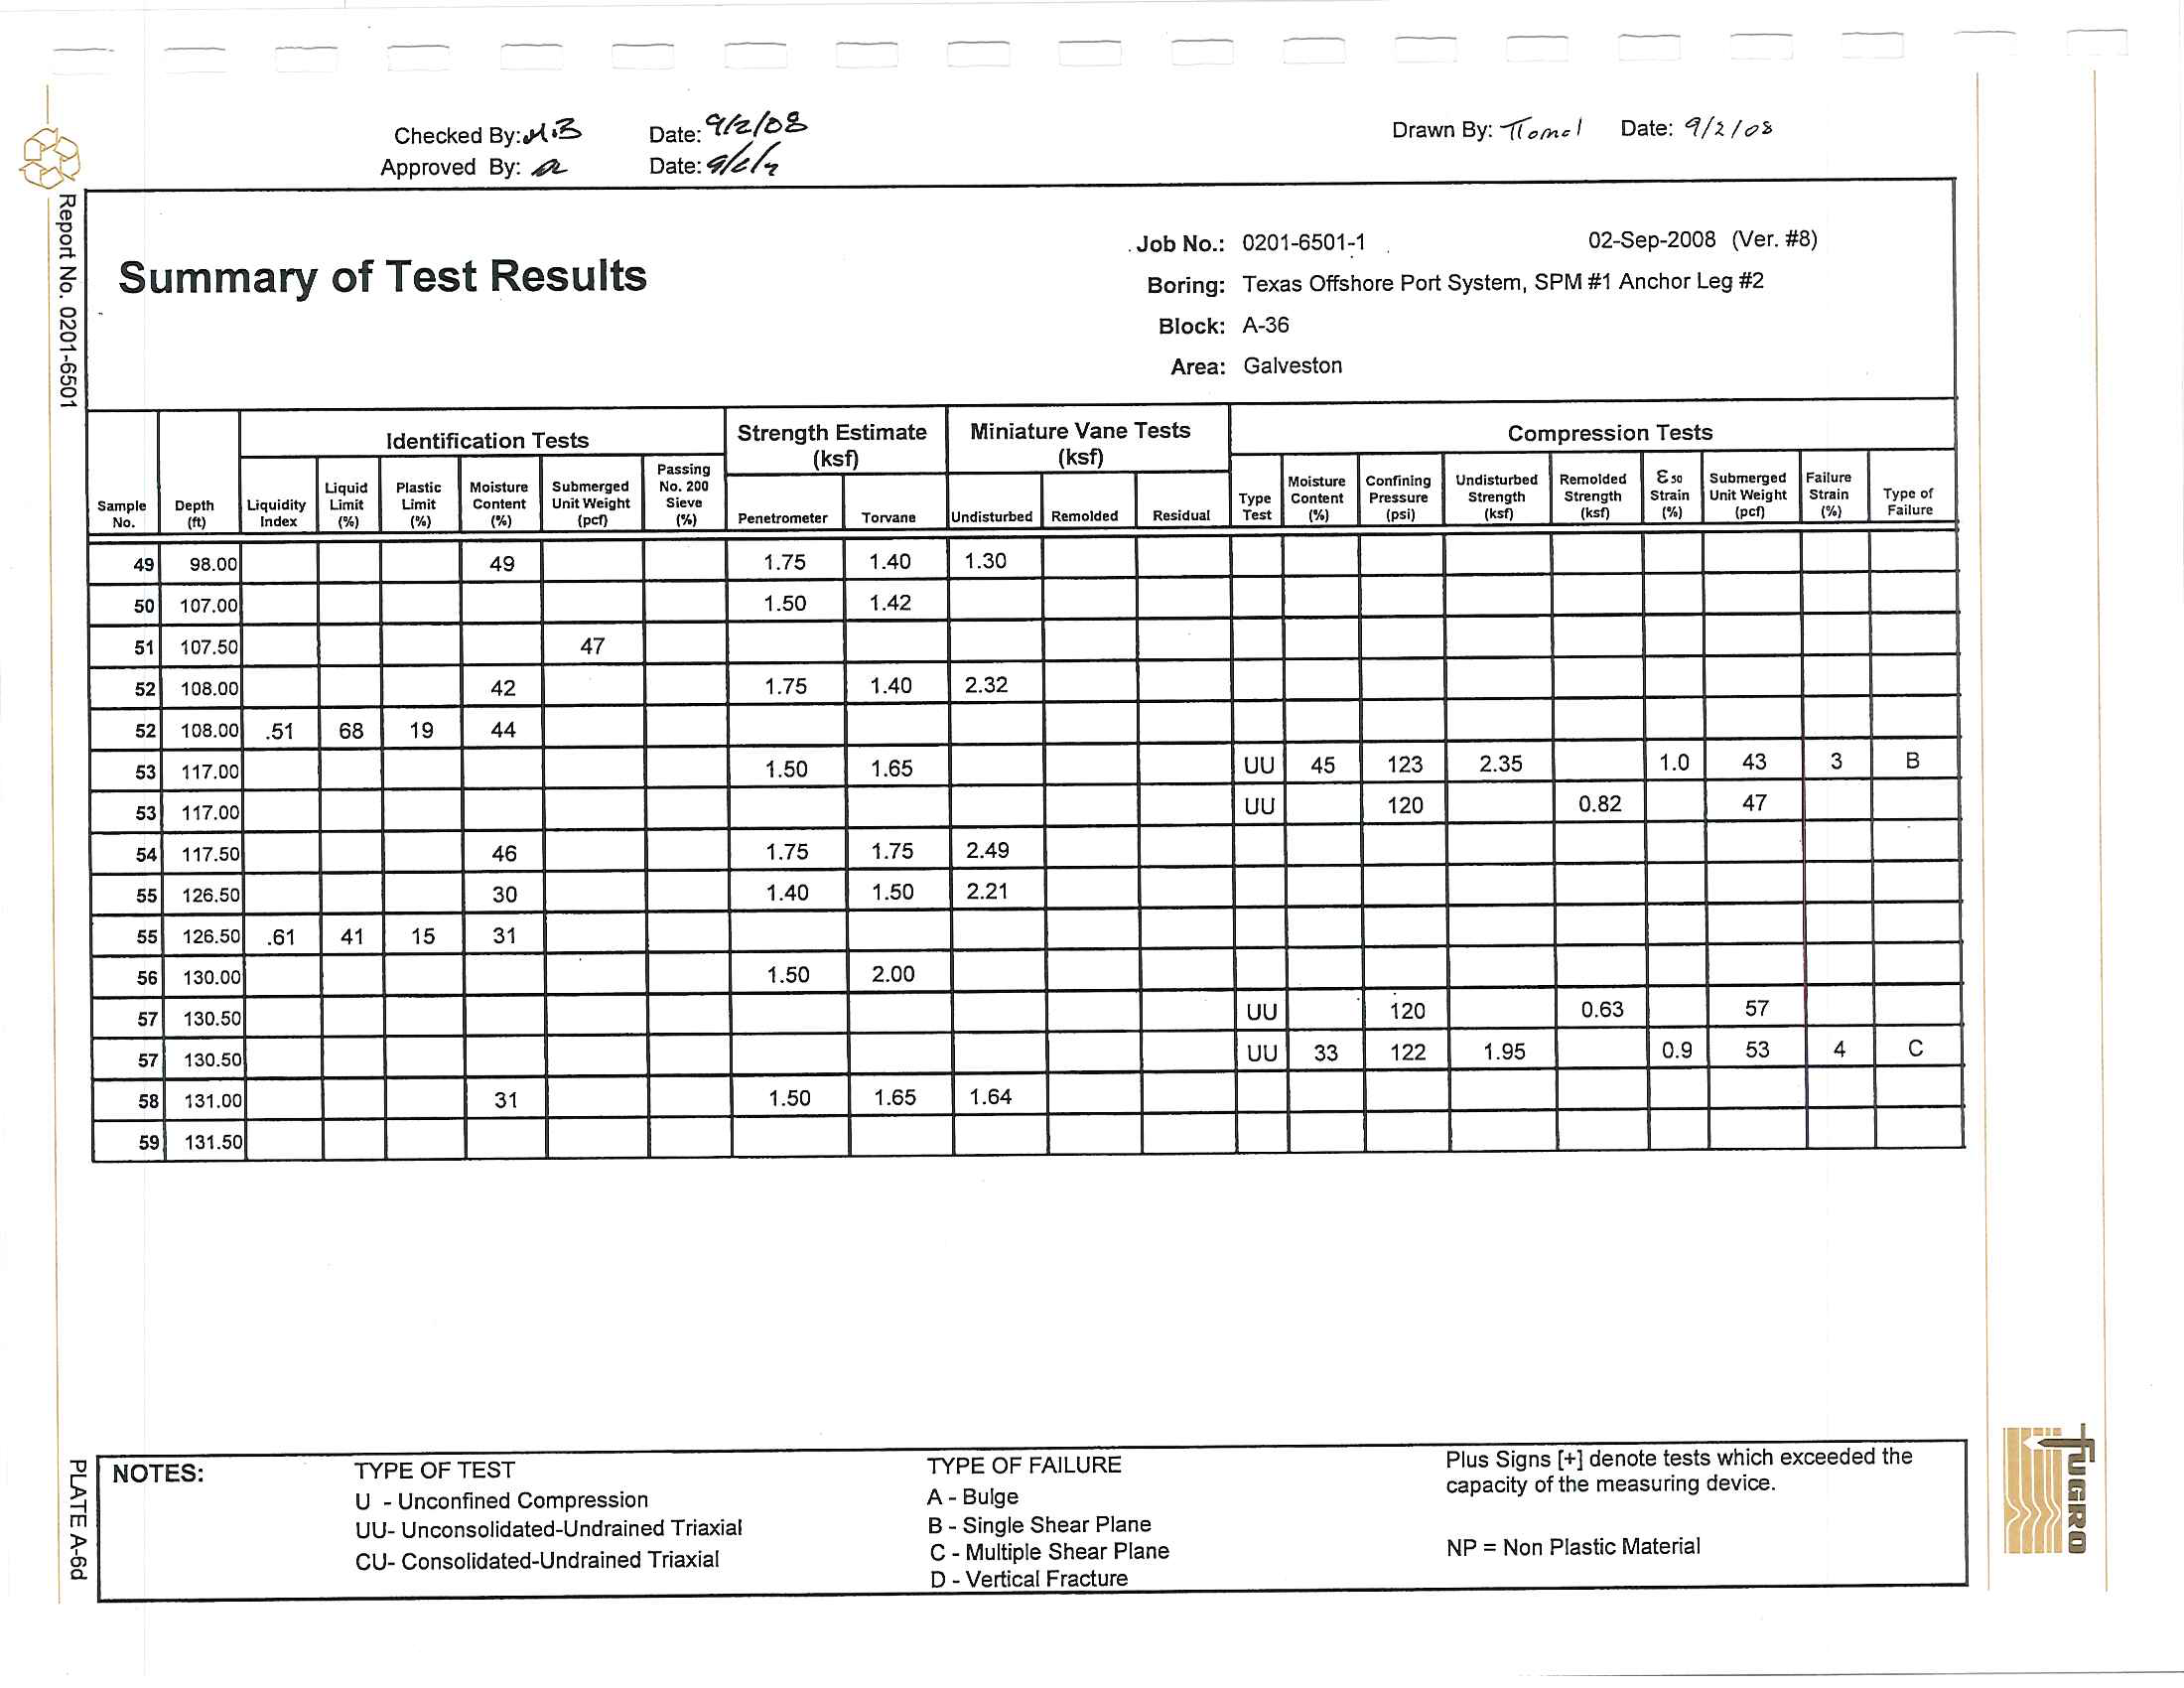
Summary of Te
s
t R
e
sults
'tlz/t!<'6
~;.:
-rr:
'1/2(0'
Job No
.
: 0201-650
1-1
02-Sep-2008 0/e
r
.
#8)
Bo
r
ing: Texas Offshore Port
System,
SPM #1 Ancho
r
Leg #2
B
l
ock
:
A-36
Ar
ea:
Galveston
.
Identification
T
ests
S
tre
n
gth Est
im
ate
Mi
n
i
a
tu
r
e
V
ane Tests
C
om
p
ression Tests
P
assing
(ksf)
(ksf)
LIquid
Plutlc
Mois
t
uno
Submerged
No. :ZOO
Moisture
Conrin1n"
Undisturbed
Remolded
E.
Submerged
Failutll
Sample
Depth
L
iquidity
Limil
LImi
t
Co
nt
e
n
t
U
n
it
Weight
SieVfl
Type
Content
Pressure
SlrlIngth
Strength
Slniin
UnitWelllht
Str.lin
Type
of
No.
'"
Indu
(%J
l%l
l%l
10<0
(\/0)
Penetro
m
eter
TOIV;lnl
Undisturbed
Remolded
Resi
d
lHli
Tut
(\!oj
(psi)
I.."
I.."
(%)
"'"
('10)
Fillhll'
''
1
1
.
00
47
0.17
0.07
2
1.50
.92
41
14
39
2
1.50
39
0.09
2
1.50
45
0.17
3
4
.
00
48
4
4
.
50
49
0.40
5
4
.
80
25
0.16
5
4
.
80
1.02
38
13
39
5
4
.
80
0.08
6
7
.
50
28
55
38
7
8
.
00
38
0
.
80
0.93
+
7
8
.
00
.69
52
14
4
0
7
8.00
37
0
.
52
8
1
0
.
00
1.50
1
.
54
9
10.50
9
10
.
50
U
U
27
120
0.7
1
2.9
51
13
A
10
1'
.
00
.68
41
13
32
0.96
0.37
11
14
.
00
27
53
2
1
1
2
17
.
00
28
56
48
1
3
20.00
27
56
69
14
25
.
00
33
54
66
15
28
.
50
52
N
O
T
ES
:
TY
P
E OF TEST
TYPE OF FAILUR
E
Plus Signs [+] denote
tests which exceeded the
U
-
U
n
confined Compression
A- Bulge
capacity
of the measuring device.
UU- Unco
n
soli
d
ated-
Und
rai
n
e
d T
riaxia
l
B
-
Si
n
gle Shear Plane
CU- Consolidated
-
Undrained Triaxial
C
-
Mul
t
iple Shea
r
Plane
NP = Non Plastic
Material
D
-
Vertical
Fracture
--
,
I
@
il'
"0
o
"
Z
~
o
N
S!
0,
~
S!
"
~
m
~
<r
Checked
By:
1"'\.J3.
Approved
By
:
ffi
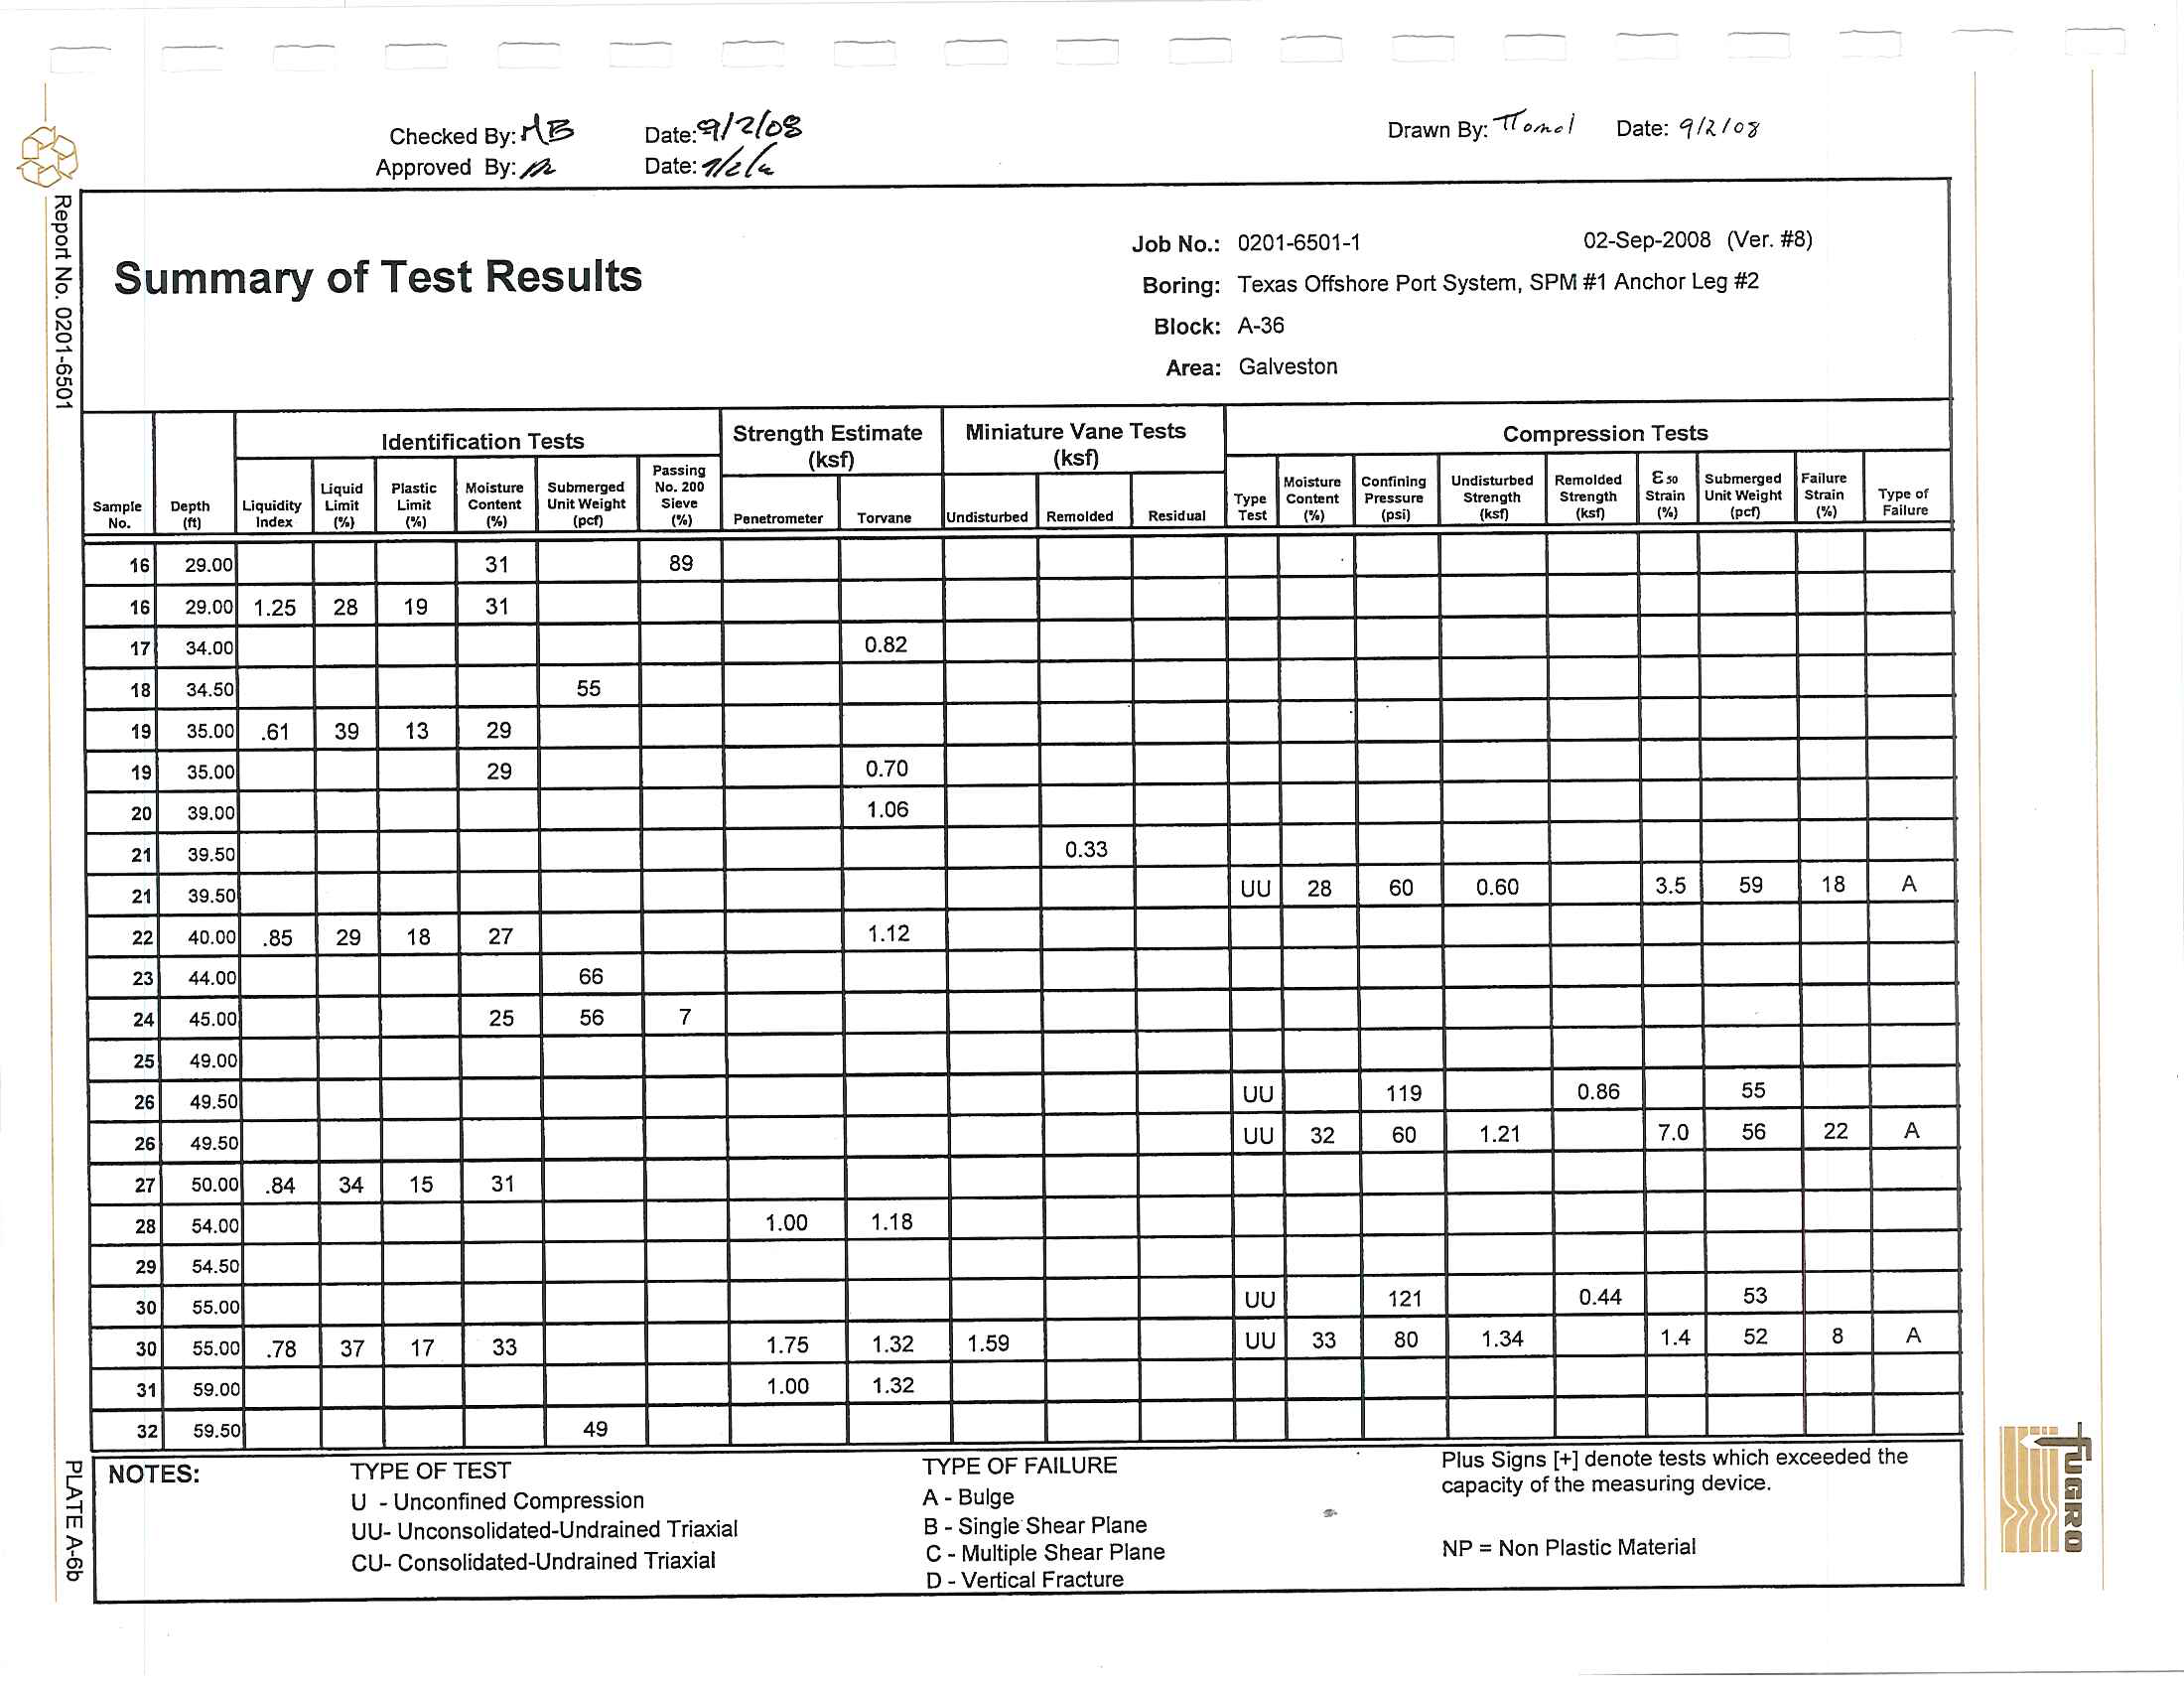
Summary of Test Results
Date:<fI/--Z(C$
Date
:
?,4;(
Drawn
By:
-r(e>n..
'"
I
Date:
'l/U
o~
Job
No.:
020
1-6
501
-1
02
-
Sep-2008 (Ver
.
#8)
Boring
:
Texas
Offshore
Port
System, SPM #
1
Anchor
L
eg #2
Bloc
k: A-36
Area:
Ga
l
veston
Identification
Tests
Strength
Estimate
Miniature
Van
e
Tests
Compression Tests
PUling
(ksf)
(ksf)
Uquid
PJastlt;
Moisture
Submerged
No. 200
Moisture
Conllnlng
Und
isturbed
Remolded
E.
Submerged
hnure
Sample
Depth
Liquidity
L1m1l
Li
mit
Content
Un1tW111l1It
Sieve
Typo
Content
P",SIUrl!
S
trength
SIrl!nglll
SI....
in
Unit Wei
g
ht
Strilln
Type of
No.
Iftl
Inde.-.
('10)
(%J
(%1
(p<f)
(%1
P,netromelu
TorvillllJ
Undisturbed
Remolded
Resid ....J
Tut
(%1
(psi)
(""
(""
(%J
"'"
(%1
Falhl/'e
,.
29
.00
3
1
89
1
.
29
.
00
1.25
28
1
9
31
17
34
.
00
0
.
82
18
34
.5
0
55
19
35
.
00
.61
39
1
3
29
19
35
.
00
29
0.70
20
39
.00
1
.
06
21
39
.
50
0.33
21
39
.
50
UU
28
60
0
.
60
3.5
59
18
A
22
40
.
00
.8
5
29
1
8
27
1
.
1
2
23
44
.
00
66
2.
45
.
00
25
56
7
2
5
49
.
00
2.
49.50
UU
119
0
.
86
55
2.
49
.
50
UU
32
60
1
.
21
7.0
56
22
A
27
50
.00
.
84
34
15
31
28
54
.00
1
.00
1.
1
8
2.
54
.
50
30
55
.
00
UU
121
0.44
53
30
55.00
.
78
37
17
33
1.75
1
.
32
1
.59
UU
33
80
1
.34
1.4
52
8
A
31
59
.
00
1
.00
1
.32
32
59.50
49
NOTES:
TYPE OF
TE
ST
TYPE
OF
FAILURE
Plus
Signs
[+J
denote
tests
w
hi
ch
exceeded the
U
-
Unconfined Compression
A -
Bulge
capacity of
the
measuring device.
UU-
Unconsolidated-Undrained
T
riaxial
B
- Single
'
Shear Plane
•
CU-
Conso
li
d
ated-Undrained
T
riaxial
C
-
M
u
ltiple Shear Plane
NP = Non
Plastic
Material
D
- Vertica
l Fra
cture
-
@
il'
,
-0
o
'"
Z
~
N
o
~
a,
~
"
~
~
en
o
Checked
By
:
rlp
Approved
By
:
.,#If-
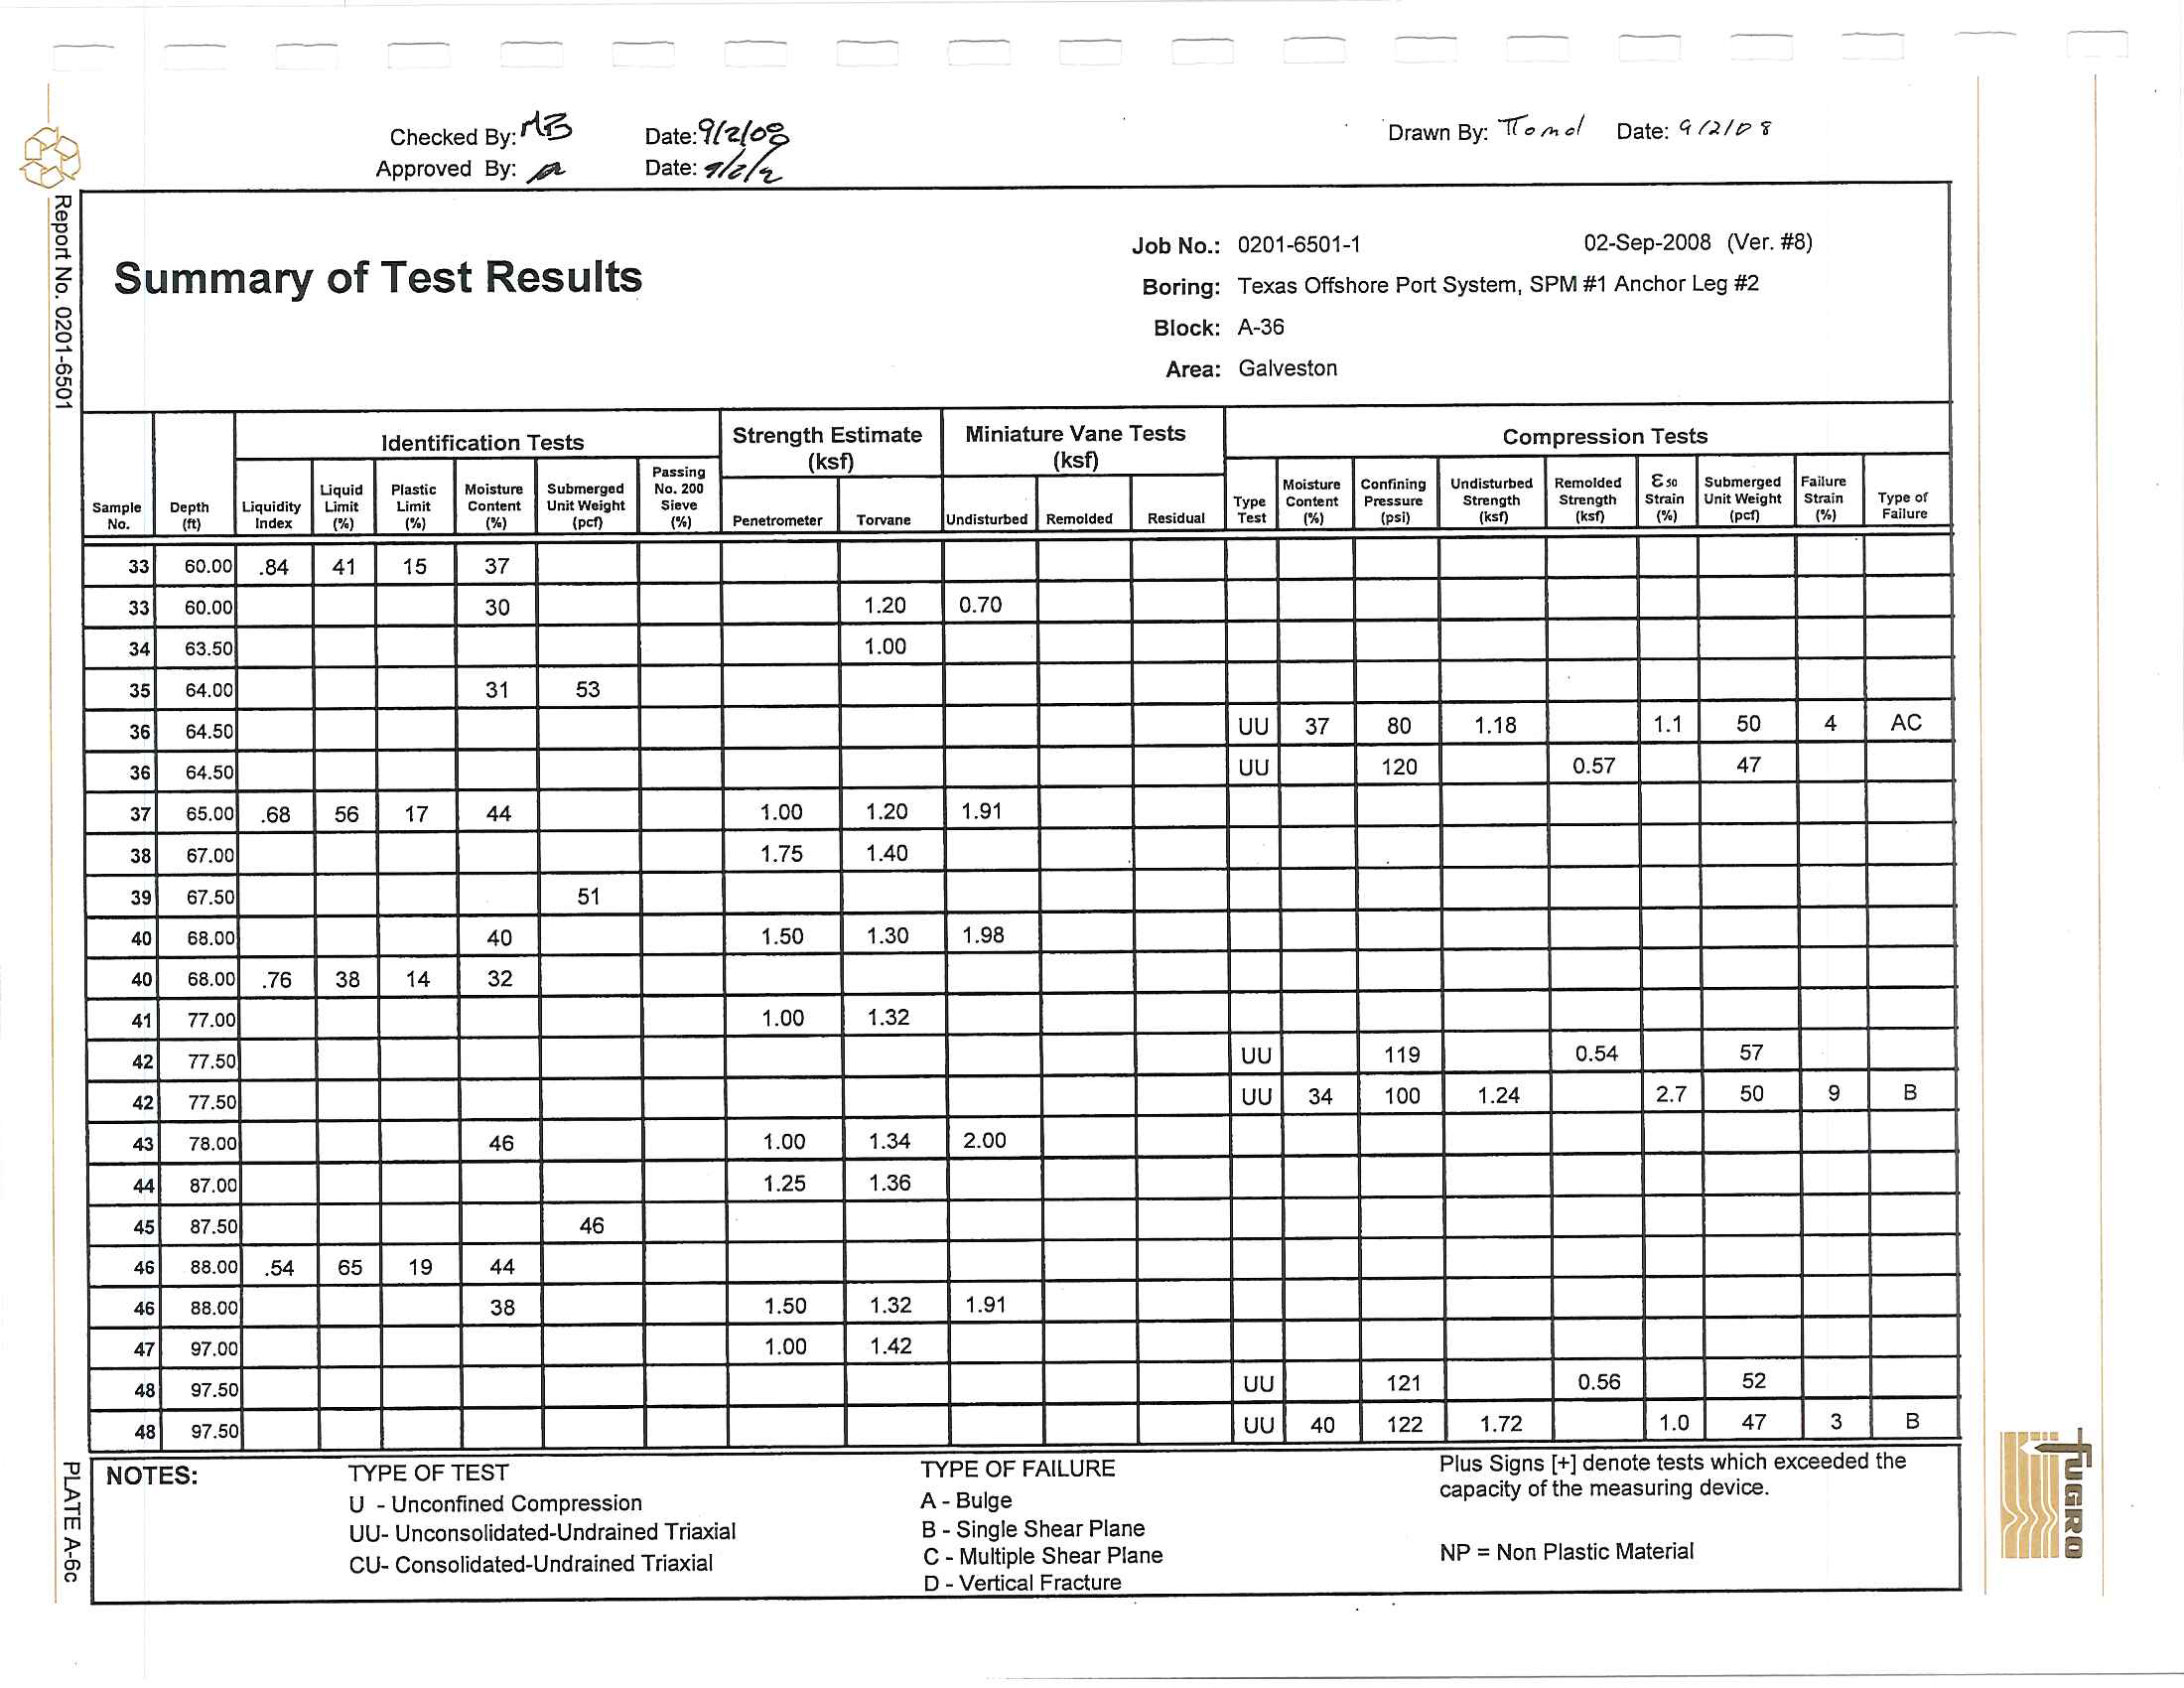
Summary of Test Results
Date
:9
!?(o'fo
Date
:
~/.V't-
.
Drawn By:
](D
/>< ,,
/
Date:
q!').
/
p
f
Job
No.: 0201-6501.1
02.Sep.2008
0Ier
.
#8)
Boring:
Texas
Offshore
Port
System, SPM #1 Anchor
Leg
#2
Block:
A.36
Area:
Galveston
I
dentificat
io
n T
ests
Strength Est
i
mate
Miniatur
e
Vane Tests
Compression
Tests
Pass
i
ng
(ksf)
(ksf)
Uquld
Plastic
MoistunI
Submer"
ed
No.
2
0
0
MoistunI
Confin
i
ng
Undisturbed
Remold
ed
6.
Submerged
Fa
il
u",
Samp
le
Oepth
Liq
uidity
Limi
t
LImit
Con
t
e
nt
UnltWelllht
Sieve
Type
Content
Press!'!"'
Strength
Strength
Strain
Unit We
l
!jlht
Sin
i
n
T
yp
e of
No
.
1M'
Index
(%)
('10
)
(%)
"<1)
(%)
Penetrometer
To",
a
na
Undisturbed
RemoLded
Residual
Tut
(%)
[psi)
(ksf)
(kif)
(
%
,
"<1)
{
%
,
Fa
il
u
re
33
60
.
0
0
.
84
4
1
15
37
33
60
.
00
30
1
.
20
0.70
34
63
.
50
1
.
00
35
64
.
00
31
53
36
64.5
0
UU
37
80
1
.
18
1
.
1
50
4
AC
3
6
64
.
50
UU
120
0
.
57
47
37
65
.
0
0
.68
56
17
44
1
.
00
1
.
20
1.91
38
67
.
00
1.75
1.40
3.
67
.
50
51
40
68
.
00
40
1.50
1
.
30
1.98
40
68
.
00
.
76
38
14
32
41
noo
1
.00
1.32
42
77
.
5
0
UU
119
0
.
54
57
42
77
.
50
UU
34
1
00
1.
24
2
.
7
50
9
B
43
78
.
00
46
1.00
1
.
34
2.00
44
87.00
1.25
1.36
45
87
.
50
46
46
88
.0
0
.
54
65
1
9
44
46
88
.00
38
1
.
50
1
.
32
1
.
91
47
97
.
00
1.00
1.42
48
97.50
UU
121
0
.
56
52
48
97
.
50
UU
40
122
1
.
72
1.0
47
3
B
NOTES:
lY
PE
OF TEST
lYPE OF
FAILURE
Plus Signs [+] denote
tests which exceeded the
U
- Unc
o
nfine
d Compression
A- Bulge
capacity of the measuring
device
.
UU- Un
co
nso
l
idated-Undrained Tri
axia
l
B
-
Single
S
h
ea
r Plane
CU-
Consolidated-Undrained
Tr
iaxial
C
-
Multiple Shear
P
lane
NP = Non
P
lastic Material
o
-
Vertical Fracture
.
-
I
@
;0
"0
o
""
Z
o
o
'"
~
in
?i
Checked
By:.K'
''-
Appr
ove
d
By
:
,.::L
Summary of Te
s
t Re
s
ults
Id
entification Tests
LJquid
Plastic
MOi
s
ture
Submerged
Sample
Depth
Uqujdity
Urn;!
Urn;!
Conlent
Unit
W
eight
N,.
,.,
Index
I%)
I
%)
,%,
49
'''''
96
.
00
49
50
107
.0
0
51
107
.50
47
52
108
.
0
0
42
52
1
08.00
.
51
68
19
44
53
1
17
.
00
53
1
17.
0
0
..
117
.
50
46
5
5
126.50
30
55
12
6,50
.
6
1
4
1
15
31
56
130
.00
5
7
130
.50
57
130
.
50
58
131.
0
0
31
59
131
.
50
D
ate
:
'1'1'z./o!.
Date
:
-?~;;
S
trength Esti
m
ate
Pus
i
n
ll
(ksf)
No. 200
SievII
{%'
Penetrometer
Torvan
e
1
.
75
1
.40
1.50
1.42
1
.
75
1.40
1.50
1.65
1.75
1
.
75
1.40
1
.
50
1.50
2
.0
0
1
.
50
1
.
65
Drawn By
:
-r/o/h&
I
Date:
q/,
(,po
.
Job No.:
0201
-
6501
-
1
02
-
Sep-2008 (Ver. #8)
B
oring:
T
e
x
as Offshore
Port System,
SPM #1
Ancho
r
Leg #
2
Bl
ock:
A-36
A
rea: Galveston
Miniat
u
re Vane Tests
(ksf)
Compres
s
ion
T
ests
Moistur
e
C
o
nfin
ing
Undisturbed
R
emold
ed
E.
Subm
erged
F
zllunt
T
y
pe
Conlent
Pressu","
Strl!ngth
Sll1!n
ll
th
Stnlin
Unit Weight
Strain
T
ype
or
Undisturbed
Remolded
Residu;al
Test
(%)
(
psi)
'WI
''''0
(%
'
(pet)
I
%)
Failure
1
.
30
2
.
32
UU
45
123
2.35
1.0
43
3
B
UU
120
0
.
82
47
2.49
2
.2
1
UU
120
0
.
63
57
UU
33
122
1.95
0.9
53
4
C
1
.
64
~
N
O
TES:
TYPE OF TES
T
TYPE OF
F
AILUR
E
Plus
Signs
[
+]
den
o
te tes
ts
whic
h
e
xce
e
d
ed the
~
U
- Unconfined Compression
A _ Bu
l
ge
capacity
of the measunng dev
i
ce
.
~
UU- Unconsolidated-Undrained
T
riaxia
l
B
-
Single Shea
r
Plane
~
CU- Consolidated-Undrained T
riaxi
a
l
C - Multip
l
e Shear Plane
D
- Vertical Fracture
NP
= Non P
las
tic
Material
I
I
@
;0
ro
"0
0
"-
z
100
?
0
'"
0
in
90
:1
'"
80
f-
I
70
'"
~
6
0
II]
>-
'"
z
(jj
50
(j)
«
"'-
f-
z
40
UJ
II
'"
UJ
"'-
30
20
10
0
100
"
m
~
!
o
C
h
e
cked
b
y:
~
A
pproved
b
y:
'p.,
u
.
s
.
STANDARD
SIEVE
S
IZE
S
IN INCHES
3
2
I
Coarse
SAM
PLE
NO
.
12
14
24
1
3
/
4
3
/
8
I
I
I
I
I
10
GRAVEL
I
F
i
ne
DEPTH
,
FT
17.00
25.00
45.00
4
I
I
oate
:
7/v'D~
oate
:
?/'ih
u.S. STANDARD
SIEVE
NUMBERS
1