Appendix B contains discussions of ana
l
ytical
procedures used
in
our
engineering analyses. Appendix C
contains a positioning
report
by
Fugro
Chance,
I
nc.,
of
Lafayette, Louisiana
.
•
For the purposes
of discussion and presentation, "driven pipe
pile"
is
used
in
this report
to represent
foundation piles,
caissons and conductors,
unless otherwise
specified.
2.2 FIELD AND LABORATORY
INVESTIGATIONS
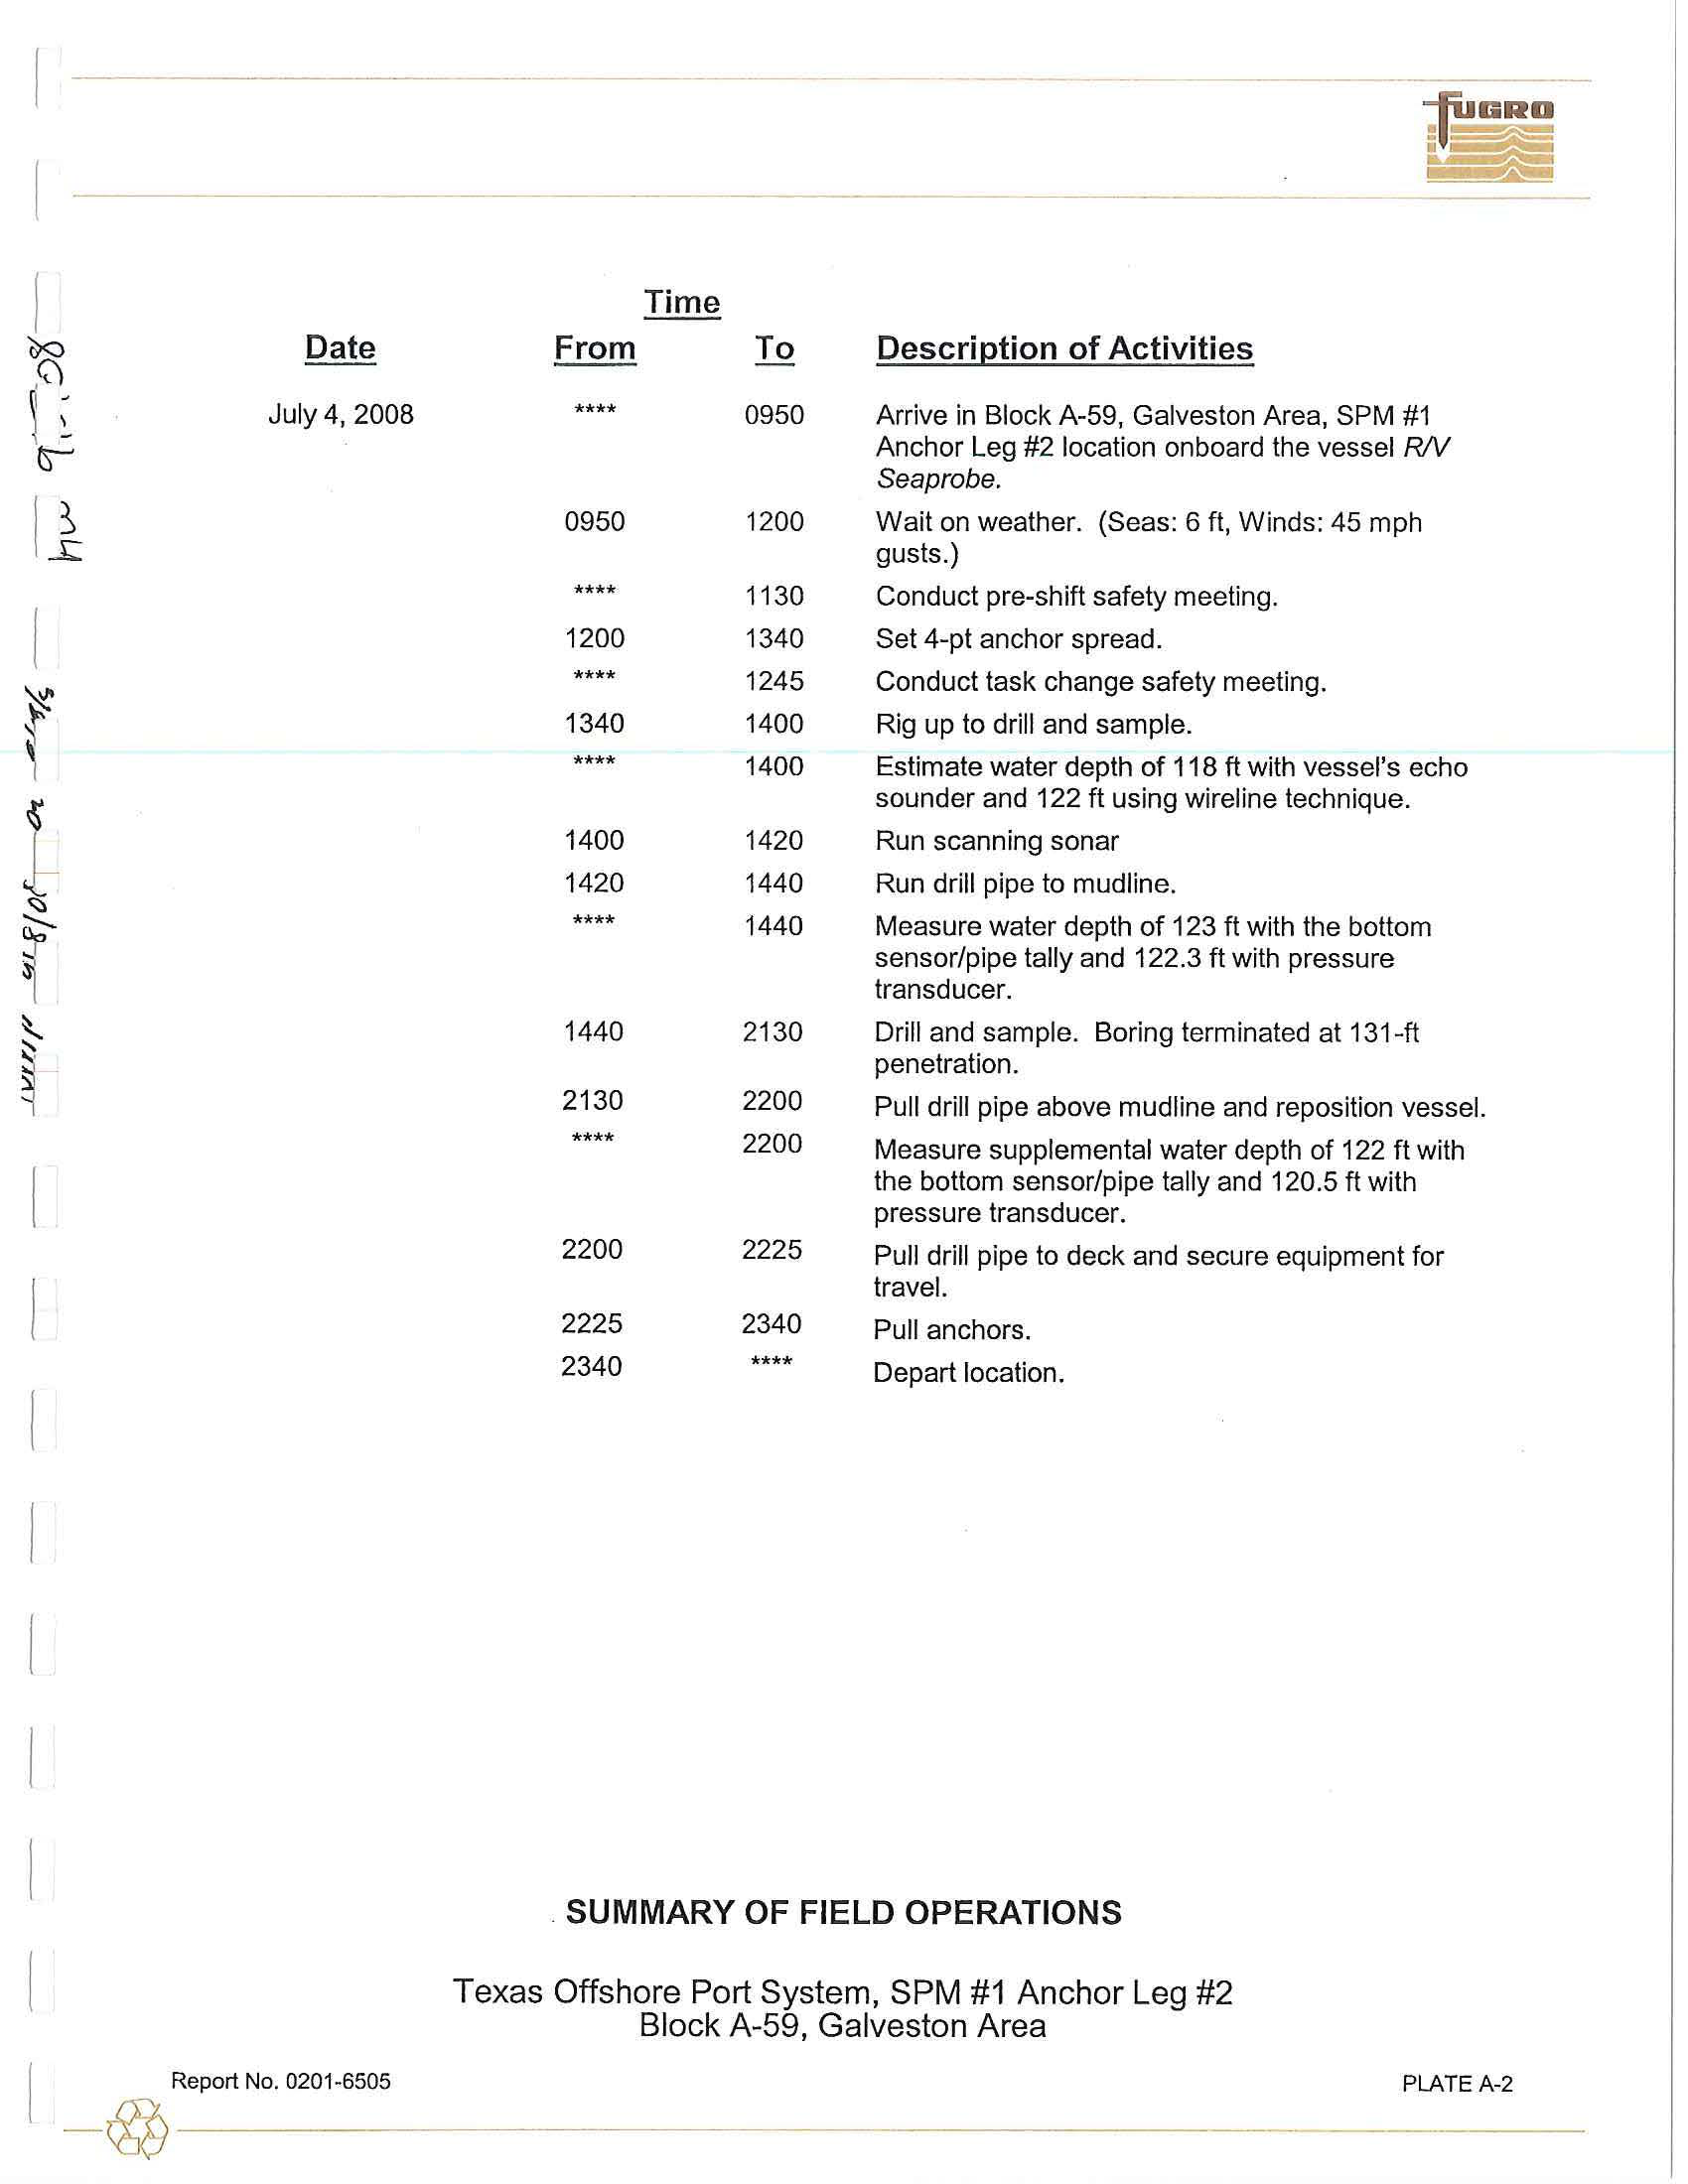
The field investigation
was
performed
on Ju
l
y
4
through 6, 2008,
from the
RN
Seaprobe.
The
soil
cond
itio
ns were
determined
by performing
four exploratory borings
,
two at each
SPM location with
one
boring
at
a
selected
anchor
l
eg location, and one
boring
at
the
proposed
PLET location. Enterprise
Field
Services selected
the
boring
locations. These
borings were
drilled to
a penetration of 131-ft
below
mudline.
The water
depths
at
the boring locations ranged from 123 to 125
ft. A chronological summary
of
field
operations
is
presented
in
Appendix
A.
2.2.1
Exploratory Borings
FMMG
personnel
drilled
the
so
il
borings with a
OMX
drill
rig
positioned over
the
centerwell of
the
RN
Seaprobe.
The
vesse
l
was anchored at
the
boring
location by
a 4-point mooring system.
Soil
conditions at
the
site were
exp
lored
by
drilling
a group
of four soil borings
to 131-ft
penetration below the
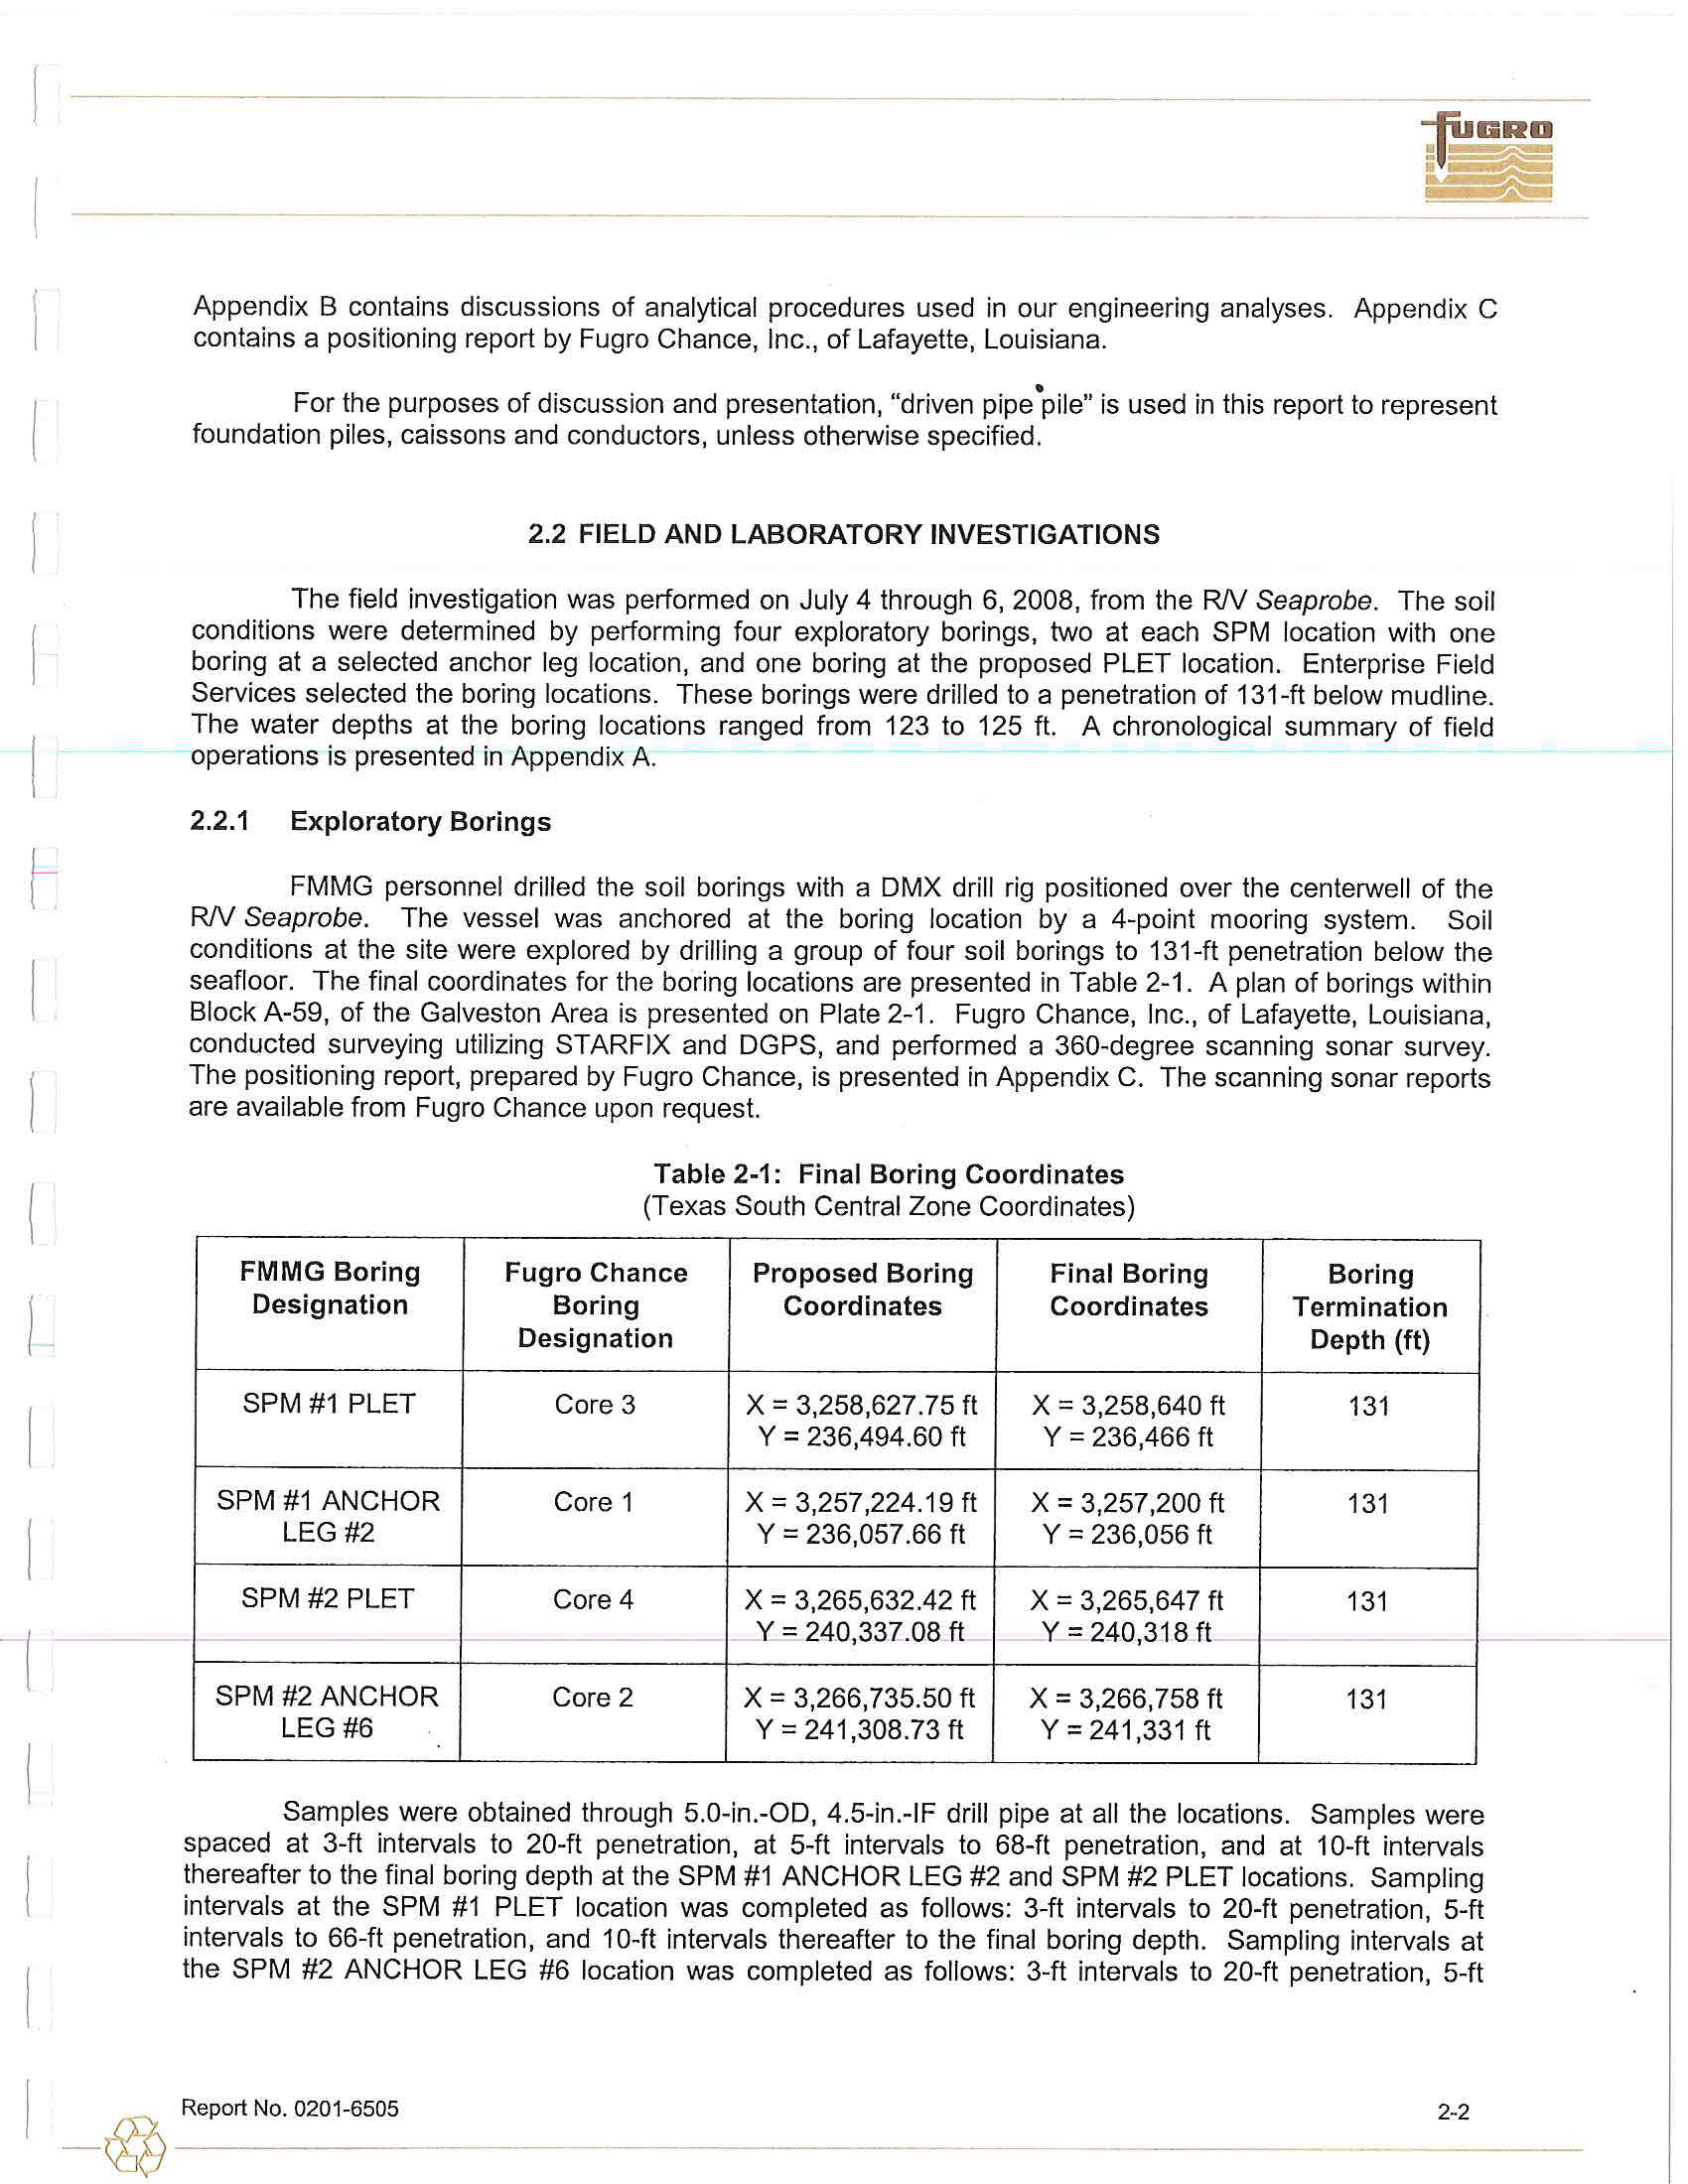
seafloor. The
final
coordinates for the boring
locations
are presented
in
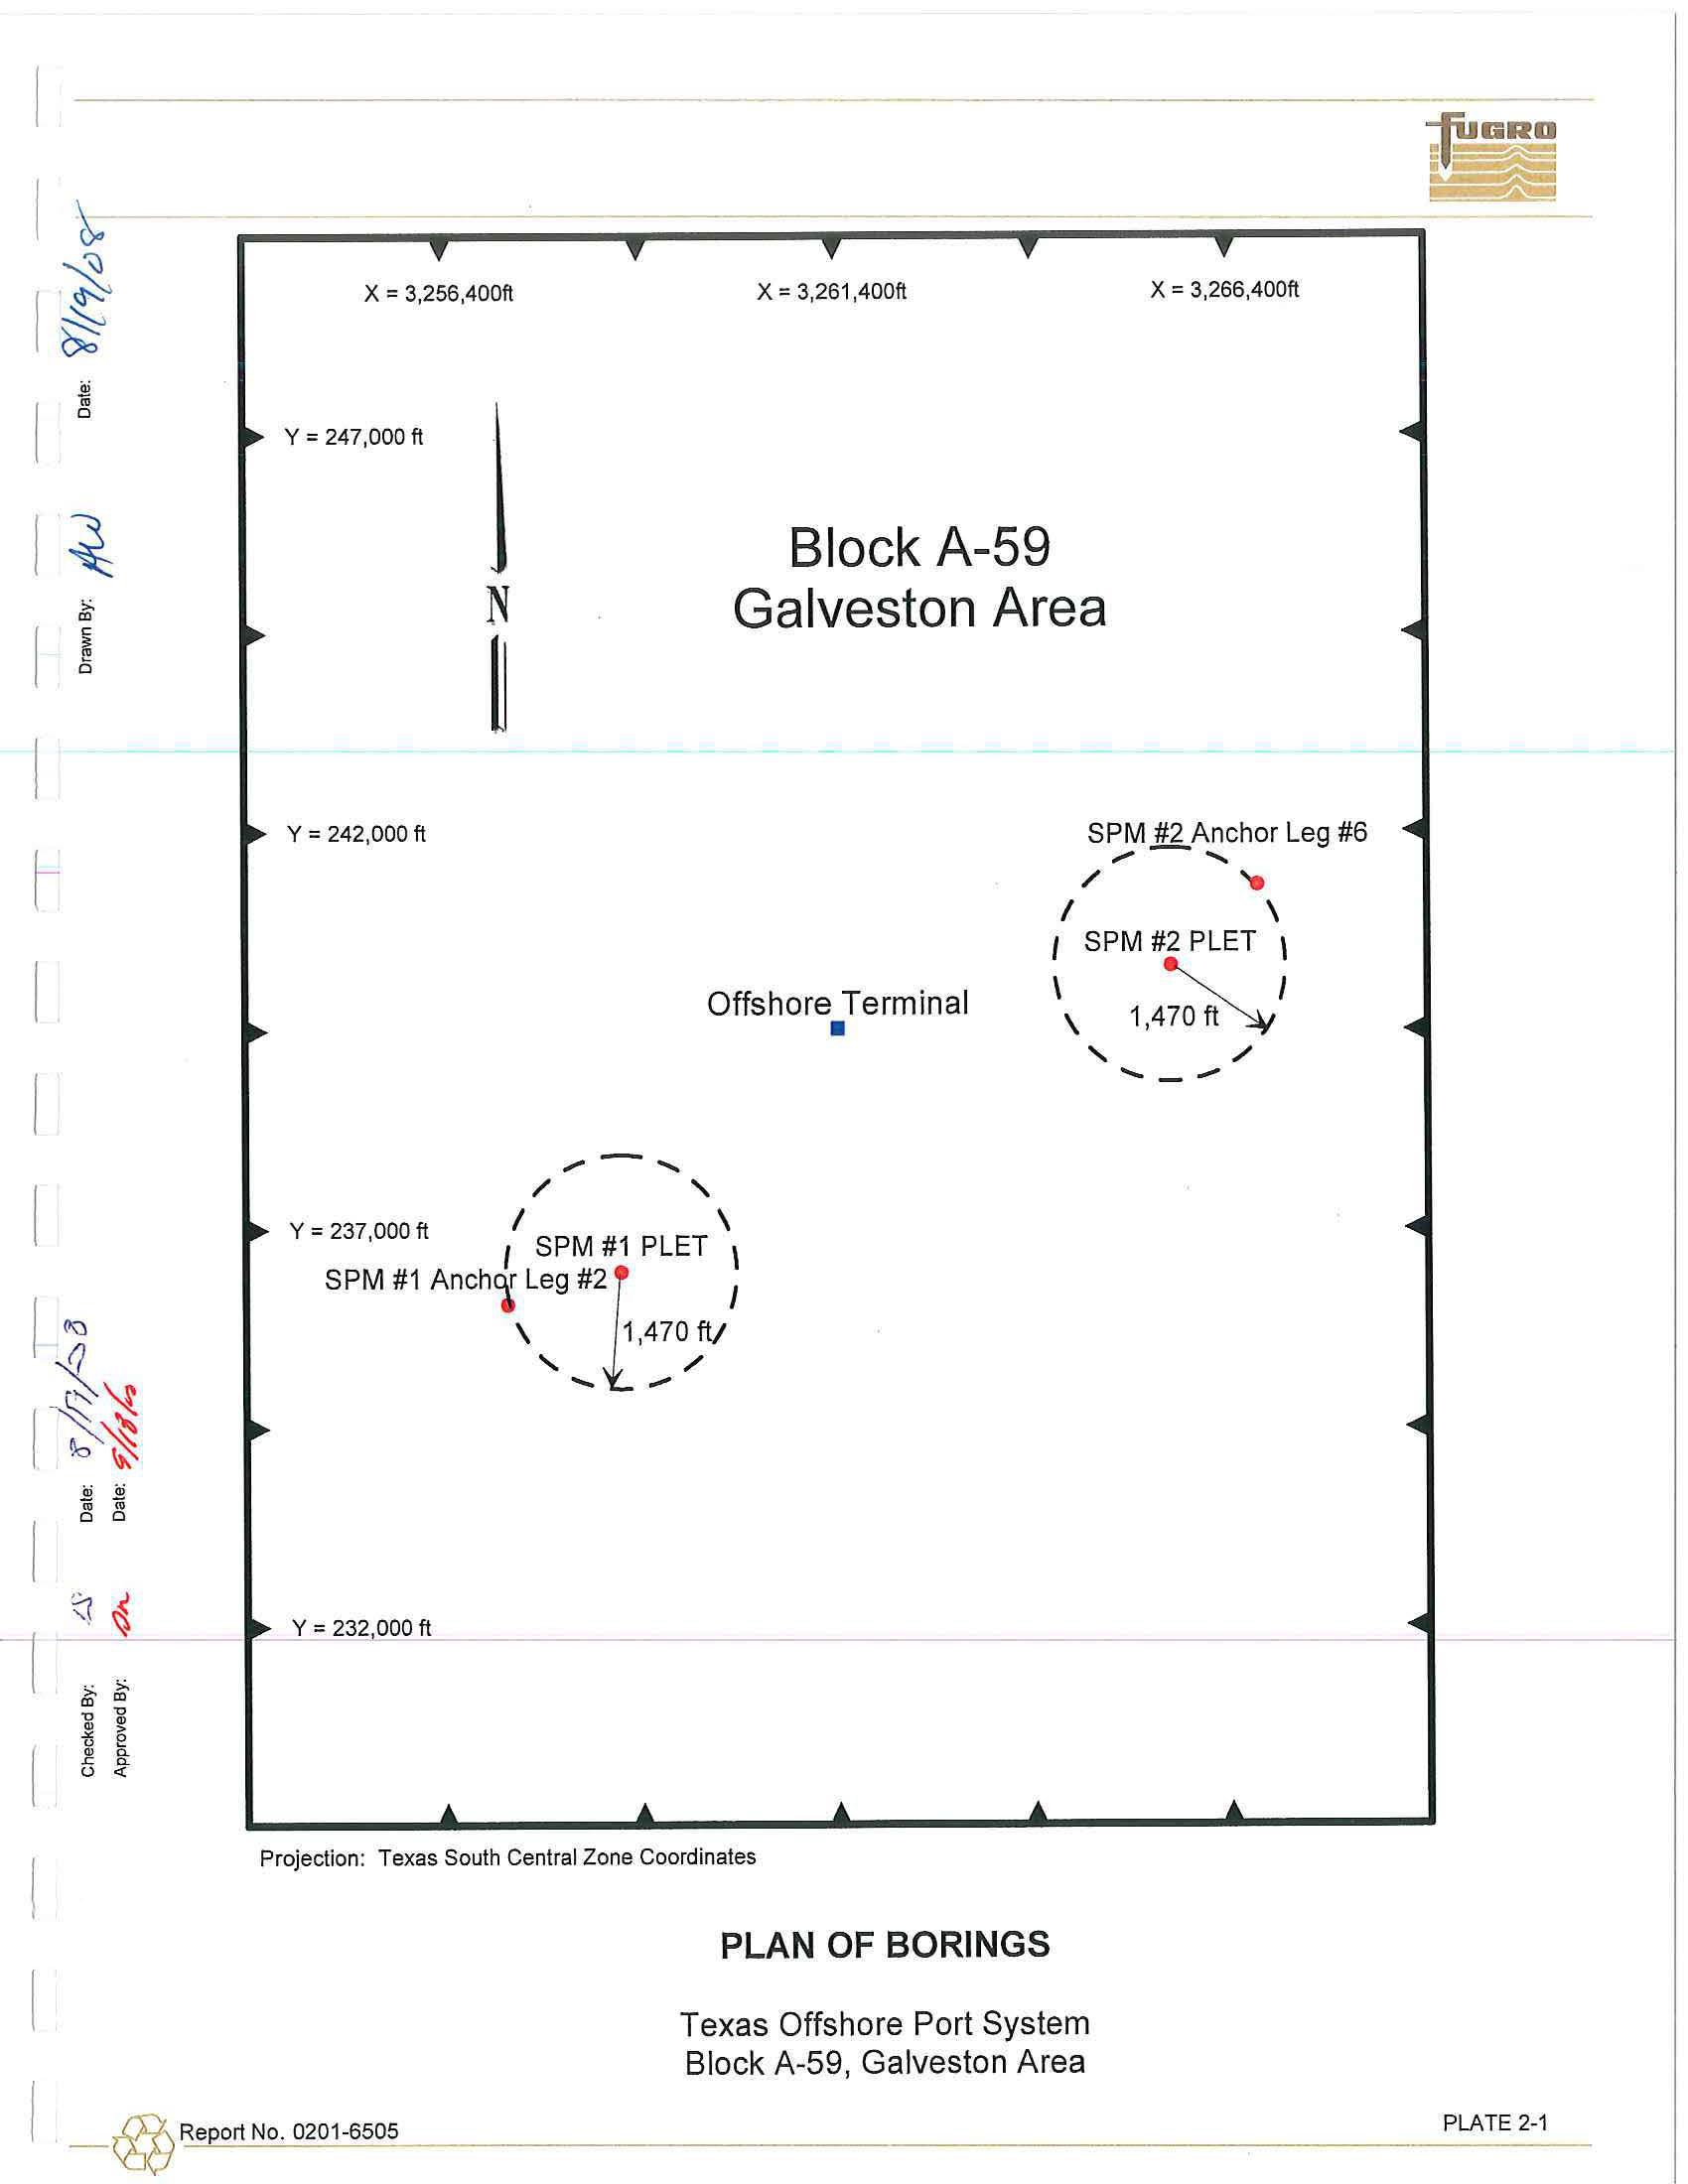
Table 2-1. A plan of borings within
Block A-59,
of
the
Galveston Area is presented on
Plate
2-1.
Fugro
Chance,
Inc.,
of
Lafayette, Louisiana
,
conducted surveying utilizing STARFIX and
DGPS,
and
performed
a 360-degree scanning sonar survey.
The
positioning report, prepared by
Fugro
Chance,
is
presented
in Appendix C.
The
scanning sonar
reports
are available from
Fugro
Chance
upon
request.
FMMG
Boring
Designation
SPM
#1 PLET
SPM #1 ANCHOR
LEG#2
SPM
#2 PLET
SPM #2
ANCHOR
LEG
#6
Table 2-1:
Final
Boring Coordinates
(Texas South Central Zone Coordinates)
Fugro
Chance
Proposed
Boring
Final Boring
Boring
Coordinates
Coordinates
Designation
Core 3
X
=
3,258,627
.
75
ft
X = 3,258,640
ft
Y =
236,494.60 ft
Y = 236,466
ft
Core
1
X = 3,257,224.19 ft
X = 3,257,200
ft
Y = 236,057.66
ft
Y
=
236,056 ft
Core4
X
=
3,265,632.42
ft
X
=
3,265,647
ft
Y
=
240,337.08 ft
Y = 240,318
ft
Core
2
X = 3,266,735.50
ft
X
=
3,266,
758 ft
Y
=
241,308.73
ft
Y
=
241,331
ft
Boring
Termination
Depth (ft)
131
131
131
131
Samples were
obtained through 5.0-in.-OD, 4.5-in.-lF drill pipe at all
the locations. Samples
were
spaced at 3-ft
intervals
to 20-ft
penetration,
at 5-ft
intervals
to
68-ft
penetration,
and at 10-ft intervals
thereafter to the final boring
depth at the
SPM
#1
ANCHOR LEG #2
and SPM #2
PLET locations
.
Sampling
intervals
at
the
SPM
#1 PLET location
was completed as follows: 3-ft
intervals to
20-ft penetration, 5-ft
intervals to
66-ft
penetration,
and 10-ft
intervals thereafter to the final
boring
depth
.
Sampling intervals
at
the SPM #2 ANCHOR
LEG
#6
l
ocation
was
completed as
follows
:
3-ft intervals
to
20-ft
penetration,
5-ft
I
-
@
-
R
-
e
-
po
_
rt
_
N
_
o
_
. 02
_ _
0
_
1-
-
6
-
50
-
5
2-2
------
intervals to 65-ft penetration, and 10-ft intervals thereafter
to
the final boring depth.
The drilling and
sampling techniques used to complete this boring are
exp
lain
ed
in
detail in Appendix
A.
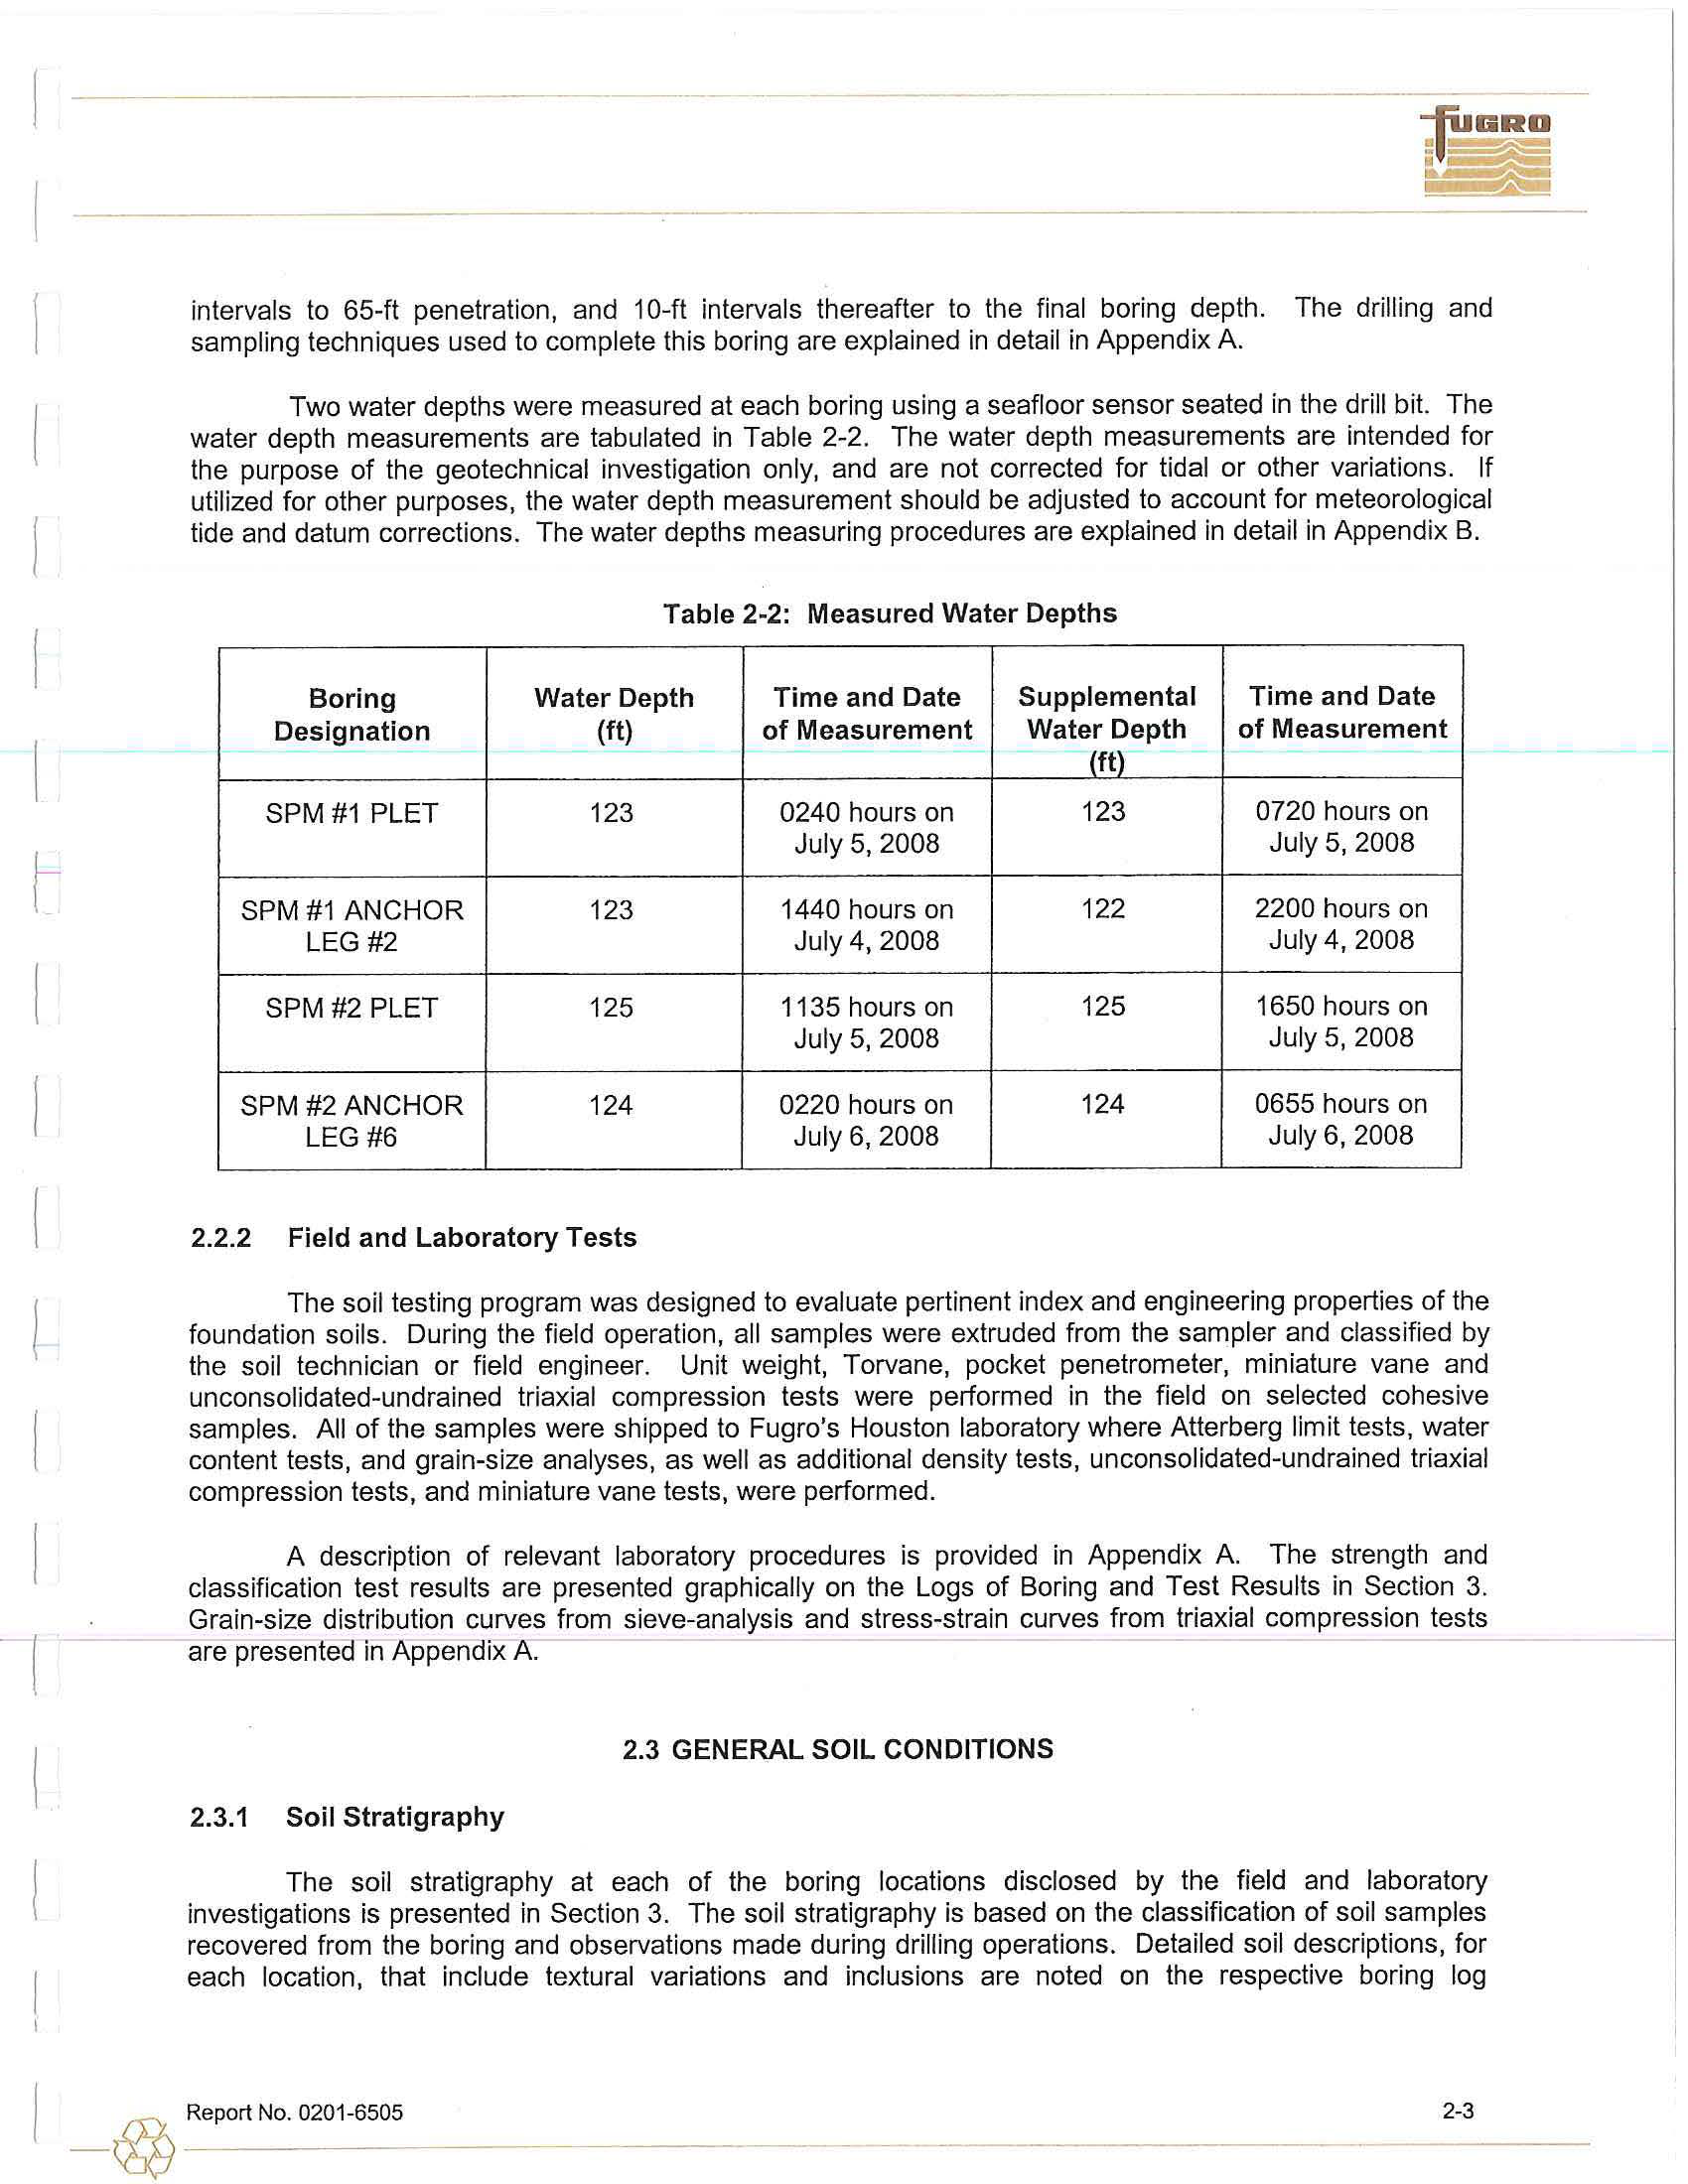
Two
wa
ter
depths were measured at each boring using a seafloor sensor seated in the drill
bit.
The
water depth measurements are
tabul
ated
in Table 2-2. The water depth measurements are intended for
the purpose of the geotechnical
in
vestigation
only, and are not corrected for tidal or other
va
riati
ons
. If
utilized for other purposes, the
water depth
measurement
should
be adjusted
to
account for meteorological
tide and datum corrections. The
water
depths measuring procedures are explained
in detail in Appendix B.
Table 2
-
2: Measured Water Depths
Boring
Water Depth
Time and Date
Supplemental
Time and Date
Designation
(ft)
of Measurement
Water Depth
of Measurement
(ft)
SPM #1 PLET
123
0240 hours
on
123
0720 hours on
July
5,
2008
July
5, 2008
SPM
#1 ANCHOR
123
1440 hours
on
122
2200
hours on
LEG #2
July
4, 2008
July 4, 2008
SPM
#2 PLET
125
1135 hours
on
125
1650 hours on
July
5,
2008
July
5, 2008
SPM #2 ANCHOR
124
0220 hours
on
124
0655 hours on
LEG
#6
July 6, 2008
July
6, 2008
2.2.2
Field and Laboratory Tests
The soil testing program was designed to evaluate pertinent index and engineering properties
of
the
foundation soils
.
During the field operation,
all samples were extruded from the sampler and classified
by
th
e soil
technician or field
eng
ineer
.
Unit weight, Torvane, pocket penetrometer, miniature vane and
unconsolidated-undrained triaxial compression tests
were
performed
in the field on selected cohesive
samples. All
of the samples were
shipped
to Fugro's Houston laboratory where Atterberg limit tests, water
content tests, and grain-size analyses, as well
as
additional density tests, unconsolidated-undrained triaxial
comp
ression
tests, and miniature
vane
tests, were performed.
A description of relevant
lab
ora
tory
procedures
i
s
provided in Appendix A.
The strength
and
classification test results are presented graphically
on the Logs of Boring and Test Results in Section
3.
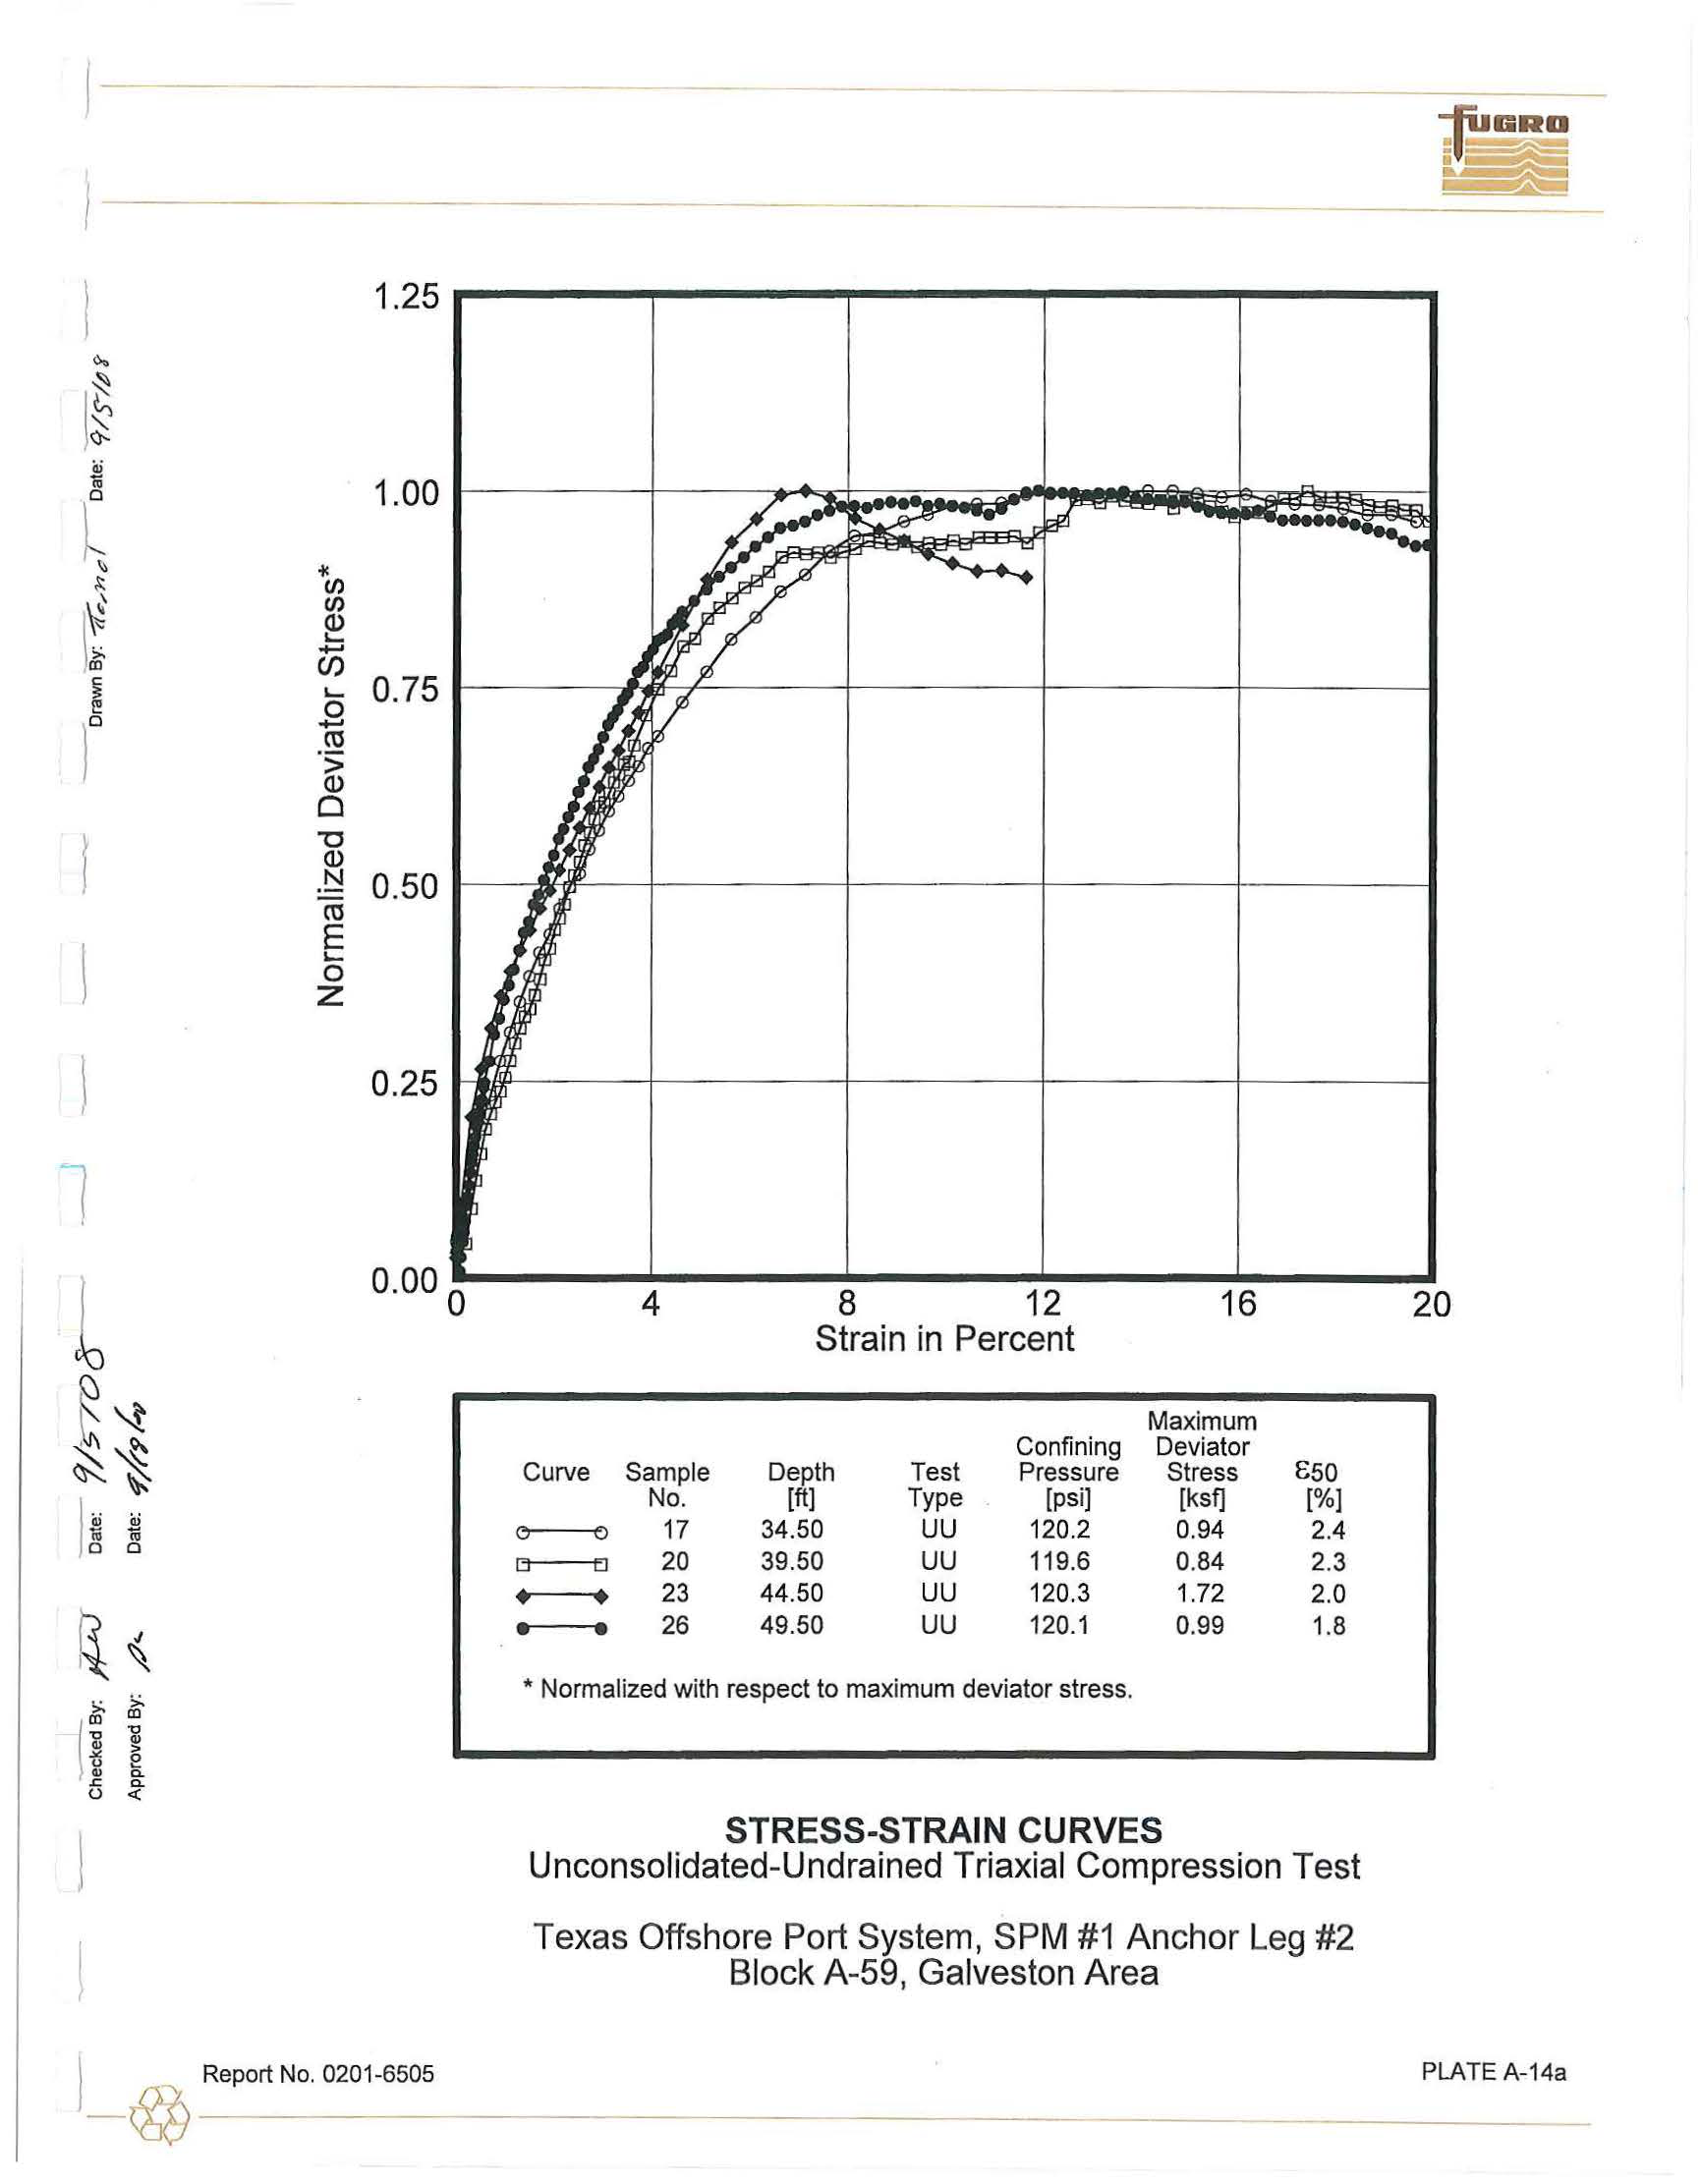
Grain-size distribution curves from sieve-analysis and stress-strain curves from triaxial compression tests
are presented
in Appendix
A.
2.3
GENERAL SOIL CONDITIONS
2.3.1
Soil Stratigraphy
The soil
strat
i
graphy
at each of the boring locations
disclosed
by the field and
laborat
ory
investigations
is
presented
in Section 3. The soil stratigraphy is based on the classification of soil
samples
recovered from
the
boring and observations
m
ade
during drilling operations. Detailed soil descriptions, for
each location, that include
t
extural
variations and inclusions are noted
on the respective
boring
log
I
-
@
Report No. 0201-6505
2-3
.s
....
~
Cl Cl
~
~
'O
'O
Q)
Q)
~
e
Q)
a.
,; a.
'-' <t
X
=
3,2
56,40
0
ft
X
=
3,261,400ft
X
=
3,266,400ft
Y
=
247,000 ft
N
Block
A
-5
9
Back to top
Galveston
Area
~
Y
=
242,000 ft
.,,.,.
........
Offshore Terminal
•
/
'
y
=
237,000
ft
I
SPM
#1
PLET \
I
\
SPM
#1
Anch
1
Leg
#2
1
I
\
1,470 ft/
'
/
.....
-
Y
=
232,000 ft
Projection:
Texas
South Central
Zone
Coordinates
PLAN OF
BORINGS
SPM~Anchor Leg #6
.,,.,.
........
/
I
\
I
SPM
#2
PLET \
\
~
I
\
1,470ft~
'
/
.....
__
Texas Offshore Port System
Block
A-59,
Galveston Area
i,i
1ii
0
-
v
\
II
\"::'
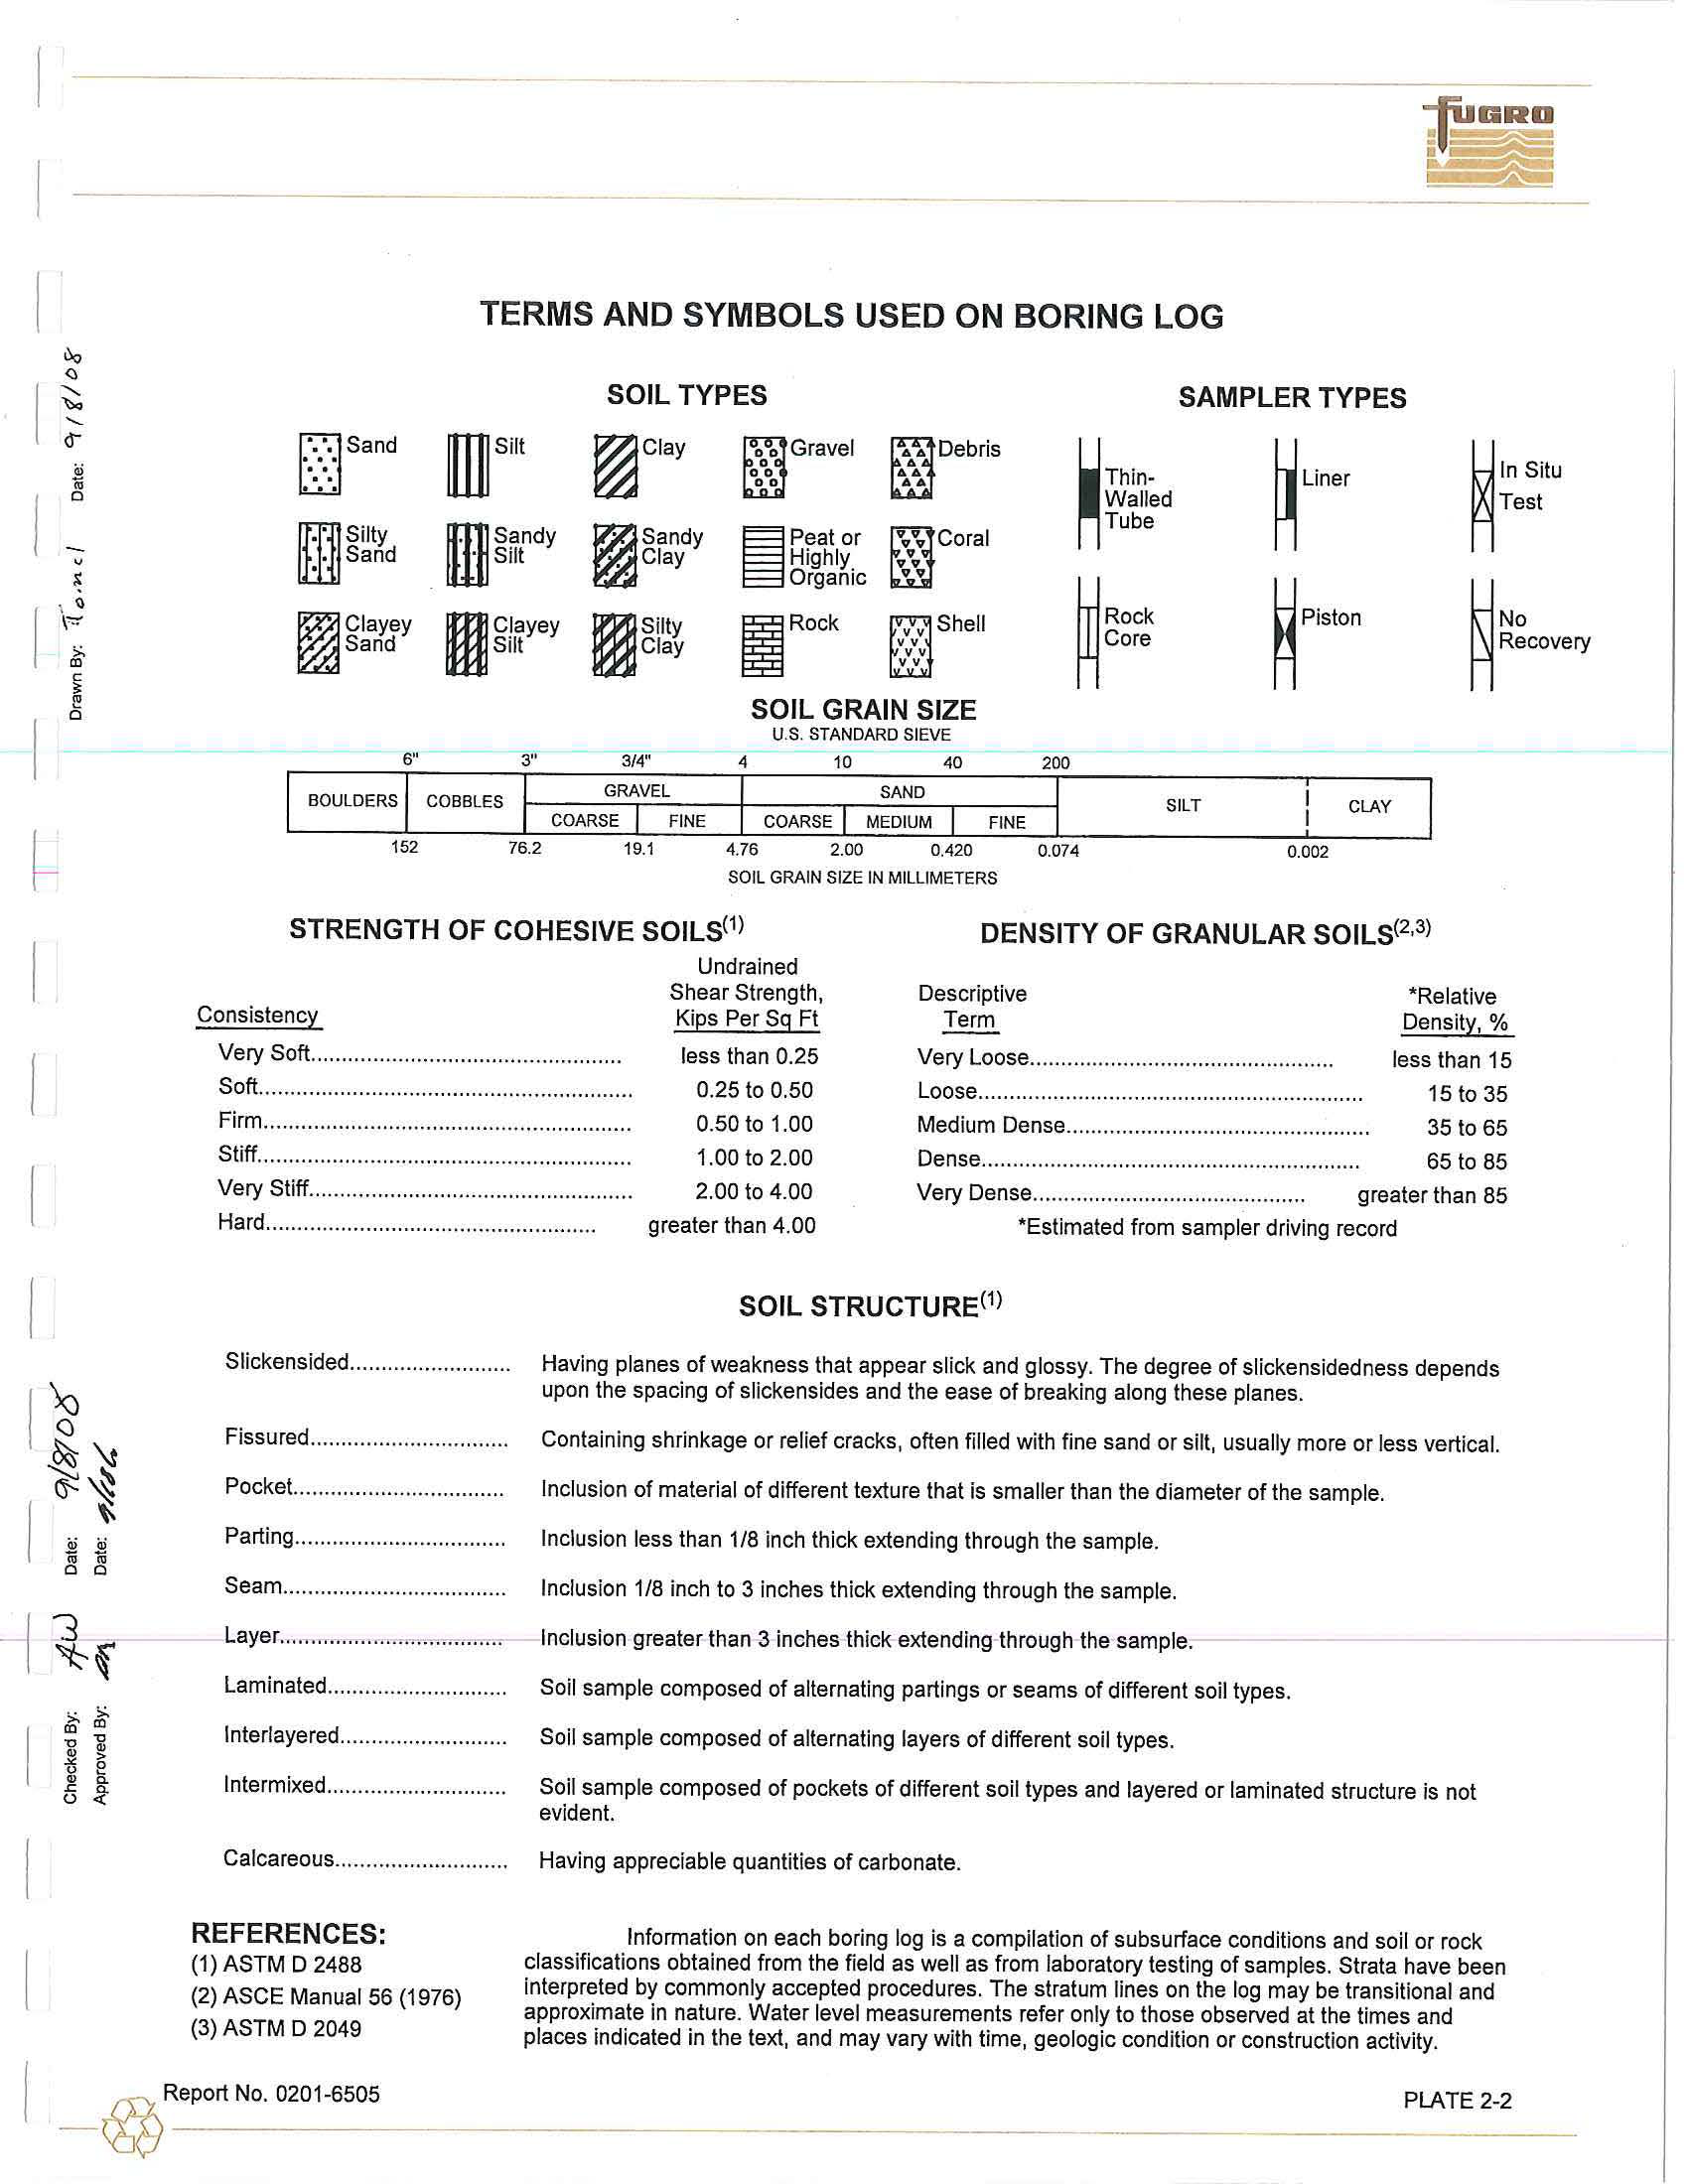
TERMS AND
SYMBOLS
USED ON
BORING
LOG
SOIL TYPES
SAMPLER TYPES
[!Sand
mSilt
~Clay
~Gravel
~Debr
i
s
~Liae,
0
..
~Th;,.
~'" su,
0
...
Walled
Test
Tube
!ill
Silty
msandy
I
Sandy
~Peat or
VI,
Coral
Sand
Silt
C
l
ay
High
l
y
"
Organic
9
v
9
v
~Clayey
mClayey
mSilty
~p;,100
I
Rock
iShell
~Rock
~No
Sand
Silt
Clay
v
Core
Recovery
v
v
SOIL GRAIN SIZE
U.S
.
STANDARD SIEVE
6"
3"
3/4"
4
10
40
200
B
OULDERS
COBBLES
GRAVEL
SAND
SILT
CLAY
COARSE
FINE
COARSE
MEDIUM
FINE
152
76.2
19
.
1
4.76
2.00
0.420
0.074
0.002
SOIL GRAIN SIZE IN
MILLIMETERS
DENSITY OF GRANULAR SOILS(
2,3
l
STRENGTH OF COHESIVE SOILS(
1
l
Undrained
Shear Strength,
Consistency
Kips Per Sg
Ft
Descriptive
*Relative
T
erm
Density,%
Very
Soft....
..............................................
less than
0.25
Very
L
oose..
...............................................
less than
15
Soft...
.........................................................
0.25
to
0.50
Loose...
...........................................................
15
to 35
Firm.
..........................................................
0.50
to
1.00
Medium Dense.
................................................
35
to
65
Stiff........
....................................................
1.00
to
2.00
Dense..
...........................................................
65
to
85
Very Stiff...
.................................................
2.00
to
4
.0
0
Very Dense
............................................
greater than
85
*Estimated from sampler driving record
Hard.
....................................................
greater than
4.00
SOIL STRUCTURE(
1
l
Slickensided..
........................
Having planes of weakness that
appear
slick and glossy. The degree
of slickensidedness
depends
upon the
spacing
of slickensides and the ease of breaking along these planes.
Fissured.............
...................
Containing shrinkage
or relief
cracks,
often filled with fine sand
or silt,
usually more or
less
vertical.
Pocket....
..............................
Inclusion of material
of
different texture
t
hat is smaller than
the
diameter of the
sample.
Parting.
.................................
Inclusion less than 1/8 inch thick extending through the sample.
Seam.......
.............................
Inclusion 1/8 inch to
3 inches
thick extending through the sample.
L
ayer.
...................................
Inclusion
g
r
eater than
3
i
n
ches thick extending through the sample.
Laminated.........
....................
Soi
l
sample composed
of alternating partings
or
seams
of
different soil types
.
l
nterlayered......
.....................
Soil sample composed of alternating layers
of
different
soil
types
.
Intermixed....
.........................
Soil
sample
composed
of
pockets of different so
i
l types and layered or laminated
structure
is not
evident.
Calcareous
............................
REFERENCES:
(1)
ASTM D
2488
(2)
ASCE
Manual
56 (1976)
(3)
ASTM D
2049
Having appreciable quantities
of
carbonate.
I
nformation
on each boring
log
is a compi
l
ation of subsurface conditions and soil or rock
classifications obtained from the field as
well
as from
laboratory
testing of samp
l
es.
Strata
have been
i
n
te
r
preted
by
commonly accepted
procedures.
The stratum lines on the log may
be t
r
ansitiona
l
and
approximate in
nature.
Water level measurements
refer
on
l
y
to those observed
at
the times and
p
l
aces indicated in
the
text, and may
vary
with time, geologic
condition
or construction activ
i
ty.
I
-
@
Report No.
0201-6505
PLATE
2-2
+
l
!
+
~
~
+
•
•
•
C.INC. Si:
1
04
§
LI
NE
S::!103
>,.,._
§
0
,,
Report
No. 0201-6505
-
\~
--
----
"'
"'
"'
no
"'
"'
'"
no
no
no
no
no
'"
+
I
,
..
-+
"'
,
..
""
,
..
"'
-eLM
,
..
"'
"
'
""
"F
,
..
~
!!
~
!
~
§
-
-
-
'
"'
'"'
=
"'
'"'
"'
"'
'
"'
-
'"'
SPM #2
Anchor Leg #6
i
1
(J)
.
.....
'
"
"
"
...
,,.
"'
...
"'
"
'
SPM#2
PLET
...
~
l!
~
'
"
~
0
-+
--
f+
+
e
-i---
=
'"'
'"'
=
.,.,
,
..
..,
-
Offshore
Terminal
=
'"'
ll
l!
~
~
~
§
""
"
"
-
'"
""
""
..
""
..
"
"
........
SPM#1 Anchor Leg #2
@
-t
""
""'
""'
~
.........
ll
...
'"'
-
+
'
"
~
""
'"
.
--
~~
@
SPM #1 PLET
-
""
'"'
...
'
"'
""'
..,
'"'
..,
l!
ij
l
I
+
+
..
"'
........
"'
"'
...
l!
~
!
~
'"'
'"'
'"'
~.
'"'
'
"'
'
"'
'
"'
--
!!
"
'--
~
"'
"'
~
""
"'
11,
,.
'"
;
~
~;
•
•
"'
•
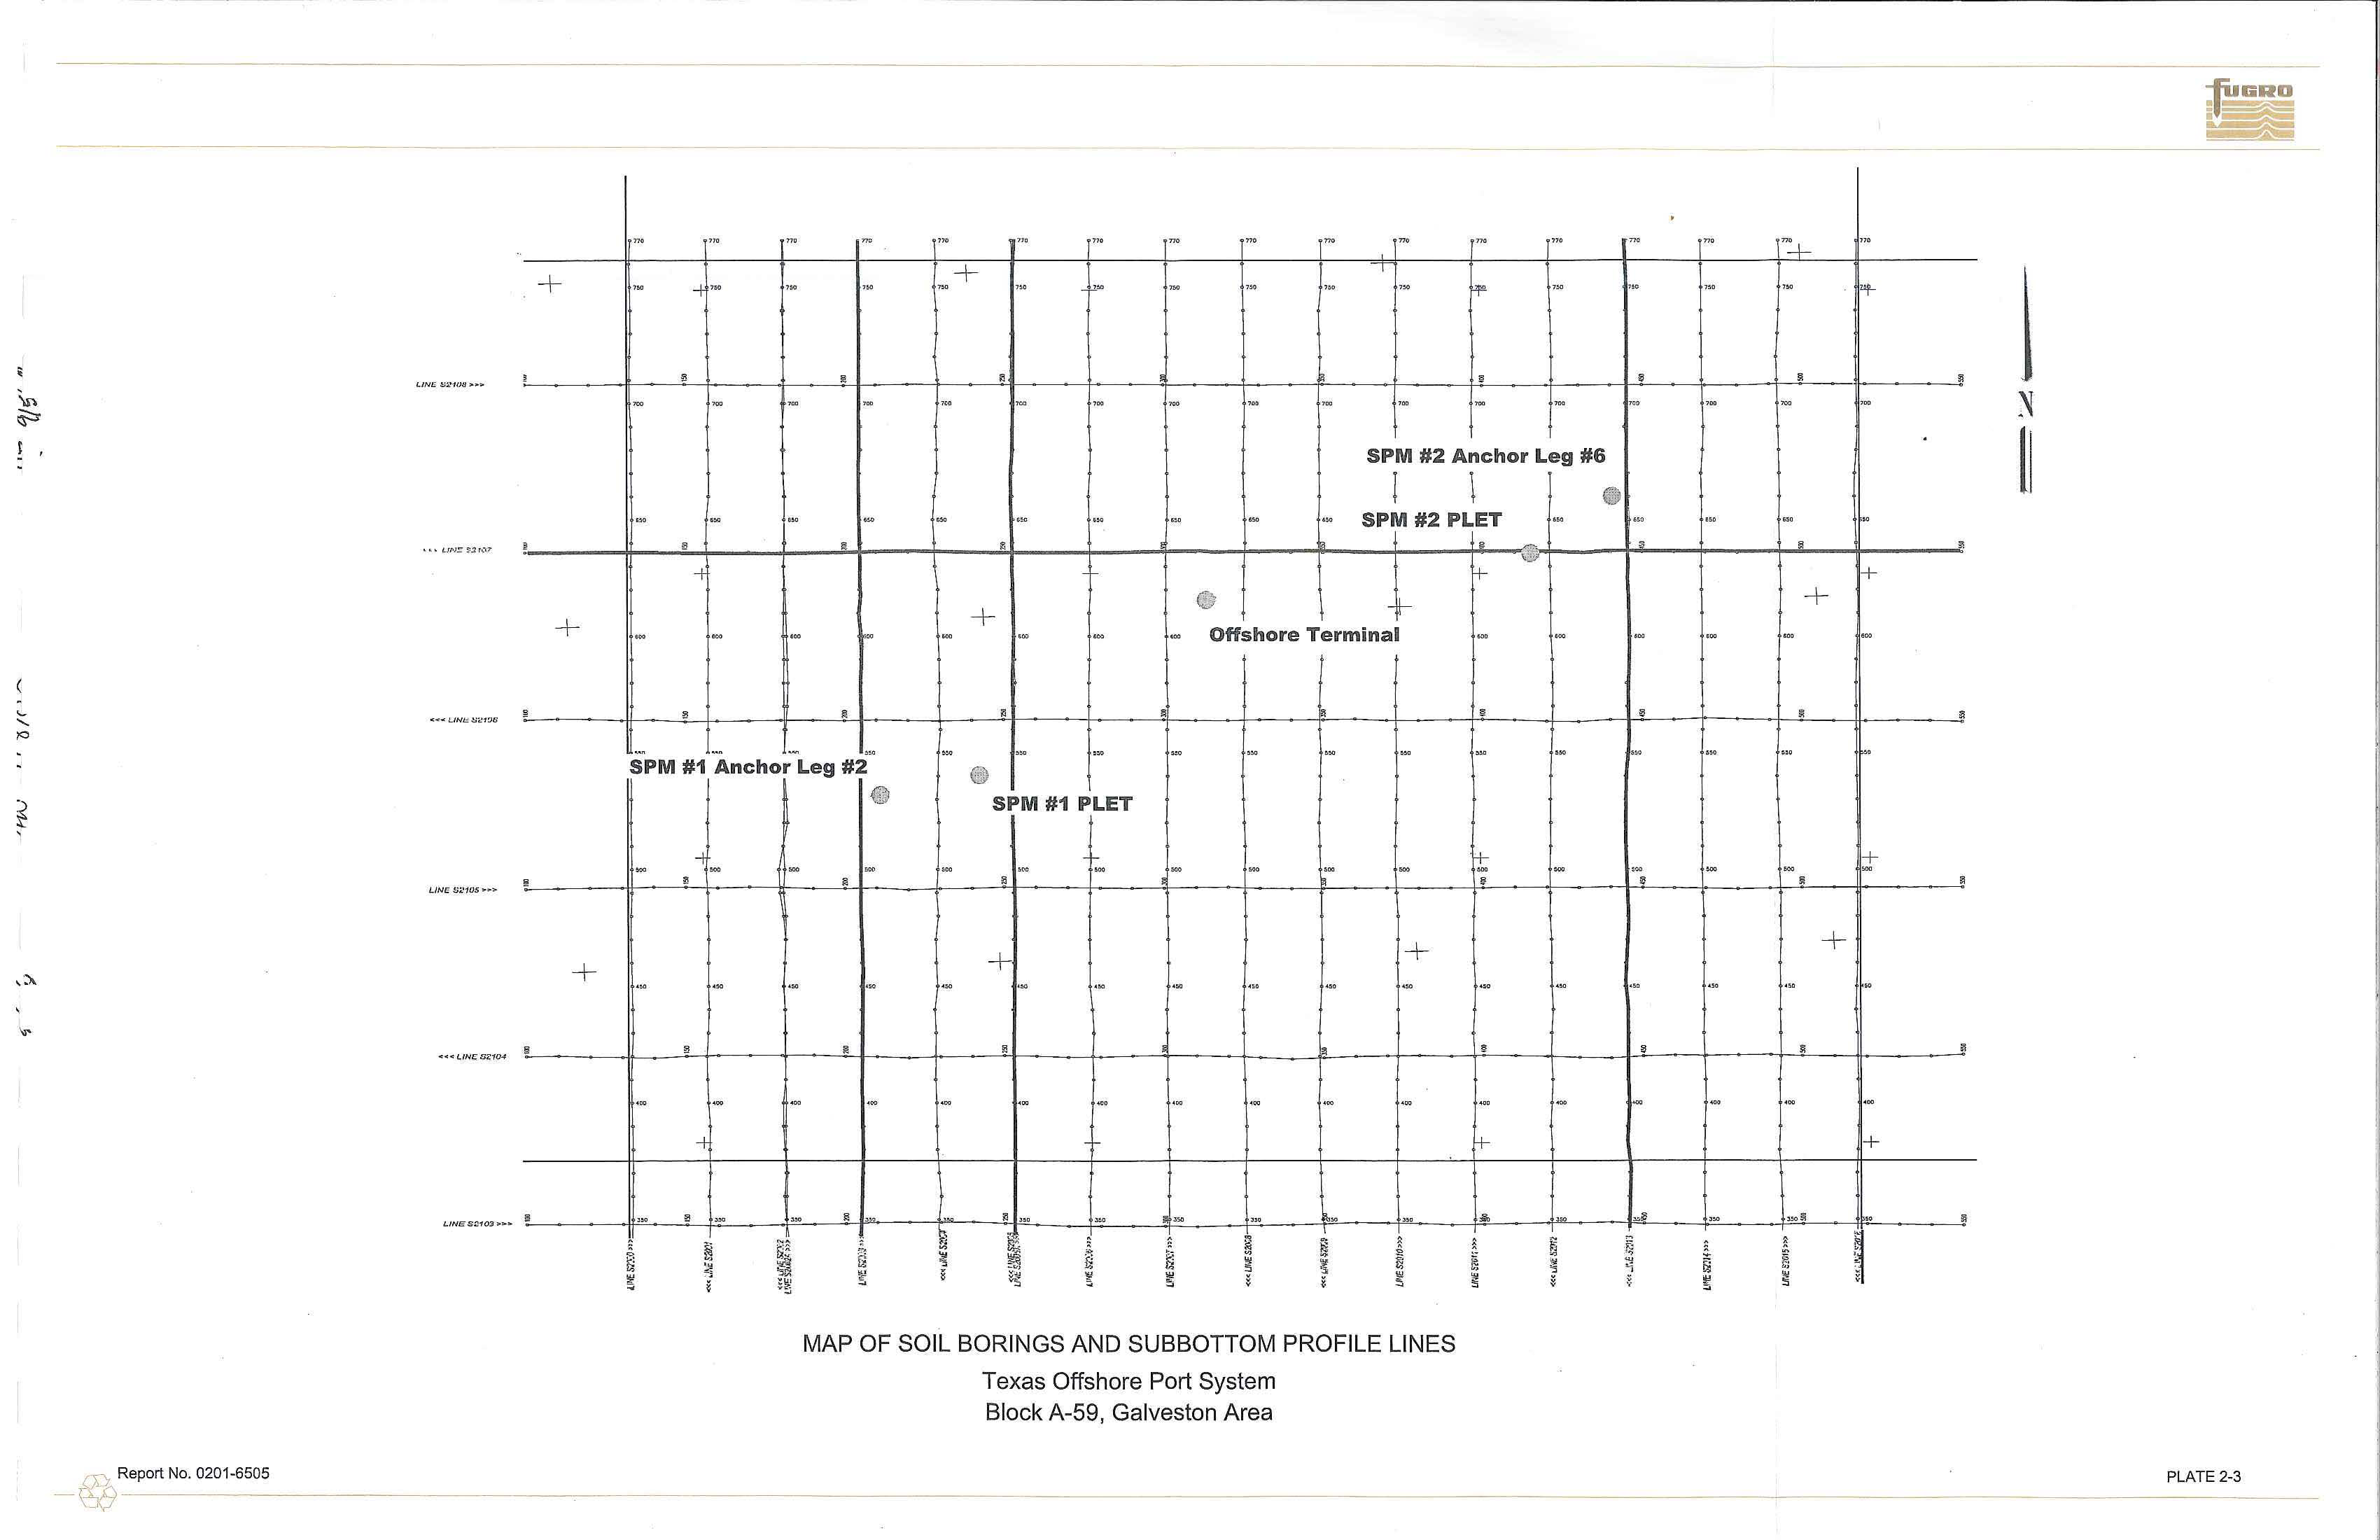
MAP OF
SOIL BORINGS
AND SUBBOTTOM
PROFILE LINES
Texas Offshore Port System
Block
A
-
59, Galveston Area
t
""'
!I
....
§
-
=
f+
A
"'
.
no
no
"'+
'"
7!
1)
'"
,
..
'+
ll
!!
~
"'
'"'
""
""
'
"
.......
~
~
~
+
+
"'
'
"'
"'
..,
ll
~
~
'
"
,
..
""
..
+
'"'
..,
..,
""'
ll
~
~
+
.........
ll
!!
~
-
-
'"'
'
"'
+
..ll
'
"
""~
..
~
•
"'
PLATE
2-3
-------
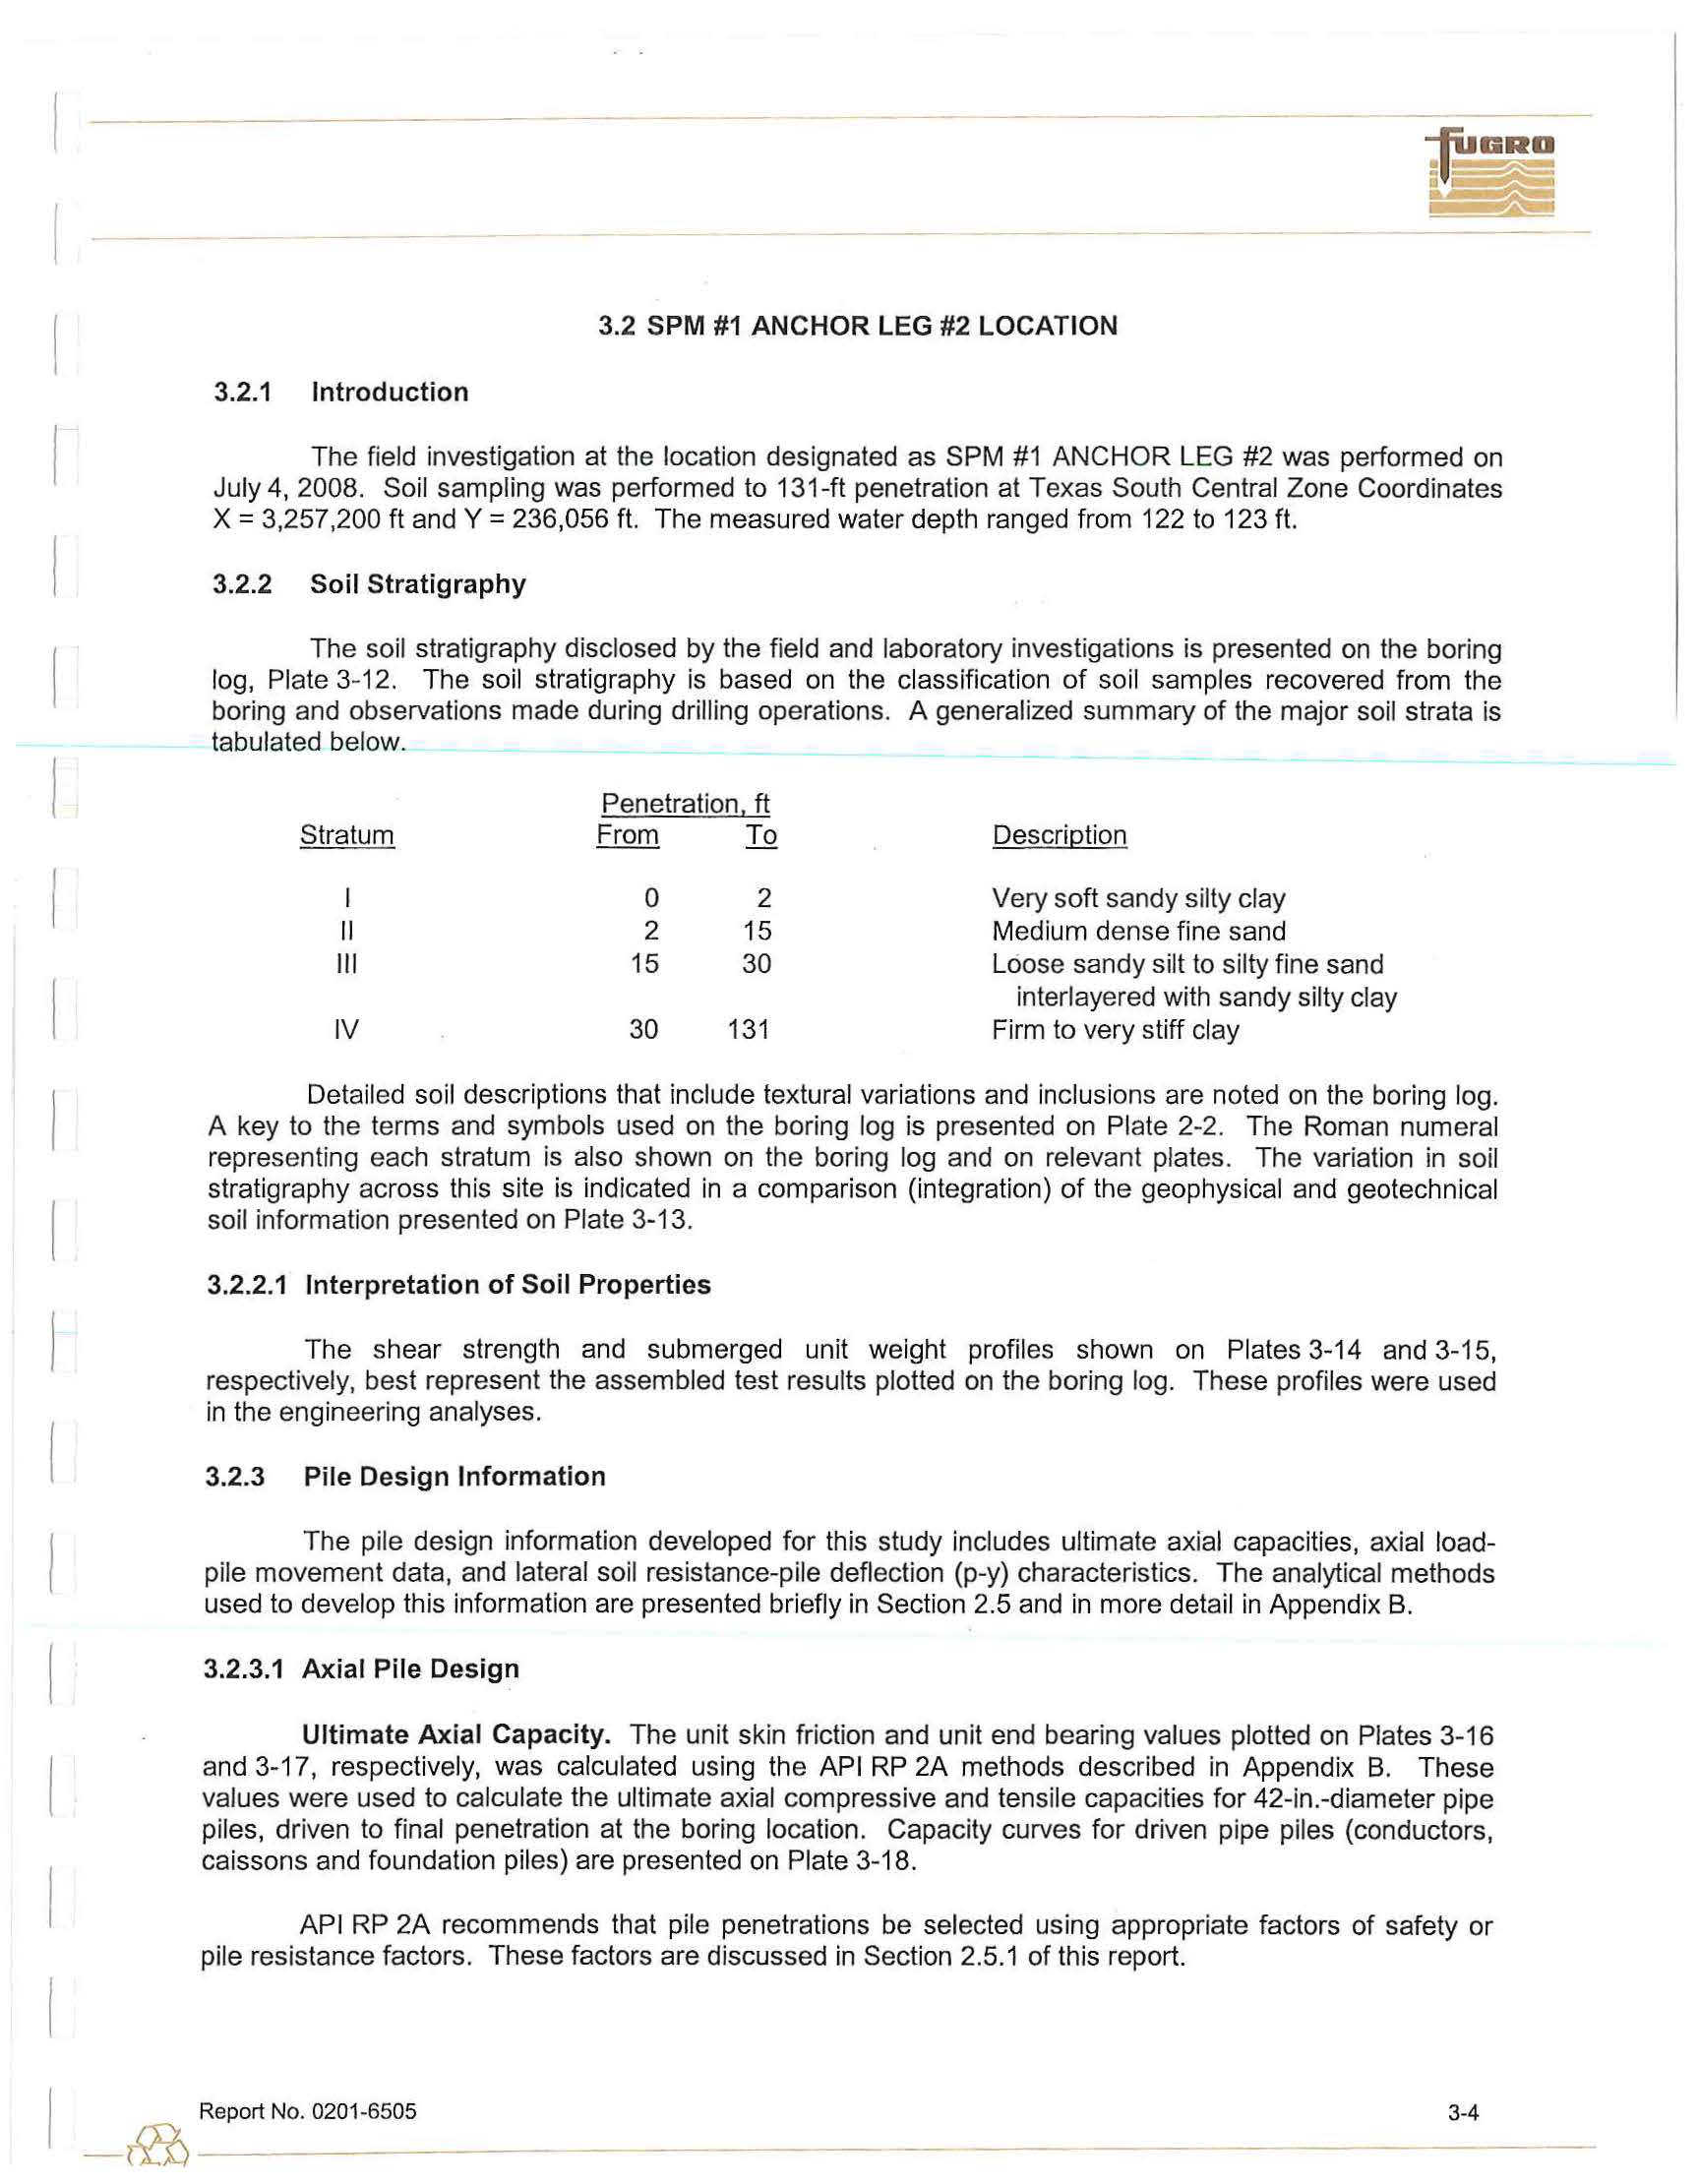
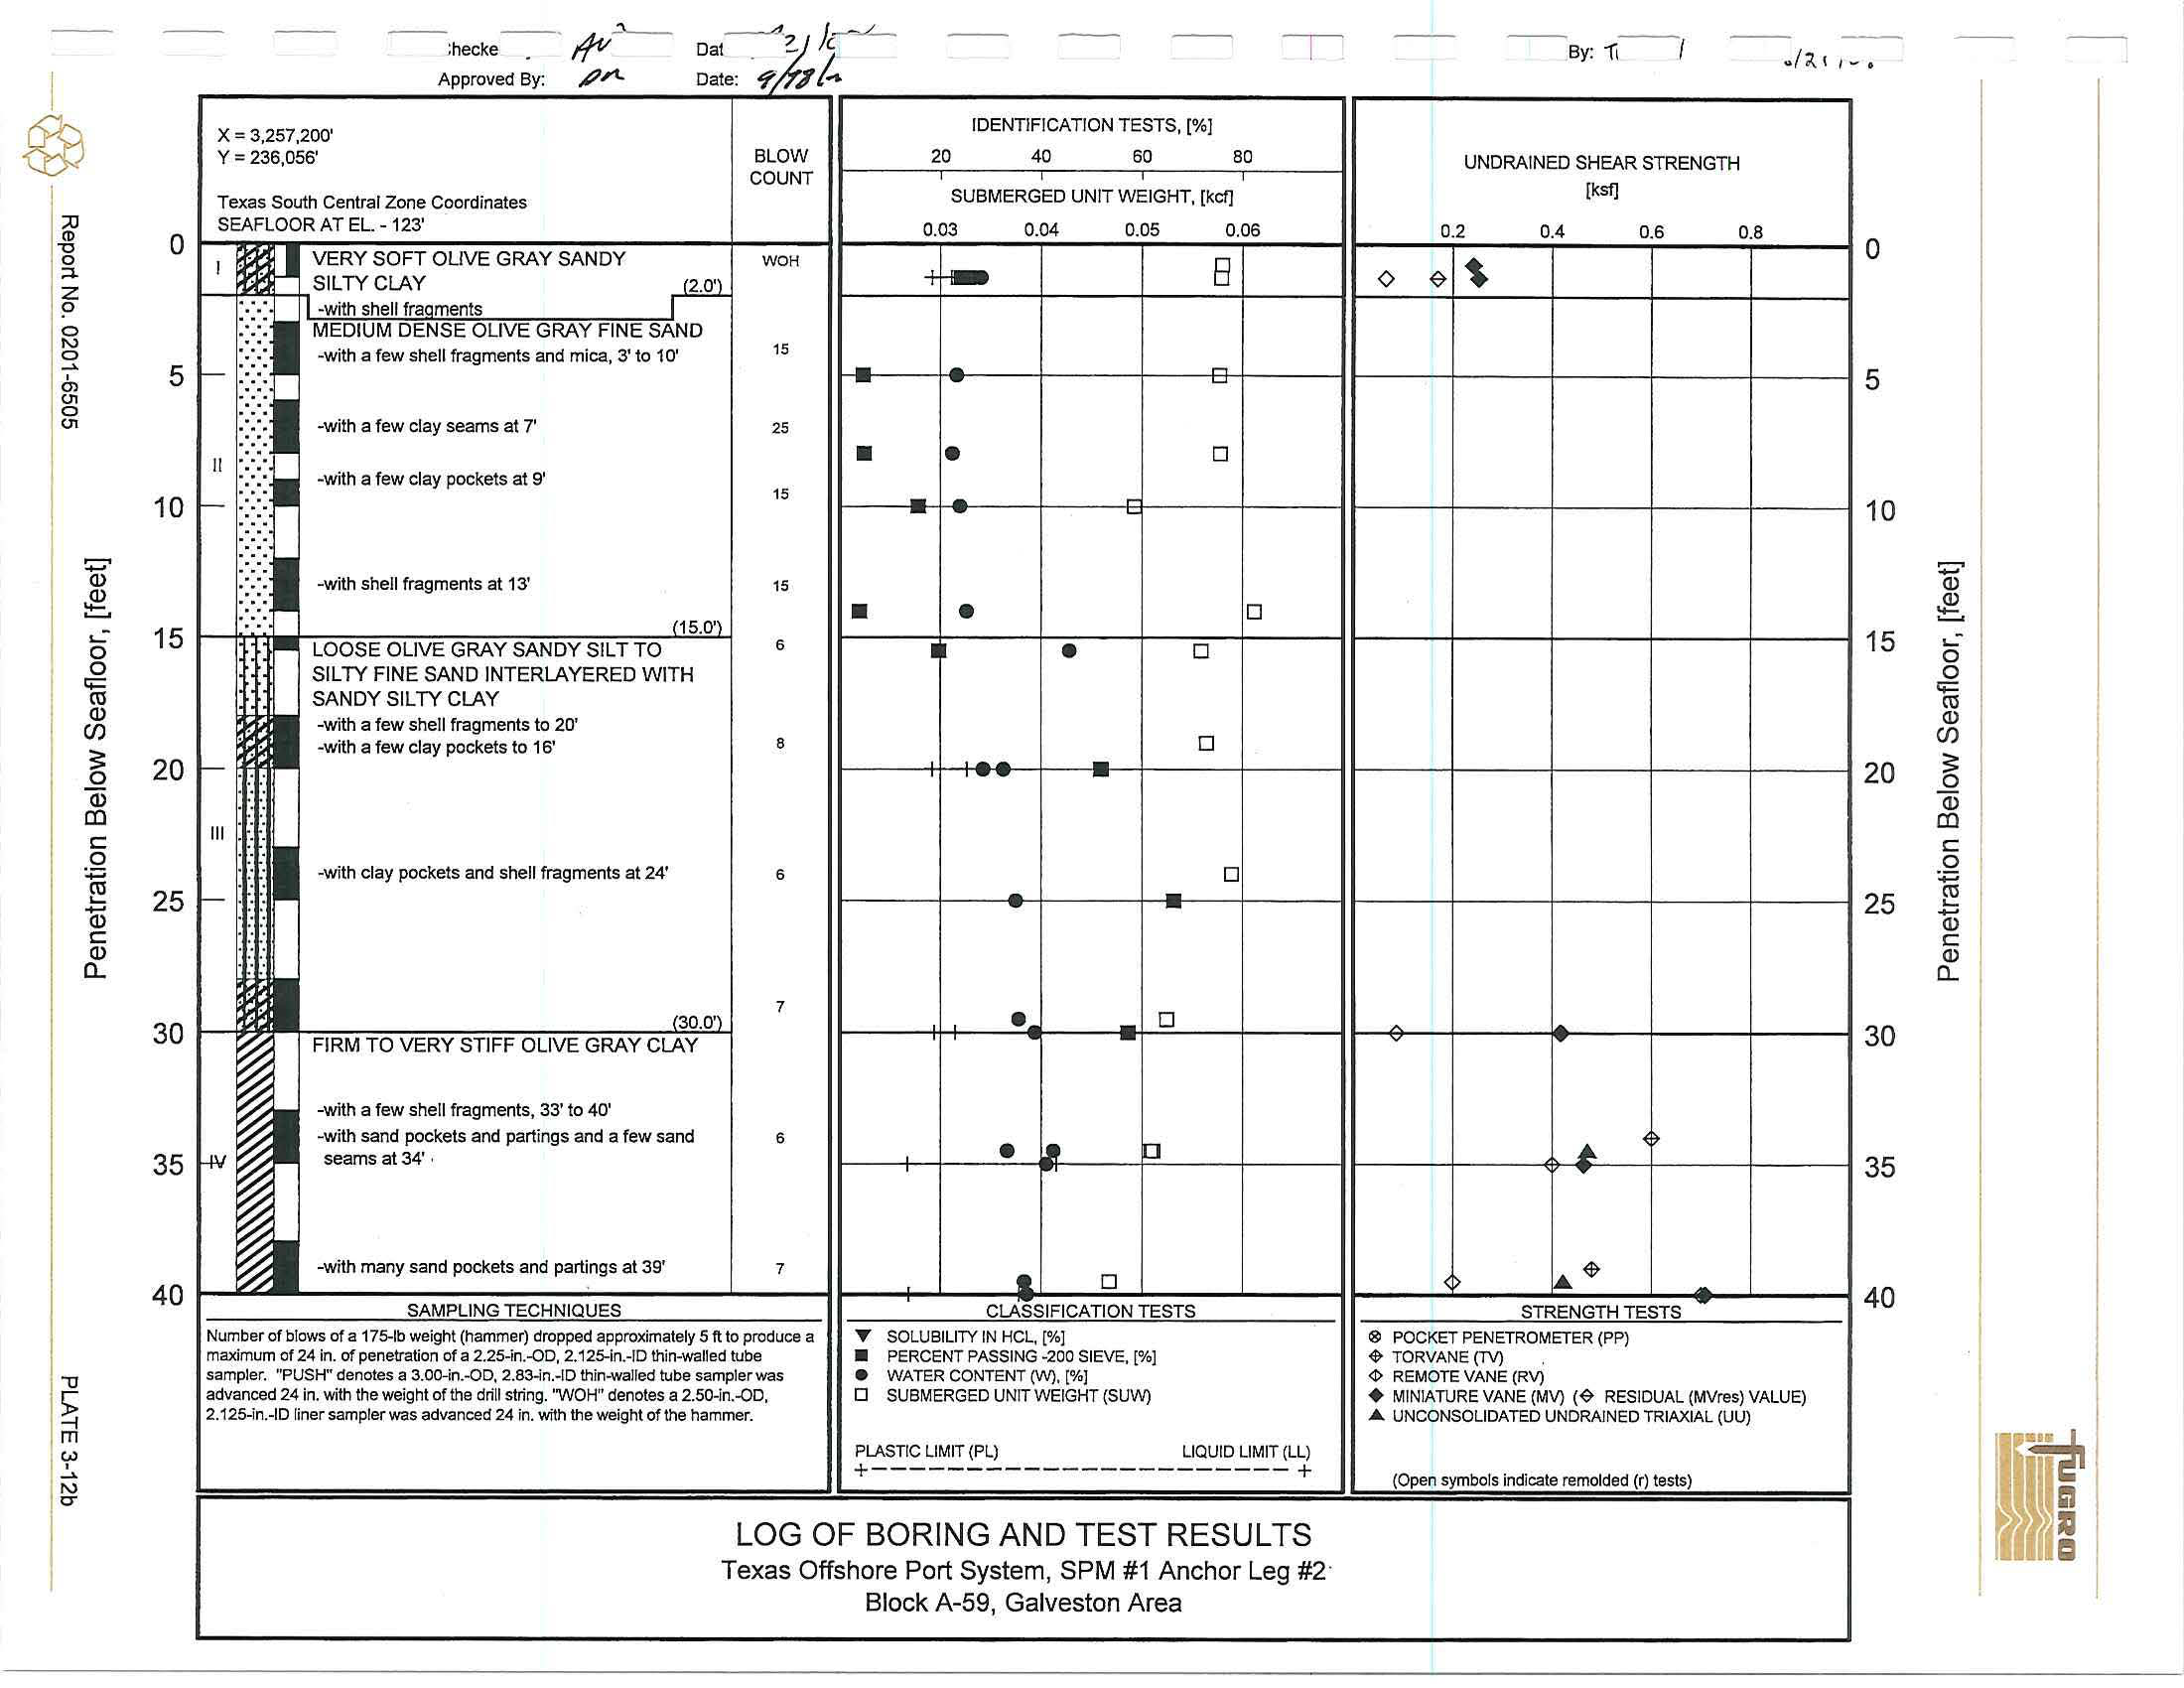
3.2 SPM #1 ANCHOR LEG #2 LOCATION
3
.
2.1
I
ntroduction
The
field
investigation
at the location
designated
as
SPM #1
ANCHOR
LEG #2 was
performed
on
July
4, 2008. So
i
l sampling was performed
to
131-ft penetration at
Te
xas
South Central Zone Coordinates
X
=
3,257,200
ft
and
Y
=
236,056
ft
.
The measured
water
depth ranged from
122
to 123 ft.
3.2
.
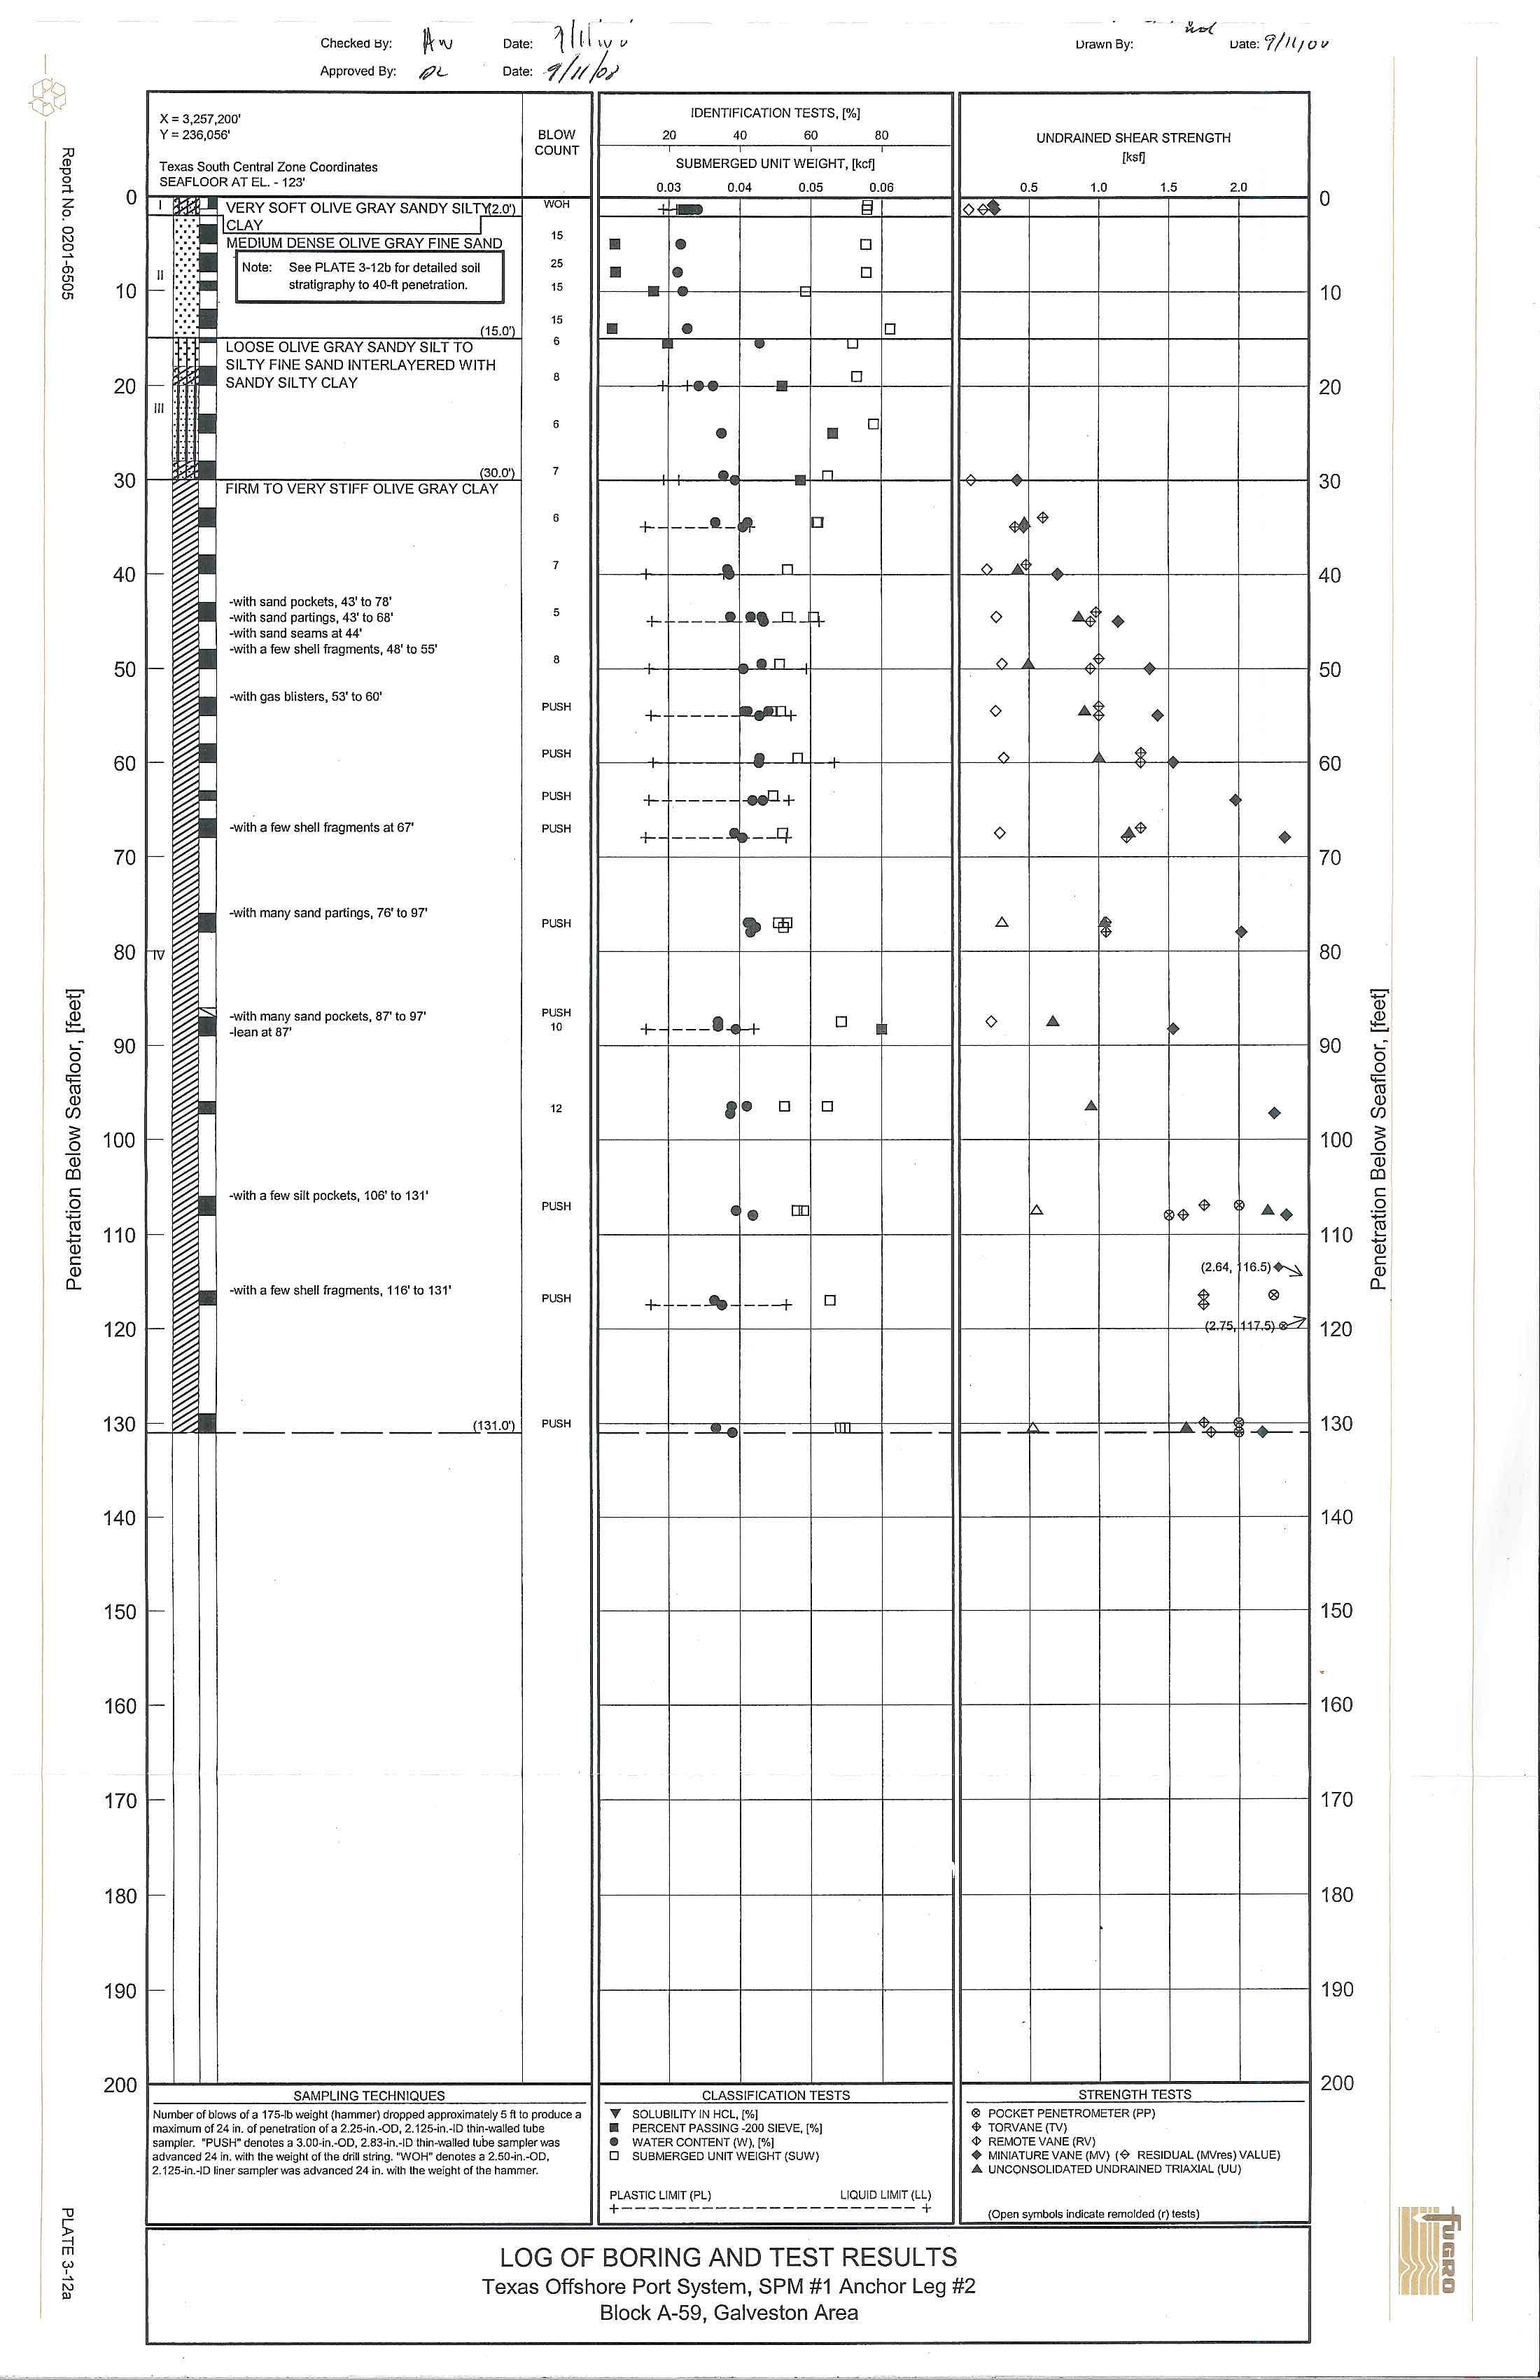
2 Soil
Stratigraphy
The
soil stratigraphy
disclosed by the
field and laboratory investigations is presented on
the
boring
log,
Plate 3
-
12.
The
soil stratigraphy
is
based
on
the
classification
of soil samples
recovered from the
boring and observations made during
drill
in
g operations
.
A
generalized summary
of the major
soil strata is
tabulated below.
Penetration, ft
Stratum
From
To
Description
0
2
Very
so
ft
sandy
silty
clay
II
2
15
M
edi
um
dense fine sand
111
15
30
L
oose sandy silt to silty
fine sand
interlayered with
sa
ndy
silty clay
IV
30
131
Firm
to very stiff clay
Detail
ed
soil
descriptions that
include
textural
variations and
inclu
s
ion
s
are
noted on
the
boring log.
A key to the terms and symbols
used
on
the boring
log is present
ed
on Pl
a
te
2-2
.
The Roman
numera
l
repre
senti
n
g
each
stratum
is also shown on the
boring
log and on
rele
vant
p
la
t
es.
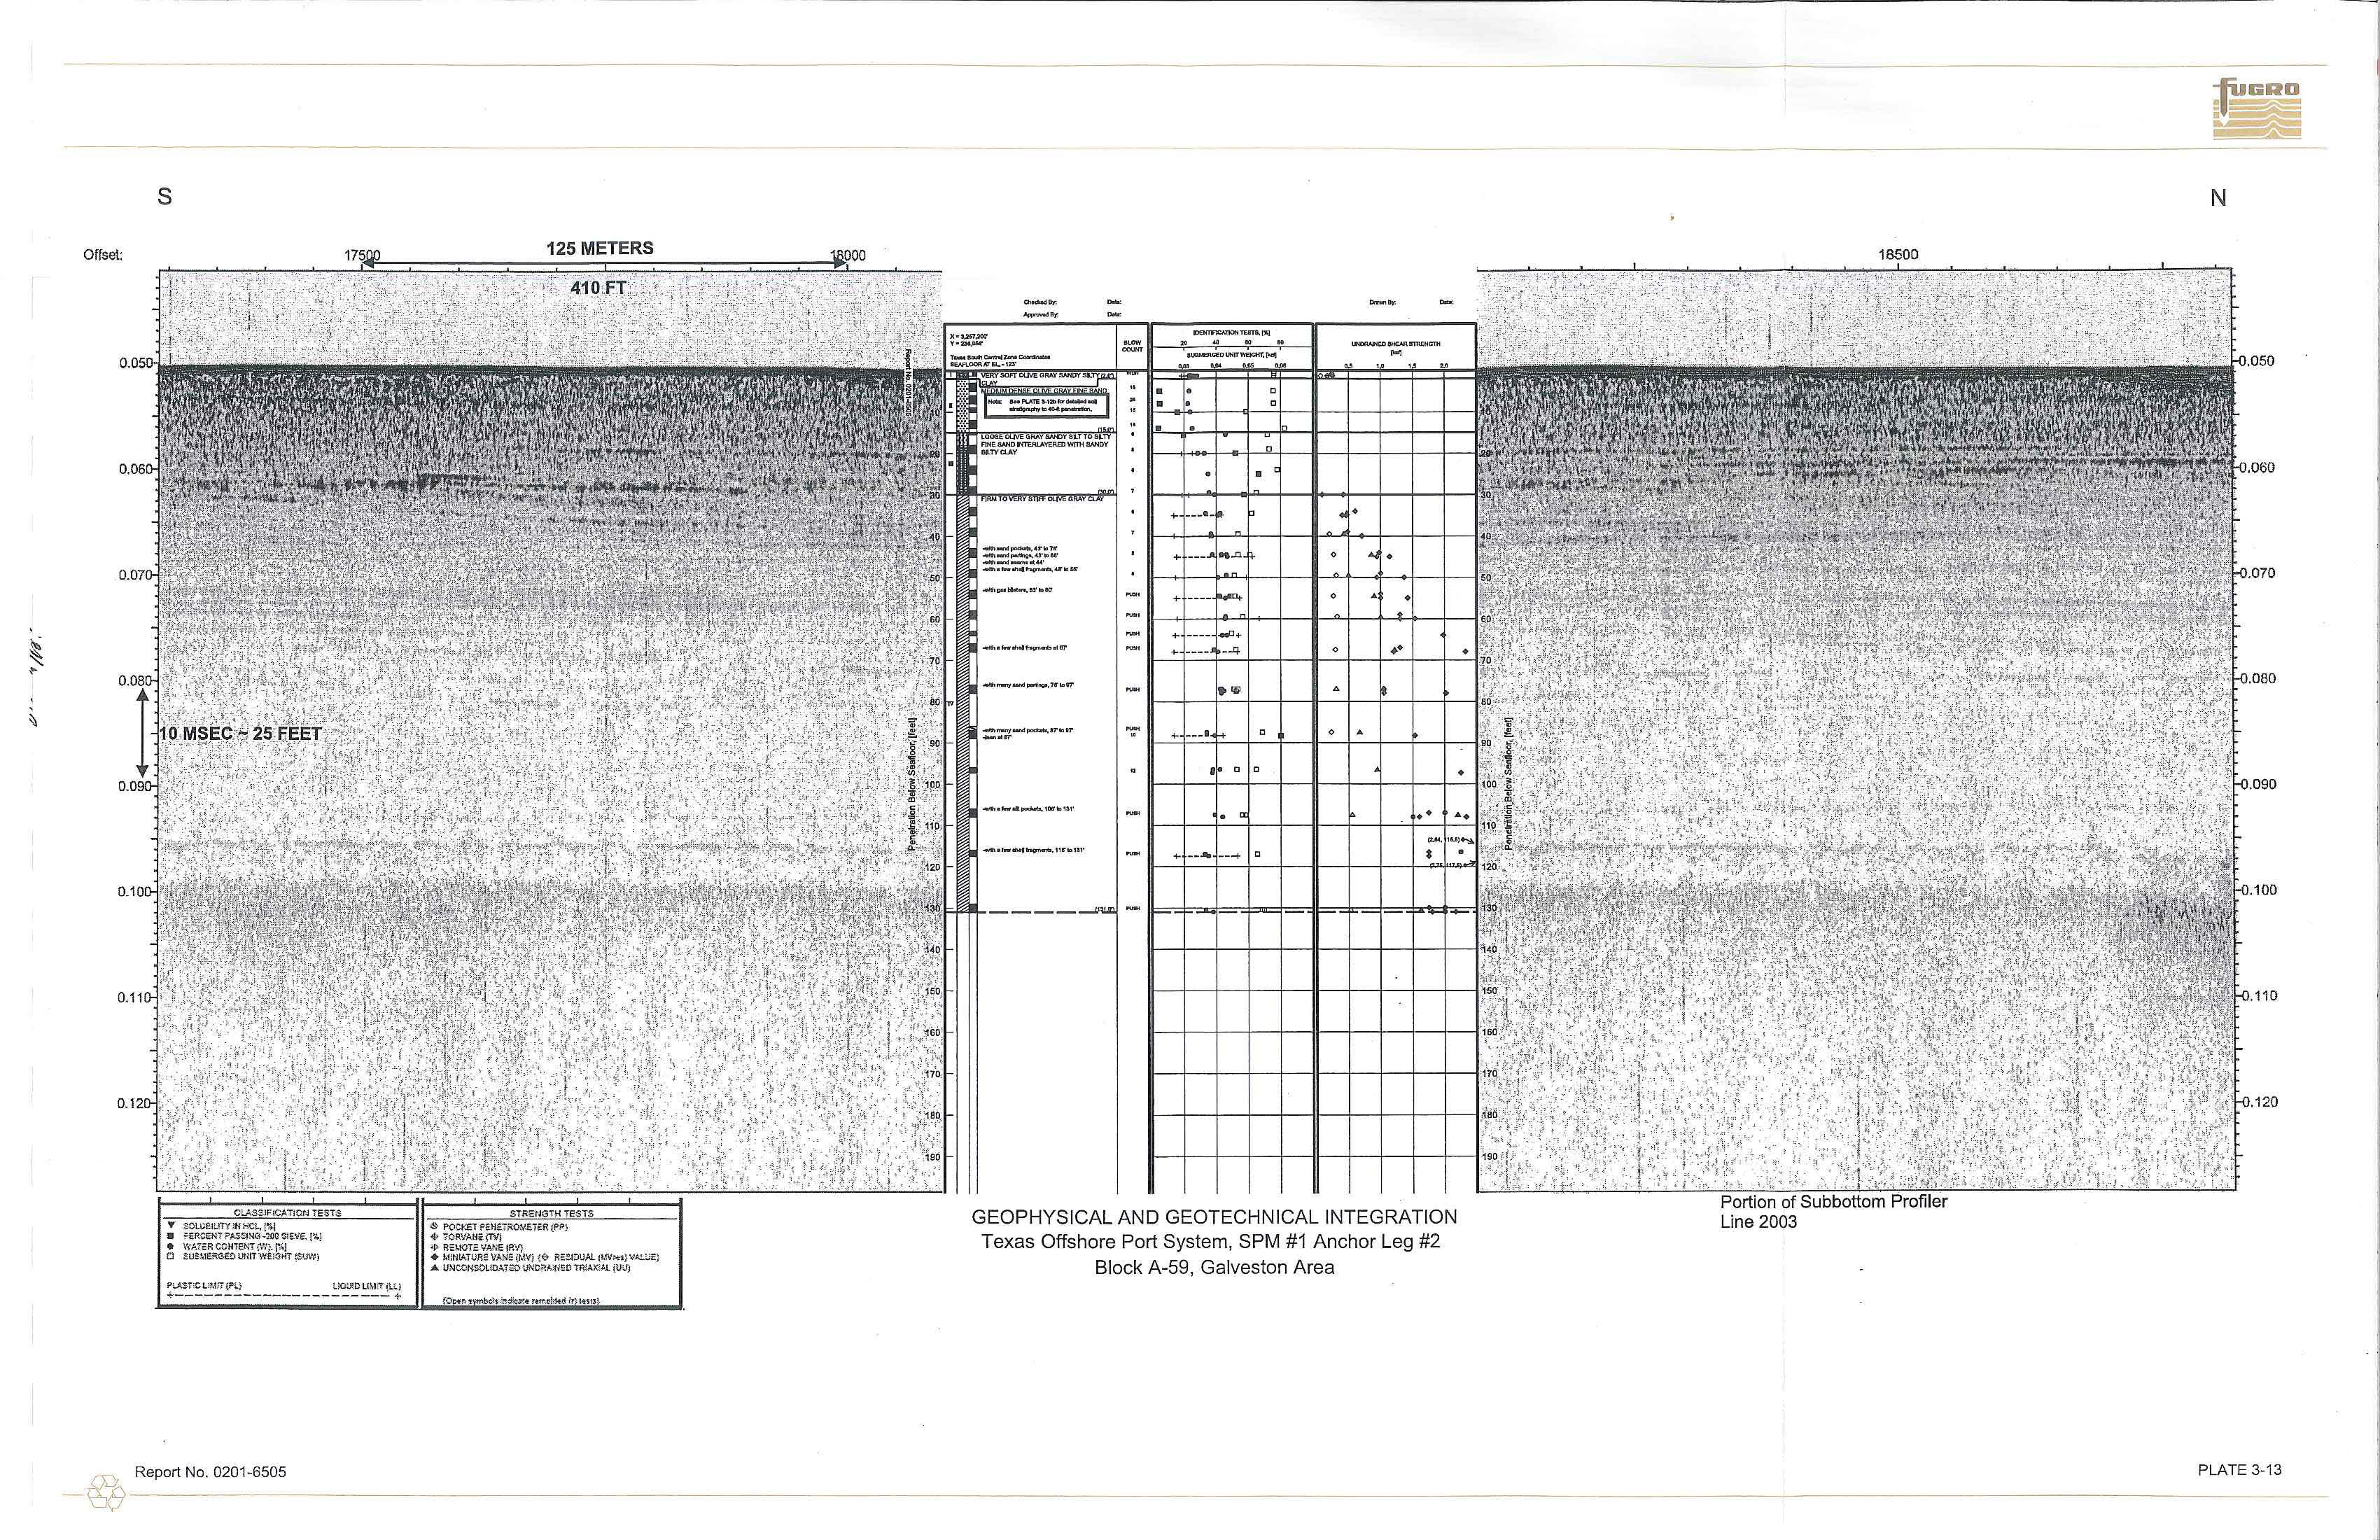
The
variation in soil
stratigraphy across
this
site
is indicated
in
a
comparison (integration) of the
geophysical
and geotechnical
soil information
presented
on
Plate
3-13.
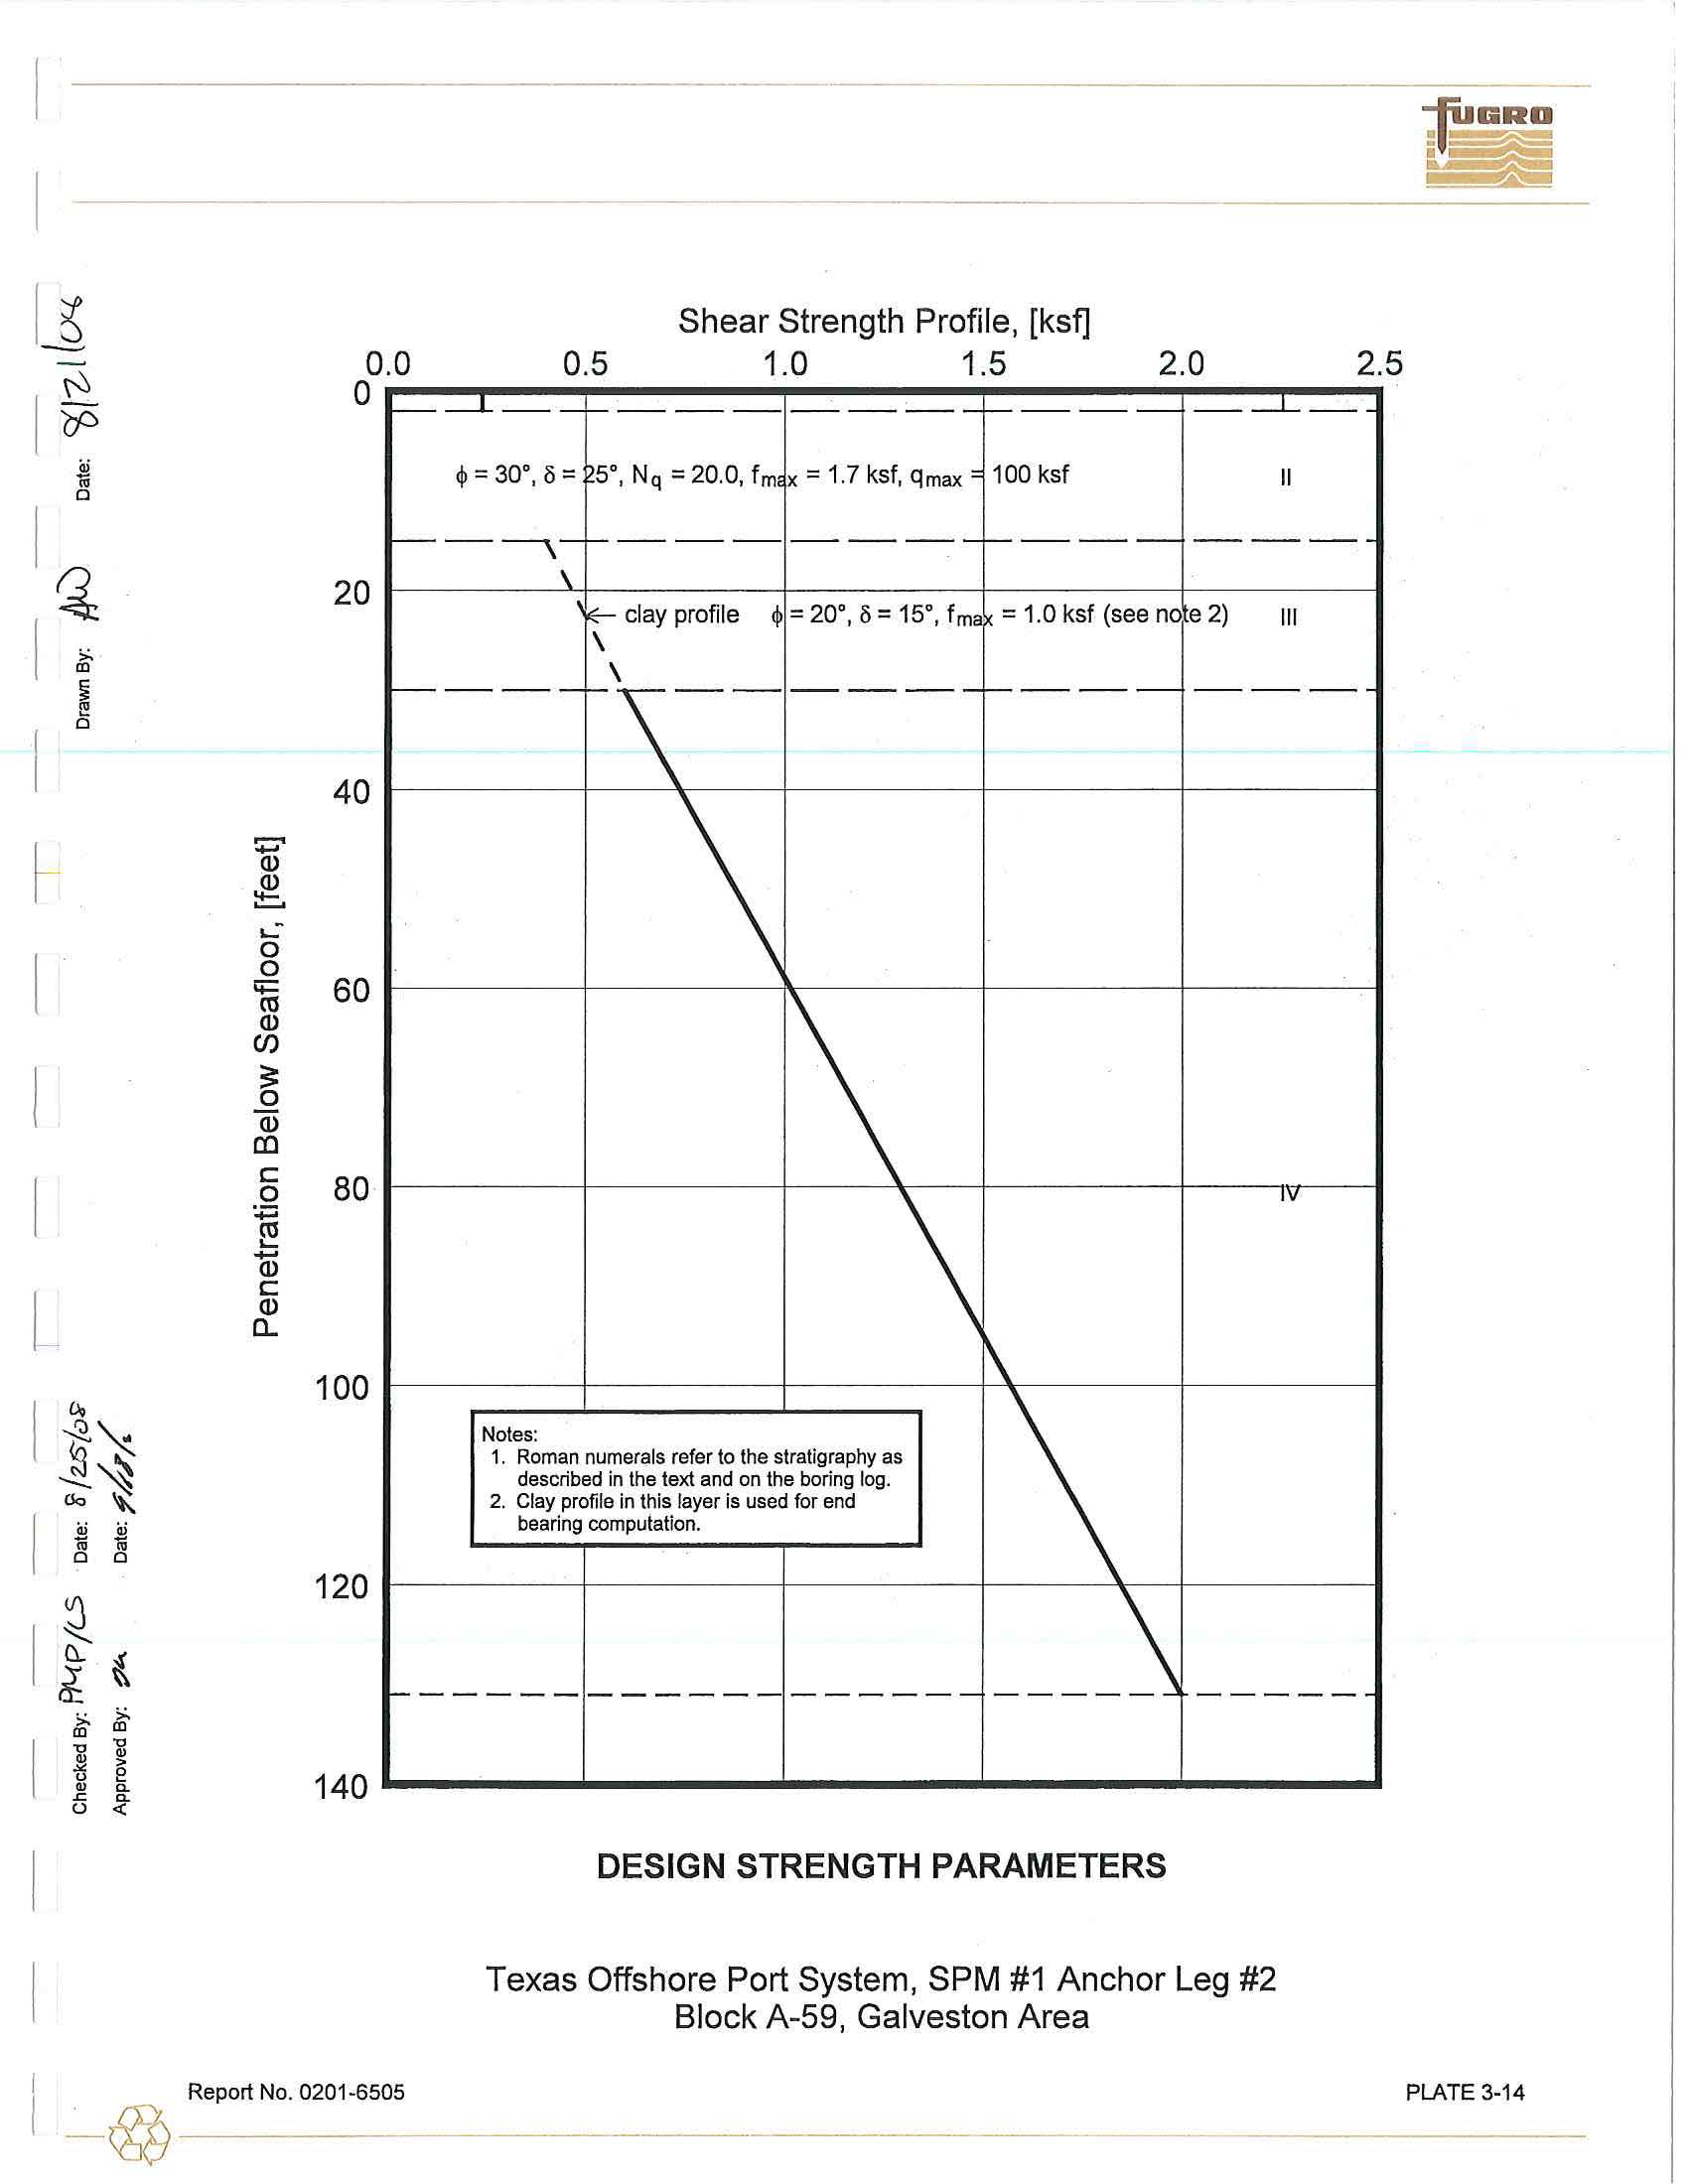
3.2
.
2.1 Interpretation of Soi
l
Propert
i
es
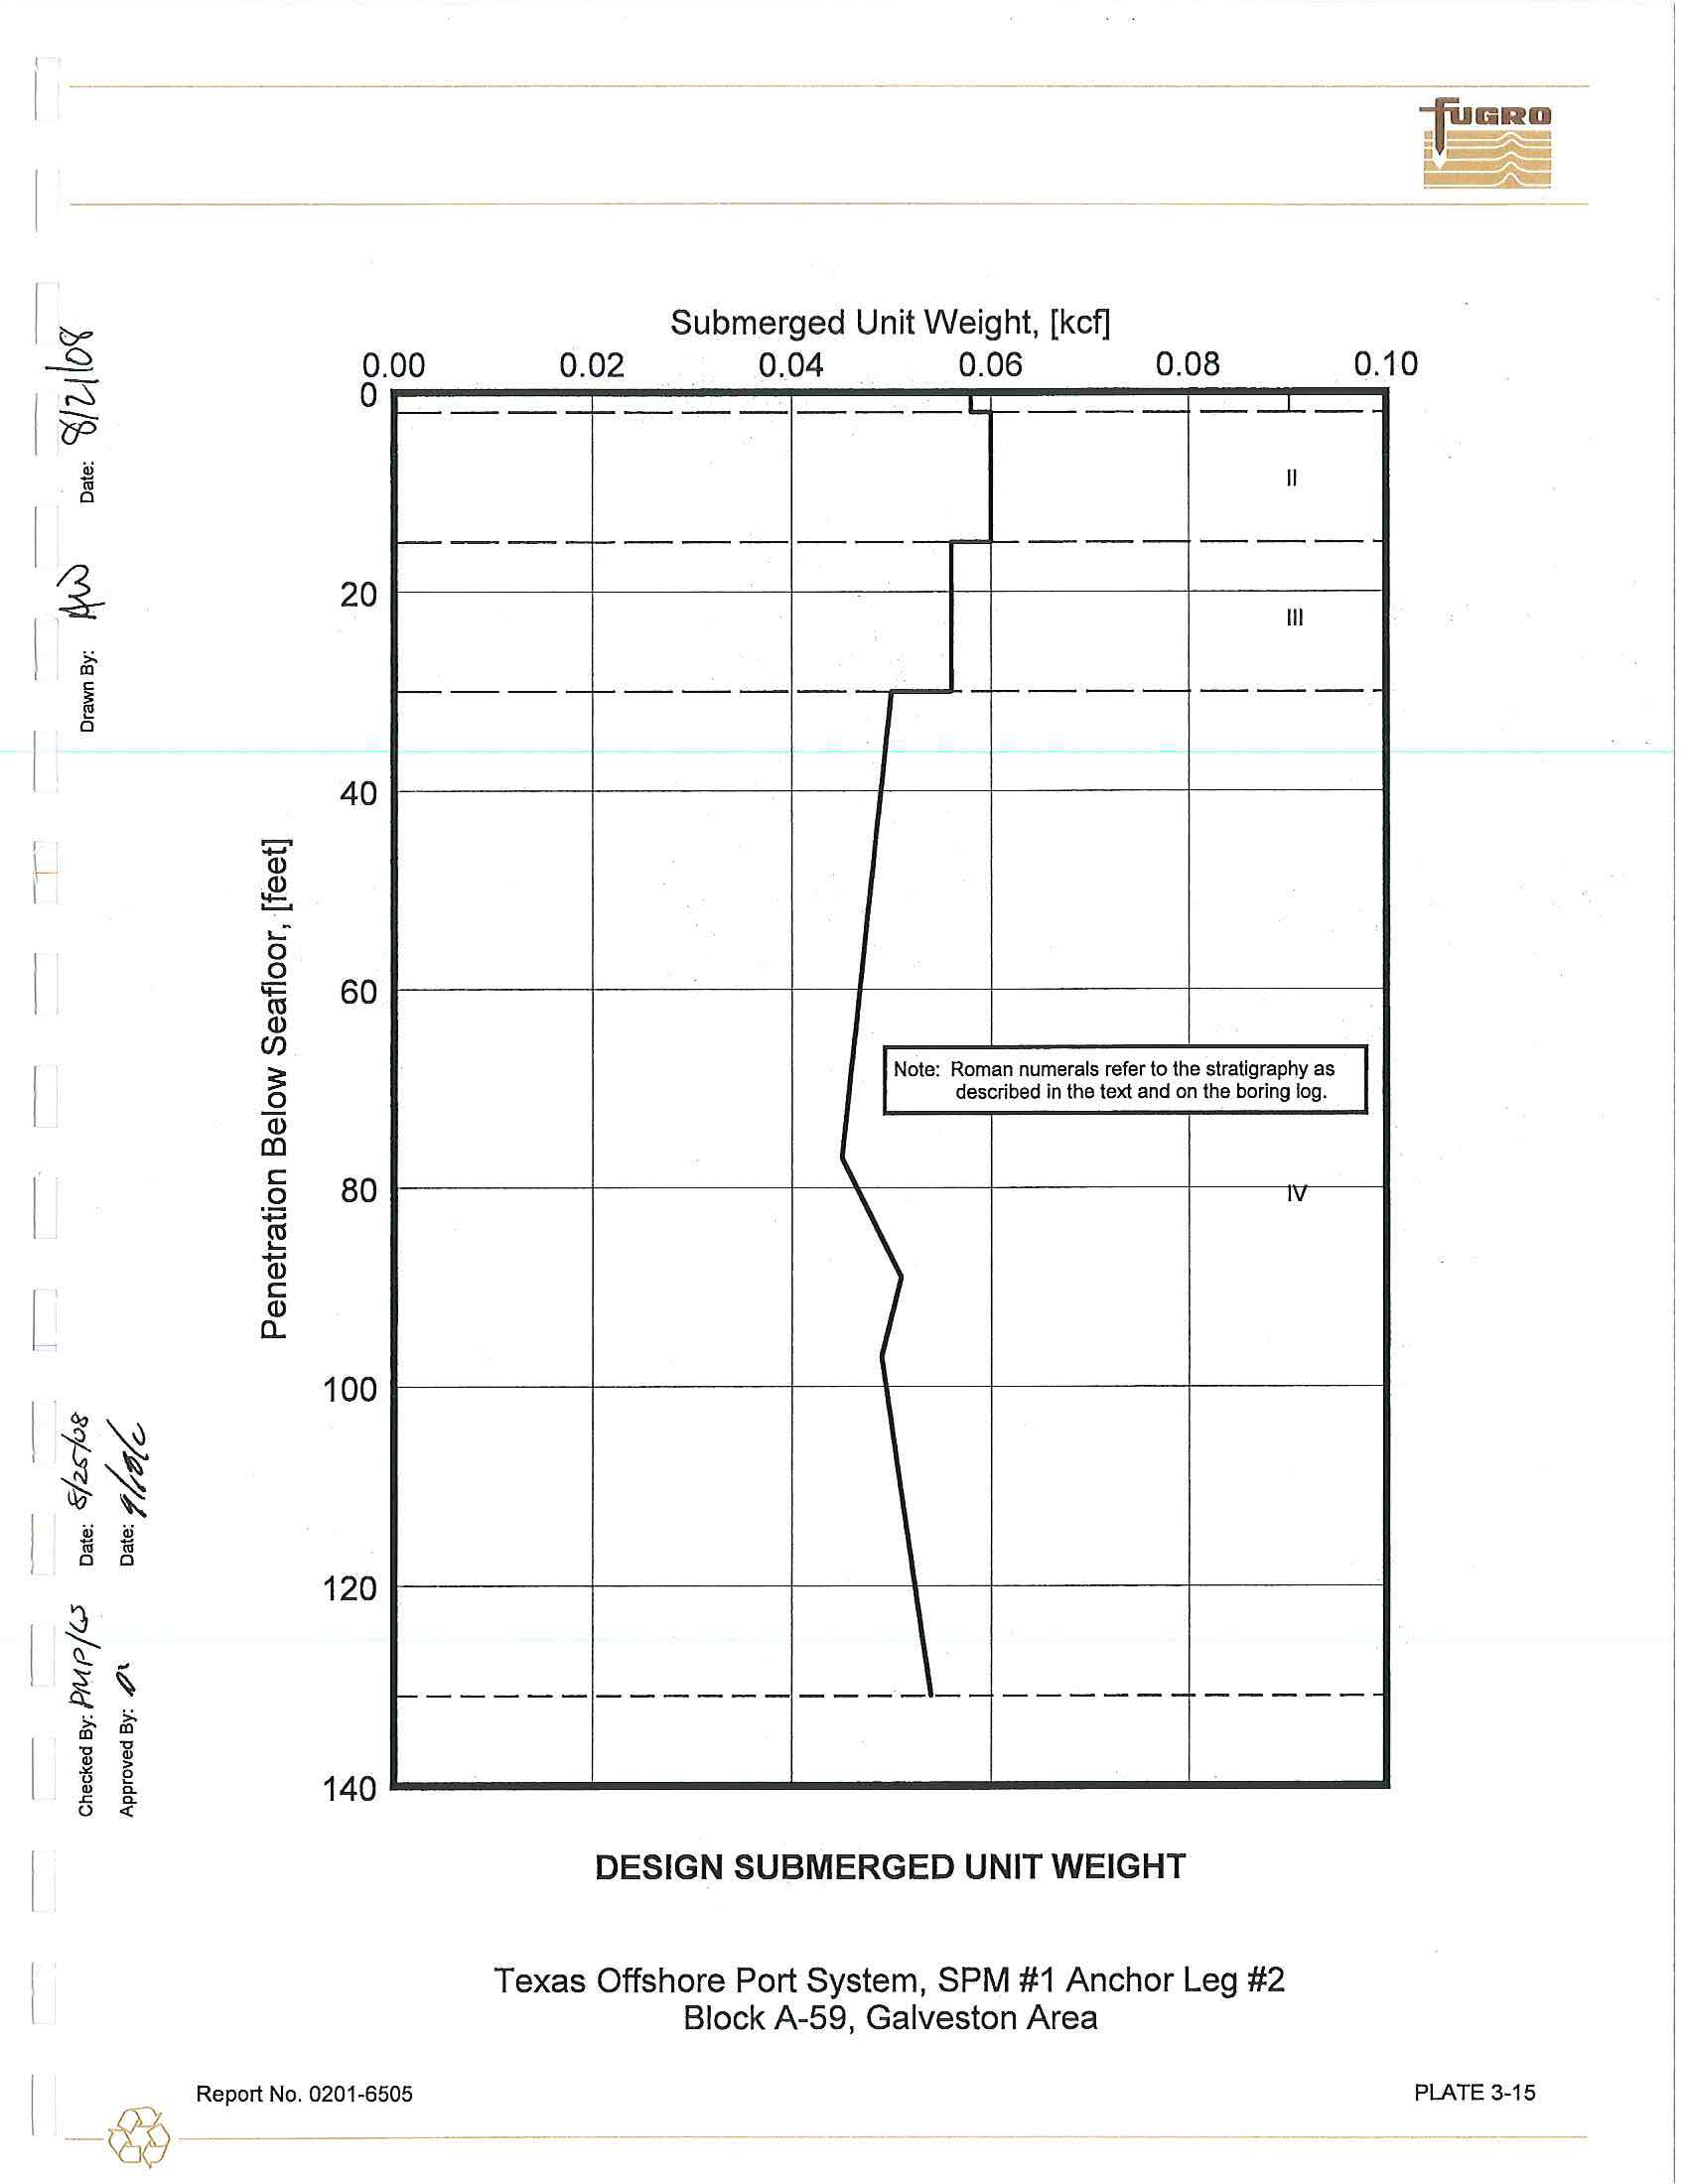
The
shear strength and
submerged unit weight profiles
shown on
Plates 3
-
14 and
3-15,
respectively,
best represent
the assemb
l
ed test
results
plotted on
the
boring log.
These
profiles
were used
in the
engineering
analyses
.
3
.
2.3
Pile Design
I
nformation
The pile
design
information
developed for this study includes ult
i
mate axial capacities, axial
load-
pile movemen
t
data
,
and
lateral
soil
resistance-pile def
l
ection
(p-y)
characteristics.
The analyt
ic
al
methods
used to
develop
this information are presented briefly
in
Section 2.5 and
in more det
a
il
in
Appendix B
.
3
.
2.3
.
1 Axial Pile Design
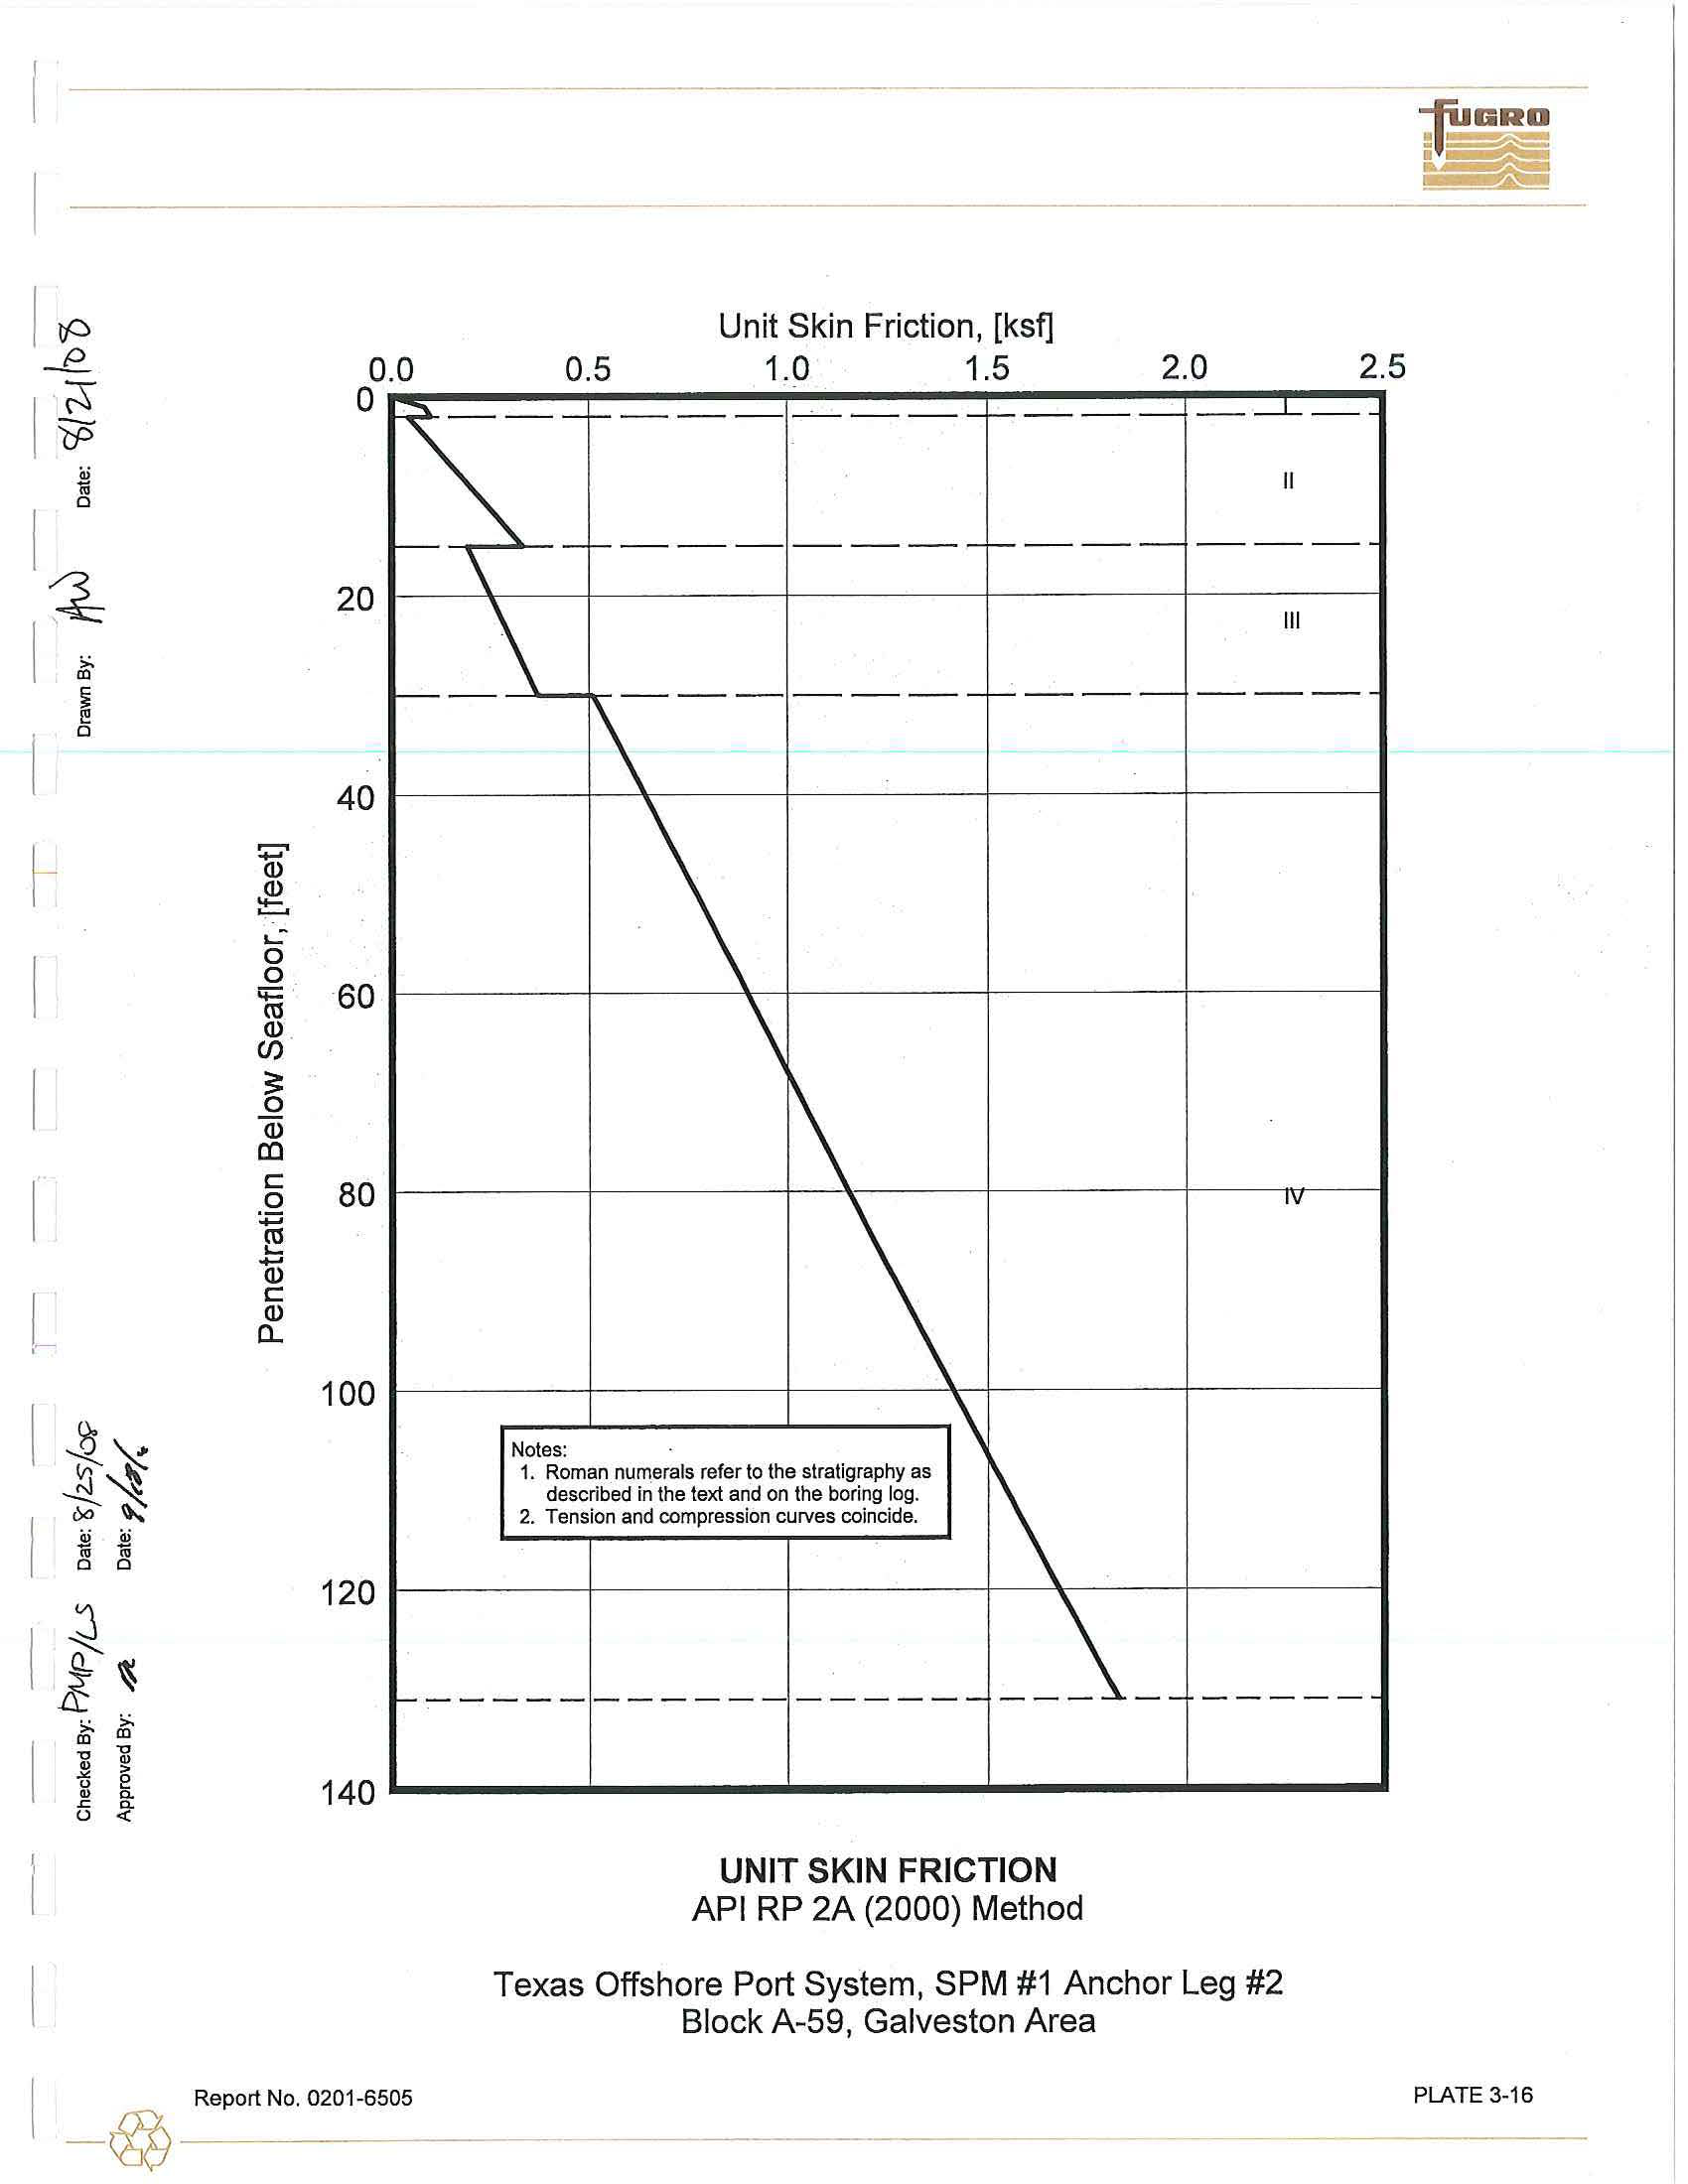
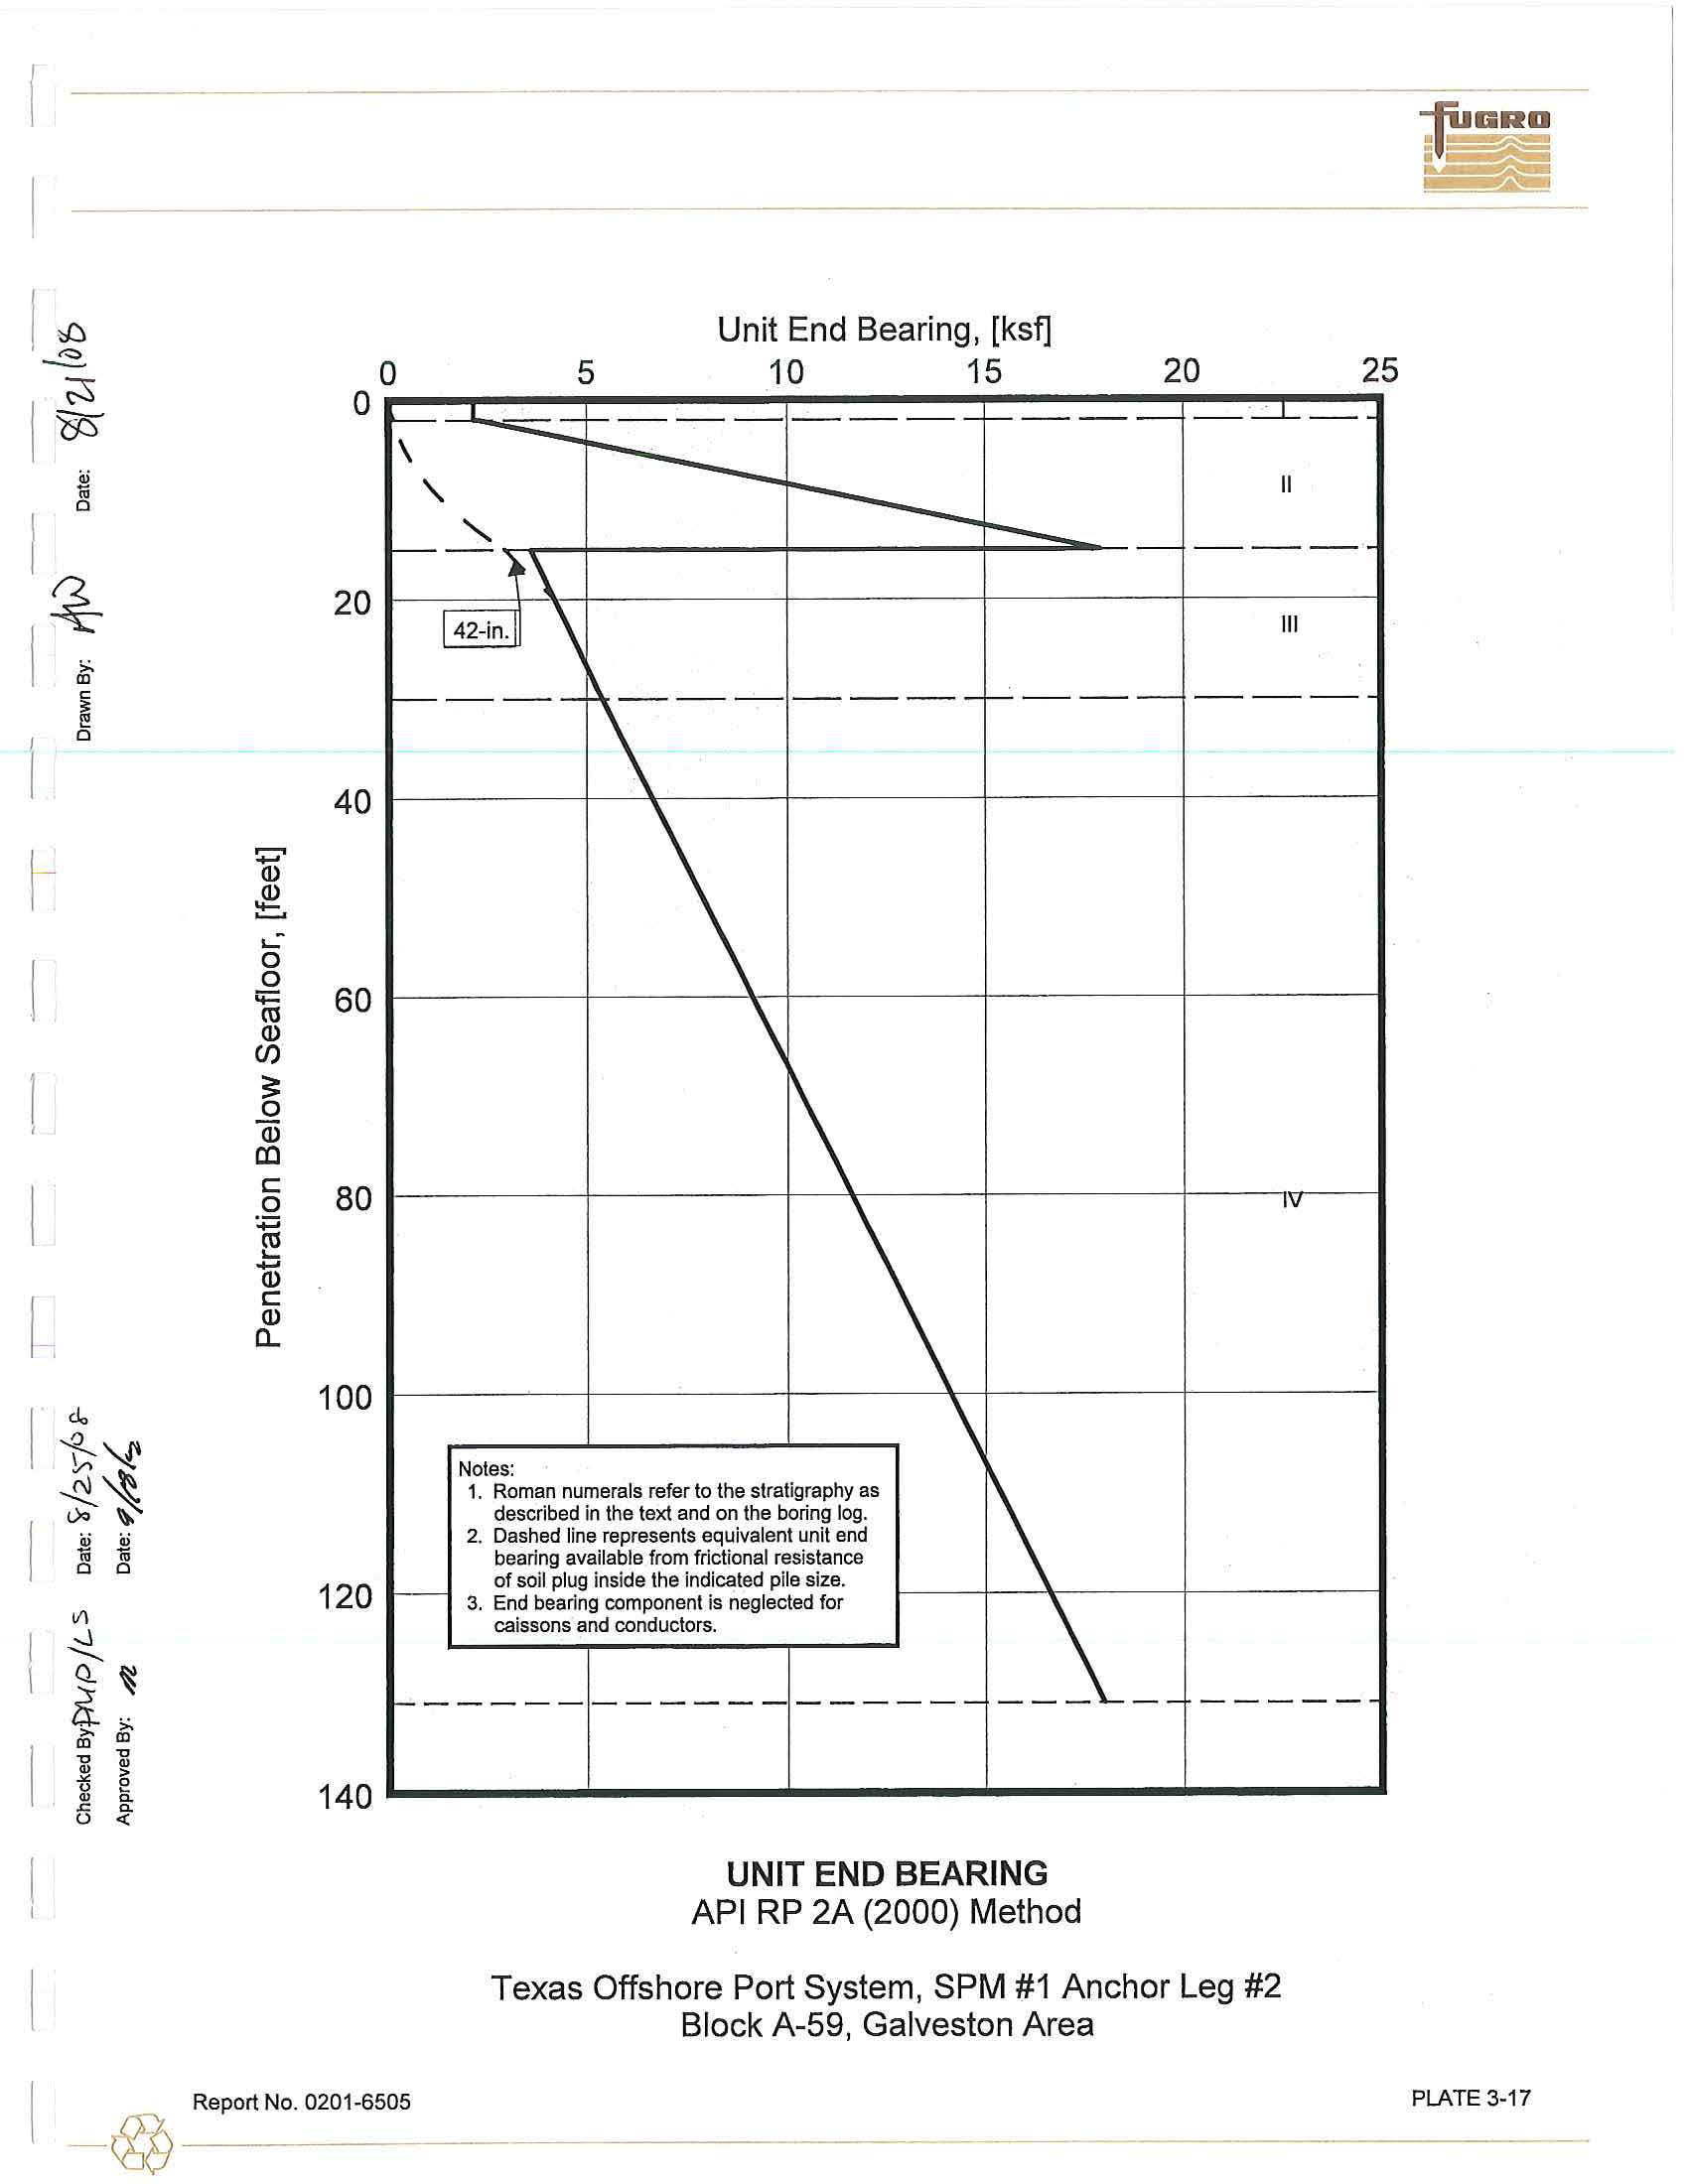
U
l
timate Axia
l
Capacity. The
unit skin
friction
and
unit
end
bearing va
l
ues
plotted on Plates
3-16
and 3-17,
respectively
,
was calculated using
th
e
AP! RP 2A methods described
in Appendix
B. These
values were
used to calculate
the ultimate axial compressive and
tens
i
l
e capacities
for 42-in
.-dia
meter pipe
piles, driven
to
final penetration at the boring location
.
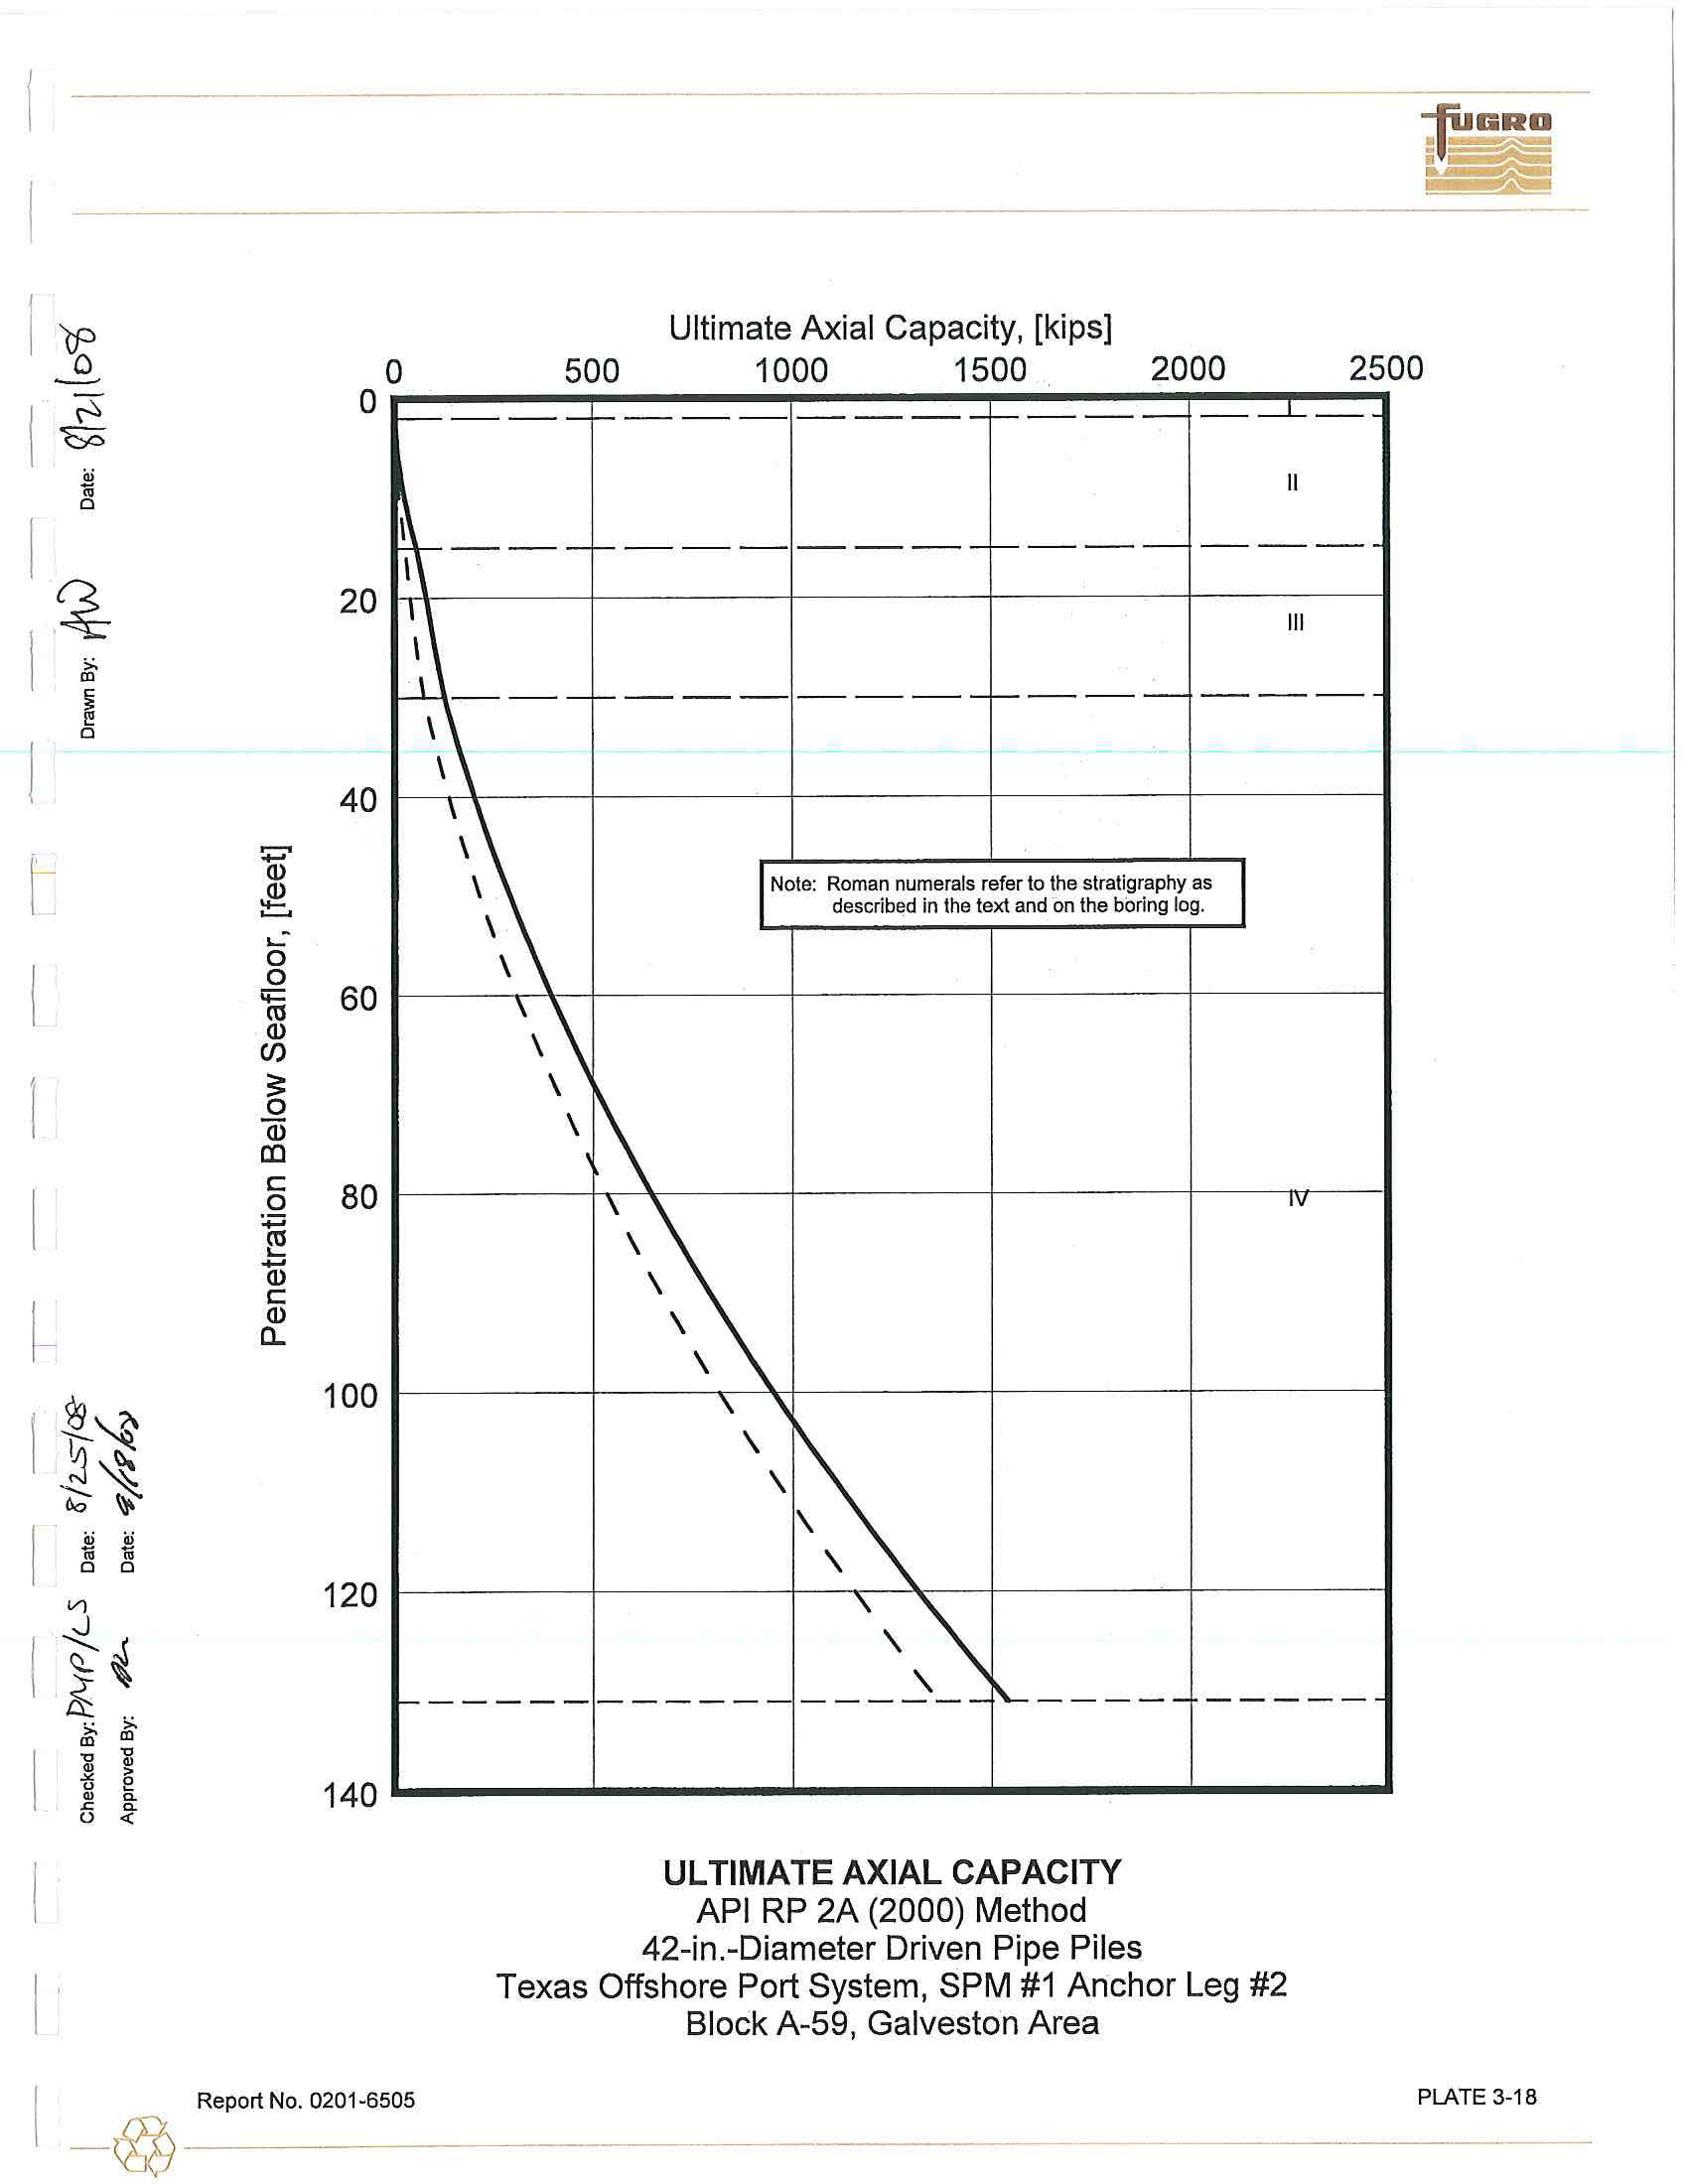
Capacity
curves
for dr
iv
en
pipe piles
(conductors,
caissons
and
foundation
piles) are presented on Plate
3-18.
API
RP 2A
recommends
that
pile penetr
a
tions be se
l
ected using appropriate factors
of
safety
or
pi
l
e
resistance
factors
.
These factors are discussed
in
Section
2.5.1 of
this report.
Report No.
020
1-
6505
-
fln
-
3-4
-------
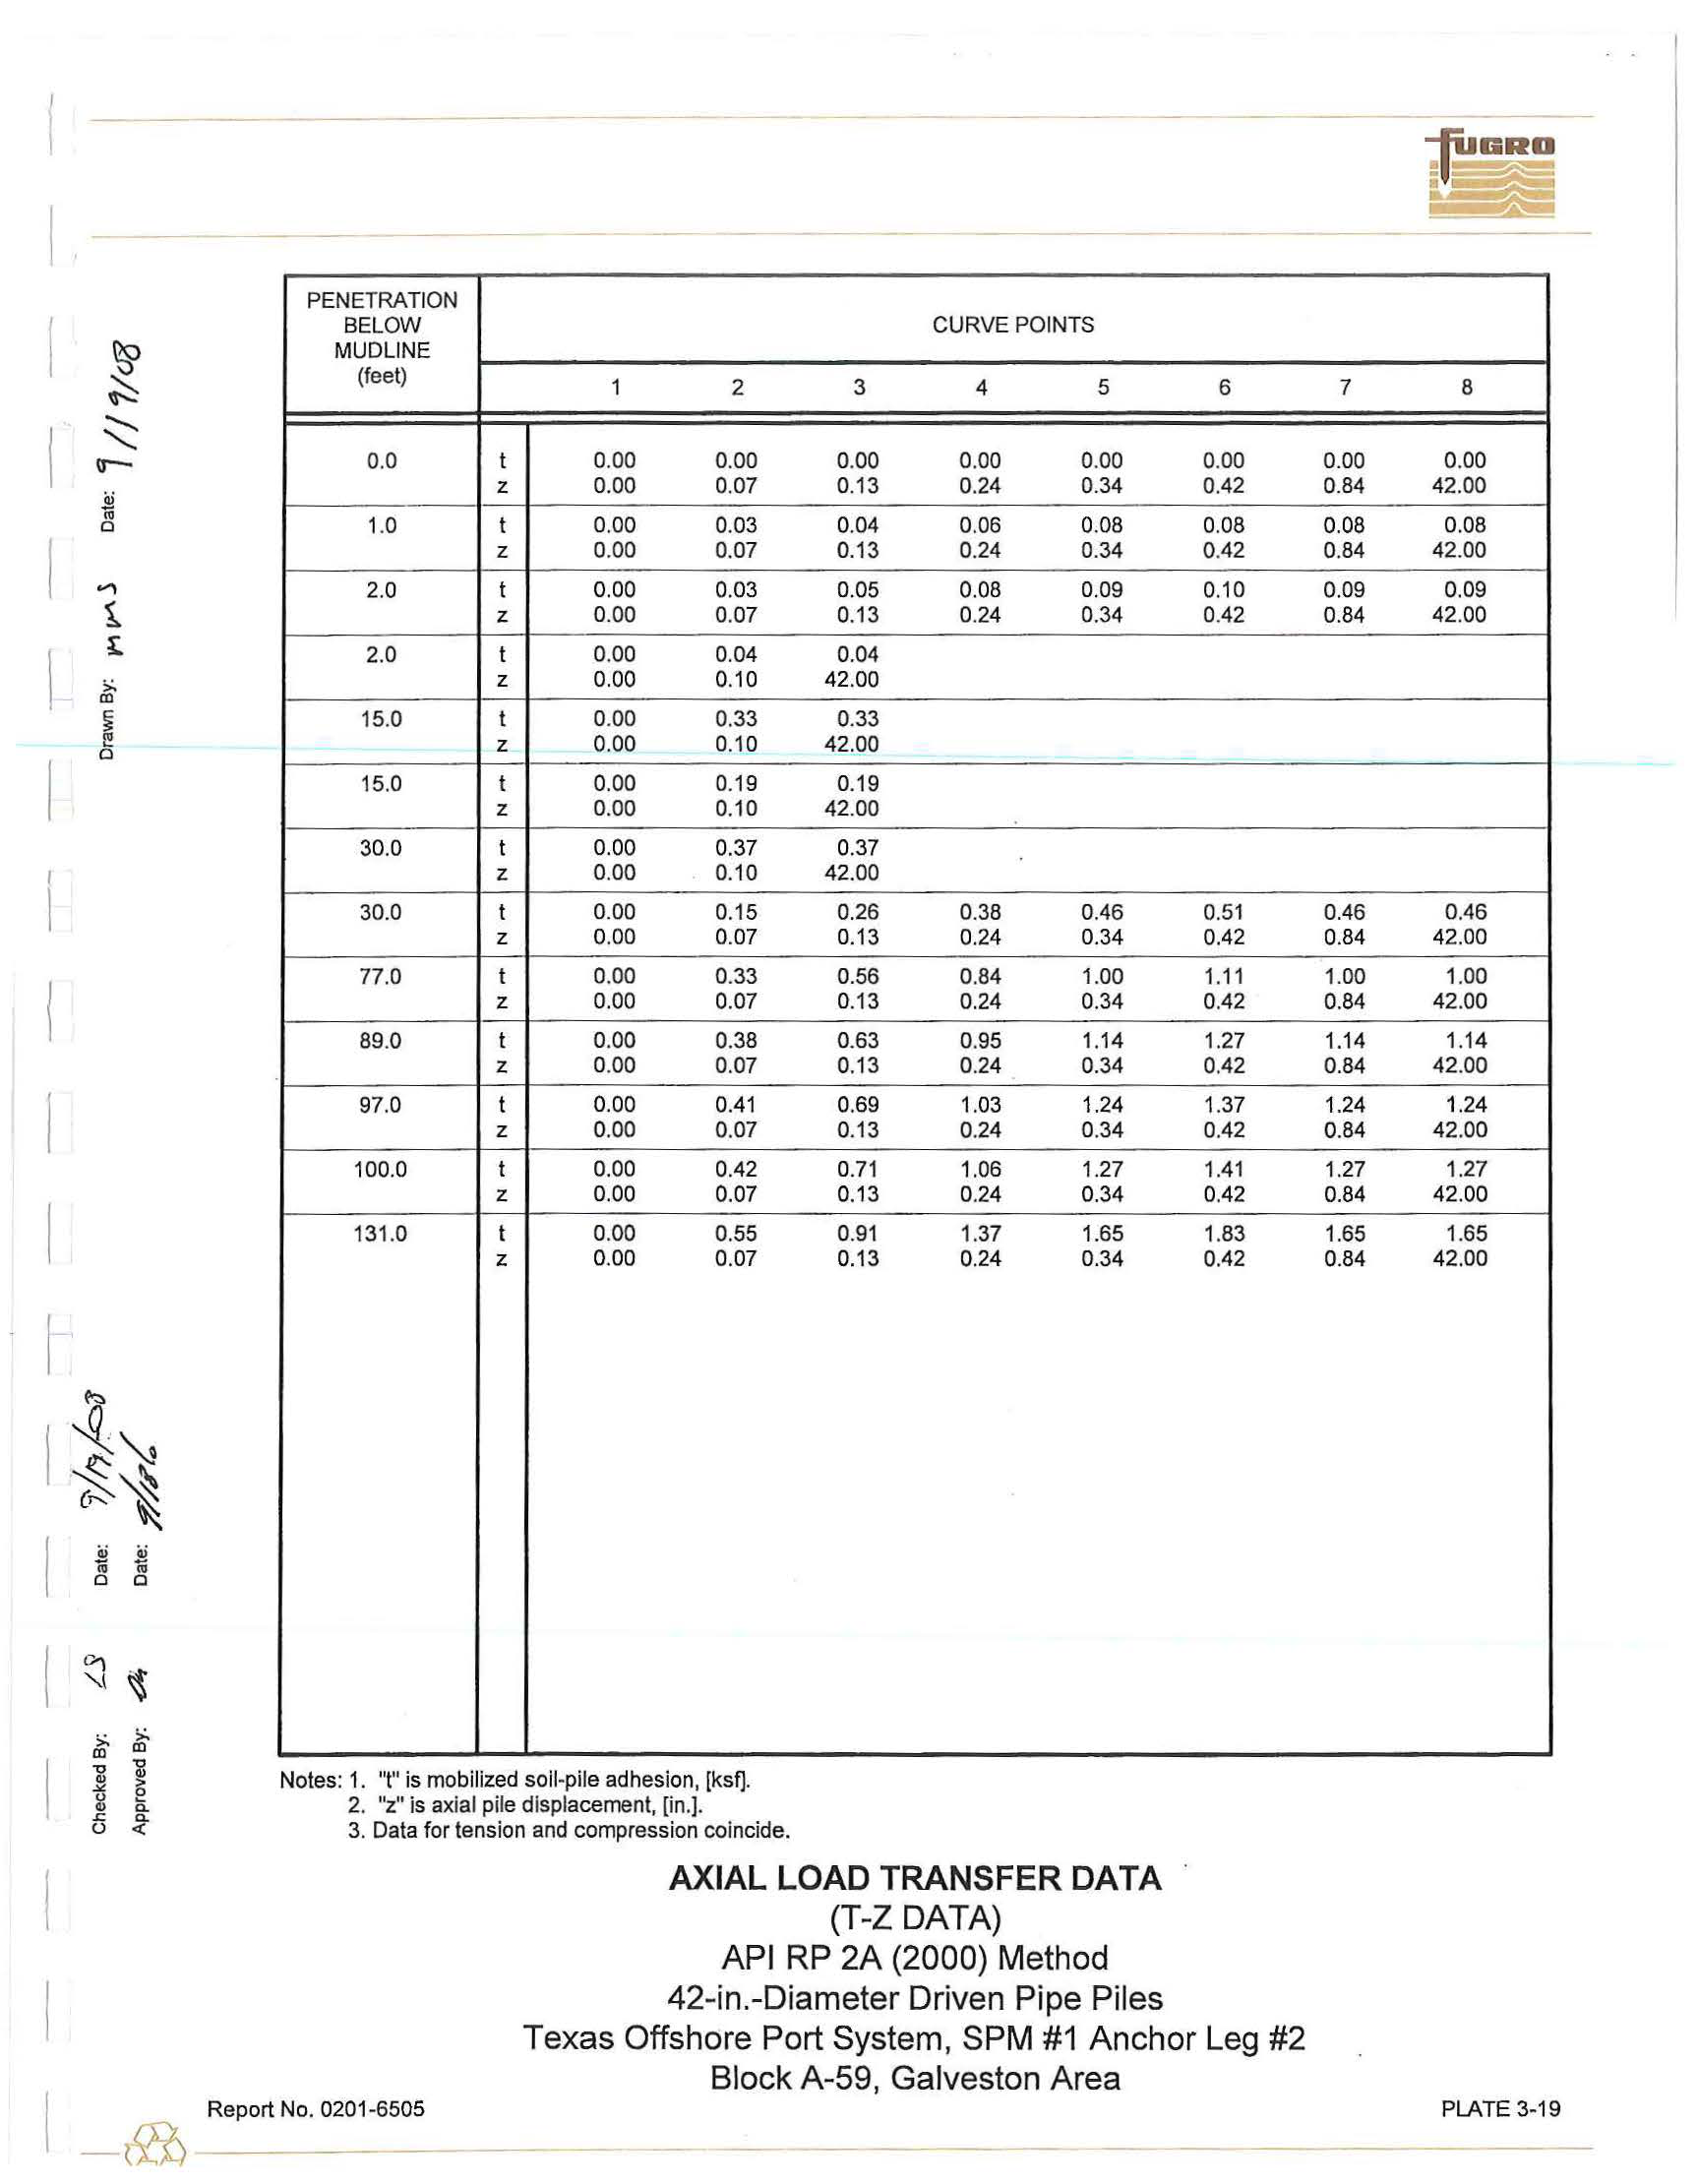
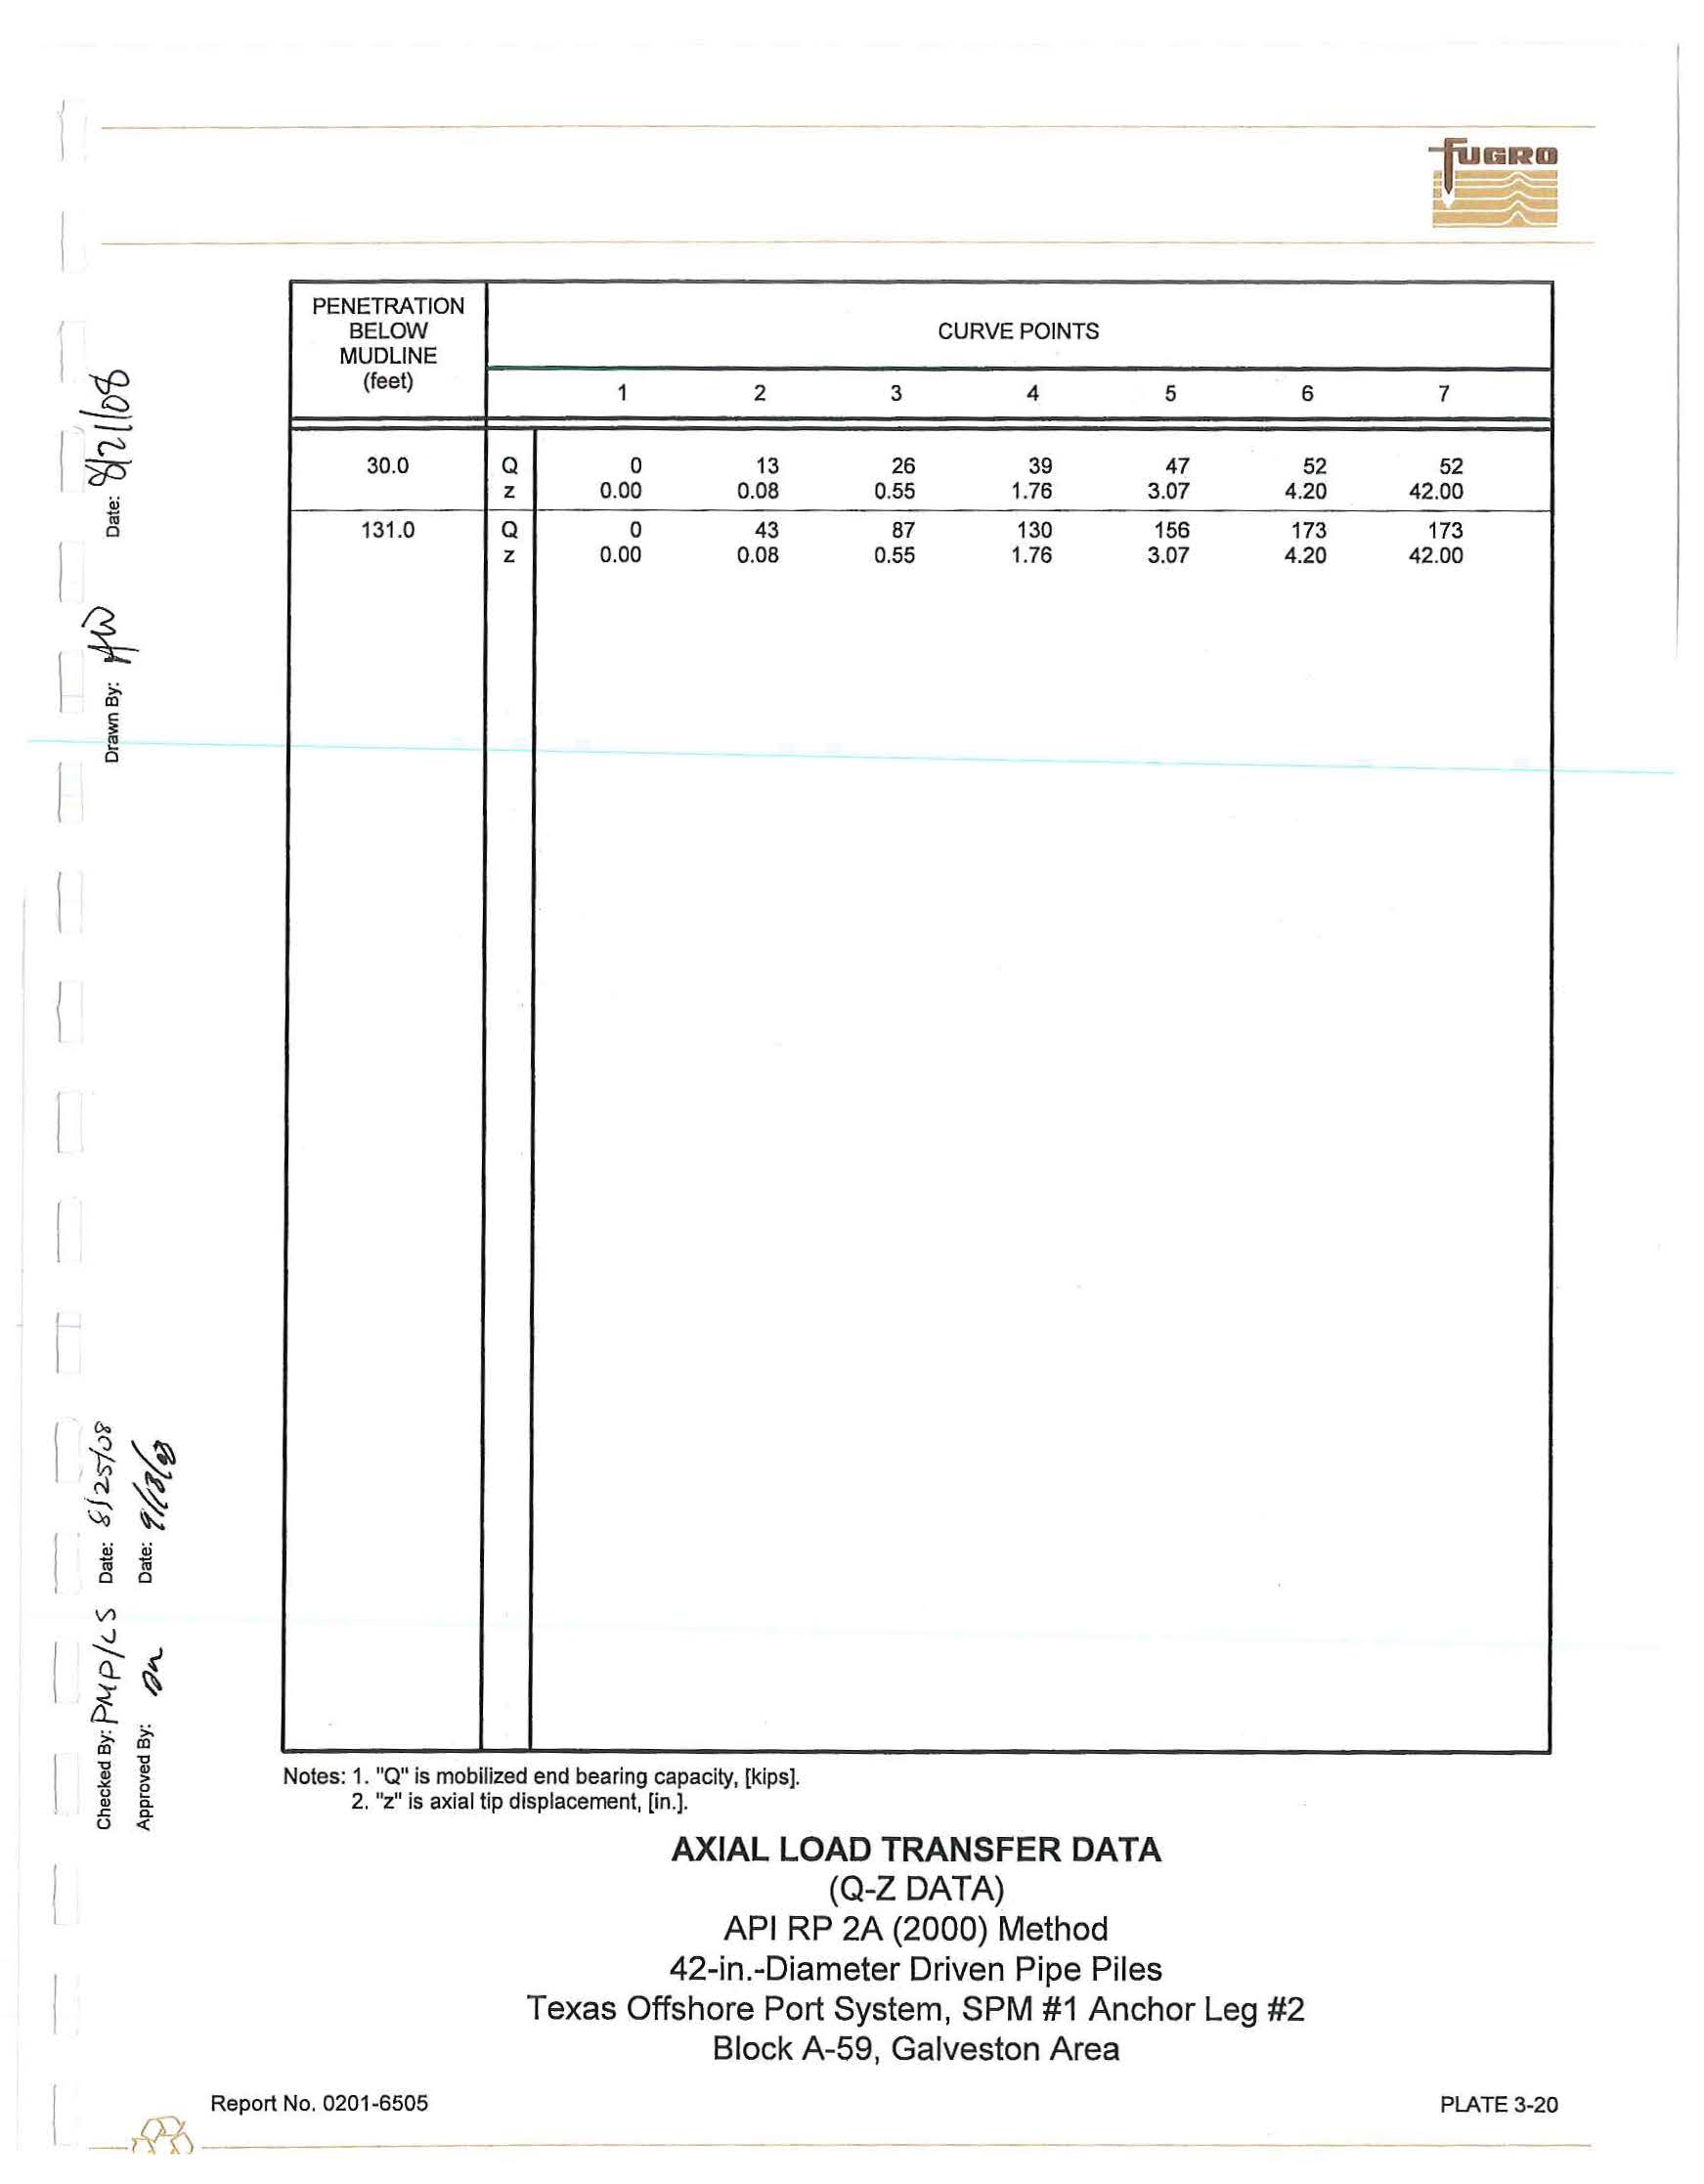
Axial Load Transfer Data.
Axial
load-pile
movement analyses are usually performed using a
computer solution based on methods developed by Reese (1964) or Matlock, et
al. (1976)
.
Plates
3
-
19 and
3-20 present the
results
as side
load-side
movement (t-z) and tip load-tip movement (Q-z) data
for
42-in.-
diameter driven
pip
e
piles
,
respectively. The
Q-z data should be used for foundation piles and neglected for
caissons and conductor design
.
In developing the axial
load
transfer data in the cohesive soils, a post-peak
adhesion ratio of 0.90 was utilized
.
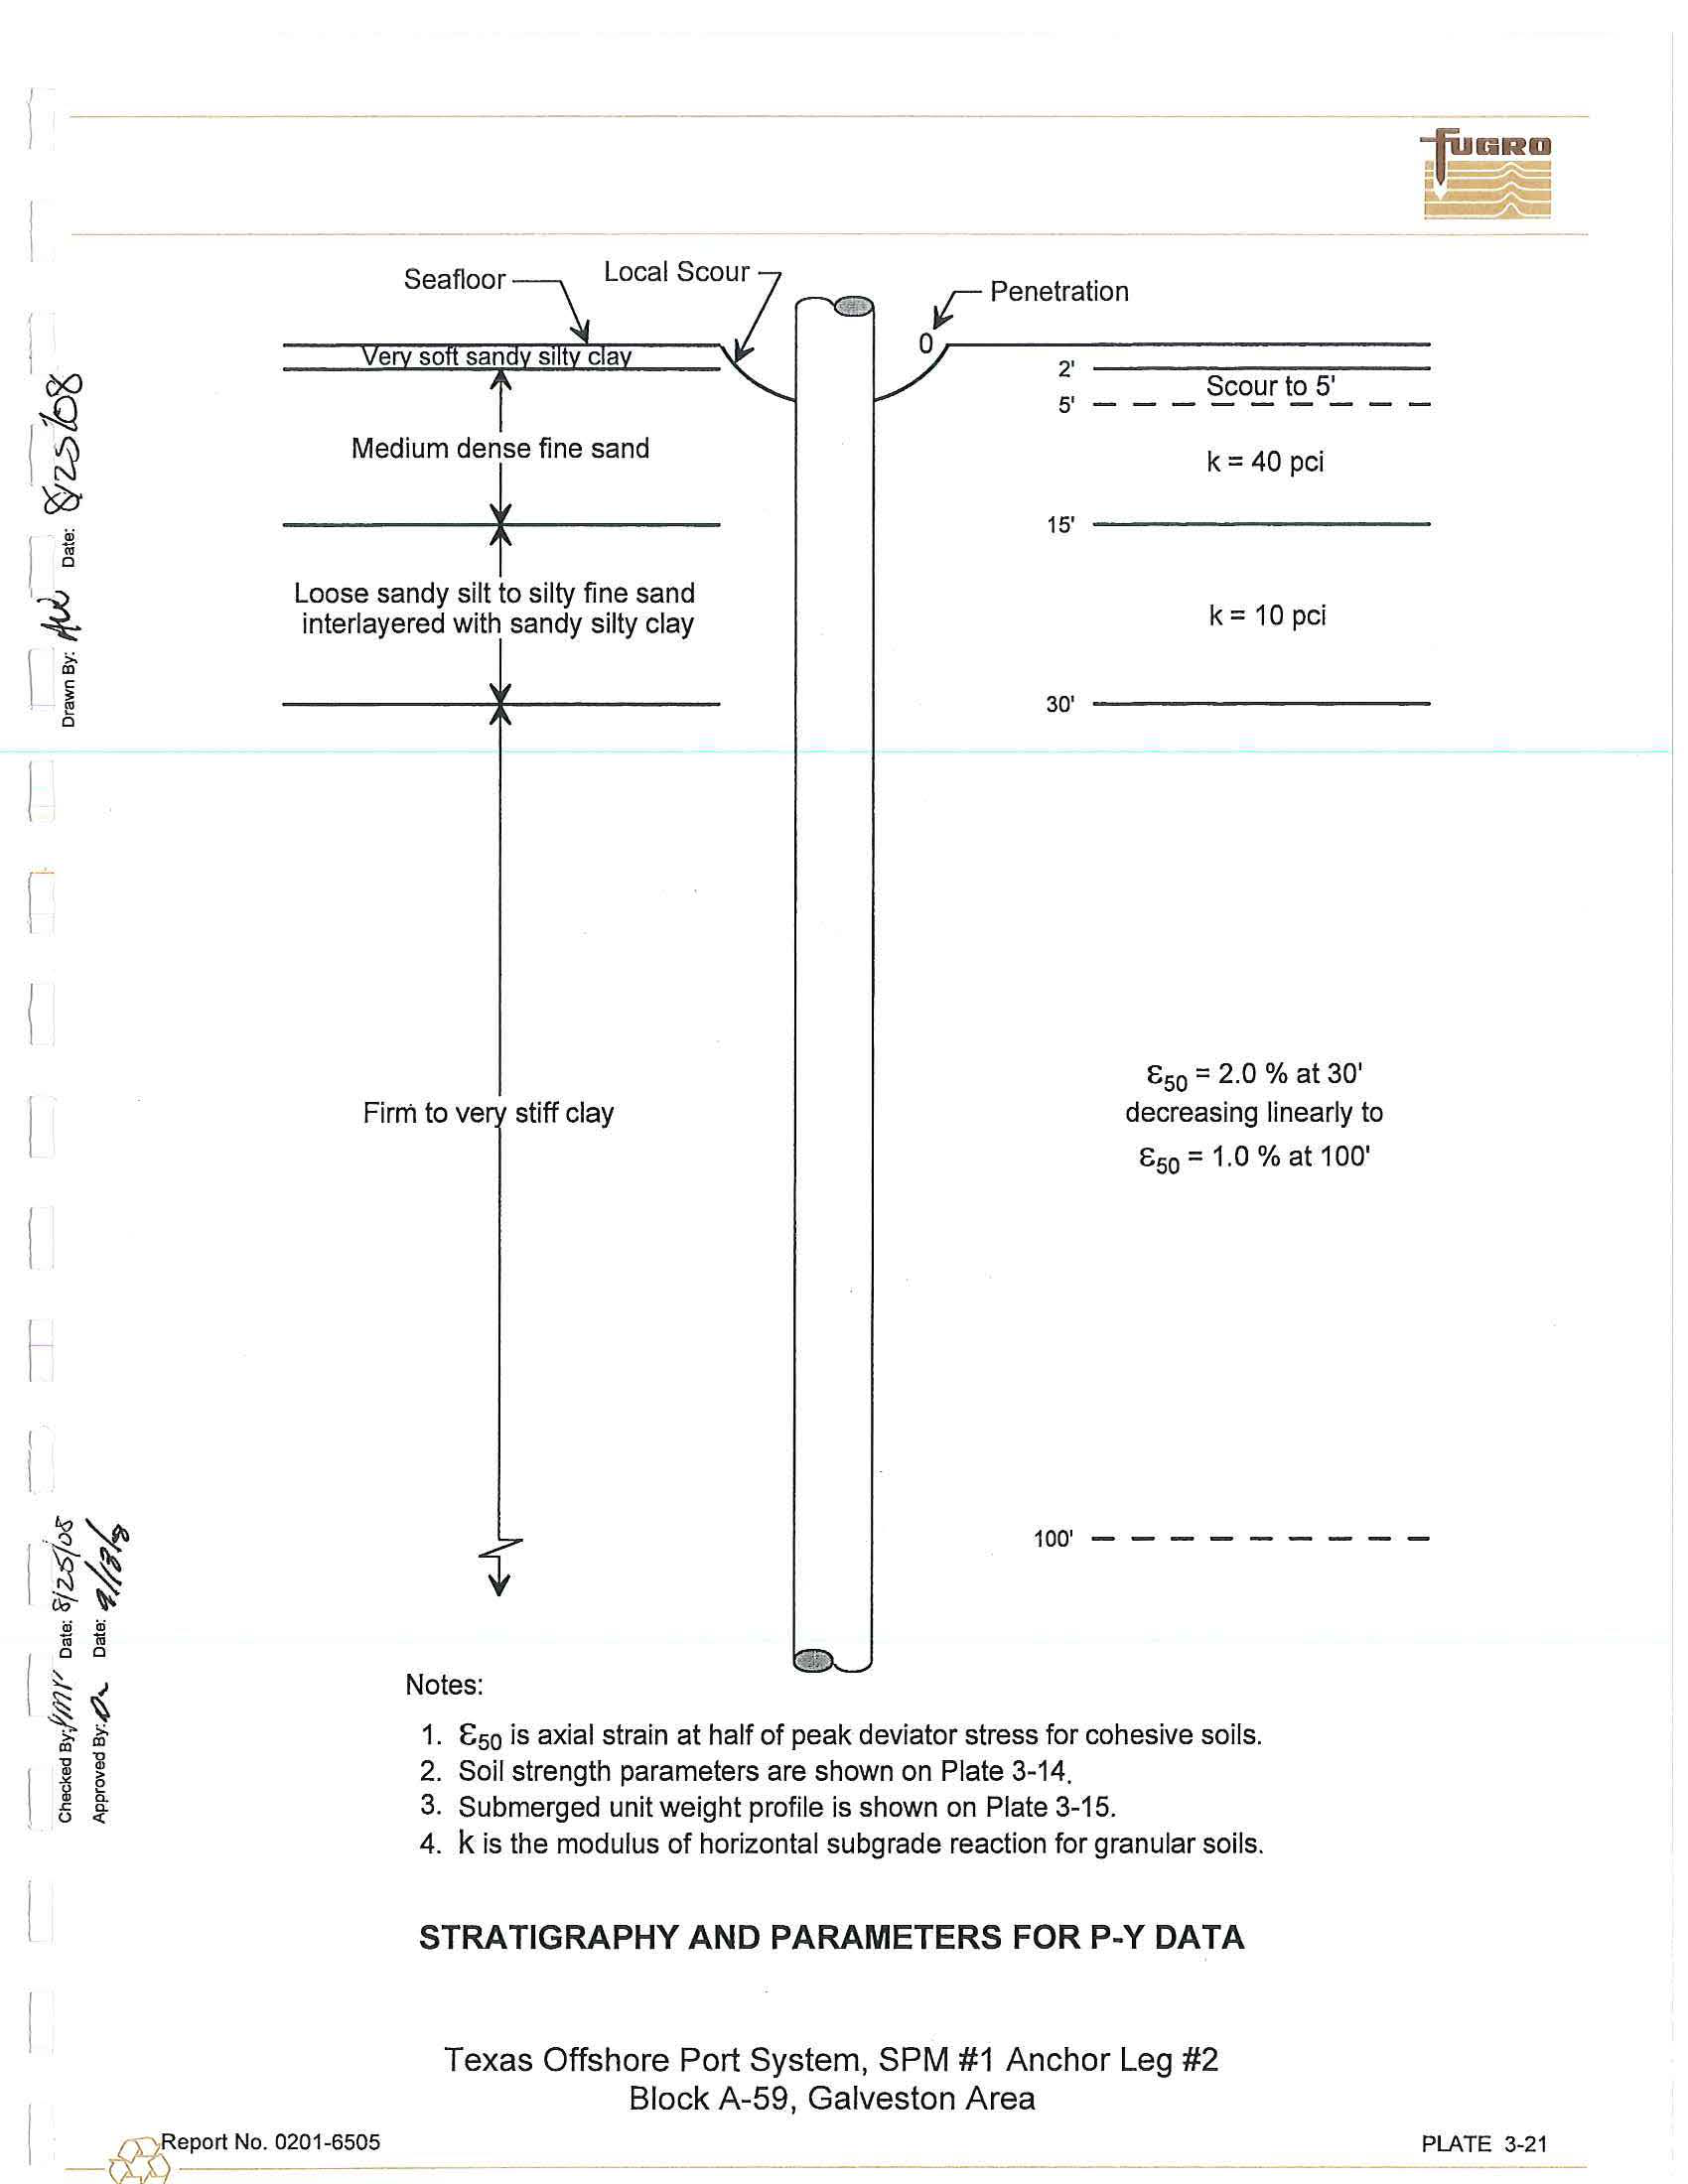
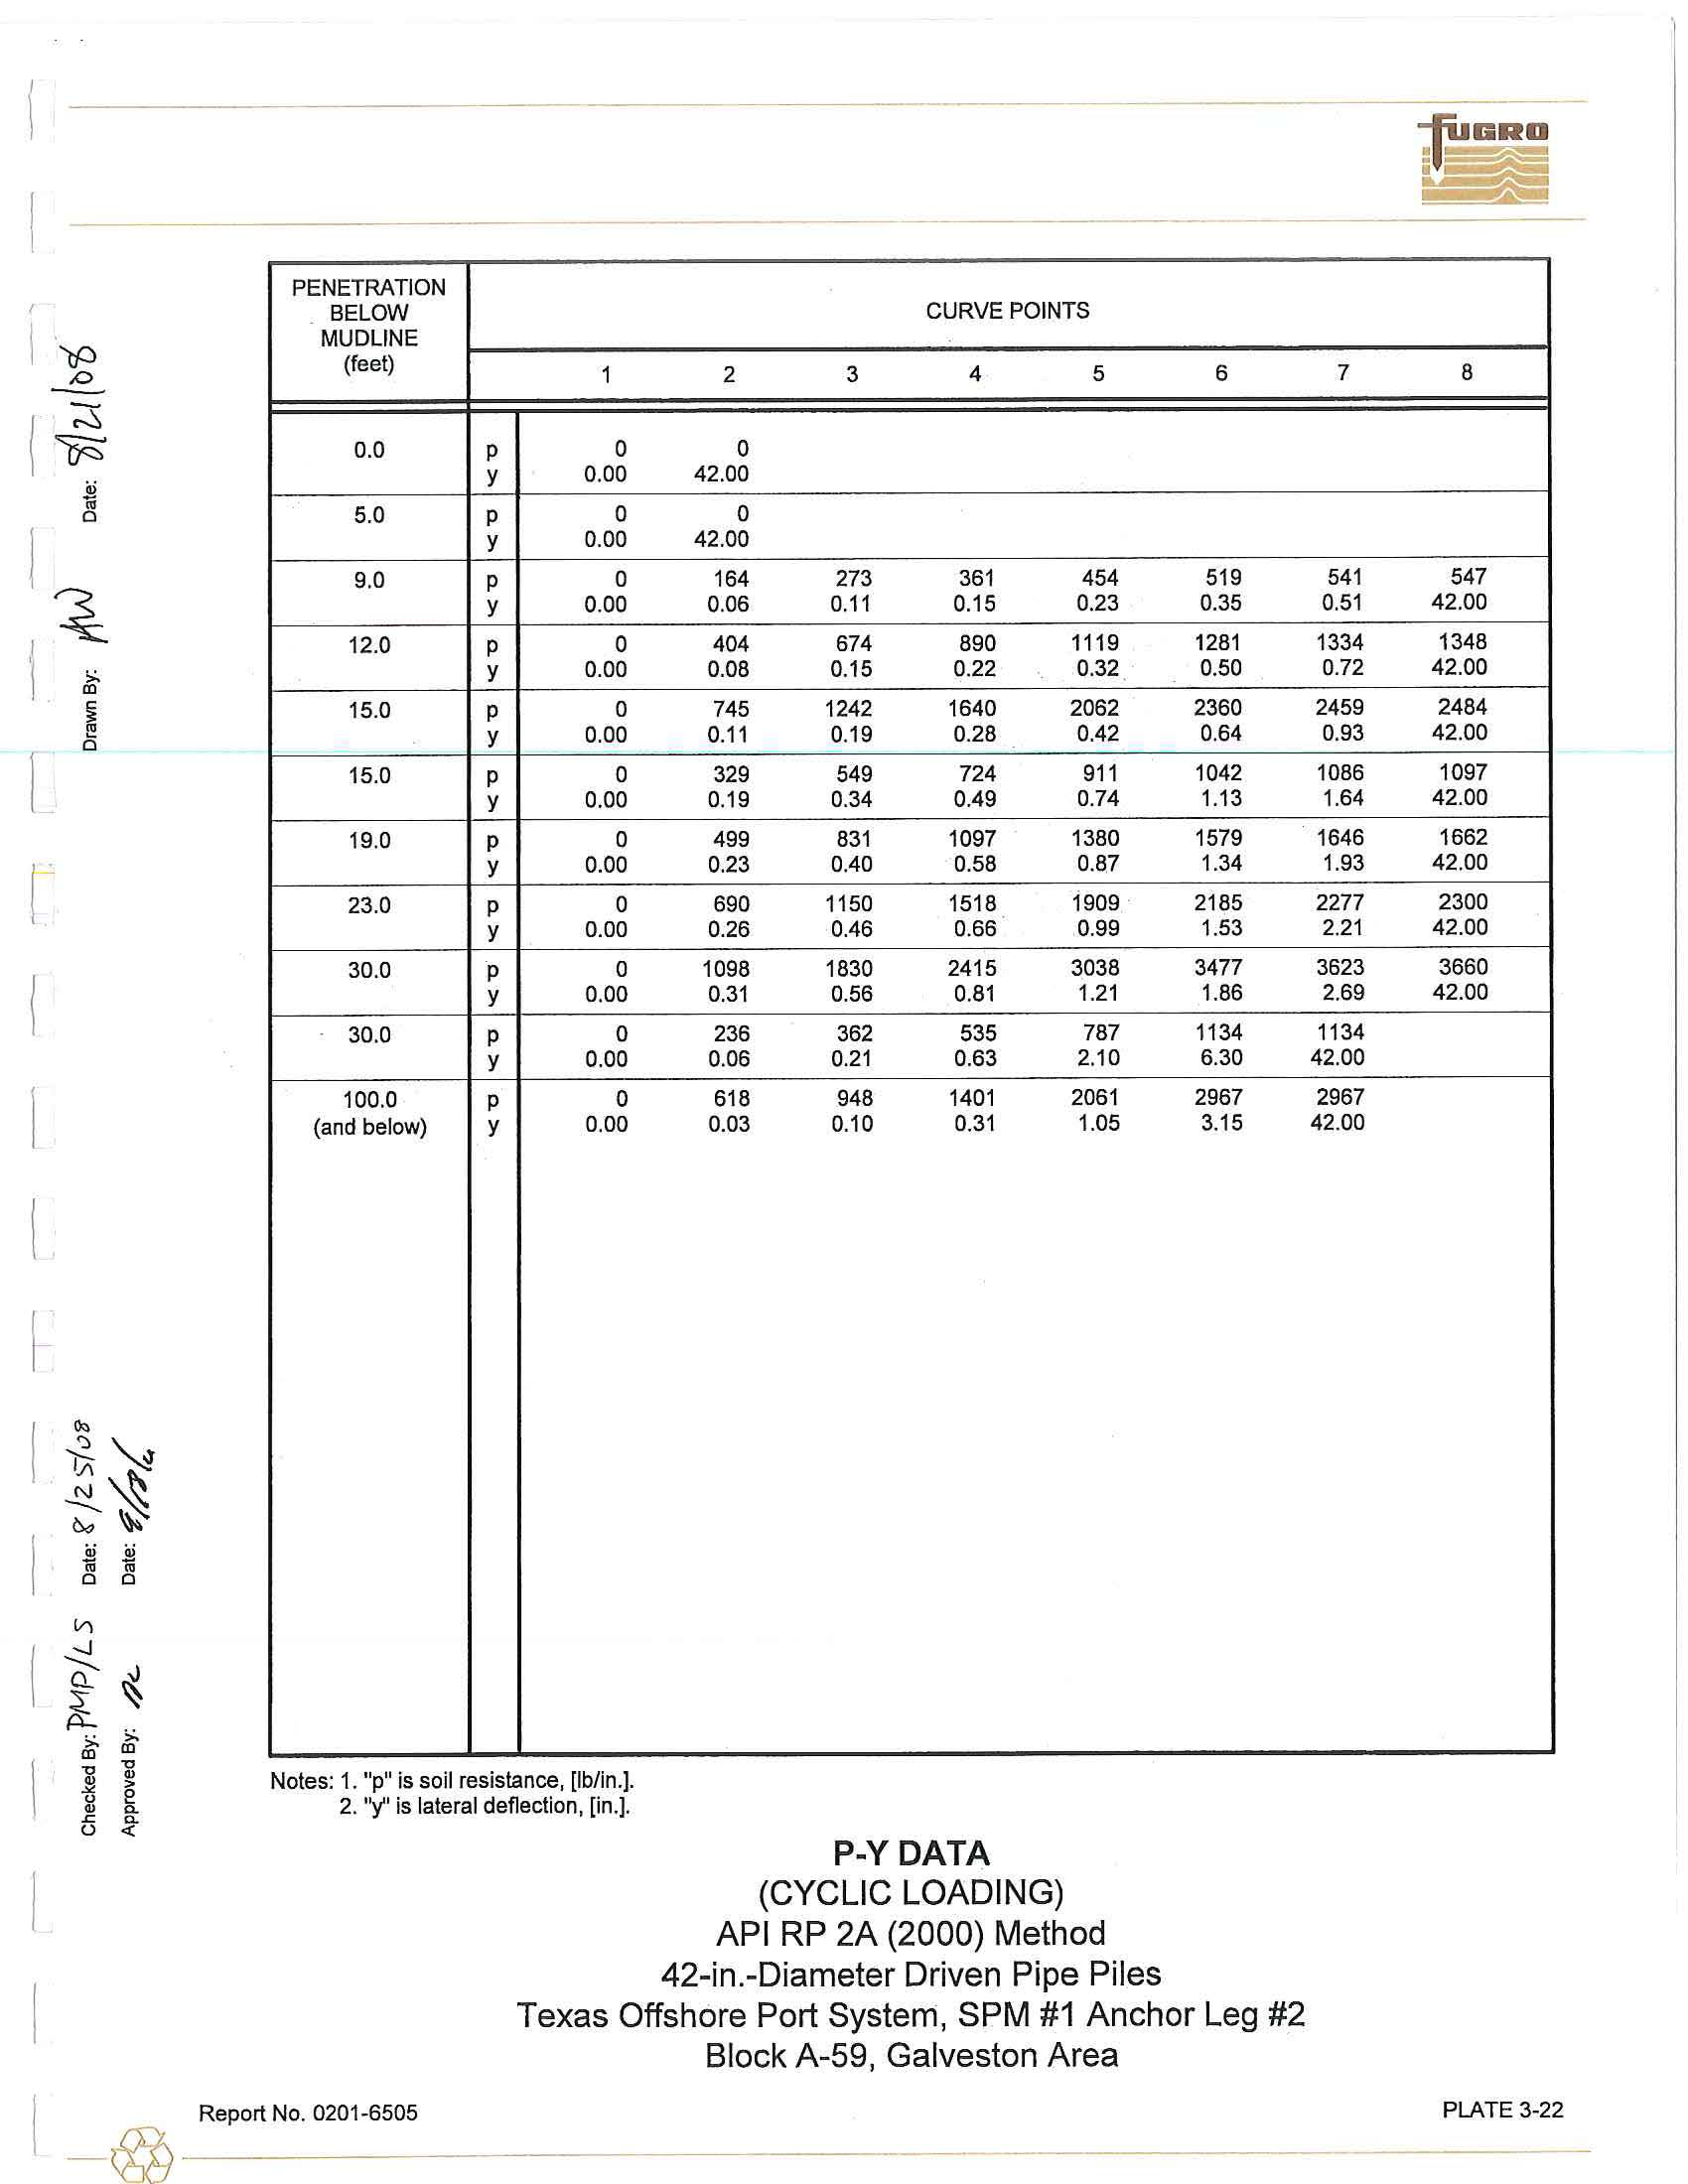
3.2.3.2 Lateral Pile Design Data
The soil resistance-pile deflection (p-y) characteristics of the soils at
the
boring
location
were
developed for individual 42-in.-diameter driven pipe
piles.
These data may
be used
in lateral load
analyses
of driven piles, conductors and caissons.
The
p-y data for cyclic
loading
were developed
to
100-ft
penetration using procedures that have been outlined
in API
RP 2A and briefly explained in Appendix B.
The stratigraphy and parameters used to develop
the
p-y data are presented on Plate 3-21
.
The
p-y data
for 42-in.-diameter driven pipe piles are presented on
Plate
3-22.
P-y
values presented at 100-ft penetration
may be used for lateral load analyses at greater depths.
I
Report No. 0201-6505
-
f&
---
3-5
I
@
;:o
(I)
"O
0
~
z
!=>
0
N
.....
0
0)
u,
u,
0
~
Q)
~
....
0
-
0
i:;:=
<ll
Q)
if)
~
0
Q)
[l)
c
:;::::;
0
....
<ll
+-'
Q)
c
Q)
0..
lJ
m
~
'f
.....
N
ru
0
10
20
30
40
5
0
60
70
80
90
10
0
110
120
130
140
150
160
1
7
0
180
1
9
0
200
Checkea t:ly:
urawn By:
-.
.
,t..,.(
Date
:
uate
:
1
/ll;ov
A
pproved B
y
:
Date:
X
=
3,2
5
7
,
2
0
0'
I
DEN
TI
FICAT
I
ON TES
T
S
,
[%]
Y= 236,056'
BLO
W
20
4
0
6
0
8
0
U
N
DR
AI
N
E
D SH
E
AR STRENG
T
H
CO
U
NT
[kst]
Te
x
a
s
South Cent
r
a
l
Zone Coordinat
e
s
SUBMERGED UNIT W
E
I
G
HT
,
[k
c
f]
S
E
A
FL
OOR AT EL.
-
123
'
0.03
0
.
0
4
0
.
05
0.06
0
.
5
1.0
1.5
2.0
I
~
c..l
VERY SOFT O
LI
VE GRAY SAN
D
Y SI
LT
~
WOH
-L~
§
(
O
AS
I
I
C
L
AY
MED
I
UM DENSE OLIVE GRAY
FI
N
E
SAND
15
•
•
D
0
.
:
I
1
Note
:
See PLA
T
E 3-
1
2
b for deta
il
ed soi
l
I
25
•
•
D
II
.:
:::
-
..
•
stratigraph
y
to
4
0
-
11 penetratio
n
.
1
5
-
-
-
~
10
<
.
1
115
.
0'l
15
•
•
0
L
OOS
E
O
LI
V
E
GRAY SAN
D
Y S
IL
T TO
6
II
.
D
S
ILT
Y FIN
E
SAND
I
NTERLAYERED W
ITH
SAND
Y
SI
LT
Y C
L
AY
8
-
-
-
D
1
...
- -
-
111
1
:-
:
-:
20
..
..
6
0
..
•
•
...
..
..
..
.
_
.
I
1
3
0
.
0
'
\
7
-
-
r,
A
A
~
.
F
I
RM TO VERY ST
I
FF OLIVE GRAY CLAY
.
-
~
T
6
-+--
_
_
_
..
_
--
D
~
~
30
I
7
•
n
{)
,t,i
....
-
-
y
40
I
-
w
i
th sa
n
d p
o
ckets
,
43' to 78'
5
~
-
w
i
t
h
sand partin
g
s
,
43
'
to 6
8
'
-+-
_
__
..Jl
••
_Q_
+
0
•
-
w
i
th sand
s
ea
m
s a
t
44'
I
-with
a
fe
w
shell fragm
e
nt
s
,
48' t
o
55
'
8
-•
n
(>
-~
,..
1--
-
y
T
50
I
-
with g
as
bli
s
ters
.
53
'
to 60
'
P
US
H
+-
-.-an
<>
...
•
-
--
....
I
P
USH
•
n
{)
~
~
..
-
.._
y
60
•
P
US
H
+-
--
---
....O
+
I
•
-
wi
t
h a fe
w
shell fragmen
t
s
a
t 67'
P
US
H
-+-
-
___
_
_.
.
-_q.
<>
.
~
•
1--
70
I
-w
i
th
m
any sa
n
d partings, 76'
t
o 97'
PUSH
•
[j§l
£:,.
,v
•
•
80
ii
-wit
h
many sand poc
k
ets
,
8
7' t
o
97'
PU
S
H
D
<>
...
-
l
ean at 87'
1
0
+--
-
-
-
.-4
k
1•
~
1--
~
~
90
....
-
0
0
i.::
ro
•
12
,.
0
0
...
•
Q)
(f)
-
~
100
~
0
<ii
en
I
-
w
it
h
a
f
ew s
i
l
t
pockets, 106
'
t
o 13
1
'
PU
S
H
I~~~
(j)
'
.
DD
IA
....
-
c
:.;:::;
0
11
0
ro
+-'
....
Q)
(2
.
64
,
1
6
.
5)~
c
Q)
•
-with
a
few shell fragm
en
t
s
, 116
'
to
1
31
'
P
US
H
--
-'It
-
0
*
®
+-
---+-
0..
-
,
~
~
~
I
«~~
,
-A
120
-
I
--------
_____0~
PU
S
H
~
~-
>--
"=G
--
---
....____
~
--
---
~
~
~
-+----
-
130
-
140
-
1
50
-
16
0
-
170
-
180
1--
1
90
SAM
P
LING
T
ECHN
I
QUES
CLAS
SI
F
IC
AT
I
O
N TESTS
STRENGTH
T
ESTS
200
Number
o
f b
lo
w
s
of a 175
-l
b w
ei
ght
(
hamm
e
r
) d
r
o
p
pe
d a
p
p
roxim
a
t
el
y 5
ft
t
o
prod
u
ce a
...
S
OLU
B
I
LITY
IN HC
L,
[
%
]
® POCKET
PE
NET
R
OM
ETE
R
(P
P)
maximu
m
o
f
24 in.
o
f
p
e
ne
tra
tio
n o
f a
2.25
-
in
.-
OO,
2.
125
-
in
.
-
lD
thin-
wa
lled tub
e
•
P
E
R
C
E
N
T
P
ASS
I
NG
-
200
S
I
EVE,
[
%
)
$
TO
RV
AN
E (TV)
s
a
mp
le
r
.
"
PU
SH
" deno
te
s
a
3.0
0-
in
.
-
O
D
,
2
.
8
3
-
i
n
.
-
l
D thi
n-wal
led tube sa
mp
ler was
•
W
ATE
R CONTENT
(W)
,
[%
]
<l> REMOTE
V
ANE
(
R
V)
a
d
v
a
n
c
e
d
24
i
n
.
with the we
ig
ht
o
f t
he
drill s
tri
ng
. 'WO
H" d
e
n
o
t
es a
2
.
50
-i
n
.-
OD,
D
S
UBMERGE
D UN
IT
W
E
IG
HT
(
S
UW)
•
MI
NIA
T
U
RE V
A
NE (M
V)
(~ RE
S
I
DUAL (
MV
r
es
)
V
A
L
U
E
)
2
.1
25
-
i
n.
-
l
D
l
i
n
er
s
am
plerwas
a
d
v
an
ced
24 i
n
.
wit
h
the w
e
i
g
ht o
f
t
he ham
m
er
.
A
UNC
O
NS
O
LI
DA
T
E
D
UND
RA
I
NED TRIA
X
IA
L
(
UU
)
PLA
S
T
IC LIM
IT
(P
L
)
LIQ
U
I
D LIM
I
T
(L
L)
+--------
---
---
--
------
+
(Open s
ym
bo
l
s
indicat
e
r
e
m
olde
d
(
r
)
tes
ts)
LOG OF BOR
I
NG AND TEST RES
UL
TS
T
e
xas Off
s
hore
P
ort System, SPM #1 Ancho
r
Leg #2
B
l
ock A
-
59,
G
a
l
veston Area
I
@
:::0
(1)
"O
0
;::i.
z
?
0
N
.....
0
&,
u,
0
u,
!;:;'
Q)
~
..:
0
0
t;::
co
Q)
Cl)
3
0
Q)
co
c
0
~
a>
c
~
Q)
a..
0
X
=
3,257
,
200'
Y
=
236,056'
:
hecke
Approved
By:
Texas
South Centra
l
Zone
Coordinates
SEAFLOOR AT EL. -
123'
I
~
lJ
VERY SOFT OLIVE GRAY
SANDY
~
SILTYCLAY
.....
l -with
shell
fraaments
BLOW
COUNT
WOH
15
IDENTIFICAT
I
ON TESTS,[%]
20
40
60
80
'
SUBMERGED
UNIT
WEIGHT,
[kcf]
0
.
03
0.04
0.05
0.06
+--
a
By:
1i
--
,
UNDRAINED
SHEAR
STRENGTH
[ksf]
0
.
2
0.4
0.6
0.8
.('-.
I
I
-
5~
...
1
MEDIUM DENSE OLIVE
GRAY
FINE SAND
-w
ith
a
few
shell
fragments
and
mica, 3' to
10'
-
-
-
10
15
20
.....
1
-with
a few clay
seams
at
7'
II
...
•
••
.
.
-with
a
few
clay pockets
at 9'
...
1
-w
ith
shell
fragments at
13'
I.
.ll
~.
L-
~-
Ill
115.0')
•
LOOSE
OLIVE
GRAY SANDY SILT TO
SILTY
FINE
SAND INTERLAYERED WITH
SANDY SilTY CLAY
-with
a few shell fragments to
20'
-with a
few clay pockets to 16'
-with clay pockets and
shell fragme
nts
at
24'
25
15
15
6
6
•
•
D
•
•
D
..
•
D
D
--
-
D
25
L-
30
,____
.t
t..
130
.0')
FIRM TO VERY STIFF
OLIVE
GRAY
CLAY
-with
a few shell fragments,
33'
to
40'
-with sand
pockets and part
i
ngs
and a
few
sand
7
.-
-
D
6
seams at 34'
,
35
1-W
I
•
.....
40
I
-w
ith
many sand pockets and partings at 39
'
7
•
0
,b
I.A.
~
'--~~~~~~~~~~--~~~~~.._~~---41-~---4~
....~~-19.-.~~~
....
~~~.-.~~---11-~~~
.....
~~~.;;;;;;~~~'--~---------~~---1
SAMPLING TECHNIQUES
Number
of blows of a
175-lb weight
(hamme
r
) dropped approximately
5 ft to produce a
maximum
of
24 in.
of
penetration
of a 2.25-in
.
-OD, 2.125-in.-lD thin-walled tube
sampler.
"
PUSH" denotes
a
3.00-in.-OD,
2.83-in
.-
l
D thin-walled tube sampler
was
advanced
24
in. with
the weight of the
drtll
strtng
.
'WOH"
denotes a 2
.
50-in
.-O
D,
2.125~n.-lD liner sampler was
advanced
24
in.
with the
weight
of the hammer.
CLASSIFICATION TESTS
STRENGT
H
TESTS
-
T
SOLUBILITY
IN
HCL,
[%]
®
POCKET
PENETROMETER (PP)
•
PERCENT
PASSING .200 S
IE
VE,
[%]
$
TORVANE
(TV)
e
WATER CONTENT
CW)
,
[%]
<!>
REMOTE VANE (RV)
D
SUBMERGED UN
I
T
WEIGHT (SU\N)
+
MINIATURE VANE (MV) (~
RESIDUAL
(MVres)
VALUE)
A
UNCONSOLIDATED
UNDRAIN
E
D
TR
I
AXIAL (UU)
PLASTIC
LIMI
T
(PL)
LIQUID LIMIT
(LL)
+----------------------+
(O
pen
sy
m
bo
l
s
indicate
remolded
(r)
tests)
LOG
OF
BORING
AND
TEST RESULTS
Texas
Offshore Port System, SPM #1 Anchor
Leg
#2
.
Block A-59, Galveston Area
0
5
10
15
20
25
30
35
40
!;:;'
Q)
~
....
-
0
0
t;::
co
Q)
(/)
ca
Q)
~
c
.Q
-
~
Q)
c
Q)
a..
s
Offset:
~
~
~
0
.1
0
0.1
1
D.!2
Y
'
~
Ol.OEl!.1T¥
Jtf
fiCJ.., i"r.l
•
FERCeN
TP
ASSING.'.!00$15.VE.r~t
•
w;.,
t
cR
cct
n.Et-.'T
rn
:
.
r{J
Cl SU:'M~e£0 UfltTWElC!HT
($!,¥.
\')
+-----------
Pi.AST
i
CL!M
ir(
?t
}
----------
L.IG~CUM
ft
iU..J
.+
(D
Report No. 0201-6505
-~9----
STRENGTH
T
ESTS
'
~
POCKET fa'HC.TROMETiR
(!11)
'{, 'i'ORVAffi (TV)
•
~
Ri:tJOTE. ....ANE
f
P.\J)
+
t.1!NtAT
U
RE
\)J...~E
(MVj
t&
rii:!.IDUAI..
l
l.l\'t
,,u}
;,~DC
}
A UNCONSOL!OA.j;O
~
JNC-?,A:N~C
lll/AIC
~
l-.l
{
UiJ)
~TION"TUTS,.[11,j
:::::.11-
~
--'r-~-~'i-
~-i'--
~--'r-
~
----t1
SUBhD'Cil:D
UNrt
lltOQKf
.
l"d)
-
•
•
+
----
-+
-4
.....
+
---.
0
•
0
0
0
0
0
.... ----- ---+
c
.......
•
0
0
..
•
0
••
0
••
•
.....
GEOPHYSICAL
AND
GEOTECHNICAL INTEGRATION
Te
x
as Offshore Port S
ys
tem
,
SPM
#1 Anchor
Leg
#2
Block A-59, Gal
v
eston
Area
•
18500
Portion
of
Subbottom Profiler
Line
2003
N
.050
.060
.Q70
.080
.
0
90
.10
0
.
1
10
.120
PLA
T
E 3-13
1
3
N
0
.
0
I
-
.
0
(fa
~
Cl
I
i
2
0
I
;..:.
ID
§
!!!
Cl
I
4
0
~
........
Q)
~
1--
0
0
..::::
ro
60
Q)
Cl)
3::
0
Q)
Ill
c
8
0
0
:.::;
.....
I-
Q)
ro
c
Q)
a..
1
00
lli
]~
~~
Clo
"'
~
Cl
.hl
..
Cl
~
12
0
~
t
&
;..:.
;..:.
ID
ID
'O
"
QI
~
>
0
e
1
4
0
.,
a.
.c a.
(.)
<>::
Repo
rt
No
.
0201-6505
-
@
-
S
h
ear Stre
ng
t
h
Pro
fil
e,
[k
sf]
0
.
5
1.0
1
.
5
2
.
0
2.5
------
5°, N
q
= 2
0
.
0,
fm
x
= 1.7 ksf,
q
max
100 ksf
II
--
-
--
-
-- -
--
-
clay pro
fil
e
4>
= 20°,
6
= 15°, f
m
= 1
.
0 ksf (see no
e2)
I
ll
\
-
\
-
-
- ---
N
otes:
1. Roman numerals refer to
t
he
st
r
atig
r
ap
h
y as
described
in the text and on the bor
i
ng
l
og.
2
.
Clay p
r
ofile
in this layer is used for end
bearing compu
t
ation
.
-
-
---
-----
- -
----
-----
DES
I
GN STRENGTH PARAMETERS
Texas
O
ffs
hore
P
o
rt Syste
m
, SPM #
1
Anch
o
r Leg #2
Block A
-
59, Ga
l
vest
on
Area
P
LATE 3-14
Submerged Un
i
t Weight, [kcf]
0.00
0
0.02
0
.
04
0.06
0
.
08
0.10
~
I
I
~
I
O
J
~
I
:.::::;'
Q)
~
.....
~
0
0
20
40
'§
60
Q)
(J)
3:
0
Q)
Q'.l
5
80
:.::::;
......
ctl
-
Q)
c
Q)
a..
100
120
140
----
,____
___
---L
~---
_ __j_ _
_
II
-
--
-
+------
---
----
Ill
----
----
-
'
-
------
----
I
Note
:
Roman numerals refer to the stratigraphy as
described in th
e
text and
on
the boring
log
.
l
\
)
IV
I
.,_ _____
------
____
\__
------ ------
DES
I
GN SUBMERGED UNIT WEIGHT
Texas Offshore Port System, SPM
#1 Anchor Leg #2
B
l
ock A
-
59, Galveston Area
I
Report No. 0201-6
5
05
-
@
--
PLATE 3-15
I
tP
_e_
-
~
'tP
.;
iii
0
I
~
I
t
~
I
0
I-
~~
--;;;--
~~
M
"'
~
0
0
J
t
~
l's:.
;.:.
m
>,
m
.,,
-0
(I)
Q)
>
.><
e
u
Q)
0.
.c
a.
(.)
<(
~
Q)
Q)
..,._.
.......
L..-
0
0
..::
ctl
Q)
CJ)
;:
0
co
Q)
c:
0
:.:::::
ctl
.....
L..
Q)
c:
Q)
a..
Un
i
t Skin Friction,
[ksf]
0.0
0.5
1.0
1.5
2
.
0
2.5
o~
-------,-------...,..------~--------.,..----,---
-
-.
Notes:
1.
Roman
nur11e
r
als refer to
the
stratigraphy as
described
in
the text and on the
boring log
.
2
.
Tension
and
compression curves co
i
ncide.
II
Ill
140----
----------
--
....-.
--
----......i
------
--.......------
...
UNIT
SKIN FRICTION
API RP 2A (2000) Method
Texas
Offshore Port System, SPM
#1 Anchor
Leg #2
Block
A-59, Galveston Area
I
Report No
.
0201-6505
-@-
-
PLATE
3-16
I
,;/J
«::>
--
;s
!
'fJS
iii
1ii
0
l
~
!
t
c:
~
0
[
-
~
Q)
~
.._;-
I
0
0
q::
ctl
Q)
(f)
3::
0
a3
Cl'.l
c
0
:.;::;
ctl
.....
'-
Q)
c
Q)
a..
d,
~~
~~
()<,
~
iii
~
0
1ii
0
"'
VI
..._
..j
Q
~
i
>,
;,:,
m
m
'C
'C
Q)
1.1
>
0
[
Q)
.c:
0.
(.)
<(
0
0
20
40
60
80
100
120
140
Unit
End Bearing,
[ksf]
5
10
15
20
II
'
------
Ill
--
-----
Notes:
1.
Roman
numerals
refer
to
the stratigraphy as
described in
the text and
on the
boring
log.
2.
Dashed
l
ine
rep
resents
equivalent unit end
bearing avai
l
ab
l
e
from frictiona
l
res
istance
of
so
i
l plug
ins
i
de the
indica
t
ed
pile
size.
3
.
End
bearing component
is
neg
l
ected
f
or
caissons
and
conductors.
-----
------
-----
-----
UNIT
END
BEARING
API RP
2A
(2000) Method
Texas
Offshore Port System
,
SPM #1 Anchor Leg #2
Block
A-59, Galveston Area
!
-@
Report No
.
0201
-6505
___
25
PLATE
3-17
~
~
~
iii
.;
0
I
~
I
;,.:,
[D
0
~
l
1
-
!
~~
--
~~
6o
~
.;
iii
.;
iii
0
0
V)
~
l
~i
;,.:,
;,.:,
[D
[D
"O
"O
Q)
Q)
....-,
-
(1)
..._.
~
......
~
0
0
ii=
m
(1)
(/)
~
0
ai
co
c
:.;::::;
m
......
0
-
(1)
c
(1)
a..
U
l
t
i
mate Axial Capacity, [kips]
500
1000
1500
2000
Note:
Roman numerals
r
efer to the
stratigraphy as
described in
the
text
and
on the boring
l
og.
\
\
2500
II
Ill
e
.x
u
Q)
a.
.c a.
140._
________________________________........_______.
0
4:
ULTIMATE AXIAL CAPACITY
AP
I
RP
2A (2000) Method
42-in
.
-Diameter
Driven Pipe Piles
Texas Offshore Port System, SPM
#1 Anchor Leg #2
Block A-59, Ga
l
veston Area
I
Report
No. 0201-6505
-
@
---
PLATE
3-18
.S!
..
0
~
1~
~1
[
!
~
(
a,
"-\
~
>,
>,
m
m
"O
"O
.,
~
K
.,
u
s:
a.
u
<(
PENETRATION
BELOW
CURVE POINTS
MUDLINE
(fe
et)
1
2
3
4
5
0
.
0
t
0
.
00
0
.
00
0
.
00
0
.
00
0
.
00
z
0
.
00
0
.
07
0
.
13
0
.
24
0.34
1
.
0
t
0
.
00
0
.
03
0
.
04
0
.
06
0
.
08
z
0
.
00
0
.
07
0
.
13
0
.
24
0
.
34
2
.
0
t
0.00
0
.
03
0
.
05
0.08
0
.
09
z
0
.
00
0
.
07
0
.
13
0
.
24
0
.3
4
2.0
t
0
.
00
0
.
04
0
.
04
z
0.00
0
.
10
42
.
00
15
.
0
t
0
.
00
0
.
33
0
.
33
z
0.00
0
.
10
42.00
15
.
0
t
0.00
0
.
19
0
.
19
z
0
.
00
0
.
10
42
.
00
30
.
0
t
0
.
00
0.37
0
.
37
z
0
.
00
0.10
42
.
00
30
.
0
t
0
.
00
0
.
15
0.26
0.38
0.46
z
0
.
00
0
.
07
0.13
0
.
24
0.34
77.0
t
0
.
00
0
.
33
0.56
0
.
84
1
.
00
z
0
.0
0
0
.
07
0
.
13
0.24
0.34
89
.
0
t
0
.
00
0
.
38
0
.
63
0
.
95
1
.
14
z
0
.
00
0.07
0.13
0
.
24
0.34
97
.
0
t
0
.
00
0.41
0.69
1
.
03
1
.
24
z
0
.0
0
0
.
07
0
.
13
0
.
24
0
.
34
100
.
0
t
0.00
0.42
0
.
71
1.06
1.27
z
0
.
00
0.07
0.13
0
.
24
0.34
131
.
0
t
0
.
00
0
.
55
0
.
91
1.37
1.65
z
0
.
00
0.07
0.13
0.24
0
.
34
Notes
:
1
.
"t"
is
mobilized
soil-p
ile
adhesion, [ksf).
2.
"z"
is a
xi
a
l
pile d
i
splacement, [in
.
]
.
3. Data for
tension
and compression coincide.
AXIAL
LOAD TRANSFER DATA
(T-Z DATA)
API RP 2A (2000) Method
42-in.-Diameter Driven Pipe
Piles
6
0
.
00
0
.
42
0
.
08
0.42
0
.
10
0.42
0
.
5
1
0.42
1
.
11
0.42
1
.
27
0.42
1.37
0.42
1.41
0.42
1
.
83
0.42
I
Report No
.
0201-6505
-
l
'IP
Texas
Offshore
Port
System, SPM
#1
Anchor Leg
#2
Block A-59,
Galveston
Area
7
8
0
.
00
0
.
00
0
.
84
42
.
00
0.08
0
.
08
0
.
84
42
.
00
0.09
0
.09
0
.
84
42
.
00
0.46
0.46
0
.
84
4
2.00
1
.
00
1
.
00
0.84
42
.
00
1.14
1
.
14
0.84
42
.
00
1.24
1
.
24
0
.
84
42
.
00
1
.
27
1
.
27
0.84
42
.
00
1.65
1
.
65
0
.
84
42
.
00
PLATE
3
-
19
I
~
I
t
~
1
0
;.:.
;.:.
m
m
'O
'O
....
>
.><
0
0
a.
.c
QJ
c.
()
.,:
PENETRATION
BELOW
CURVE POINTS
MUDLINE
(feet)
1
2
3
4
5
6
30.0
Q
0
13
26
39
47
52
z
0.00
0.08
0
.
55
1.76
3
.
07
4
.
20
13
1
.0
Q
0
43
87
130
156
173
z
0.00
0
.
08
0.55
1.76
3.07
4.20
Notes: 1
.
"Q"
is mobilized end bearing capacity,
[kips]
.
2.
"
z"
is axial tip displacement,
[in
.].
AXIAL LOAD TRANSFER DATA
(Q-Z DATA)
API RP
2A (2000) Method
42-in.-Diameter Driven Pipe Piles
Texas Offshore Port System, SPM
#1 Anchor Leg
#2
Block A
-5
9, Galveston Area
Report No.
0201-6505
-r<.F6
-
-
7
52
42.00
173
42
.
00
PLATE 3-20
I
~
I
~
.
~
l
!
I
~
I
f
l
(
-
0
Local Scour
Loose sandy silt to silty fine sand
interlayered with sandy silty clay
Firm to ve stiff clay
Notes:
r
Penetration
o
~-----------~
2
'
---------
Scour to 5'
5'
-
-
-
-
-
-
-
-
-
k
=40
pci
15'
---------
k
=
10
pci
30'
---------
E
50
= 2.0 % at 30'
decreasing linearly to
E50 =1
.
0
% at
100'
100'
-
-
-
-
-
-
-
-
-
1. E:
50
is axial strain at half of peak deviator stress for cohesive soils.
2. Soil strength parameters are shown on Plate 3-14
.
3
.
Submerged unit weight profile is shown on Plate 3-15.
4.
k is the modulus of horizontal subgrade reaction for granular soils.
STRATIGRAPHY AND PARAMETERS FOR P-Y DATA
Texas Offshore Port System, SPM
#1 Anchor Leg #2
Block A-59, Galveston Area
_
(lJ!l
eport No
.
0201-6505
---------------- ----
PLATE 3-21
0
~
I
~
1
i
~
r
!
l
0
PENETRATION
BELOW
MU DUNE
(feet)
1
0.0
p
0
y
0
.
00
5.0
p
0
y
0
.
00
9
.
0
p
0
y
0
.
00
12.0
p
0
y
0.00
15
.
0
p
0
y
0.00
15.0
p
0
y
0
.
00
19
.
0
p
0
y
0.00
23.0
p
0
y
0.00
30.0
p
0
y
0
.
00
30
.
0
p
0
y
0.00
100.0
p
0
(and below)
y
0
.
00
Notes: 1
.
"p" is so
i
l resistance, [lb/in.].
2
.
'Y'
is lateral deflection, [in.]
.
CURVE POINTS
2
3
4
5
0
42.00
0
42
.
00
164
273
361
454
0
.
06
0.11
0.15
0.23
404
674
890
1119
0.08
0.15
0.22
0
.3
2
745
1242
1640
2062
0
.
11
0
.
19
0
.
28
0.42
329
549
724
911
0.19
0
.
34
0.49
0
.
74
499
831
1097
1380
0.23
0.40
0.58
0
.
8.7
690
1150
1518
1909
.
0.26
0.46
0.66
0
.
99
1098
1830
2415
3038
0.31
0
.
56
0
.
81
1
.
21
236
362
535
787
0
.
06
0
.
21
0
.
63
2
.
10
618
948
1401
2061
0.03
0.10
0.31
1.05
P-Y DATA
(CYCLIC LOADING)
API RP
2A (2000) Method
42-in
.
-Diameter Driven Pipe Piles
6
519
0.35
1281
0.50
2360
0.64
1042
1.13
1579
1
.
34
2185
1
.
53
3477
1
.
86
1134
6.30
2967
3
.
15
Texas Offshore Port System, SPM #1 Anchor Leg #2
Block A
-
59, Galveston Area
!
Report No
.
0201-6505
-
@
--
7
8
541
547
0.51
42
.
00
1334
1348
0
.
72
42
.
00
2459
2484
0
.
93
42
.
00
1086
1097
1
.
64
42
.
00
1646
1662
1.93
42.00
2277
2300
2.21
42.00
3623
3660
2.69
42.00
1134
42.00
2967
42.00
PLATE
3-22
!
~
Date
1
~
July 4, 2008
ts-'
l
l
~
f
~
~
l
~
~
~
~
'i
~
I
Report
No. 0201-6505
-
@
--
-
---
Time
From
T
o
Desc
ri
ption of Activities
****
0950
Arrive
in Block A-59, Galveston Area, SPM #1
Anchor Leg #2 location onboard the vesse
l
RIV
Seaprobe.
0950
1200
Wait on weather. (Seas: 6 ft, Winds:
45
mph
gusts.)
****
1130
Conduct pre-sh
i
ft safety meeting.
1200
1340
Set 4-pt anchor spread.
****
1245
Conduct task change safety meeting.
1
340
1400
Rig up to drill and
samp
l
e.
****
1400
Estimate water depth
of 118 ft with vessel's echo
sounder and 122
ft using wireline techn
i
que.
1400
1420
R
un
sca
n
ning sonar
1420
1440
Run drill pipe to mudline
.
****
1440
Measure water depth of 123 ft with the bottom
sensor/p
i
pe ta
ll
y and 122.3 ft
with
pressu
r
e
transducer.
1440
2130
Dr
il
l and sample. Boring te
r
minated at 131-ft
penetration
.
2
1
30
2200
Pu
ll
drill p
i
pe above mudline and reposition vessel.
****
2200
Measure supplemental water depth o
f
122
ft
w
i
th
the bottom sensor/pipe tally and 120.5 ft with
pressure transducer
.
2200
2225
Pu
ll
dri
ll
pipe to deck and secure equipment for
trave
l.
2225
2340
Pu
ll
anchors.
2340
****
Depart
l
ocation.
.
SUMMARY OF FIELD OPERATIONS
Texas Offshore Port Sys
t
em, SPM
#1
Anchor Leg #2
Block A-59, Ga
l
veston Area
PLATE
A-2
I
@
:;o
(1)
"O
0
;:i.
z
?
0
IV
.....
0
6,
01
0
u,
Checked By:
;ftJ
Approved By: ~-.
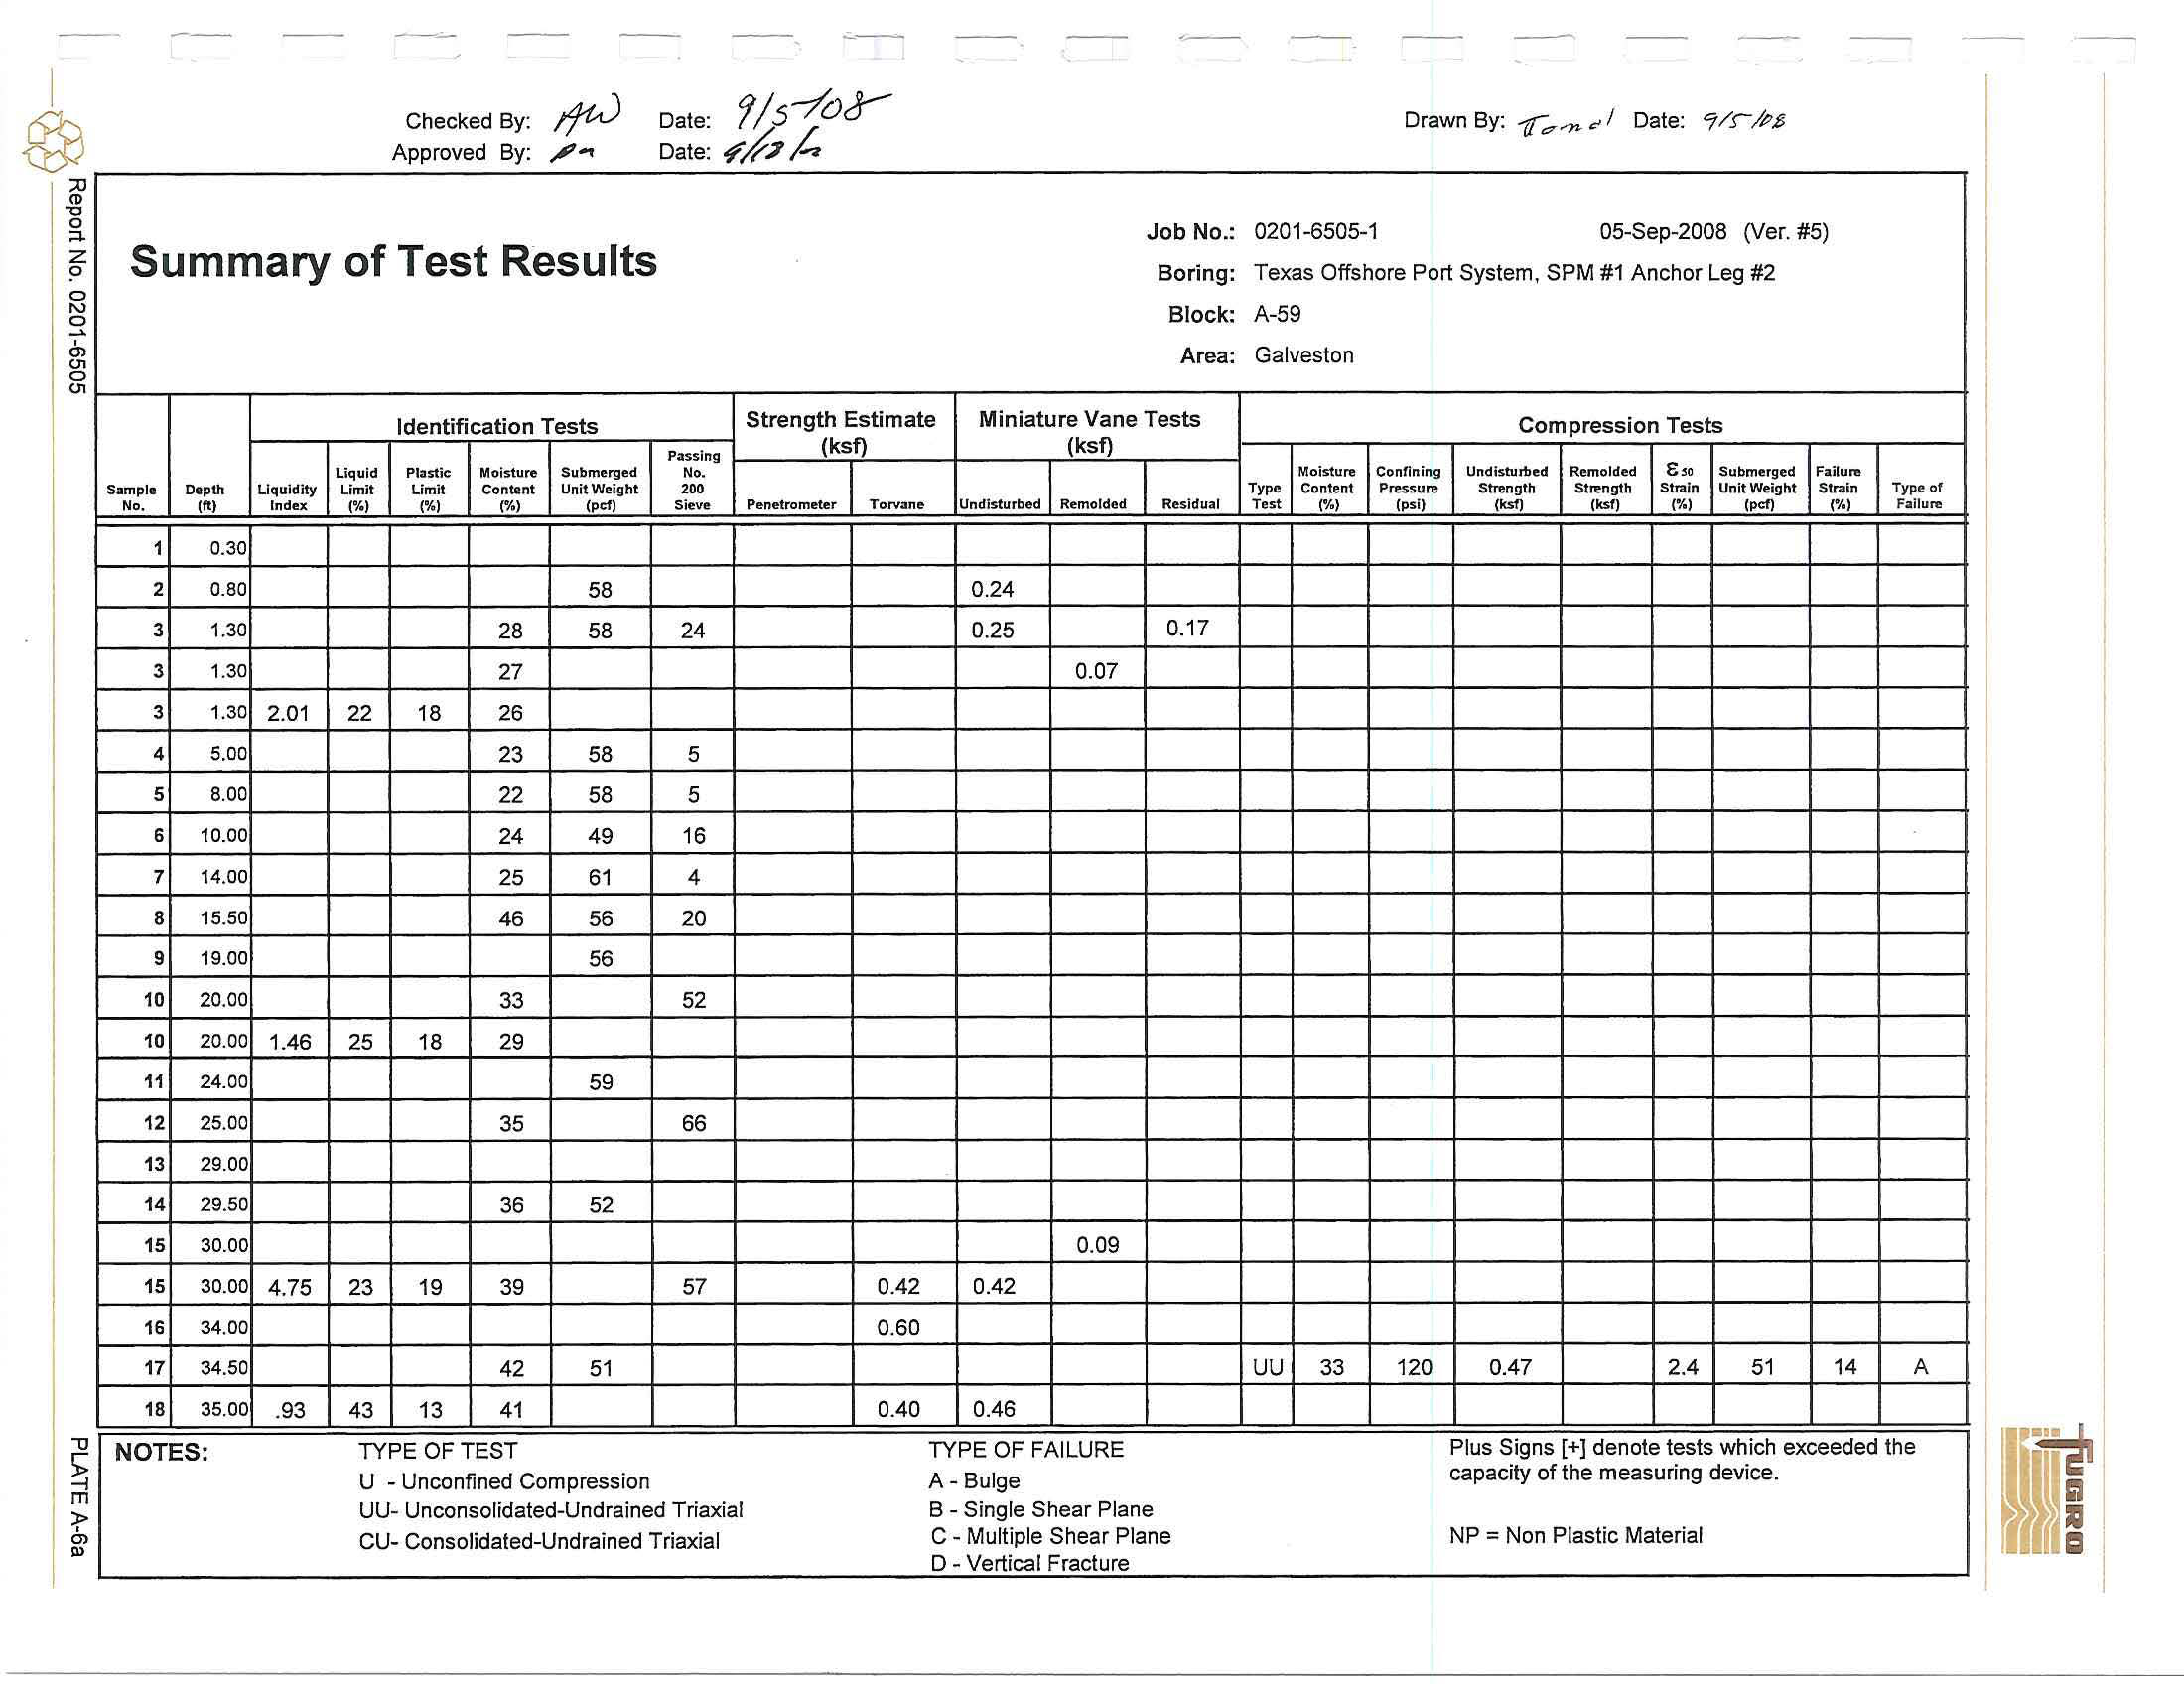
Summary of Test Results
Date
:
'//5-/oJ-
Date:
ihh
Job No
.
:
Bo
ring:
Block
:
A
rea
:
Identification Tests
S
trengt
h
E
s
timate
Miniatu
r
e V
a
ne Tests
Passing
(ksf)
(ksf)
Li
quid
P
l
astic
Moisture
Submerged
No
.
S•mp
l
e
D
e
pth
Liquidity
Limit
limit
Content
Unit Weigh
t
20
0
No
.
(ft)
I
n
dex
(
%
)
(
'!.
)
r/,)
(pcf)
Sieve
Penet
r
ometer
Torvane
Undisturbed
Remolded
Residual
1
0.30
2
0.80
58
0
.
24
3
1.30
28
58
24
0.25
0
.1
7
3
1.30
27
0.07
3
1.30
2
.
01
22
18
26
4
5.00
23
58
5
5
8
.
00
22
58
5
6
10.00
24
49
16
7
14
.
00
25
6
1
4
8
15
.
50
46
56
20
9
19
.
00
56
1
0
20
.
00
33
52
10
20.00
1.46
25
18
29
11
24.00
59
12
25
.
00
35
66
13
29.00
14
29.50
36
52
15
30.00
0
.
09
15
30.00
4.7
5
23
1
9
39
57
0.42
0.42
16
34
.
00
0.60
17
3
4
.
50
42
51
18
35.00
.
93
43
13
41
0.40
0.46
NOT
ES
:
TY
PE
O
FTE
S
T
TY
PE
O
F F
AILUR
E
U
- Unconfined Com
pr
es
s
ion
A- Bulge
UU- U
n
conso
lid
a
t
e
d-
Und
r
ai
n
ed Triaxia
l
B
-
Sing
l
e Shear Plane
CU
-
Co
n
solidated-Undrained Triaxial
C - Mu
l
tiple Shear Pla
n
e
D
-
Vertical F
r
act
ur
e
Drawn By:
f"'=
c'
I
Date:
'7/S-
IP.S
0201
-6
505-1
05-Se
p
-2008
0fer. #5)
Texas Offsho
r
e Port System
.
SPM
#1 Anchor Leg #2
A-59
Galves
t
on
Compressi
o
n Tests
Moisture
Confining
Undi
s
turbed
Remolded
t,o
Submerged
F:ailunt
Type
Content
Pressure
Strength
St~ngth
Strain
Unit Weight
Strai
n
T
y
p
e
of
Test
,
~.
,
(psi)
(ksf)
(ks!)
('!.
)
(pcf)
(
'
!.
)
Failure
u
u
33
120
0.47
2.4
51
14
A
Plus Sig
n
s [+
]
de
n
ote tests w
h
ich exceeded the
ca
p
aci
t
y
of the meas
ur
ing device
.
NP= Non Plas
t
ic Material
I
@
:;o
CD
't:l
0
::1-
z
~
0
N
0
-
Cl)
01
0
01
Checke
d B
y: J'9{,J
A
p
proved By:
~
....
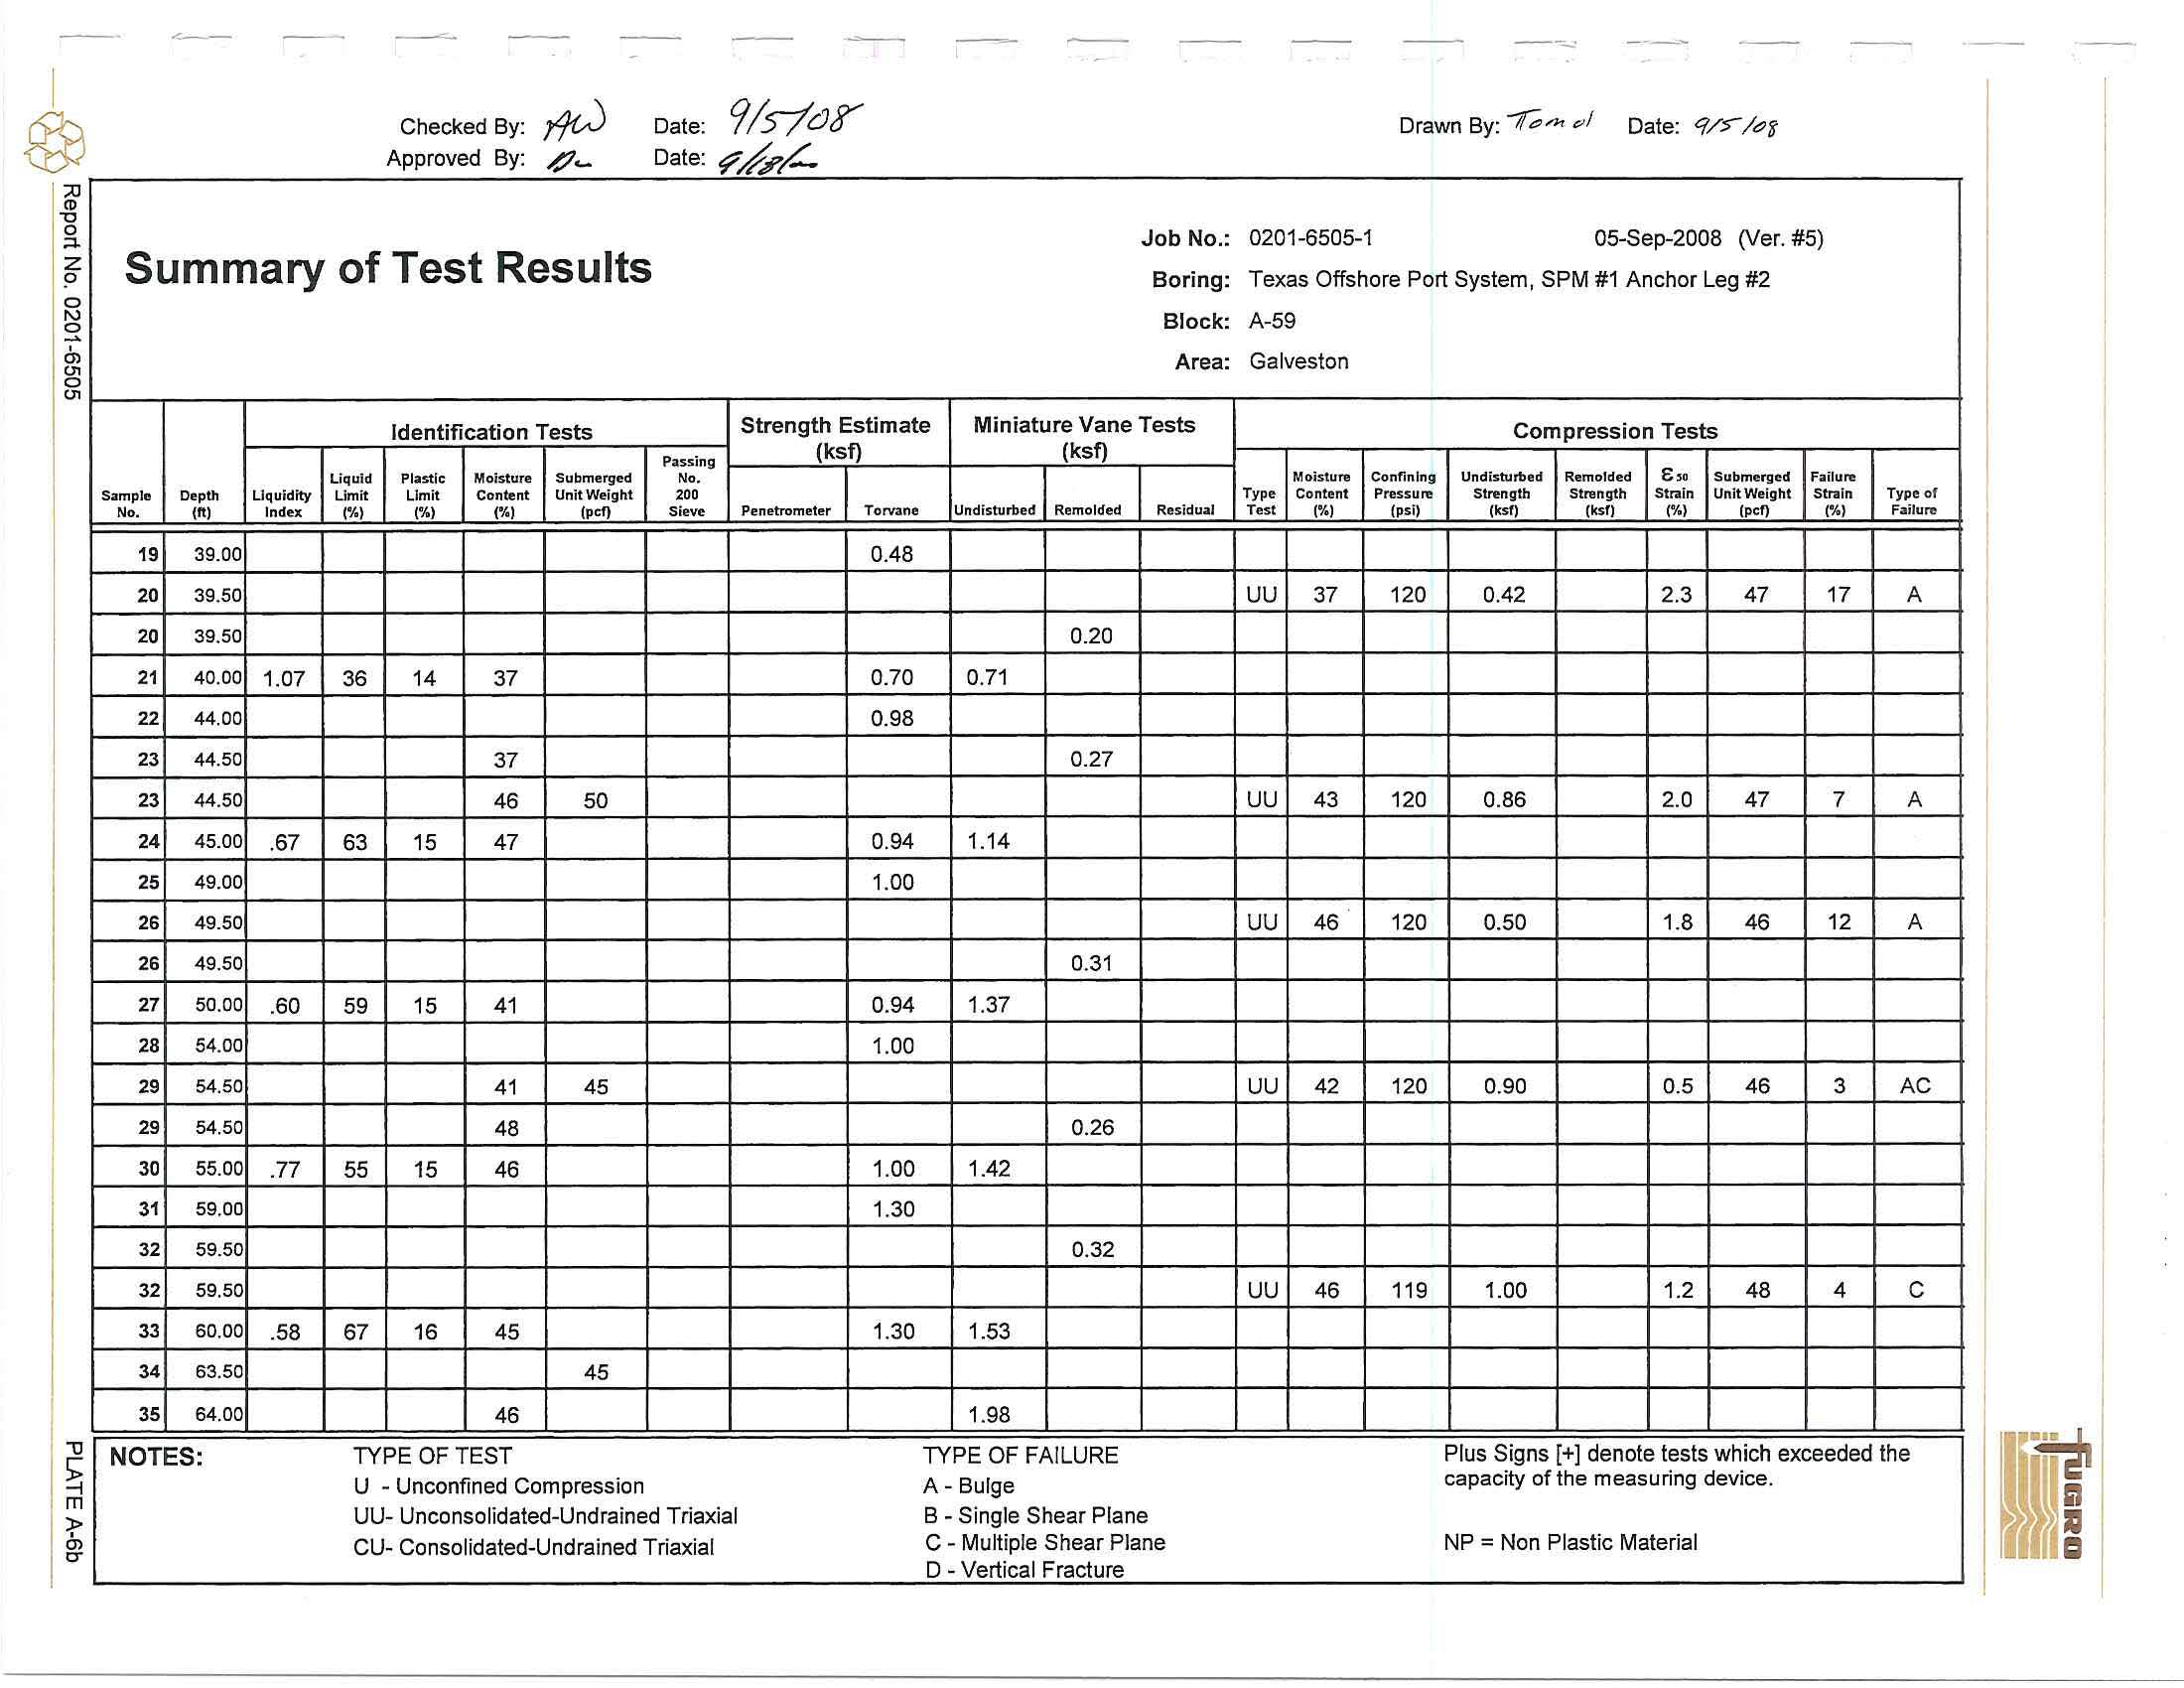
Summary of Test Results
Da
t
e:
9/s-;'cJJY
Da
t
e:
~
#;'/-
J
ob N
o
.
:
B
o
rin
g
:
Bl
o
ck
:
A
r
ea
:
Id
enti
fic
ation Te
s
ts
S
trength
Es
tim
a
te
Min
i
ature
Va
ne
T
es
ts
Passing
(ksf)
(ksf)
Liquid
Plasti
c
Moisture
Submerged
No.
Sample
Depth
Liquidity
Limit
Li
m
it
C
ontent
U
nit Weight
200
N
o.
(II)
I
n
dex
('/,)
(%
)
('
/,
)
(pcf)
S
i
eve
Pe
n
etrome
t
er
Torva
n
e
U
n
disturbed
Remolded
Residual
1
9
39.00
0.48
20
39
.
50
2
0
39.50
0
.
20
21
40.00
1.07
36
14
37
0.70
0.71
22
44
.
00
0.98
23
44
.
50
37
0
.
27
23
44
.
50
46
5
0
2
4
45
.
00
.67
63
15
47
0
.
94
1.
1
4
25
49.00
1
.00
2
6
49
.
50
26
49
.
50
0.31
27
50.00
.60
59
15
41
0.94
1.37
28
54
.0
0
1.00
29
54
.
50
4
1
45
29
54.50
48
0.26
3
0
55.00
.77
55
15
46
1.00
1.42
31
59
.
00
1
.
30
32
59.50
0.32
3
2
59.50
3
3
60.00
.
5
8
67
1
6
45
1.30
1.
53
34
63
.
50
45
35
64.00
4
6
1
.
98
NOTE
S:
TY
P
E
OF
TE
S
T
TYP
E
O
F
FAI
L
U
RE
U
-
U
n
co
nfin
ed Compression
A
- Bul
ge
UU
-
Uncons
o
lidat
e
d
-U
ndrai
n
ed T
r
iaxial
B
-
Si
n
g
l
e Shea
r Pl
ane
CU- Co
n
solidated
-
Undrained
T
riaxial
C - M
ult
iple Shea
r
Pla
n
e
D
- Ve
rt
ical
F
rac
t
ure
Dr
aw
n B
y:
"'1(;,,.,,
.,,/
Date:
q/:,
/t:JF
0201-6505-1
0
5
-Se
p
-
2
0
0
8
0/er. #5)
T
exas Offshore Port Syste
m
, S
P
M #
1
A
n
chor
L
eg #2
A-59
Ga
l
v
e
ston
Co
m
p
ression Tests
Moisture
Confining
Undisb.lrbed
Remo1ded
e,.
Submerge
d
Fai
l
ure
T
ype
Content
P
ressure
Strength
Strength
Stra
in
Unit Weight
Strai
n
T
ype
of
T
est
(
'
!,)
(psi
)
(ks!)
(ksf)
(
Y,J
(
p
ct)
(
'/,)
Failure
uu
37
120
0.42
2.3
47
17
A
uu
43
120
0.86
2.0
47
7
A
uu
46
120
0.50
1.8
46
12
A
uu
42
120
0.90
0.5
4
6
3
AC
uu
46
1
1
9
1.
00
1.
2
48
4
c
I
P
lus Sig
n
s [+]
d
e
no
te tests
w
hi
c
h
exceeded the
capac
it
y
of t
h
e
m
easuring dev
i
ce.
N
P
=
Non Plast
i
c Mate
ri
a
l
~
if
I
J-
0.