I
I
Appendix B contains discussions of analytical procedures used in our engineering analyses. Appendix C
contains a positioning report by Fugro Chance, Inc.,
of Lafayette, Louisiana.
For the purposes
of discussion and presentation, "driven pipe pile" is used in this report to represent
foundation piles, caissons and conductors, unless otherwise specified.
2.2 FIELD AND LABORATORY INVESTIGATIONS
The field investigation was performed
on June 26 through 28, 2008, from the RN
Seaprobe.
The
soil conditions were determined by performing four exploratory borings, two at each SPM location with one
boring at a selected anchor leg location, and one boring at the proposed PLET location. Enterprise Field
Services selected the boring locations. These borings were drilled to a penetration of 131-ft below mudline.
The water depths
at the boring locations ranged from 110 to 113 It. A chronological summary of field
operations is presented
in Appendix A.
2.2.1
Exploratory Borings
FMMG personnel drilled the soil borings with a DMX drill rig positioned over the centerwell of the
RN
Seaprobe.
The vessel was anchored at the boring location by a 4-point mooring system.
Soil
conditions
at the site were explored by drilling a group of four soil borings to 131-ft penetration below the
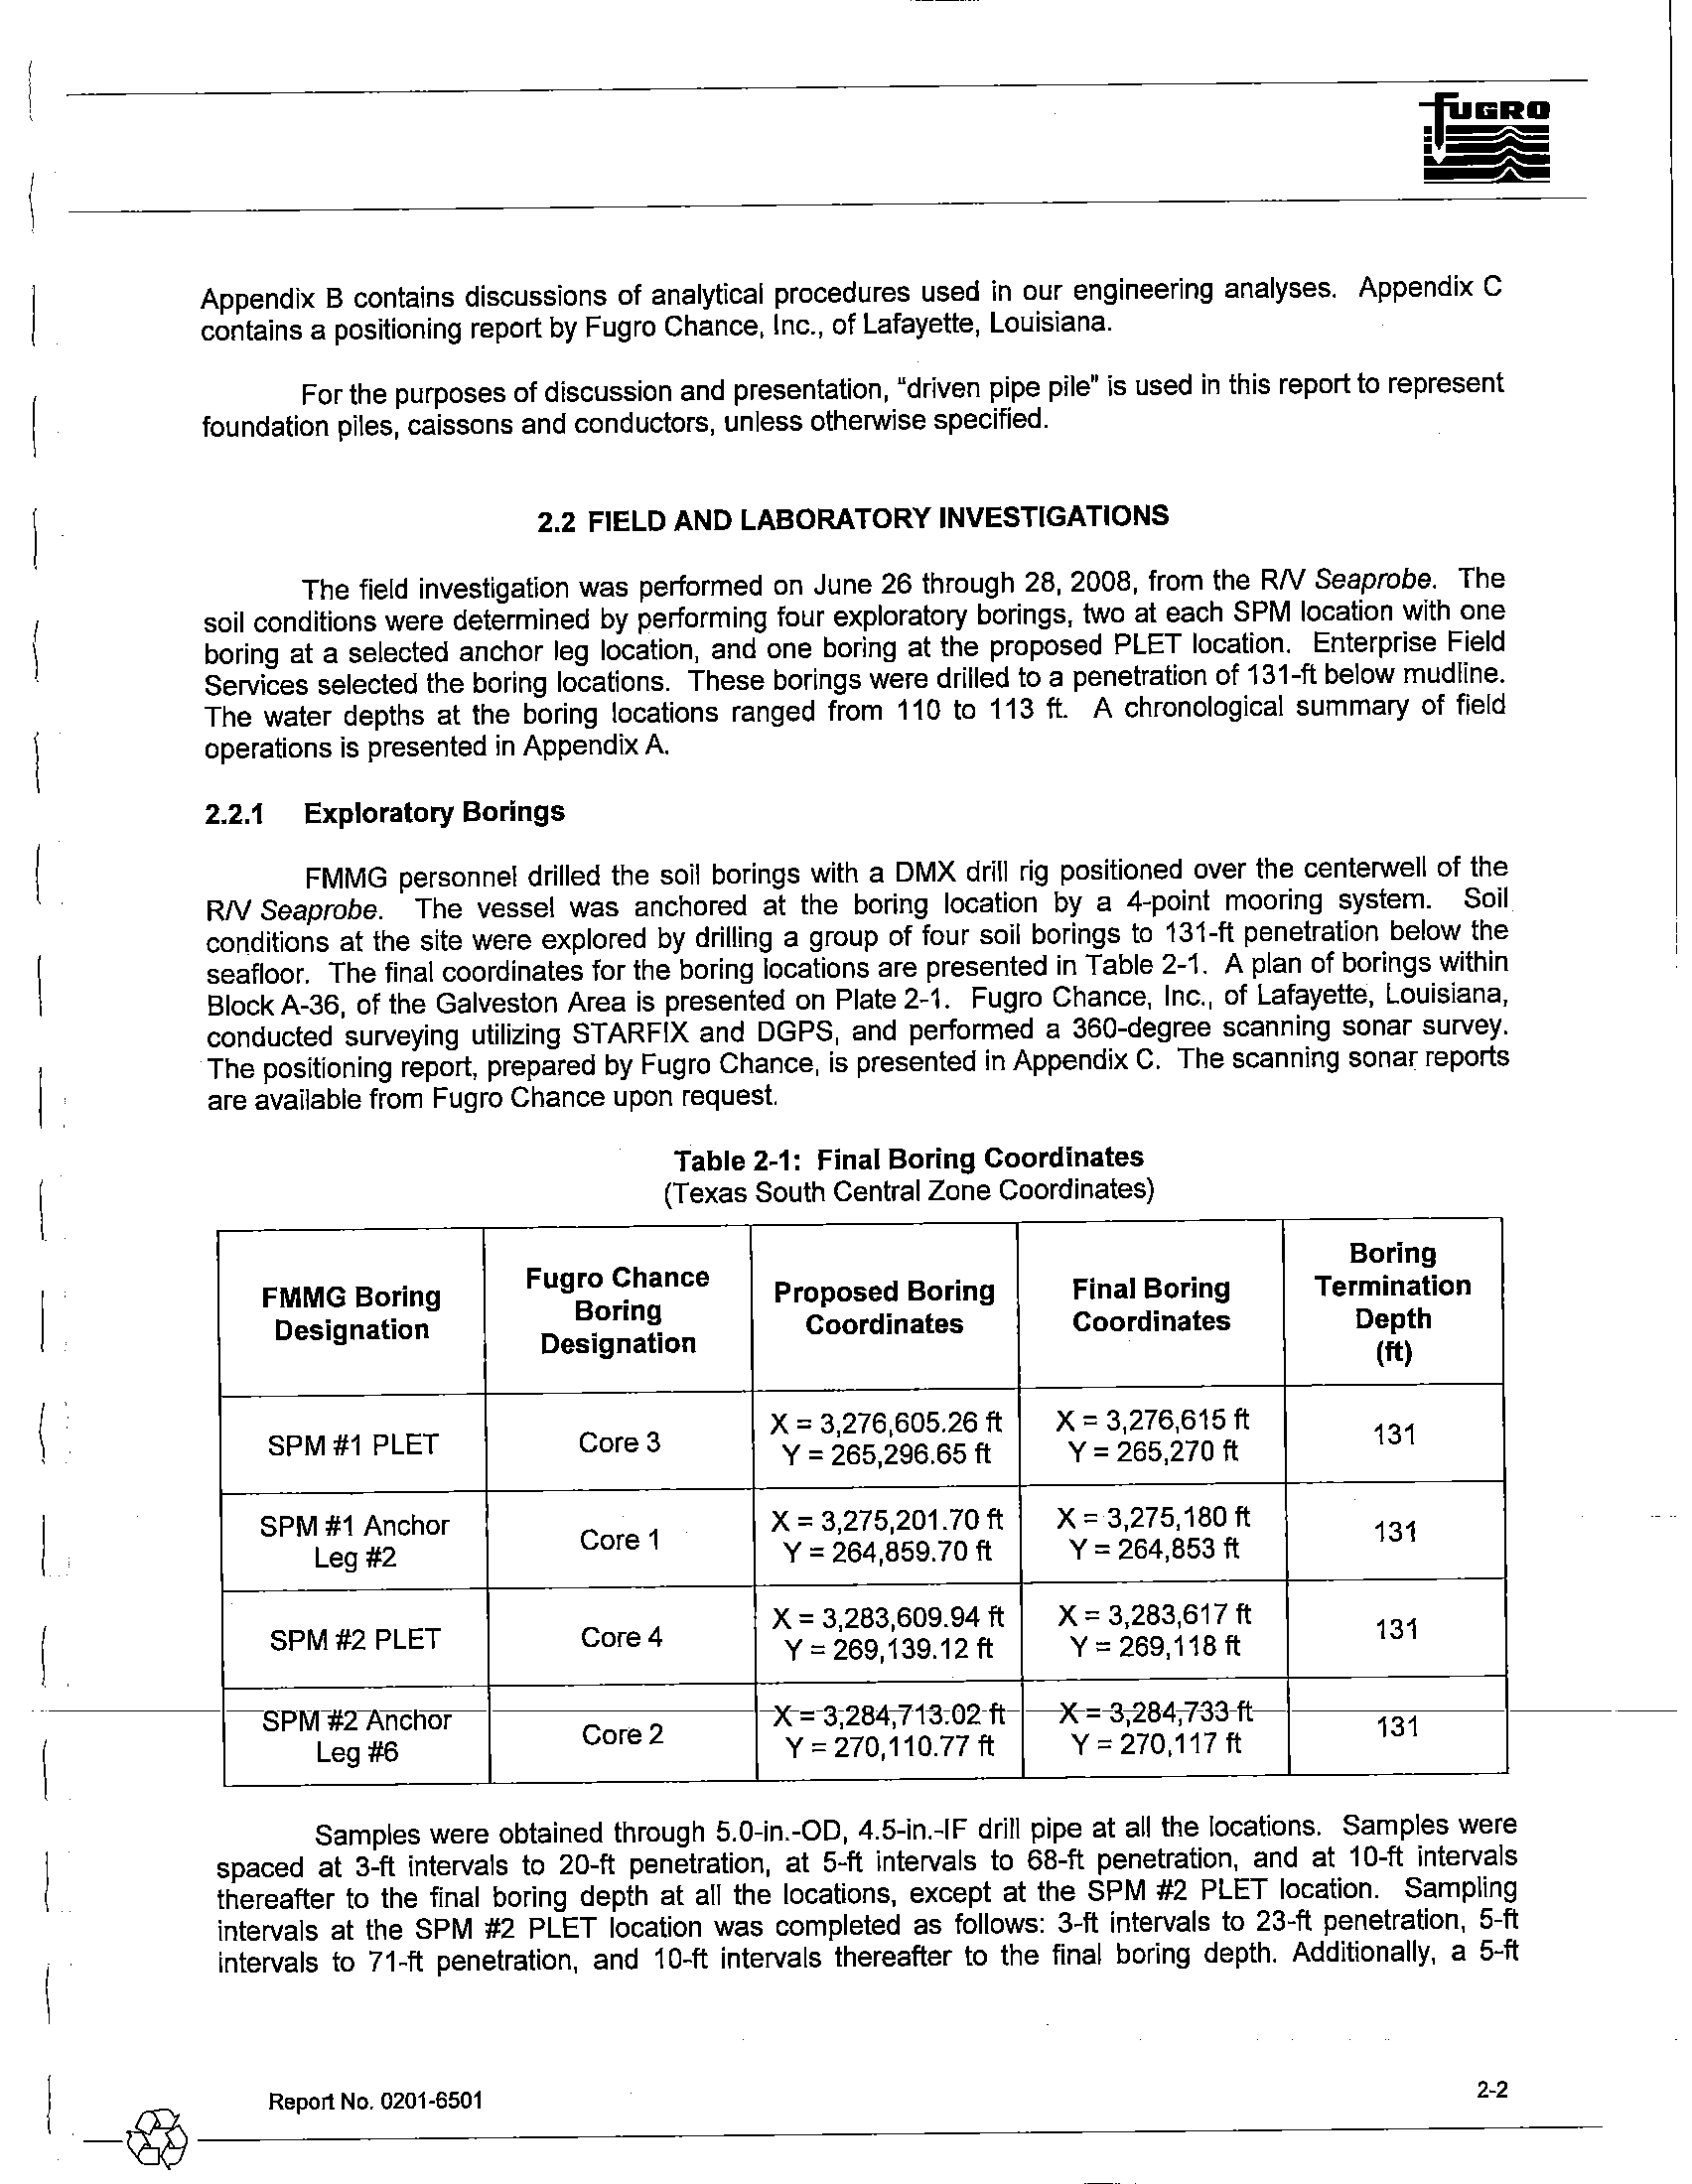
seafloor. The final coordinates
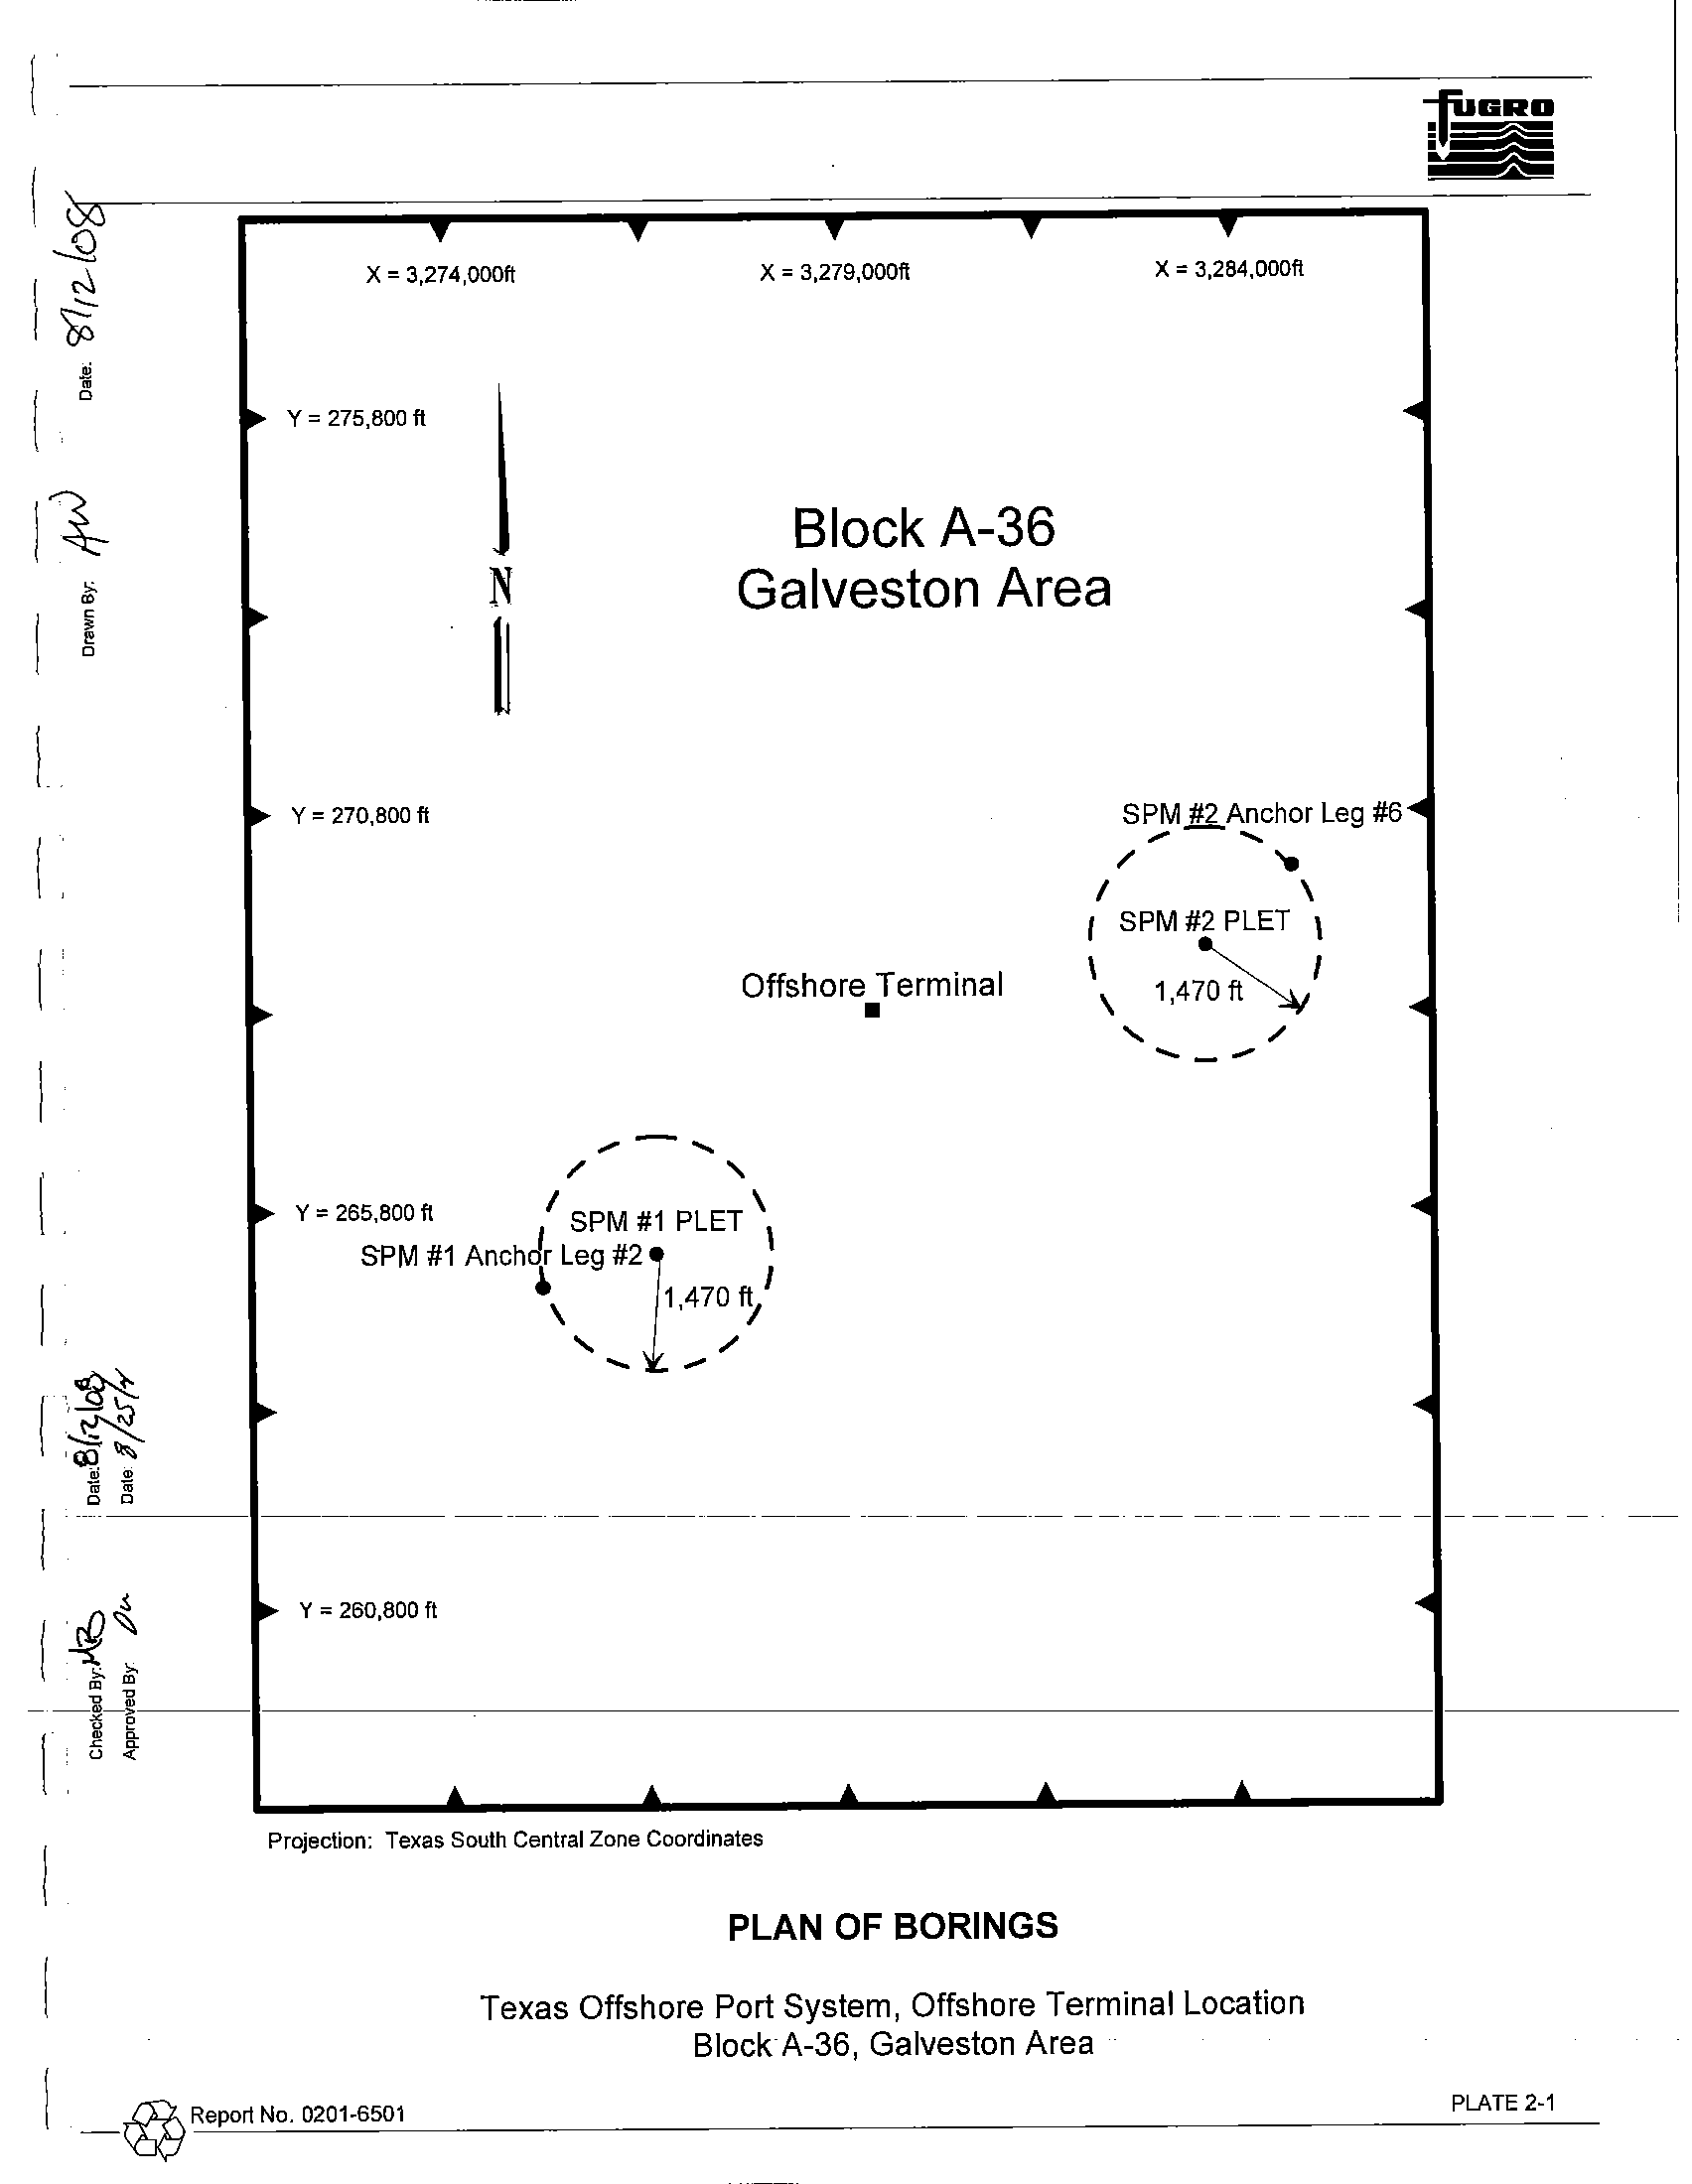
for the boring locations are presented in Table 2-1. A plan of borings within
BlockA-36, of the Galveston Area is presented on Plate 2-1. Fugro Chance, Inc., of Lafayette, Louisiana,
conducted surveying utilizing STARFIX and DGPS, and performed a 360-degree scanning sonar survey.
The positioning report, prepared by Fugro Chance, is presented in Appendix
C. The scanning sonar reports
are available from Fugro Chance upon request.
FMMG
Boring
Designation
SPM #1 PLET
SPM
#1 Anchor
Leg #2
SPM#2 PLET
SPM-#TAncnor
Leg
#6
Table 2-1: Final Boring Coordinates
(Texas South Central Zone Coordinates)
Fugro Chance
Boring
Proposed Boring
Final Boring
Designation
Coordinates
Coordinates
Core 3
X = 3,276,605.26 ft
X = 3,276,615 ft
Y = 265,296.65 ft
Y = 265,270 ft
Core 1
X = 3,275,201.70 ft
X = 3,275,180 ft
Y = 264,859.70 ft
Y
=
264,853 ft
Core 4
X = 3,283,609.94 ft
X = 3,283,617 ft
Y
=
269,139.12 ft
Y = 269,118 ft
Core 2
X-=-3;284~7t3:02-ft-
-X-=-3;-284;-7-33-ft
Y = 270,110.77 ft
Y = 270,117 ft
Boring
Termination
Depth
(ft)
131
131
131
131
Samples were obtained through 5.0-in.-OD, 4.5-in.-IF drill pipe at all the locations. Samples were
spaced
at 3-ft intervals to 20-ft penetration, at 5-ft intervals to 68-ft penetration, and at 10-ft intervals
thereafter to the final boring depth at all the locations, except at the SPM #2 PLET location. Sampling
intervals at the SPM #2 PLET location was completed as follows: 3-ft intervals to 23-ft penetration, 5-ft
intervals to 71-ft penetration, and 10-ft intervals thereafter to the final boring depth. Additionally, a 5-ft
I
_~
____
R_ep_o_rt_N_O._O_20_1_-6_50_1____________________________
2_~
____
I
shallow boring, designated as Core 4A by Fugro Chance, was drilled at the SPM #2 PLET location to allow
re-sampling. The drilling and sampling techniques used to complete these borings are explained
in detail in
Appendix A.
Two water depths were measured at each boring location using a seafloor sensor seated in the drill
bit. The water depth measurements are tabulated in Table 2-2. These water depth measurements are
intended for the purpose
of the geotechnical investigation only, and are not corrected for tidal or other
variations.
If utilized for other purposes, the water depth measurement should be adjusted to account for
meteorological tide and datum corrections. The water depth measuring procedures are explained in detail
in Appendix A.
\ '
Table 2-2: Measured Water Depths
Boring
Water Depth
Time and Date
Supplemental
Time and Date
Designation
(ft)
of Measurement
Water Depth
of Measurement
(ft)
SPM#1 PLET
112
1630 hours on
113
2245 hours on
June 27,2008
June 27, 2008
SPM
#1 ANCHOR
113
2400 hours on
113
0605 hours
on
LEG #2
June 26, 2008
June 27, 2008
SPM#2 PLET
112
0250 hours
on
112
1030 hours
on
June 28, 2008
June 28, 2008
SPM #2 ANCHOR
110
1450 hours on
111
2105 hours on
LEG #6
June 28, 2008
June 28, 2008
2.2.2 Field and
Laboratory Tests
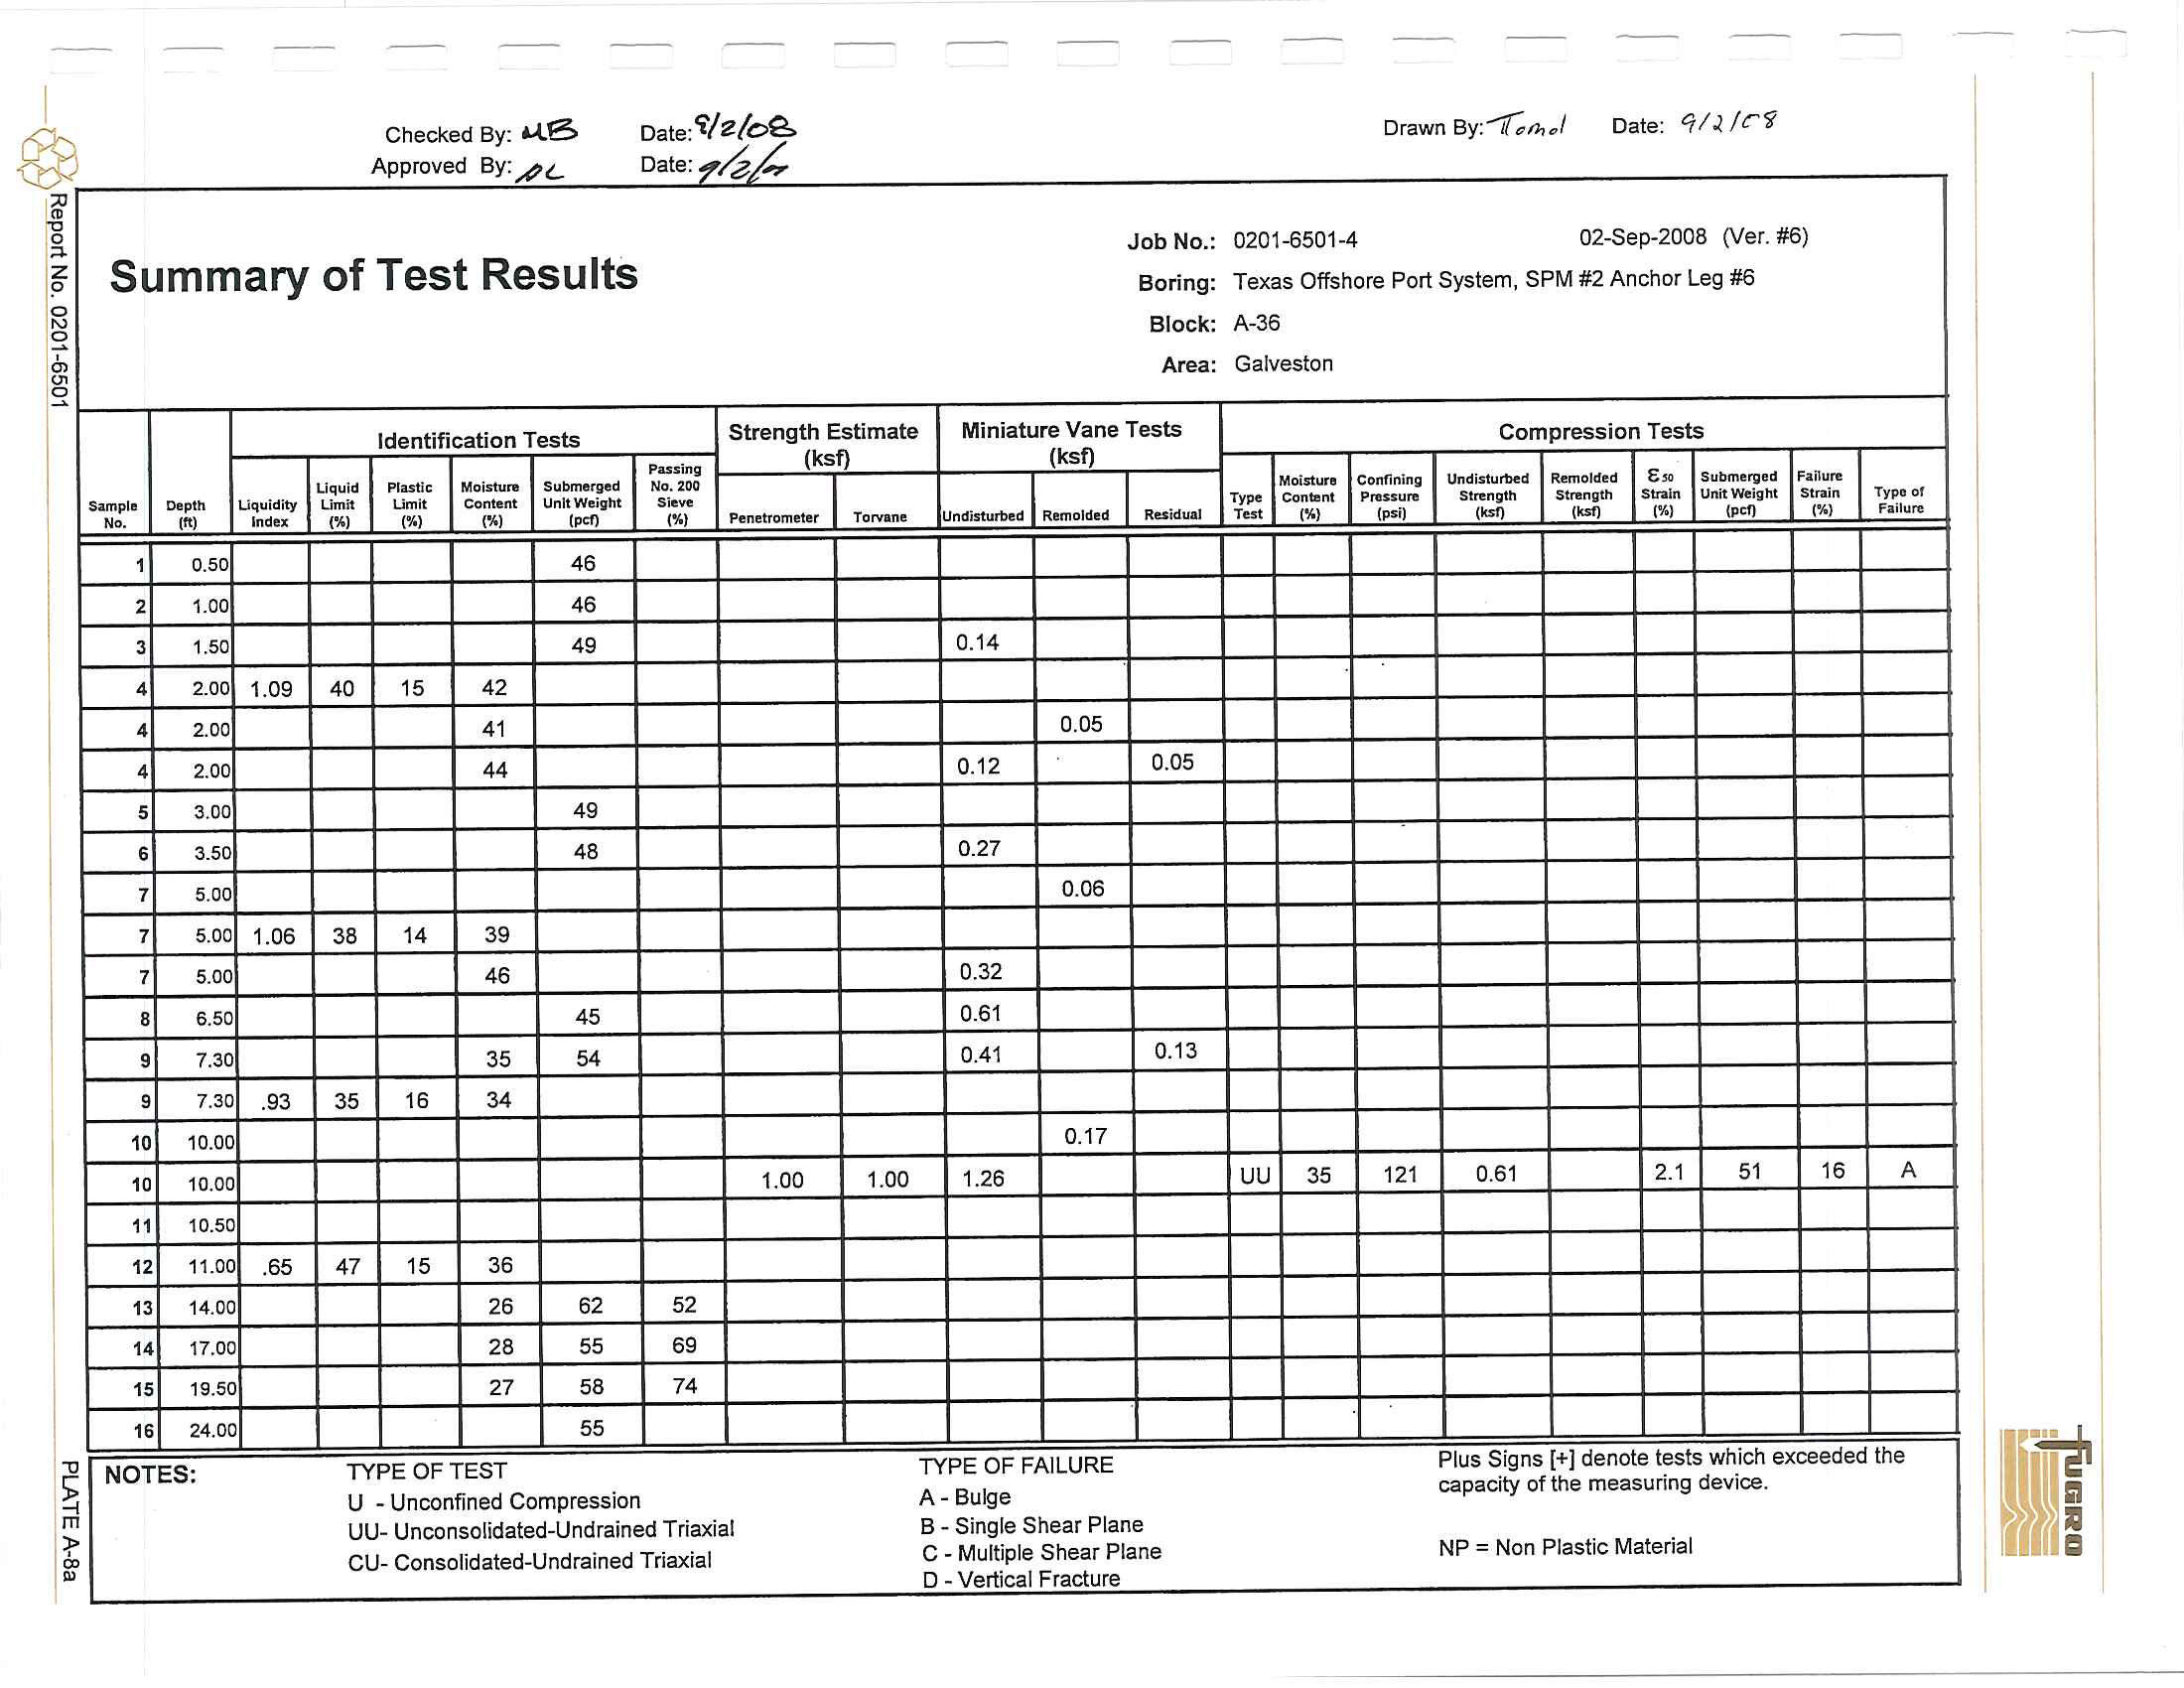
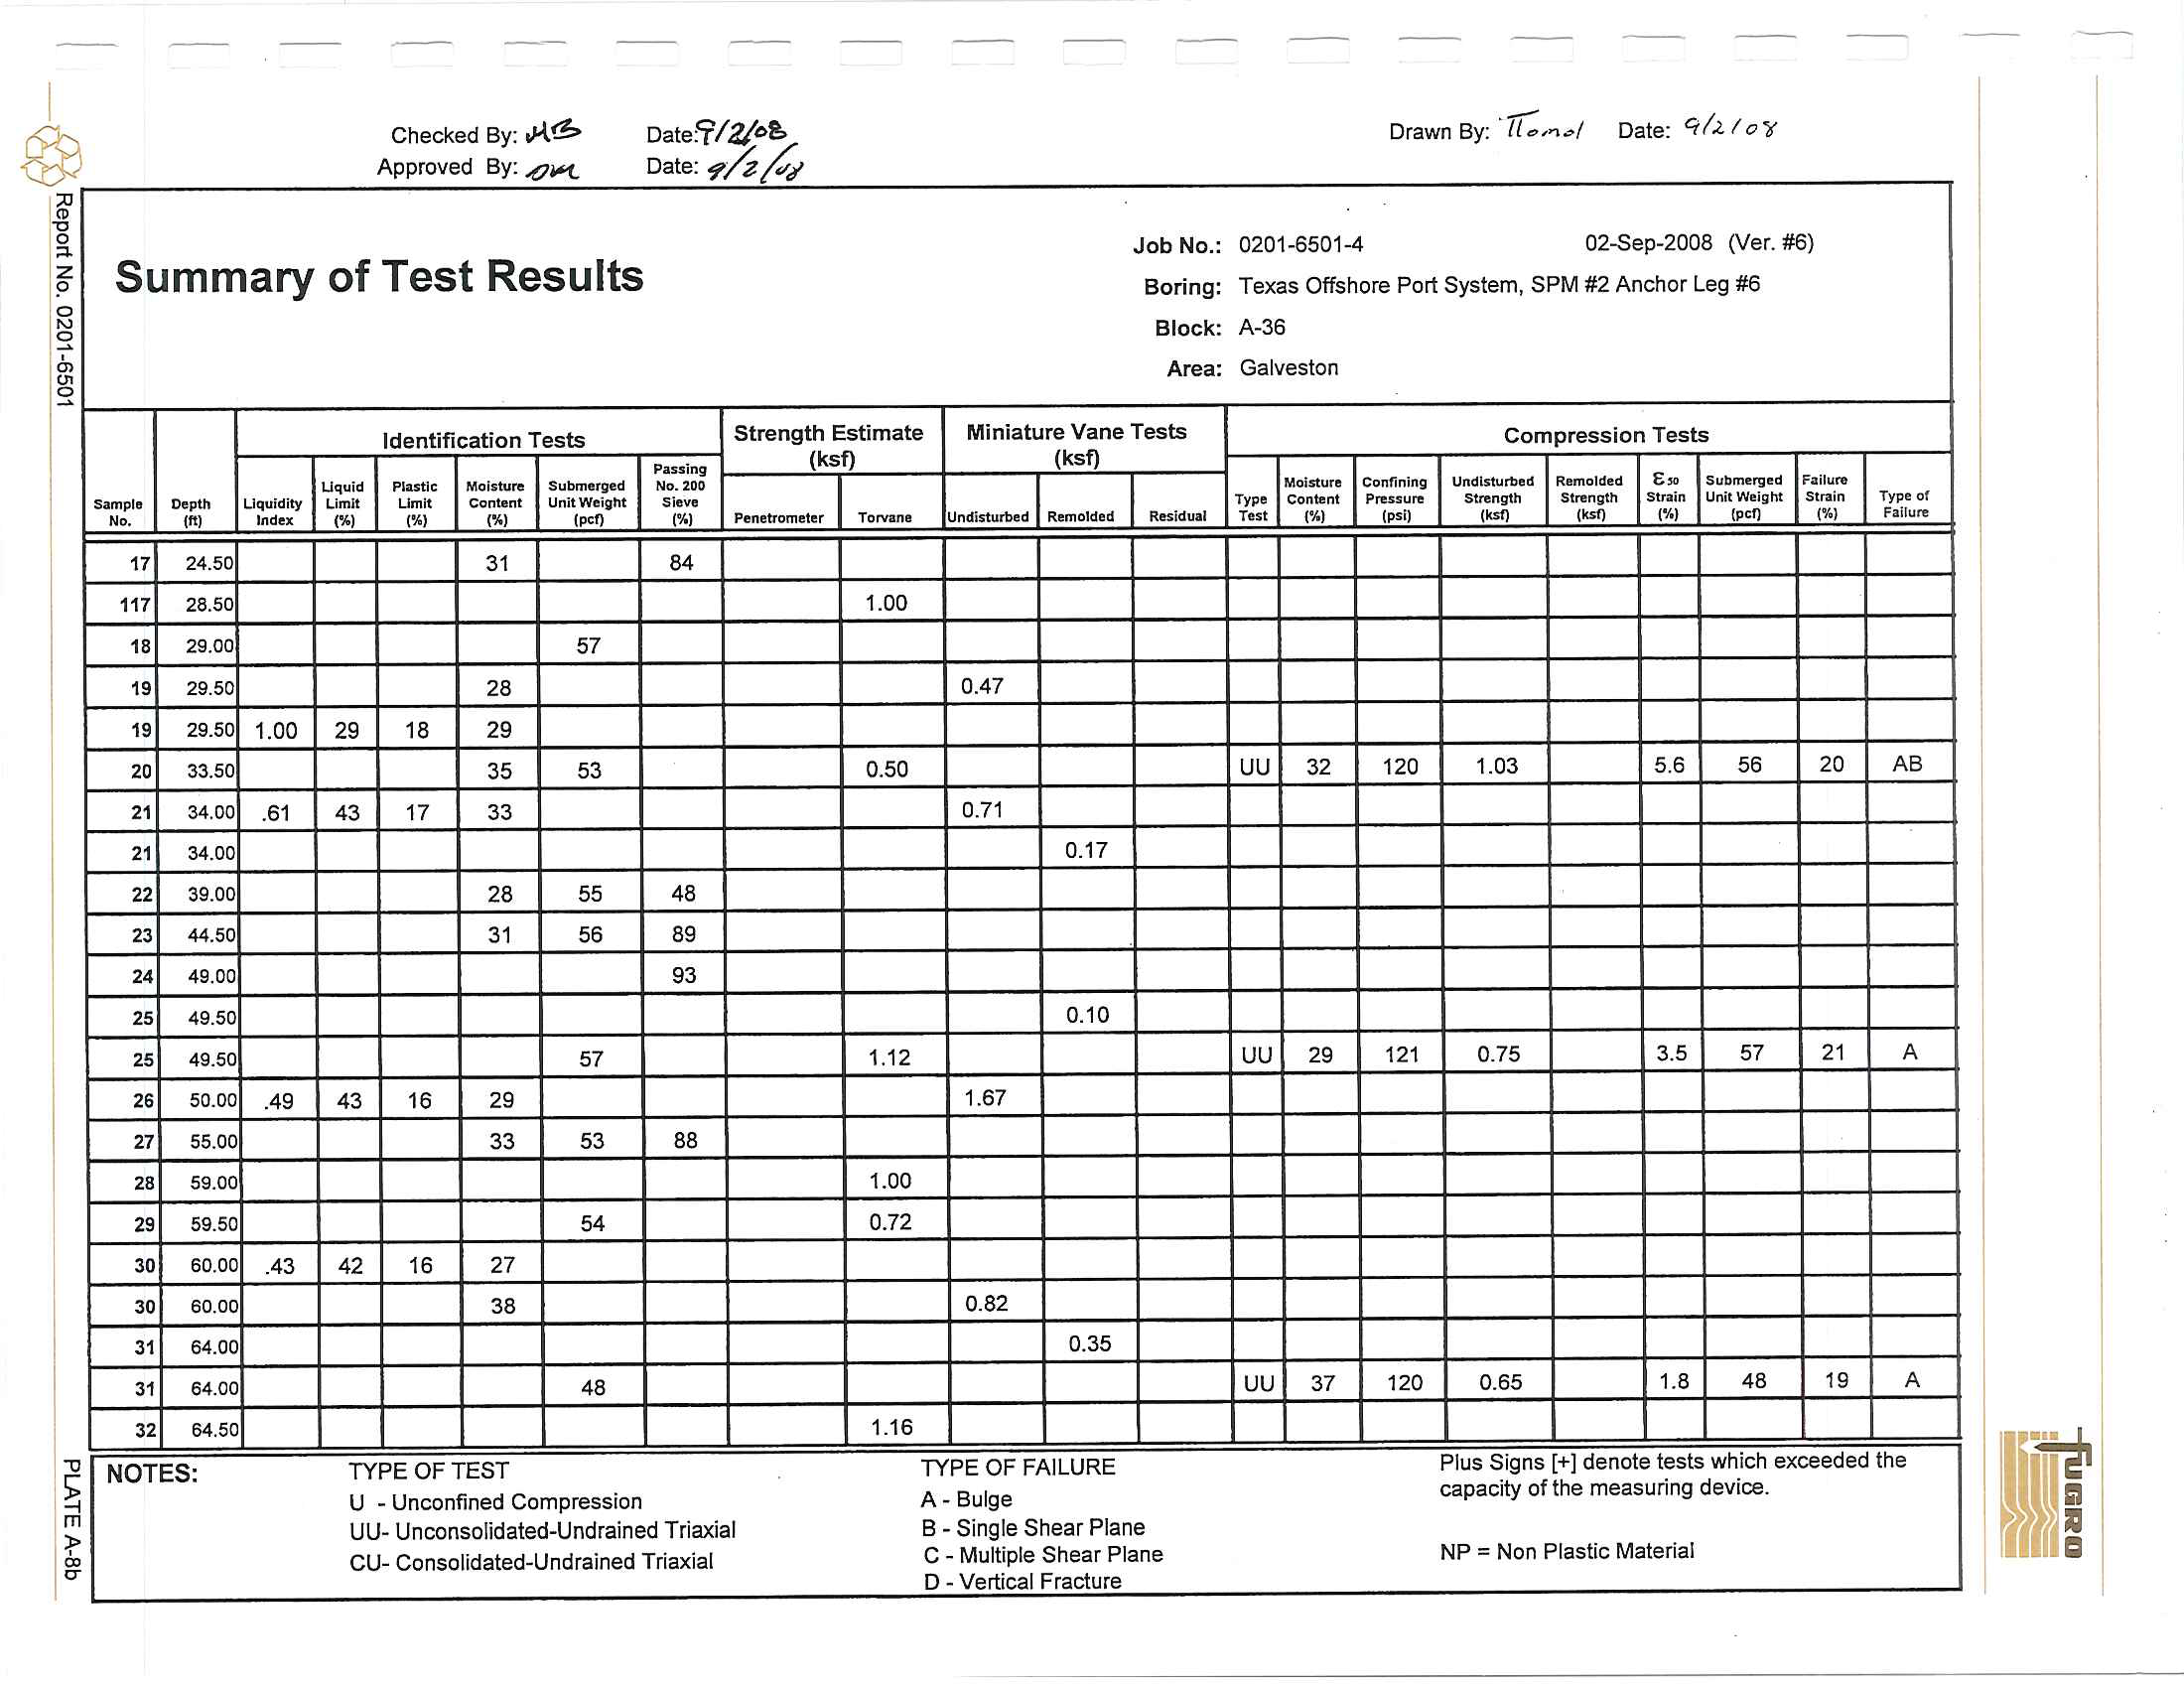
The soil testing program was designed to evaluate pertinent index and engineering properties of the
foundation soils. During the field operation, all samples were extruded from the sampler and classified by
the soil technician or field engineer.
Unit weight, Torvane, pocket penetrometer, miniature vane and
unconsolidated-undrained triaxial compression tests were performed
in the field on selected cohesive
samples. All
of the samples were shipped to Fugro's Houston laboratory where Atterberg limit tests, water
content tests, and grain-size analyses, as well as additional density tests, unconsolidated-undrained triaxial
compression tests, and miniature vane tests, were performed.
A description
of relevant laboratory procedures is provided in Appendix A. The strength and
classification test results are presented graphically
on the Logs of Boring and Test Results in Section 3.
Grain-Size distribution curves from sieve-analyses and stress-strain curves from triaxial compression tests
____--'a"re
___llresented in
AflP~e~n~d~ix~A~.
______________________________
2.3 GENERAL SOIL CONDITIONS
2.3.1
Soil Stratigraphy
The soil stratigraphy at each of the boring locations disclosed by the field and laboratory
investigation
is presented in Section 3. The soil stratigraphy is based on the classification of soil samples
I __
~
___
R_ep_o_rt_N_O_.O_2_01_-_65_0_1______________________________2_.3_____
l-
I
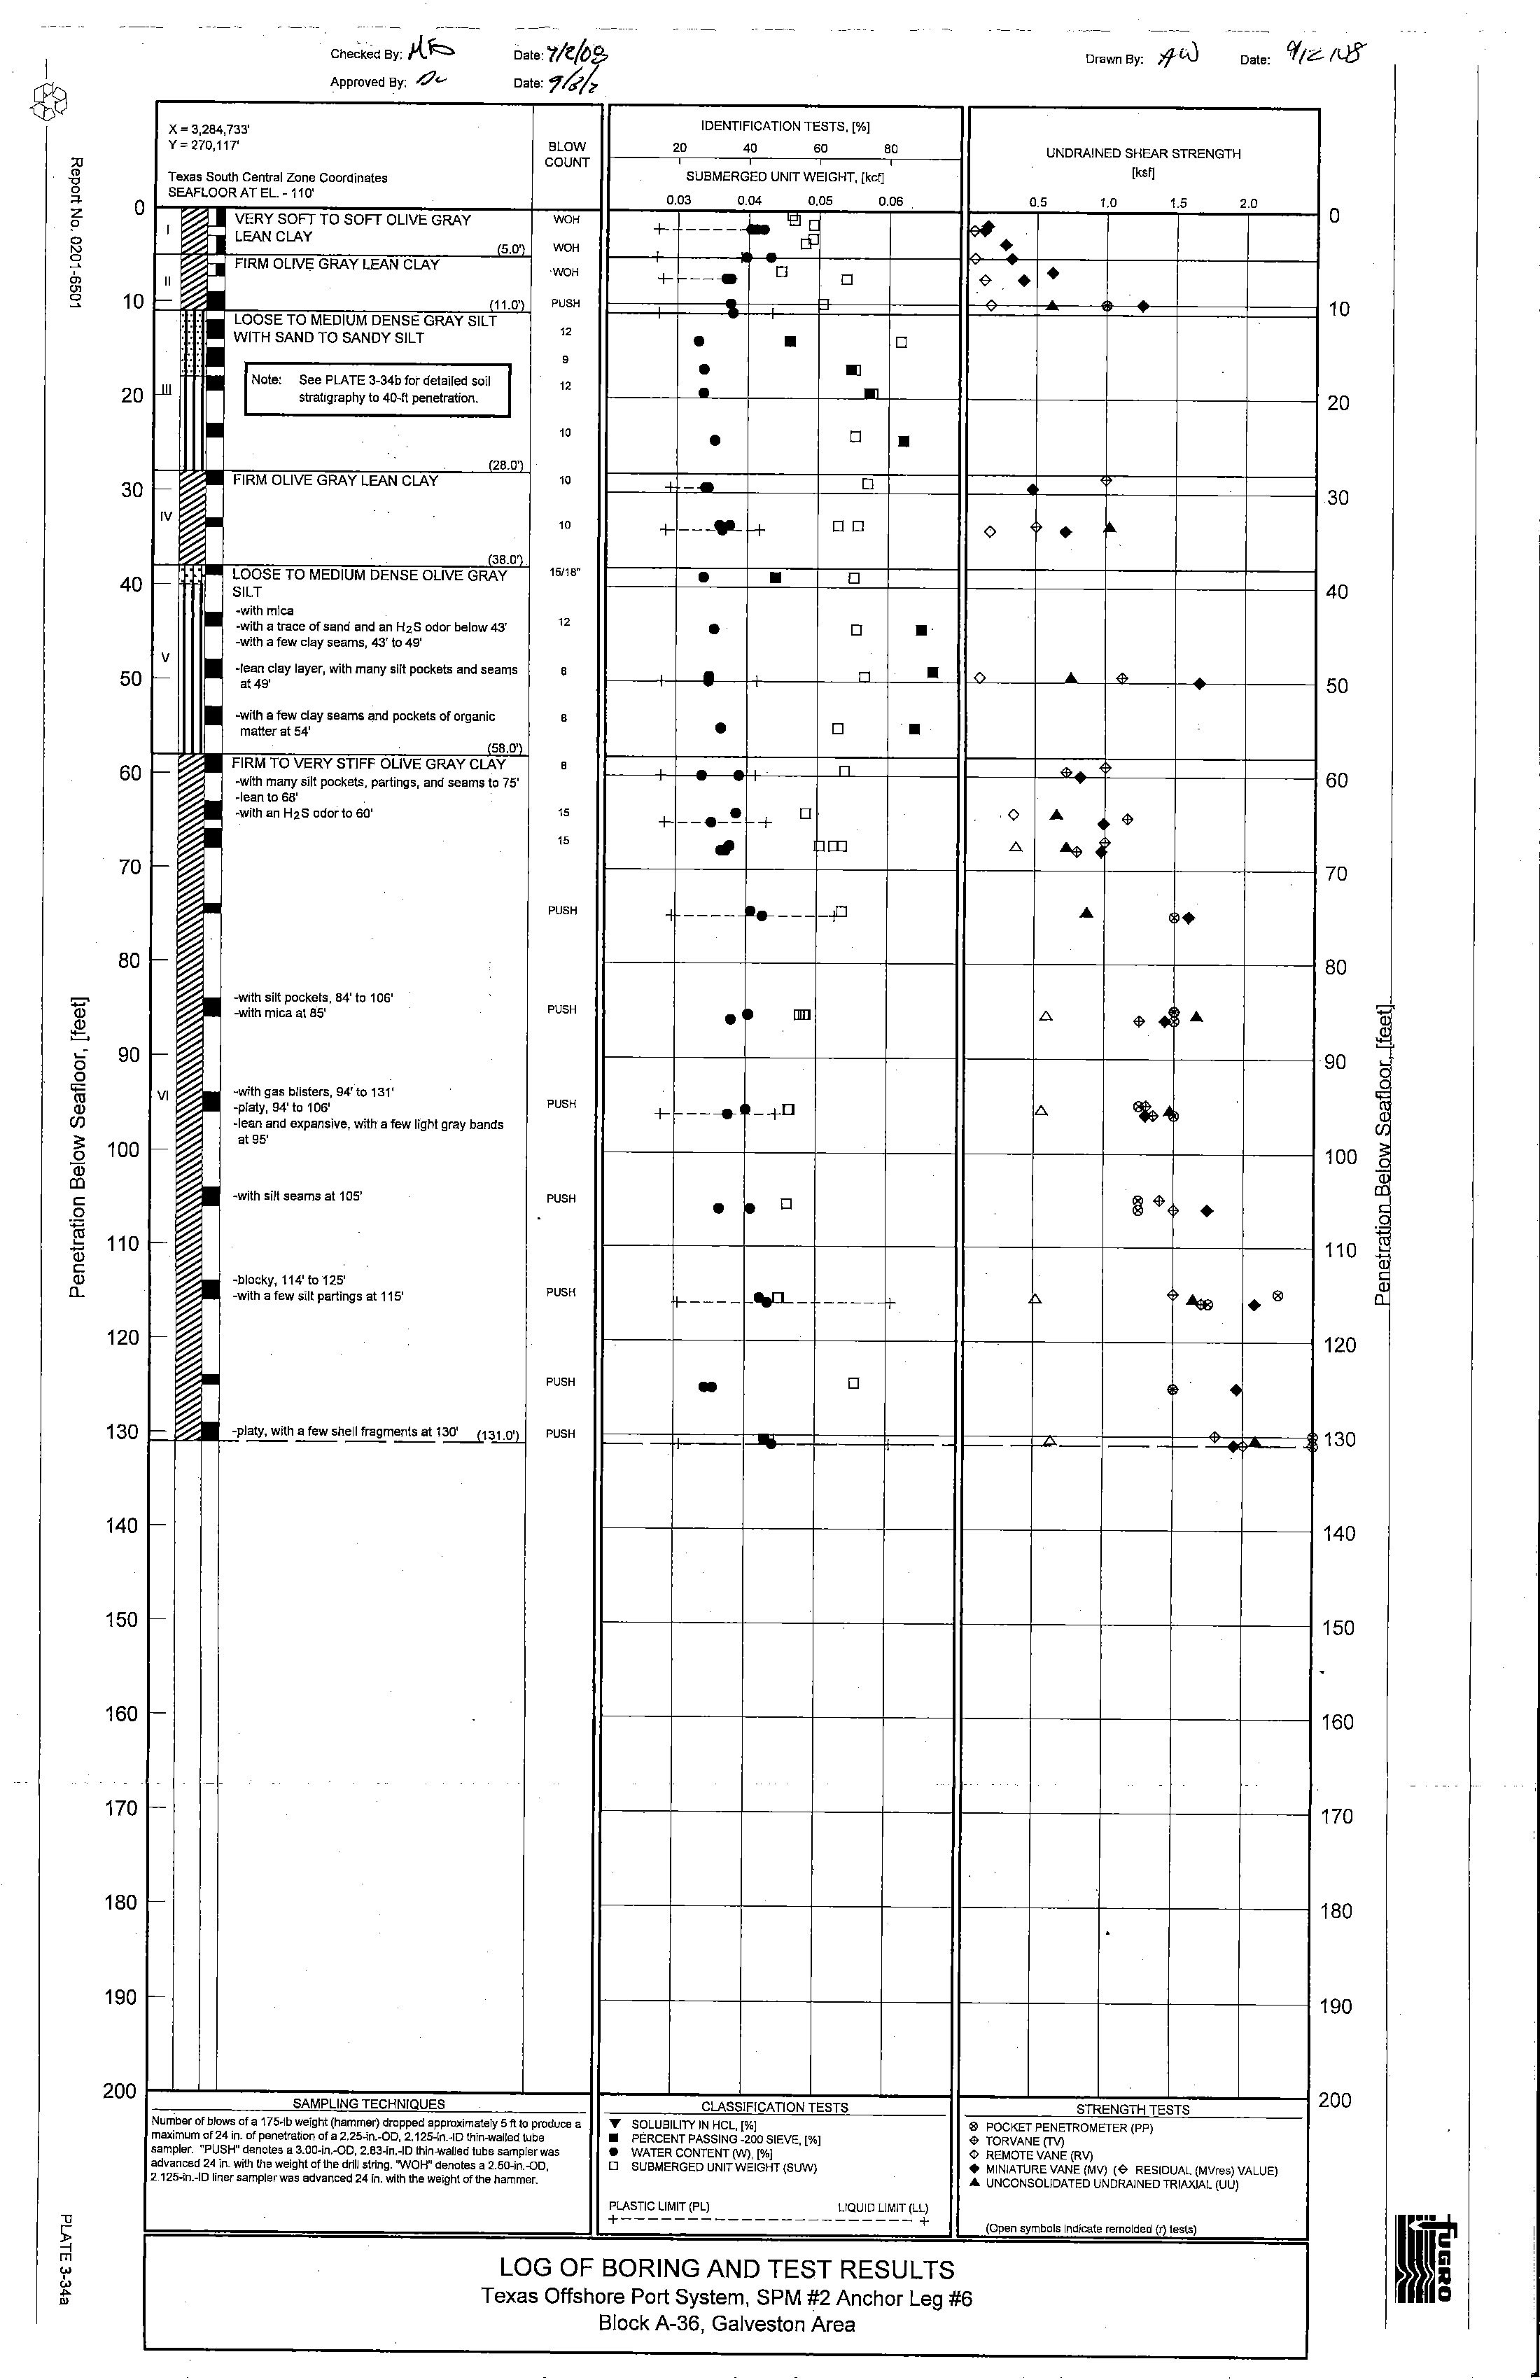
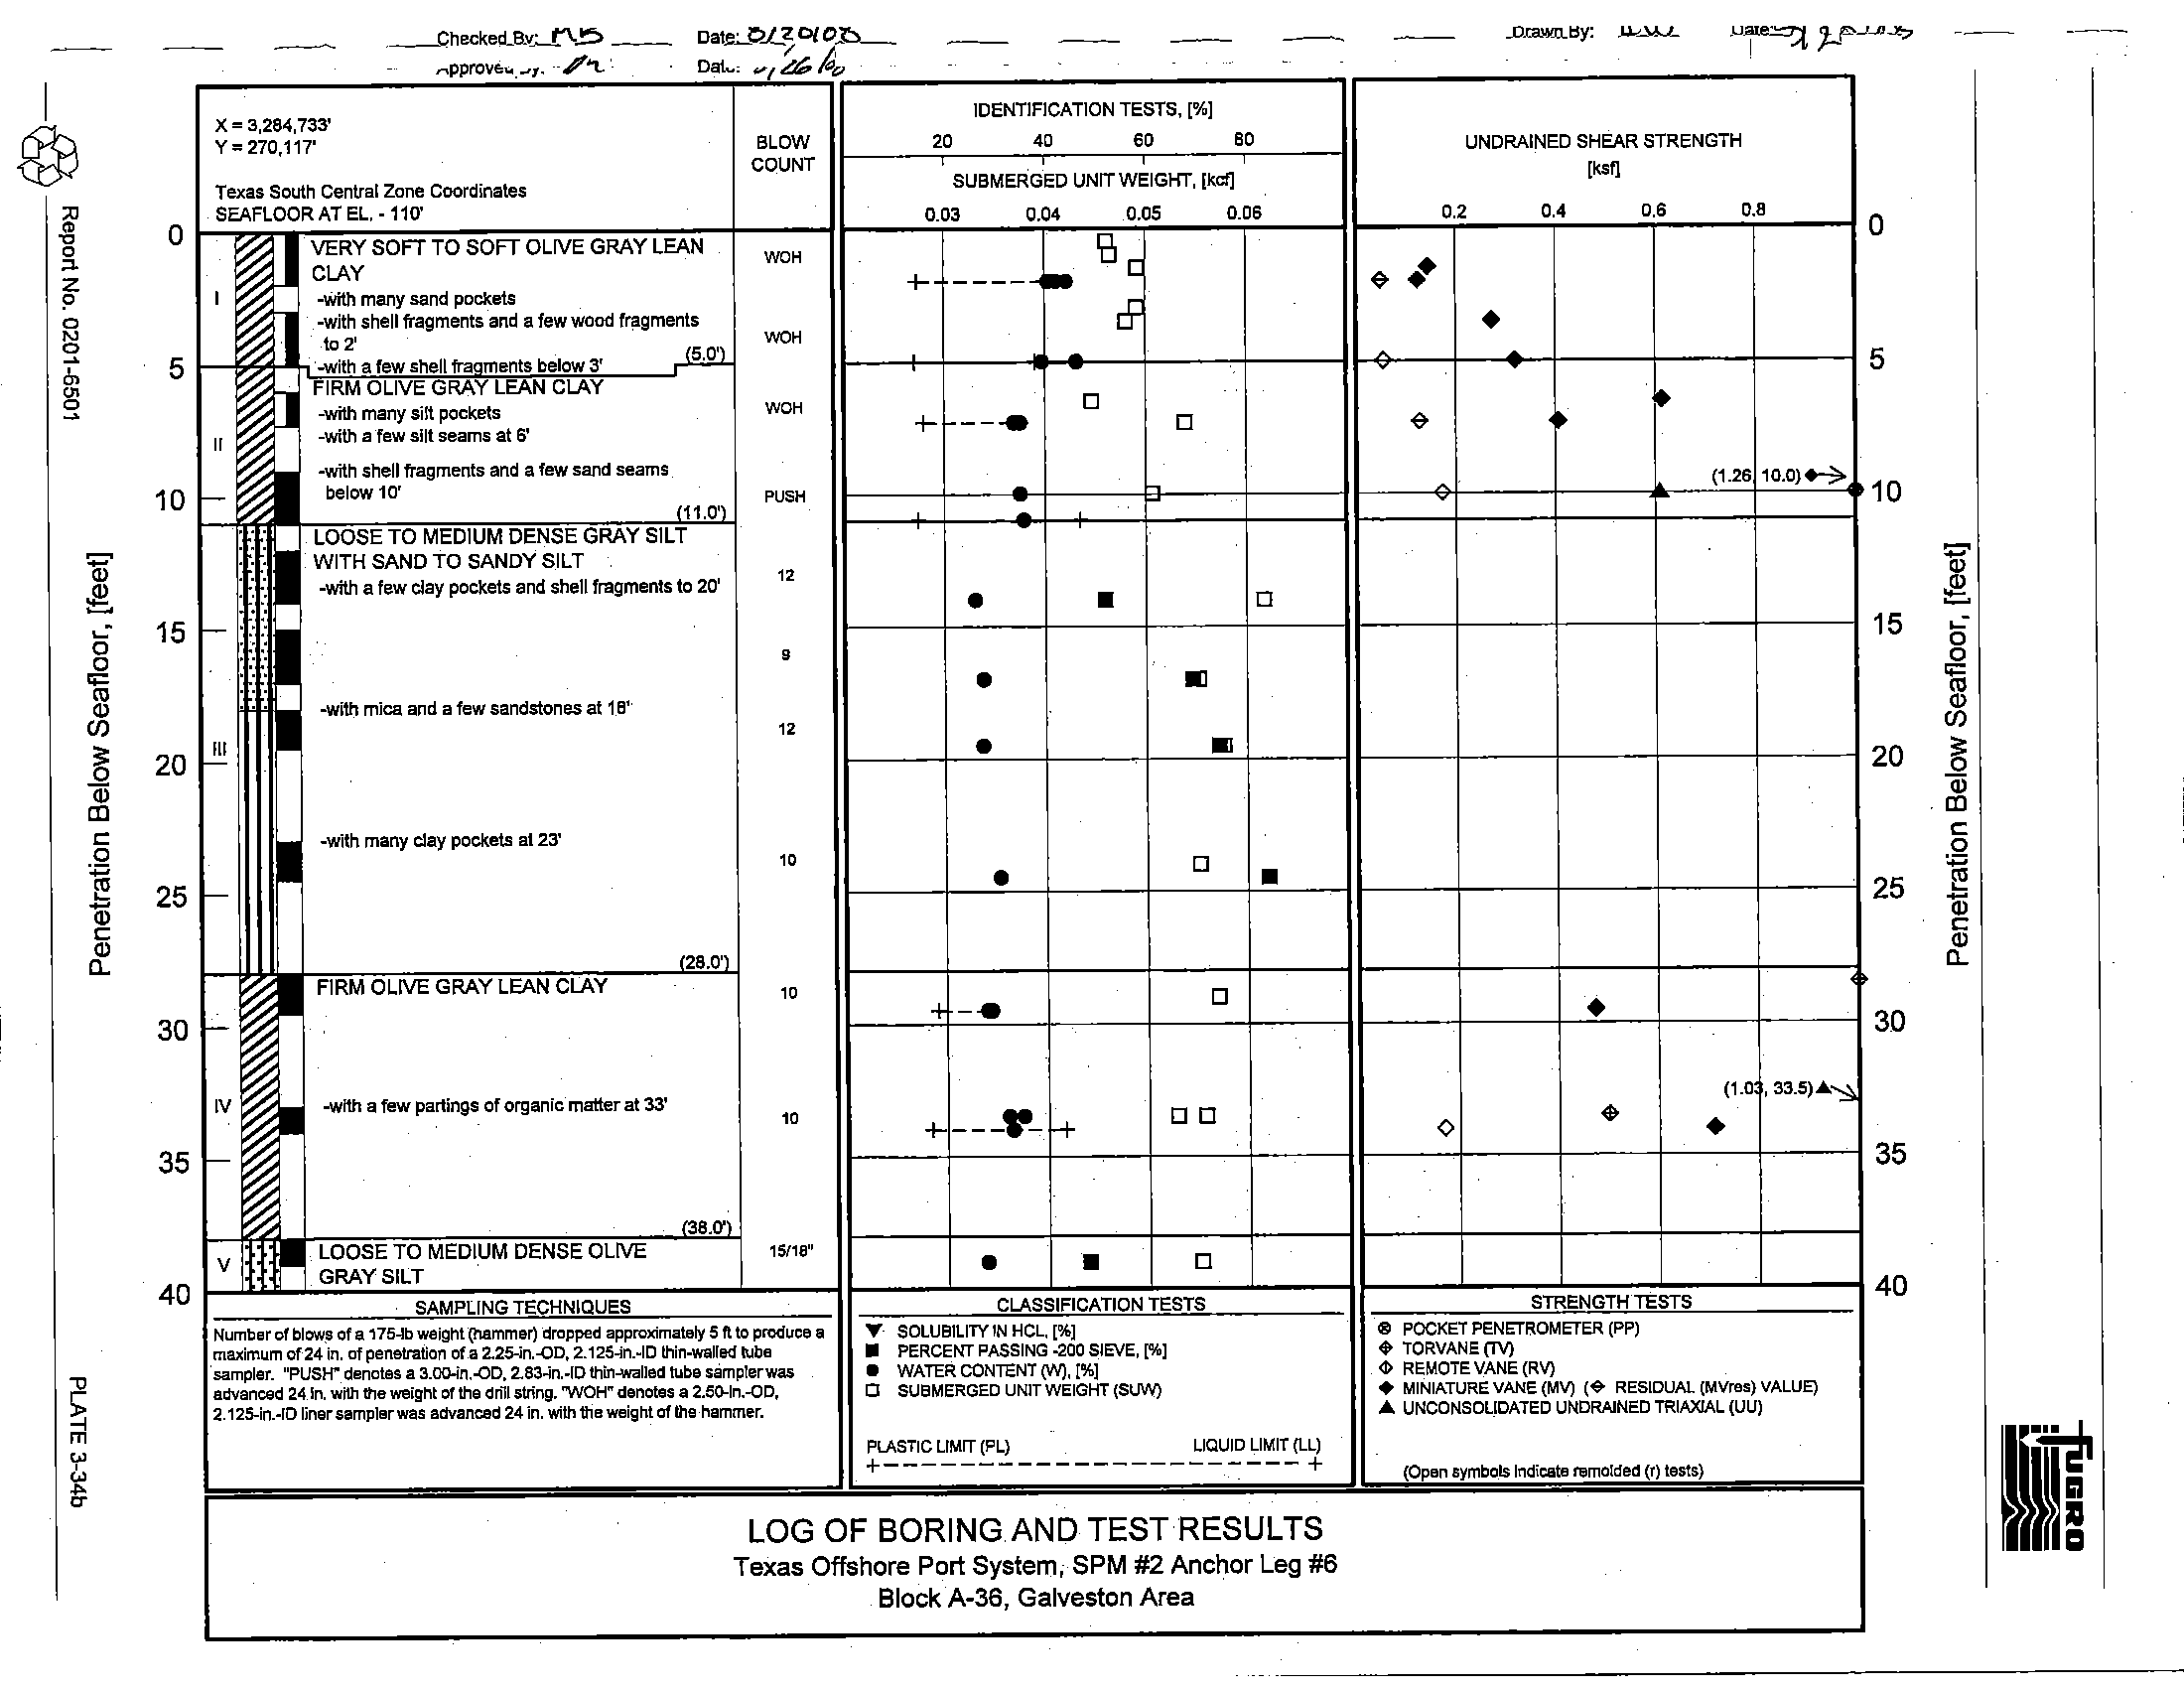
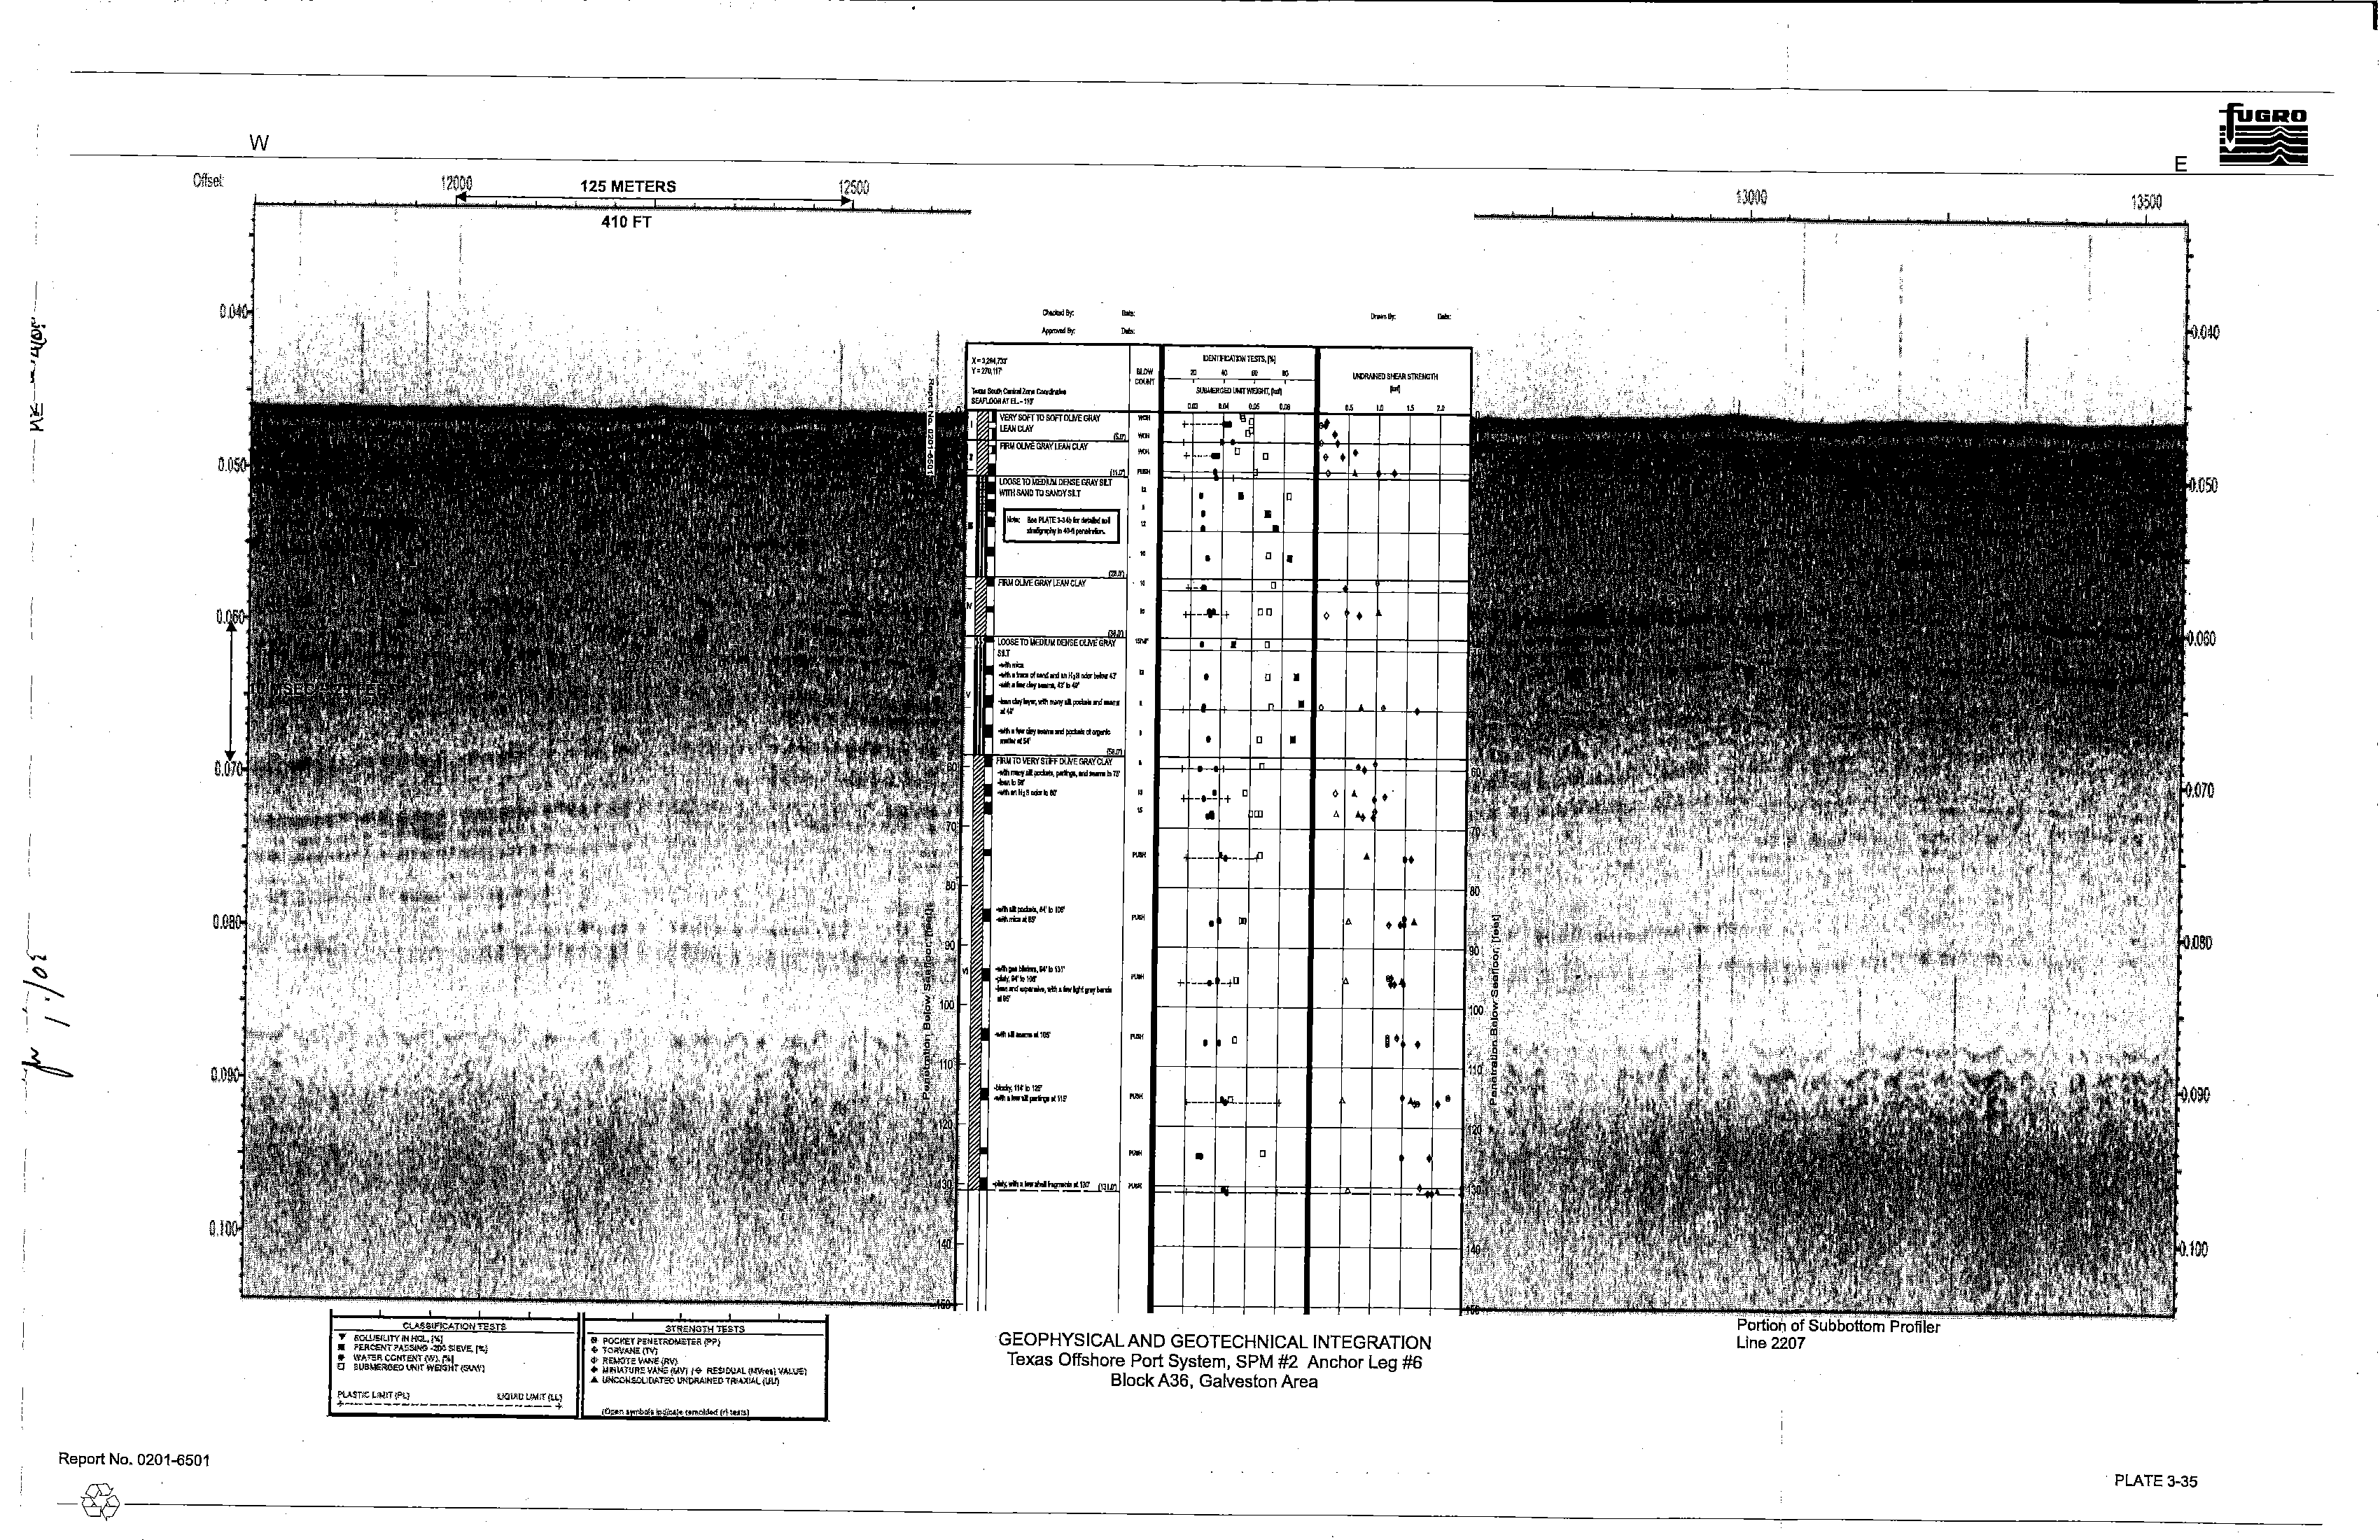
3.4 SPM #2 ANCHOR LEG #6 LOCATION
3.4.1
Introduction
The field investigation at the location designated as SPM #2 ANCHOR LEG #6 was performed on
June 28,2008.
Soil sampling was performed to 131-ft penetration at Texas South Central Zone
Coordinates X
=
3,284,733 ft and Y
=
270,117 ft. The measured water depth ranged from 110 to 111 ft.
3.4.2
Soil Stratigraphy
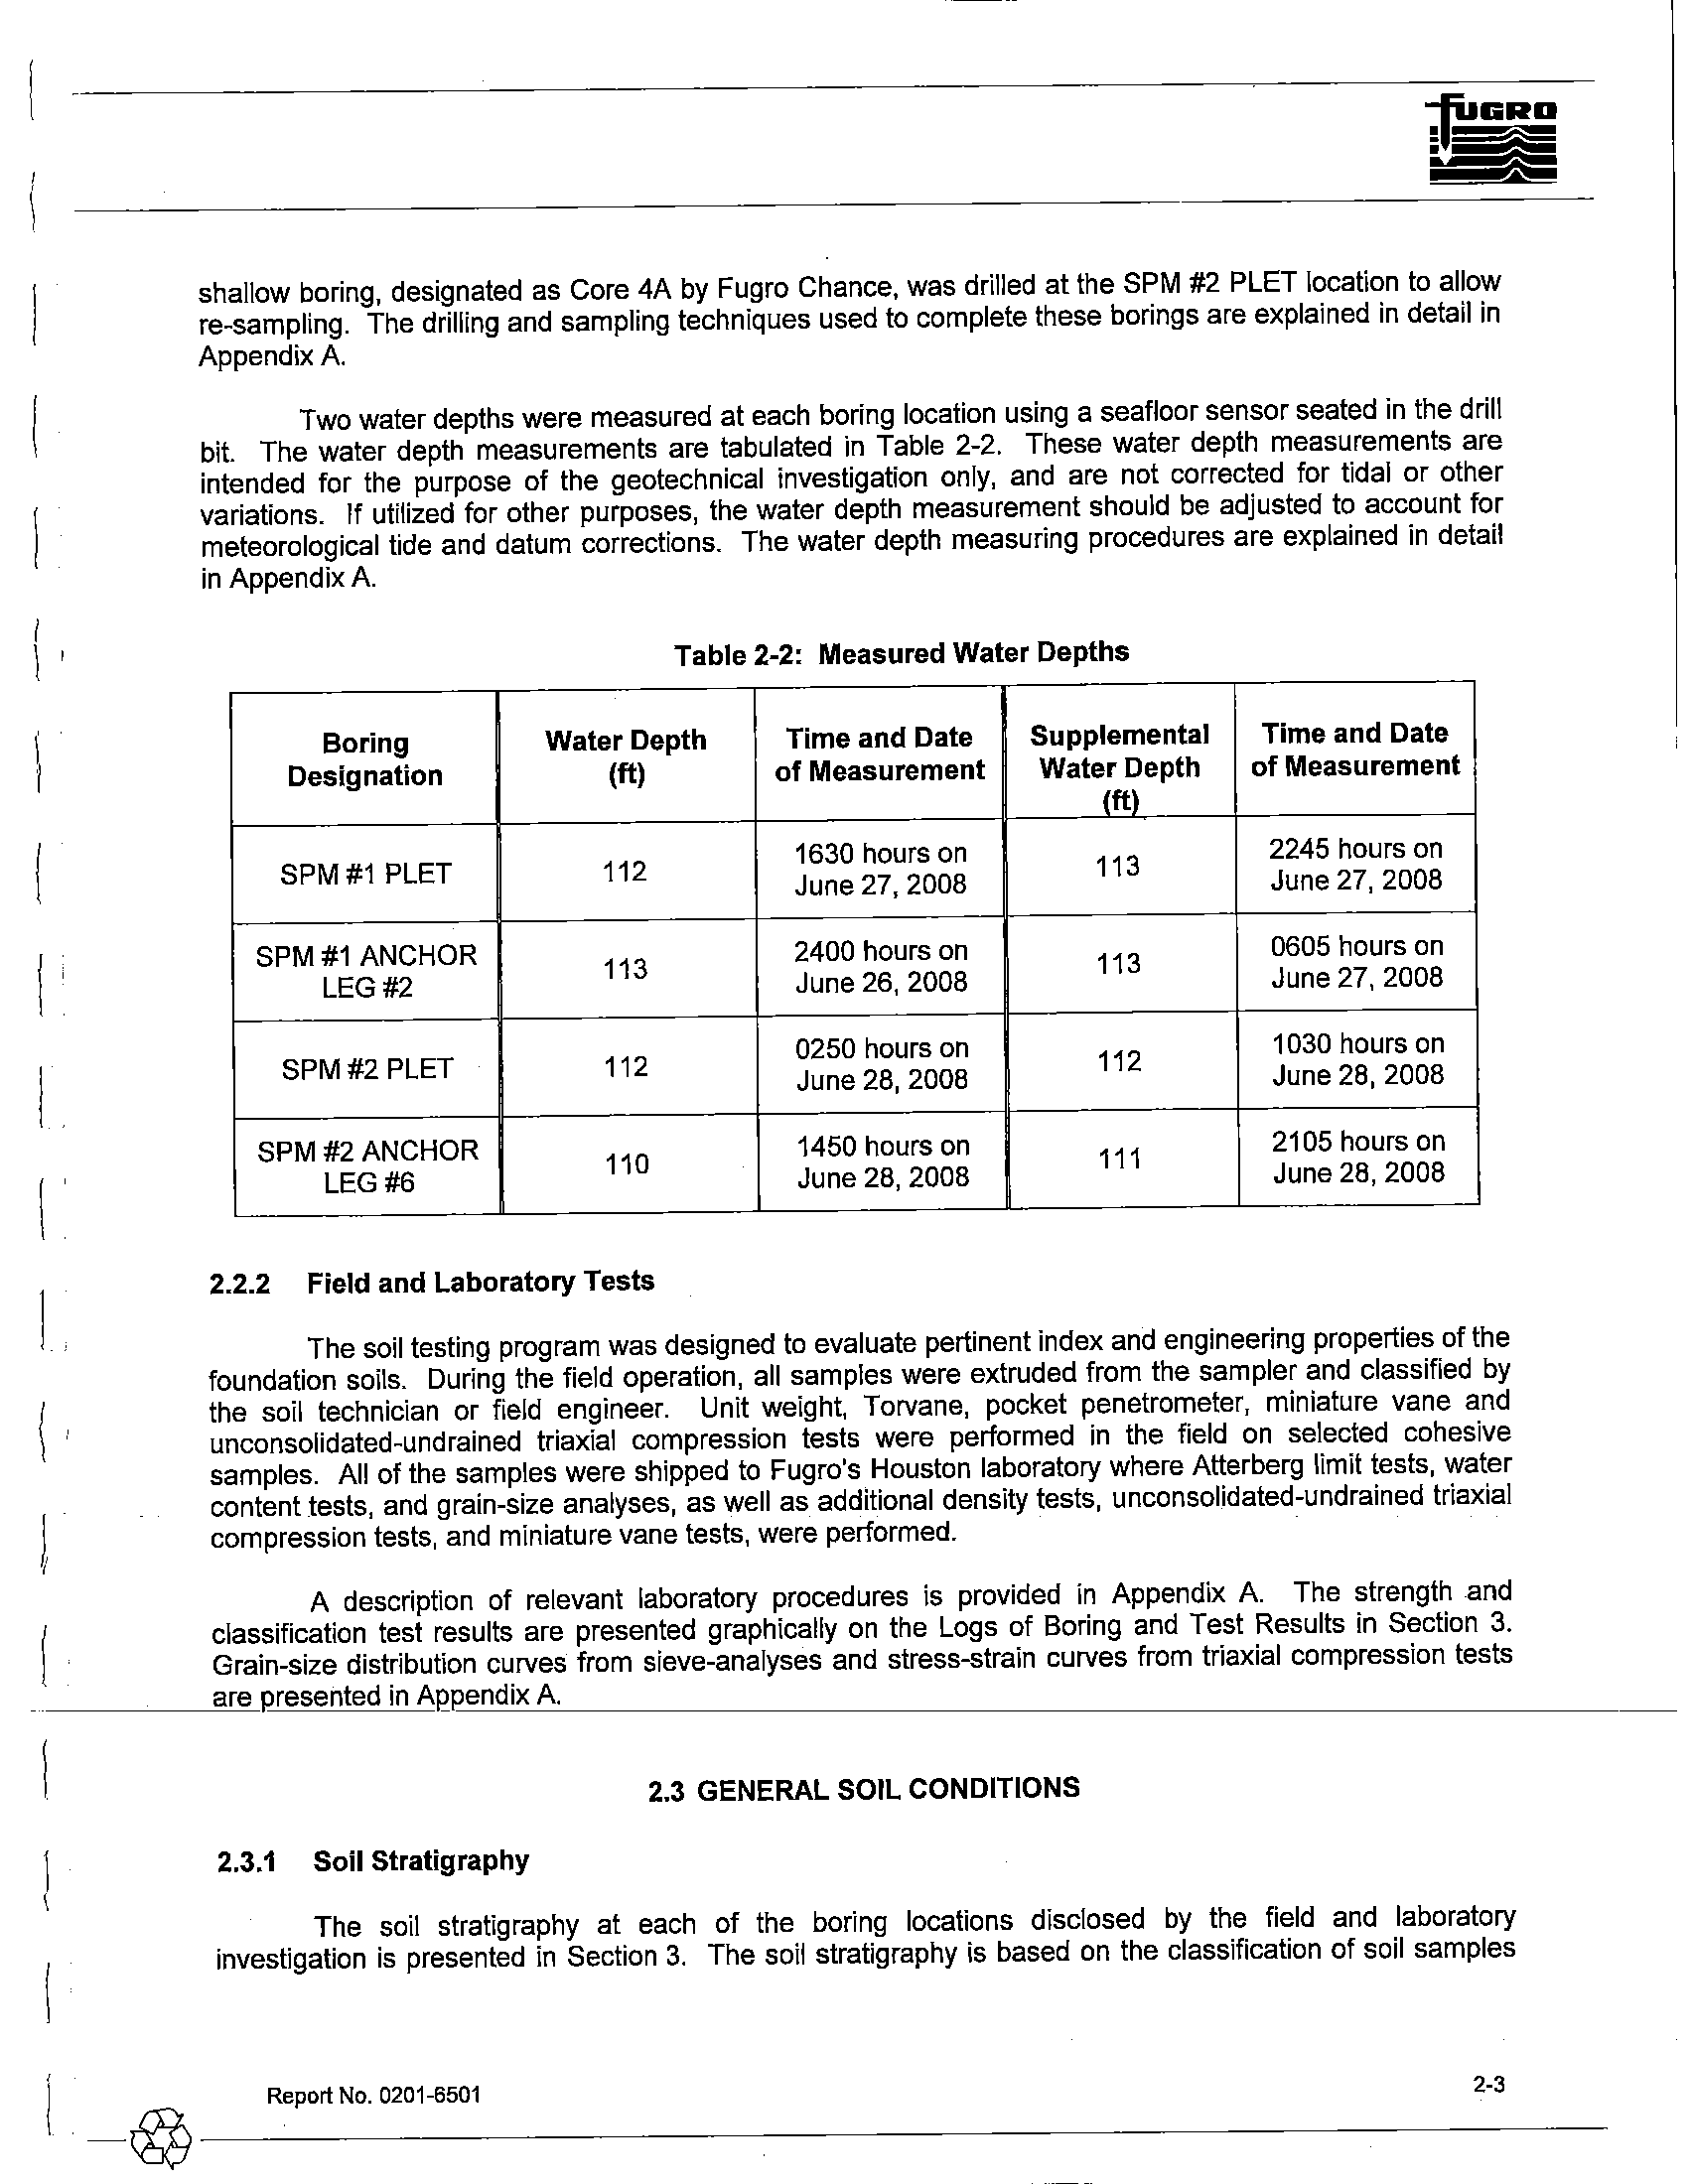
The soil stratigraphy disclosed
by the field and laboratory investigations is presented on the boring
log. Plate 3-34. The soil stratigraphy is based
on the classification of soil samples recovered from the
boring and observations made during drilling operations. A generalized summary of the major soil strata is
tabulated below.
Penetration, ft
Stratum
From
To
Description
I
0
5
Very soft to soft lean clay
II
5
11
Firm lean clay
III
11
28
Loose to medium dense silt with sand to
sandy silt
IV
28
38
Firm lean clay
V
38
58
Loose to medium dense silt
VI
58
131
Firm to very stiff clay
Detailed soil descriptions that include textural variations and inclusions are noted
on the boring log.
A key
to the terms and symbols used on the boring log is presented on Plate 2-2. The Roman numeral
representing each stratum
is also shown on the boring log and on relevant plates. The variation in soil
stratigraphy across this site is indicated
in a comparison (integration) of the geophysical and geotechnical
soil information presented
on Plate 3-35.
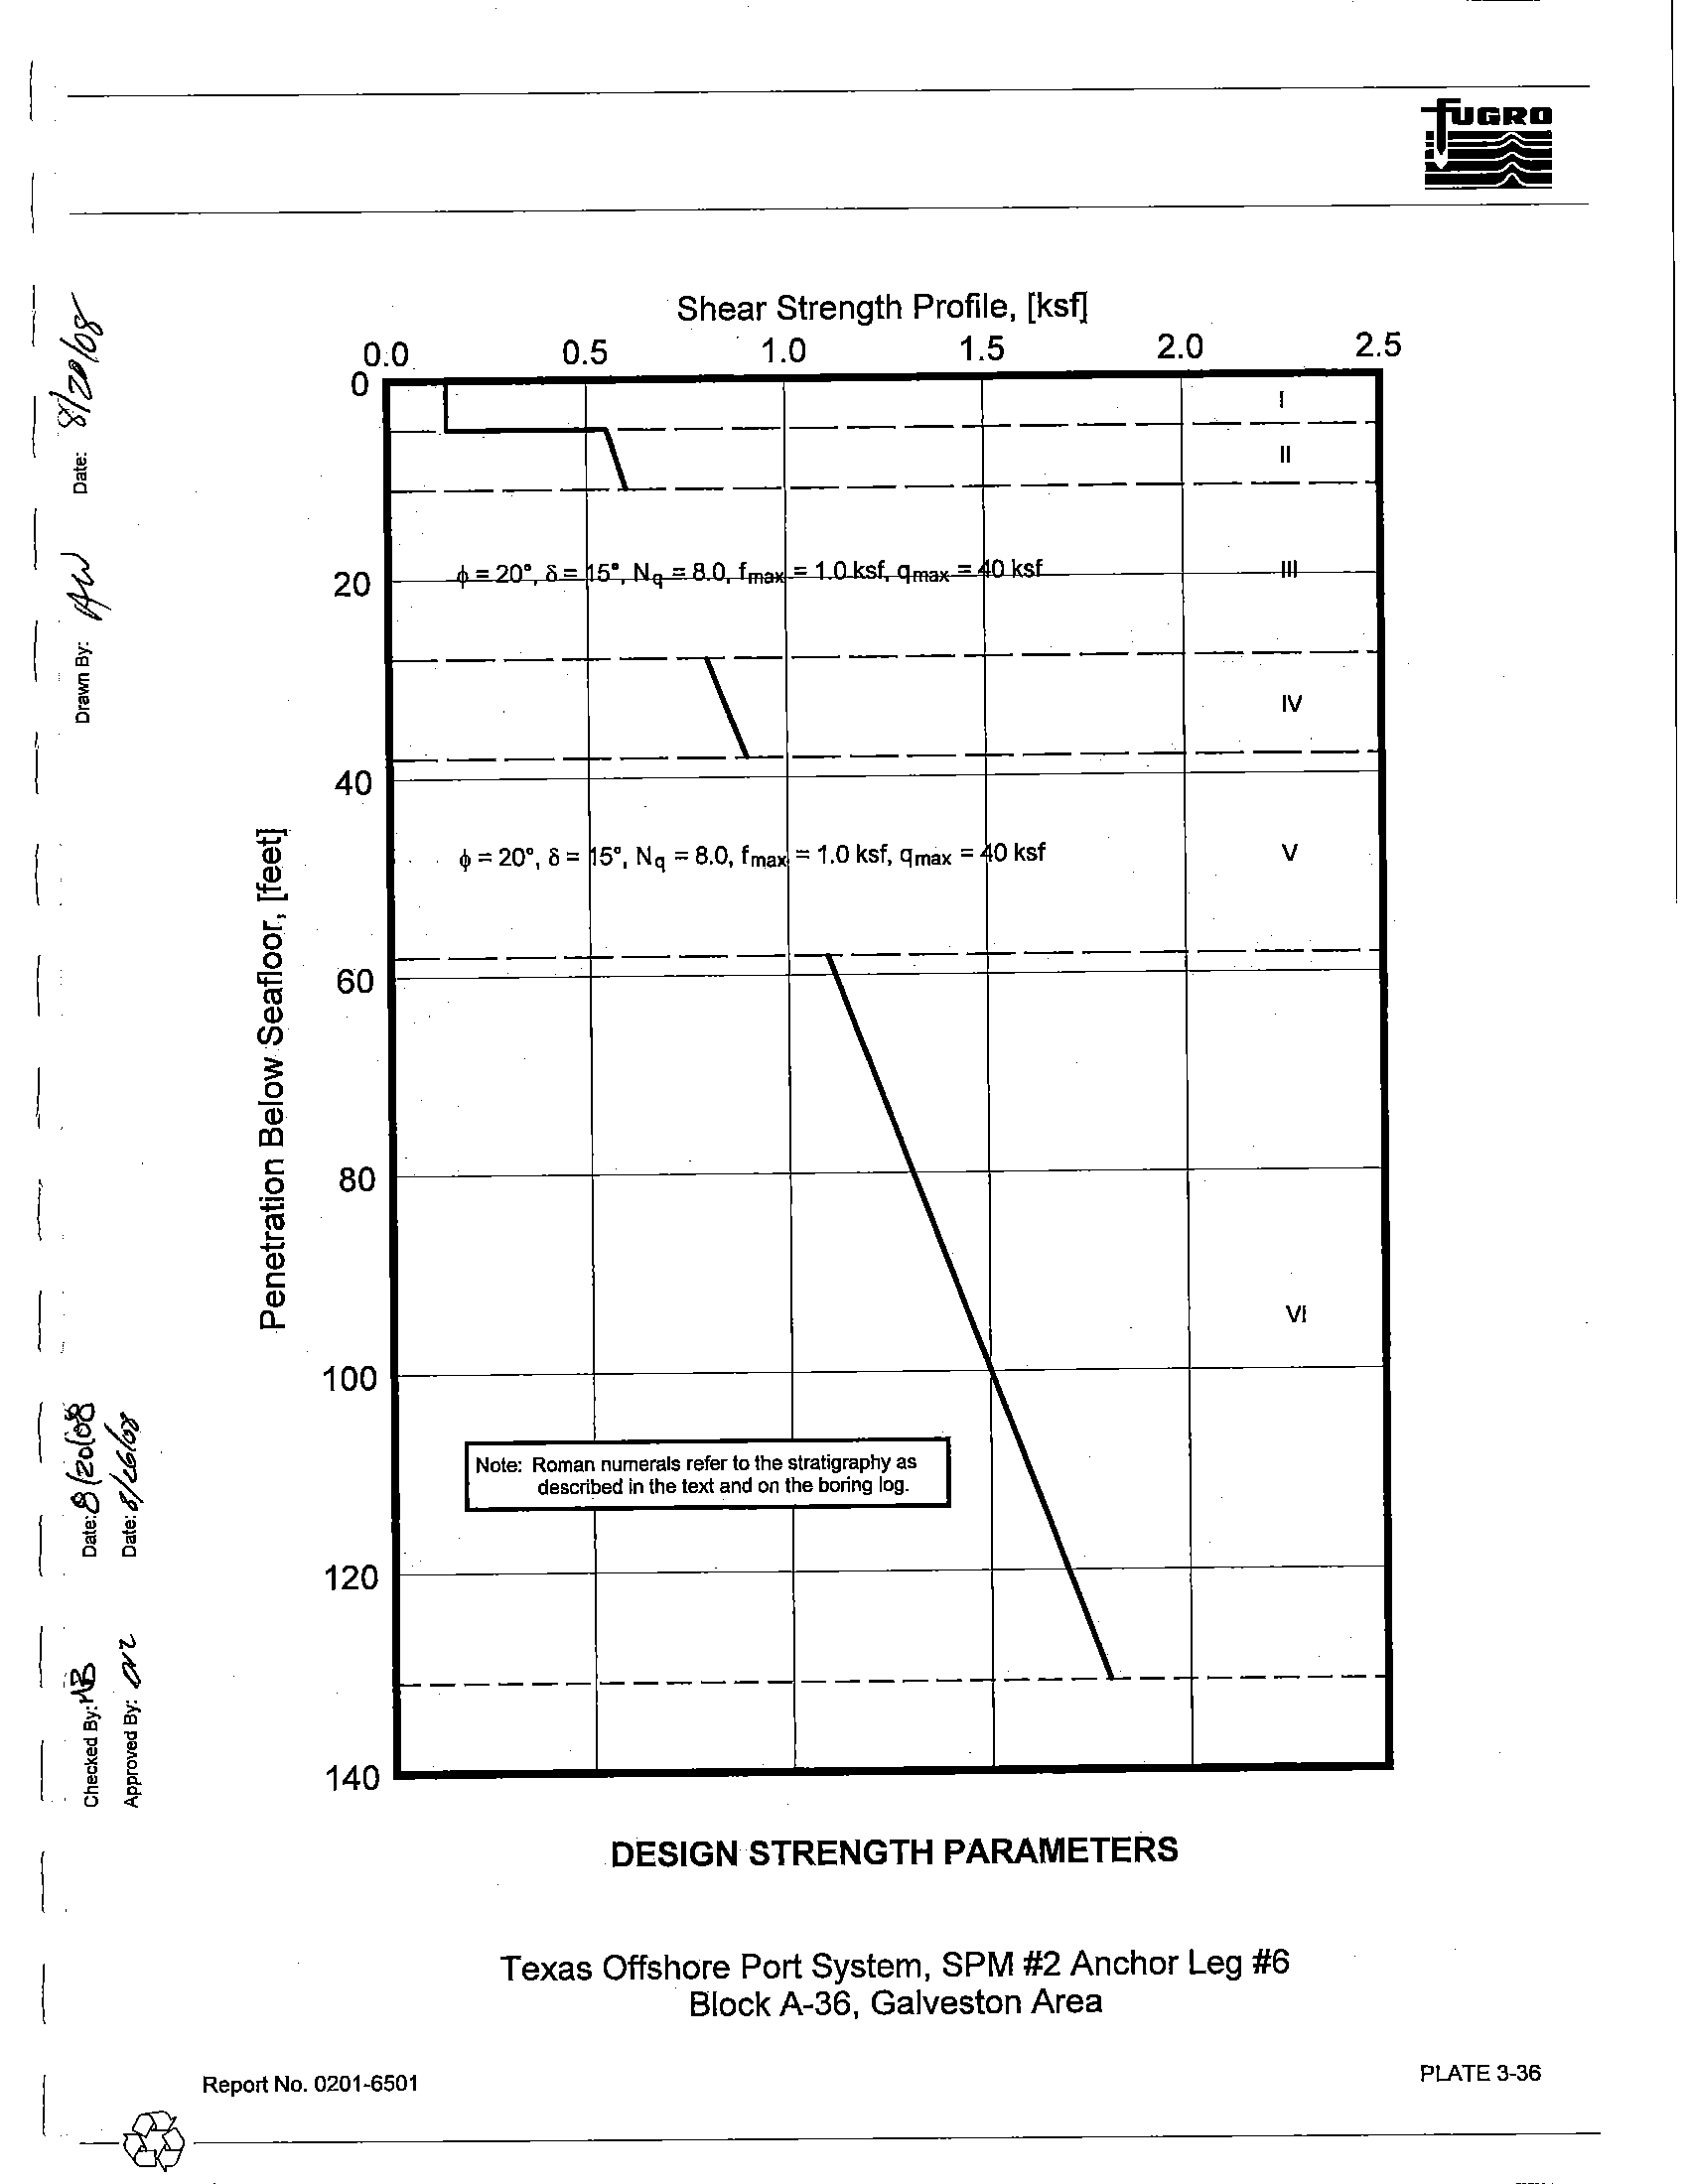
3.4.2.1 Interpretation
of Soil Properties
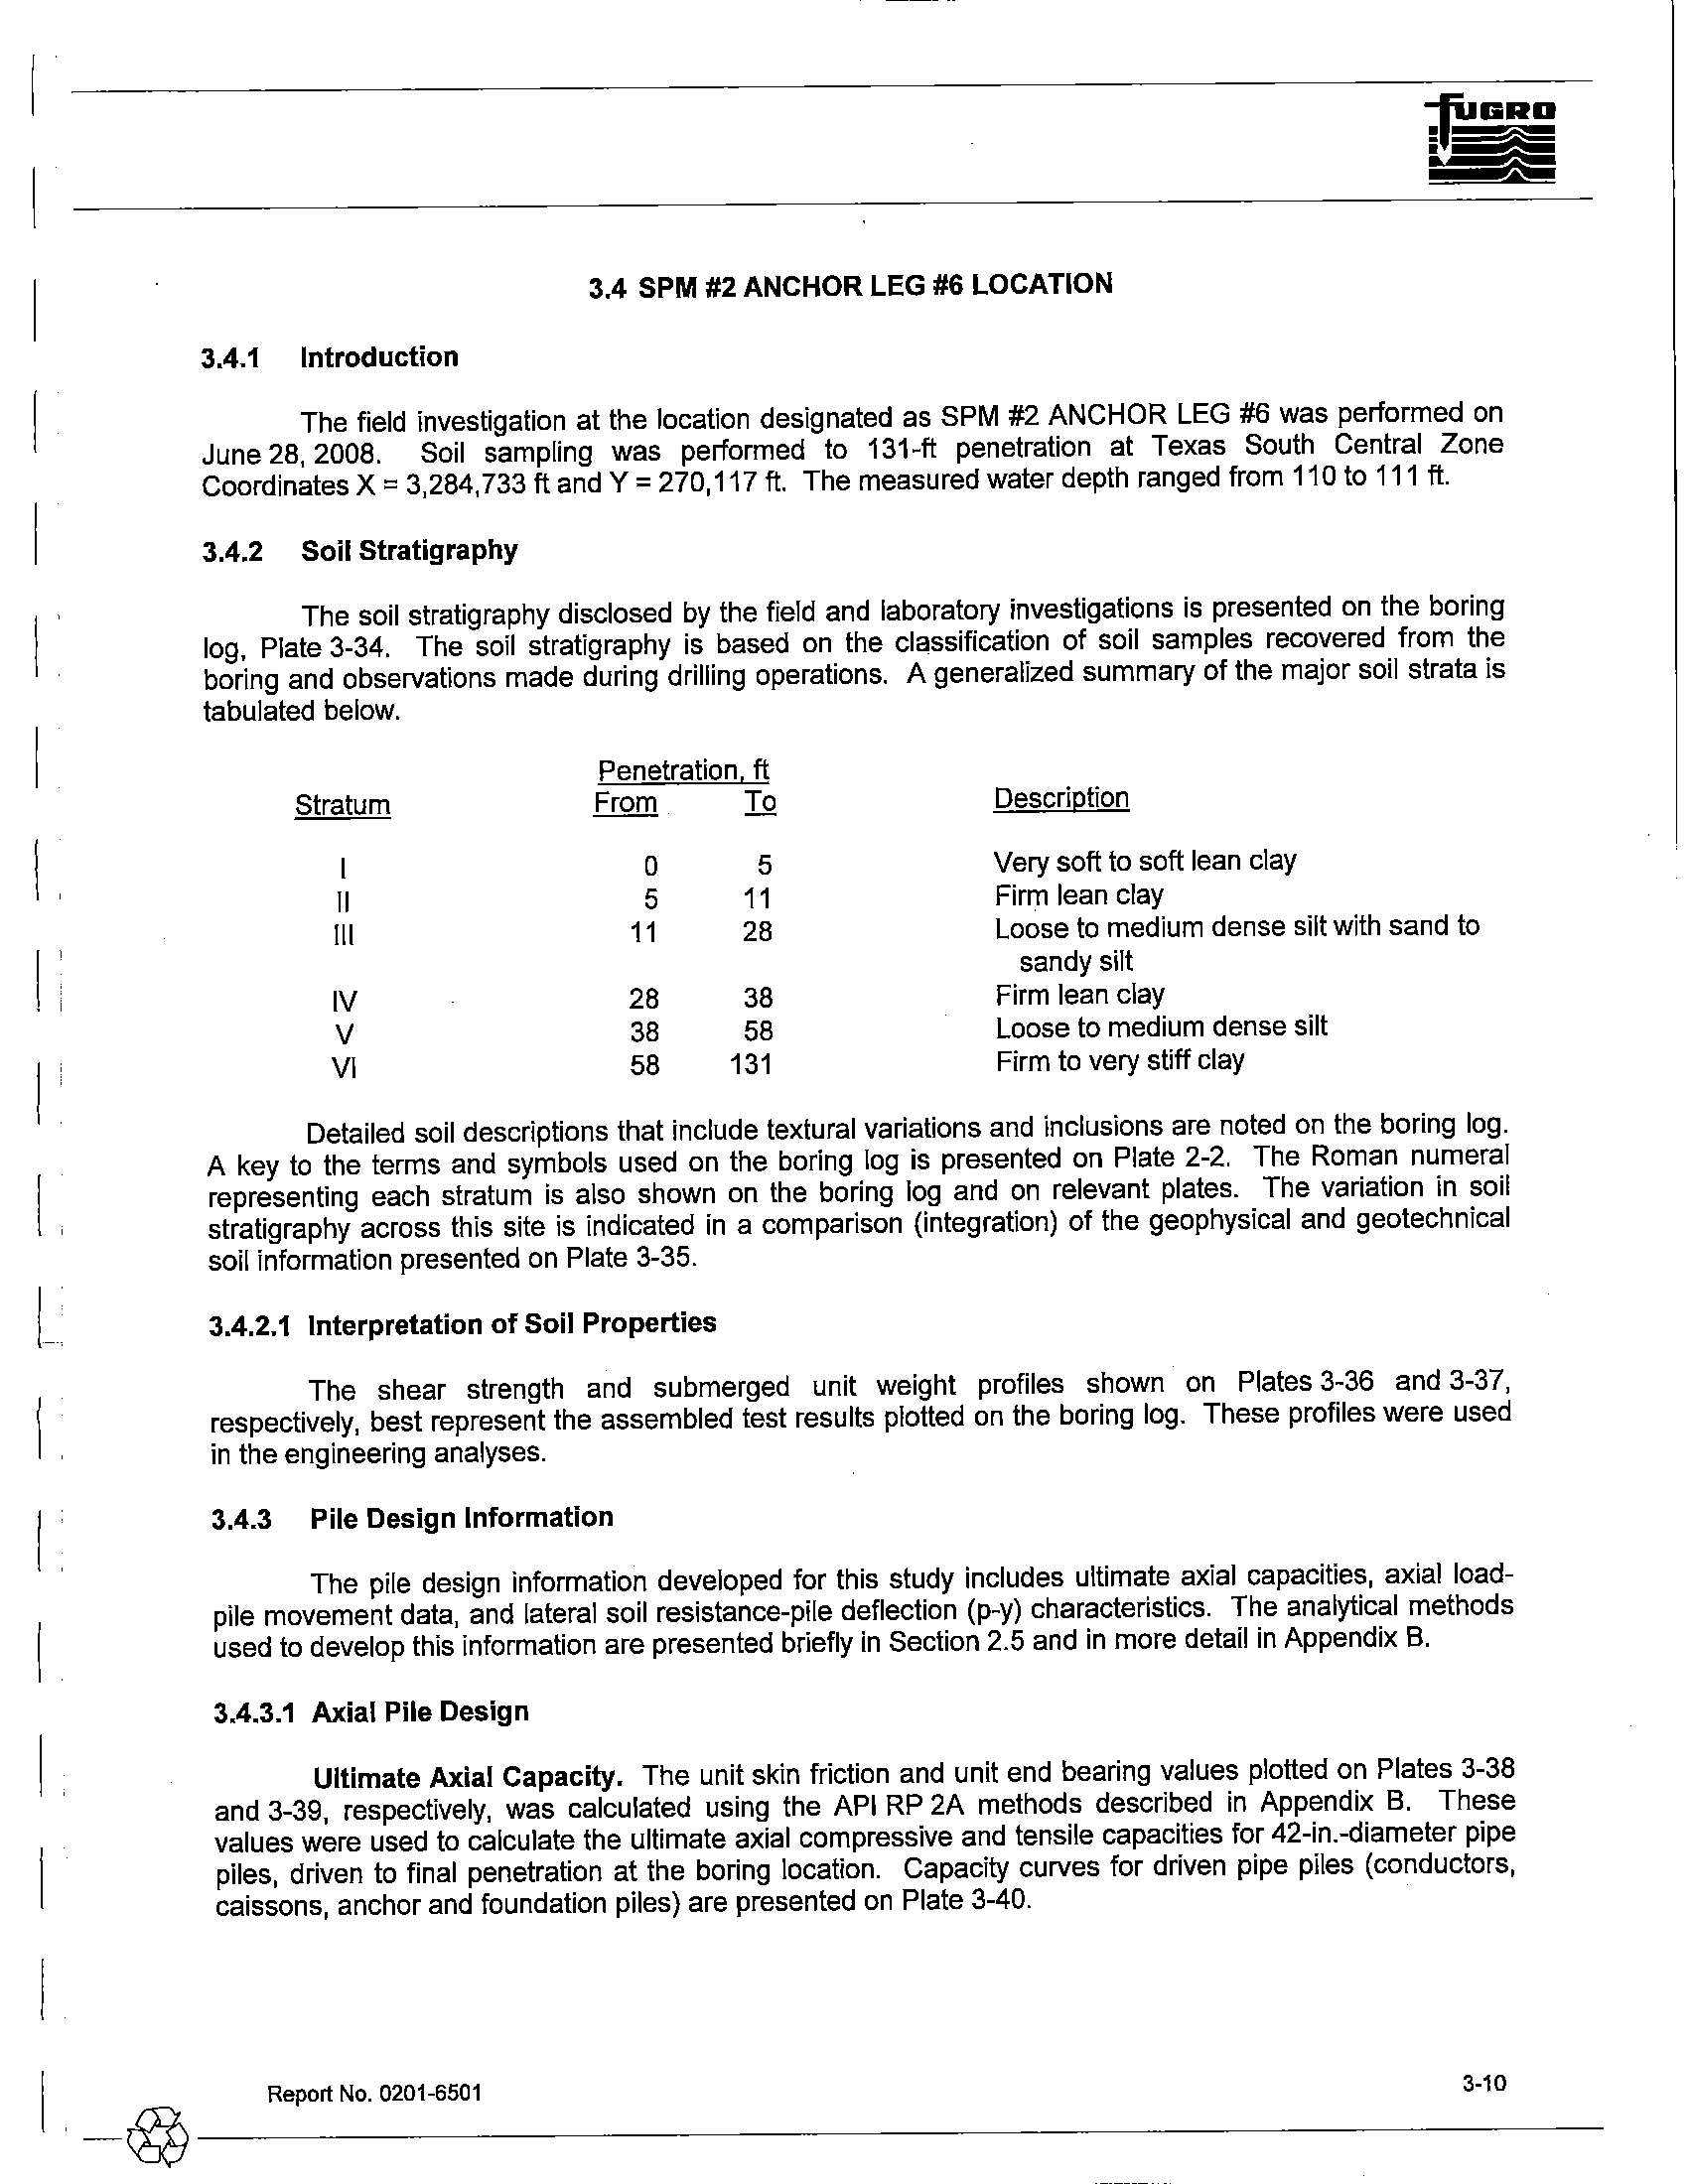
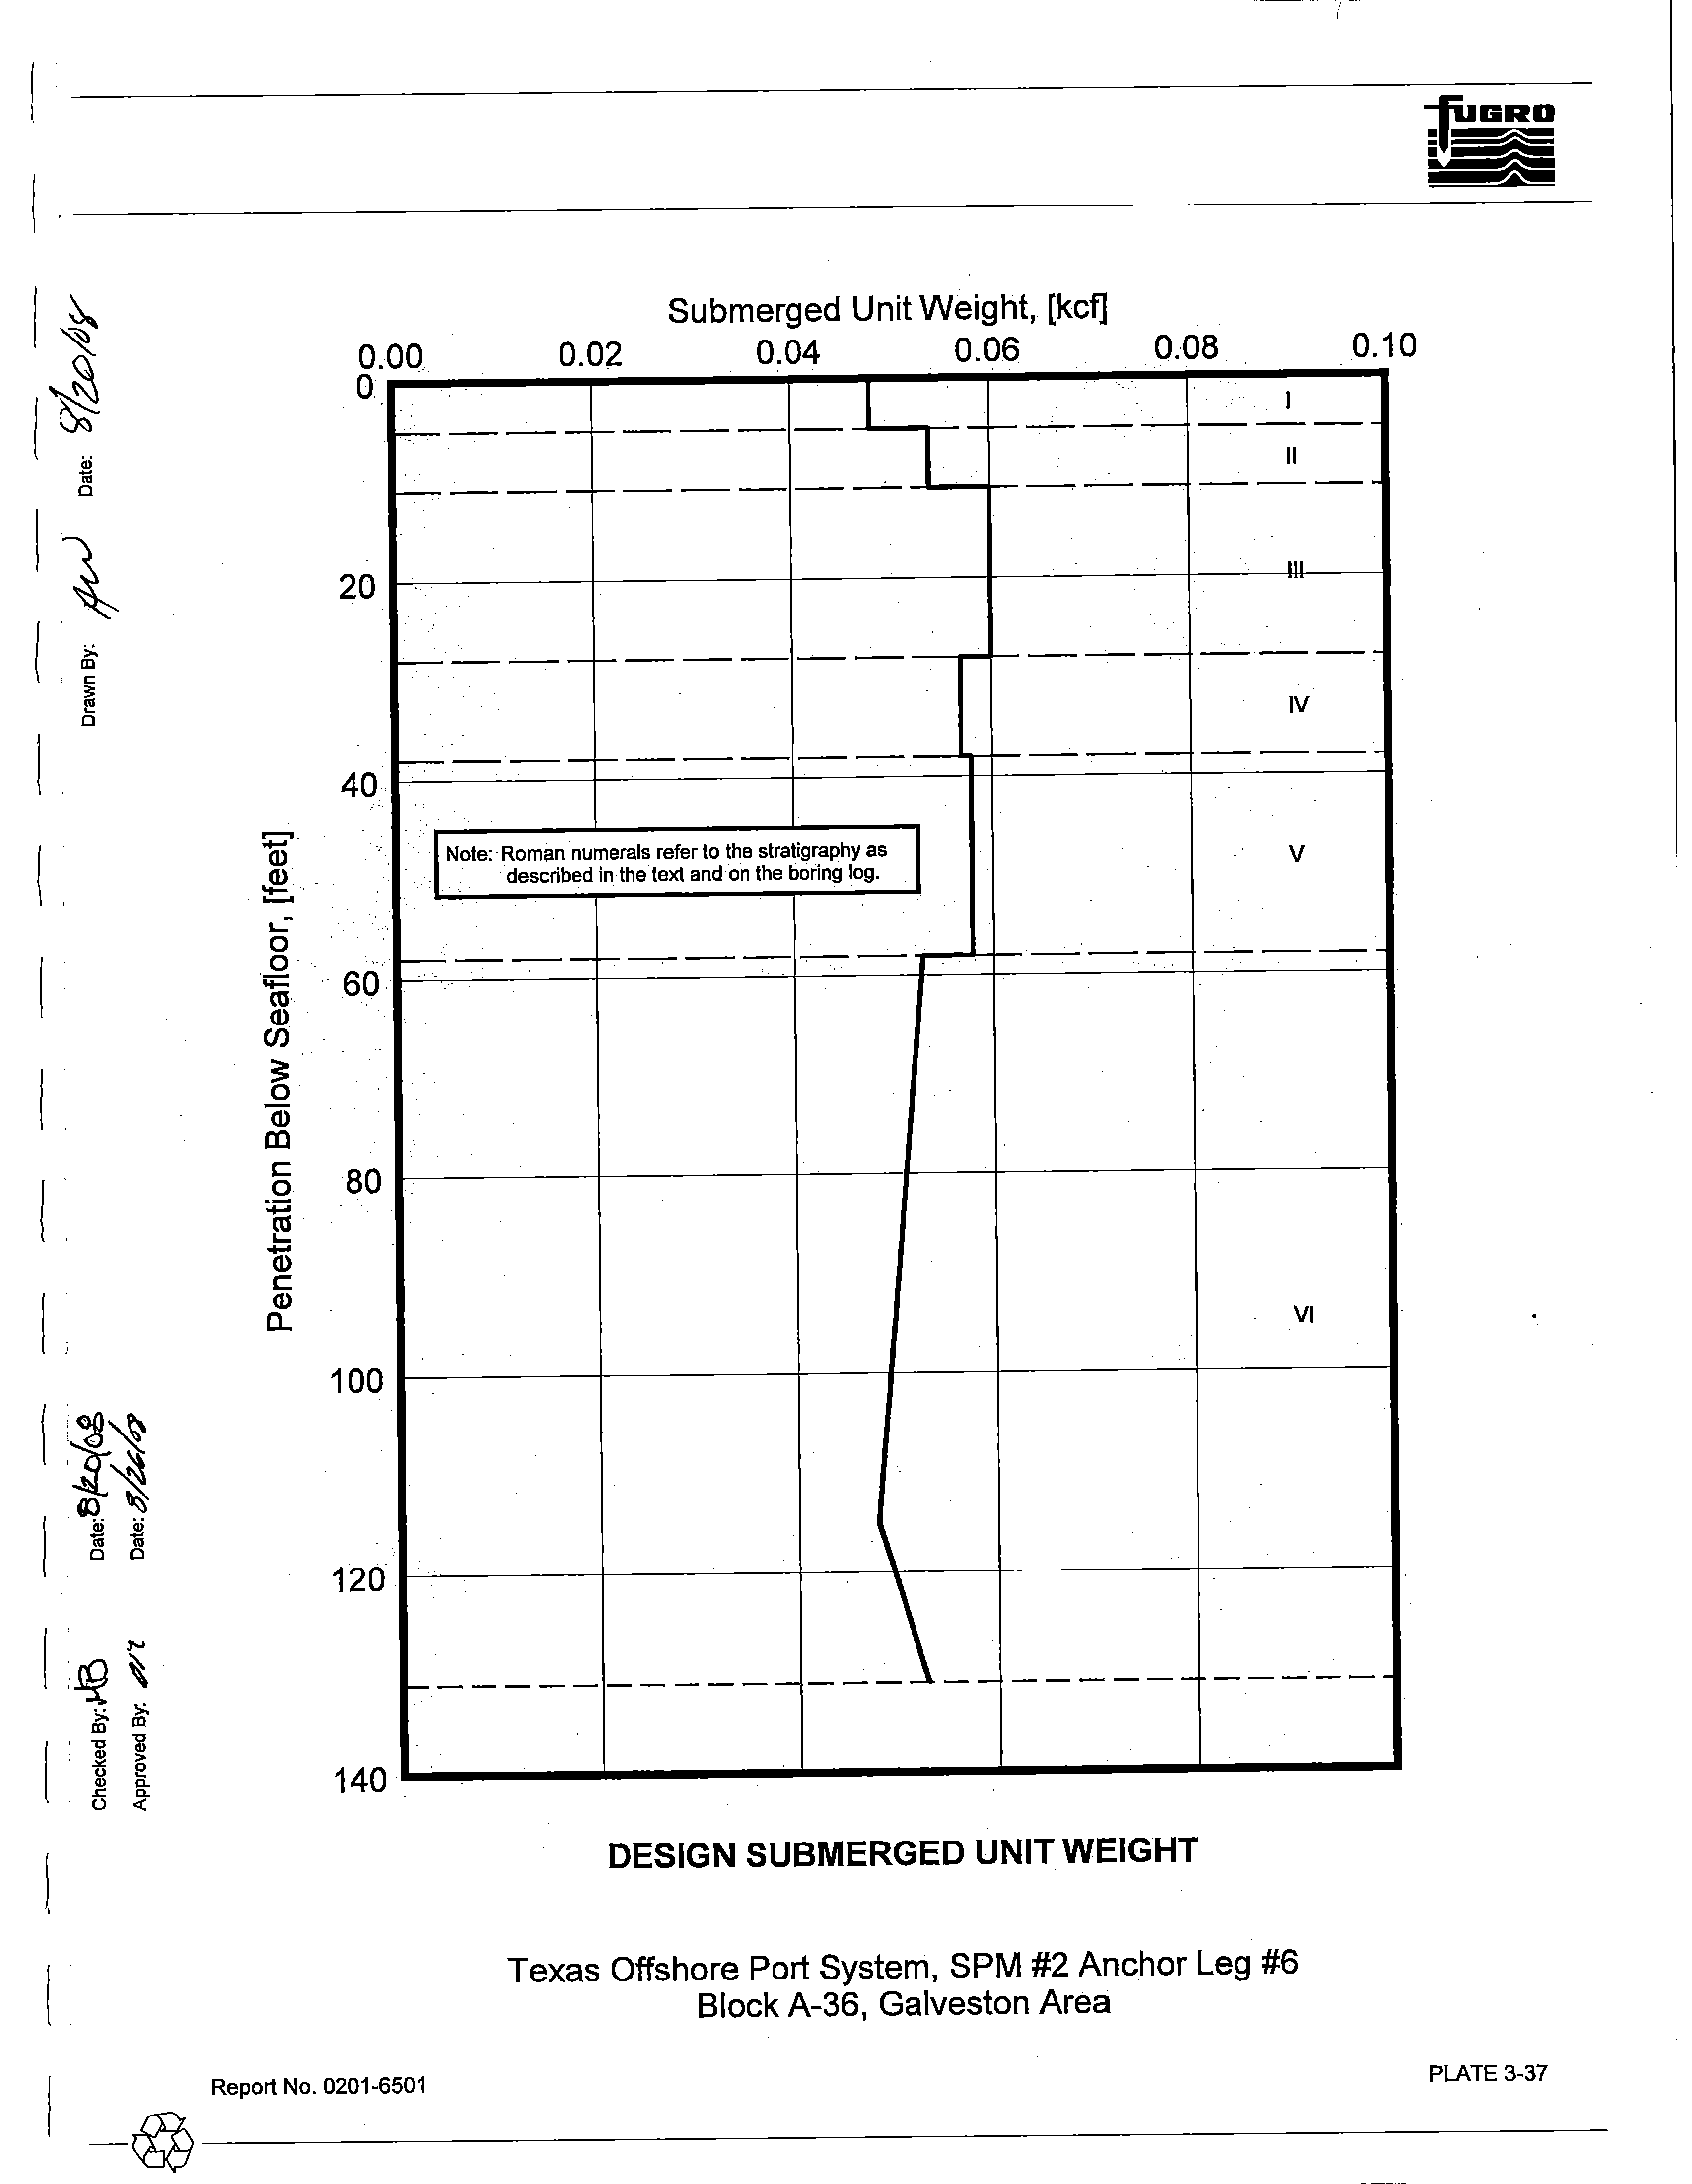
The shear strength and submerged unit weight profiles shown
on Plates 3-36 and 3-37,
respectively, best represent the assembled test results
ploUed on the boring log. These profiles were used
in the engineering analyses.
3.4.3
Pile Design Information
The pile design information developed for this study includes ultimate axial capacities, axial load-
pile movement data, and lateral soil resistance-pile deflection (p-y) characteristics. The analytical methods
used to develop this information are presented briefly
in Section 2.5 and in more detail in Appendix B.
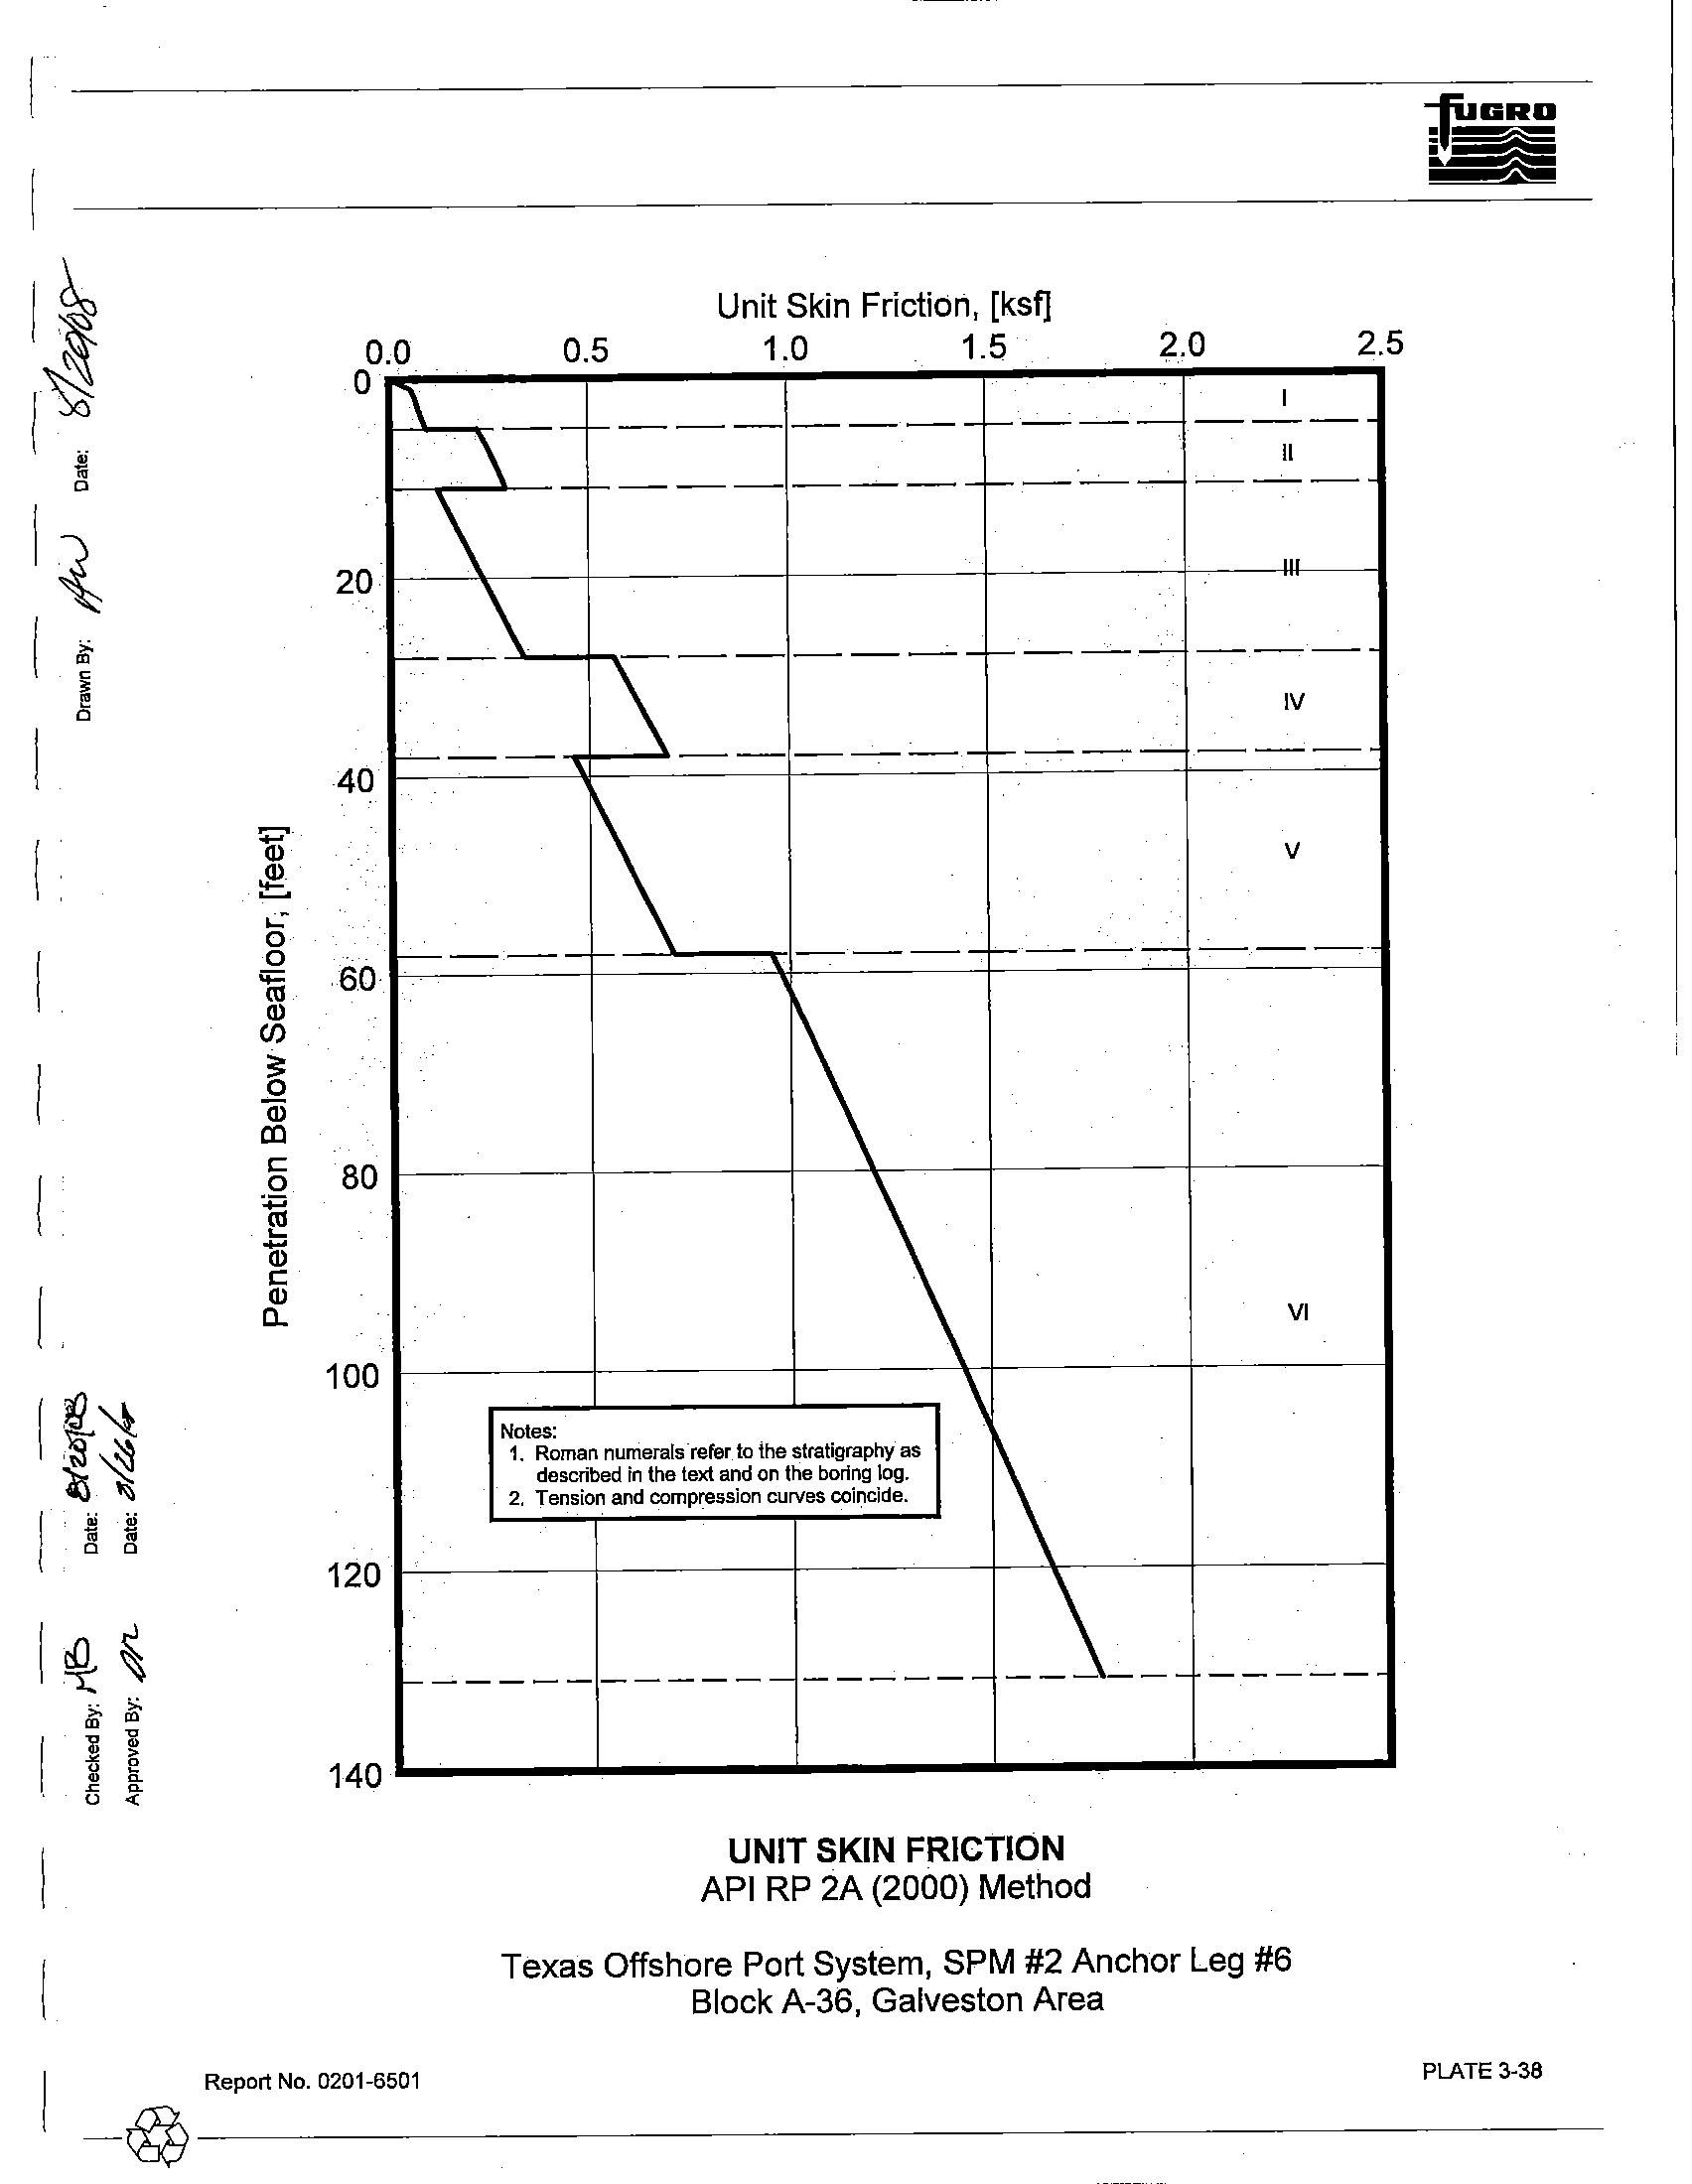
3.4.3.1 Axial Pile Design
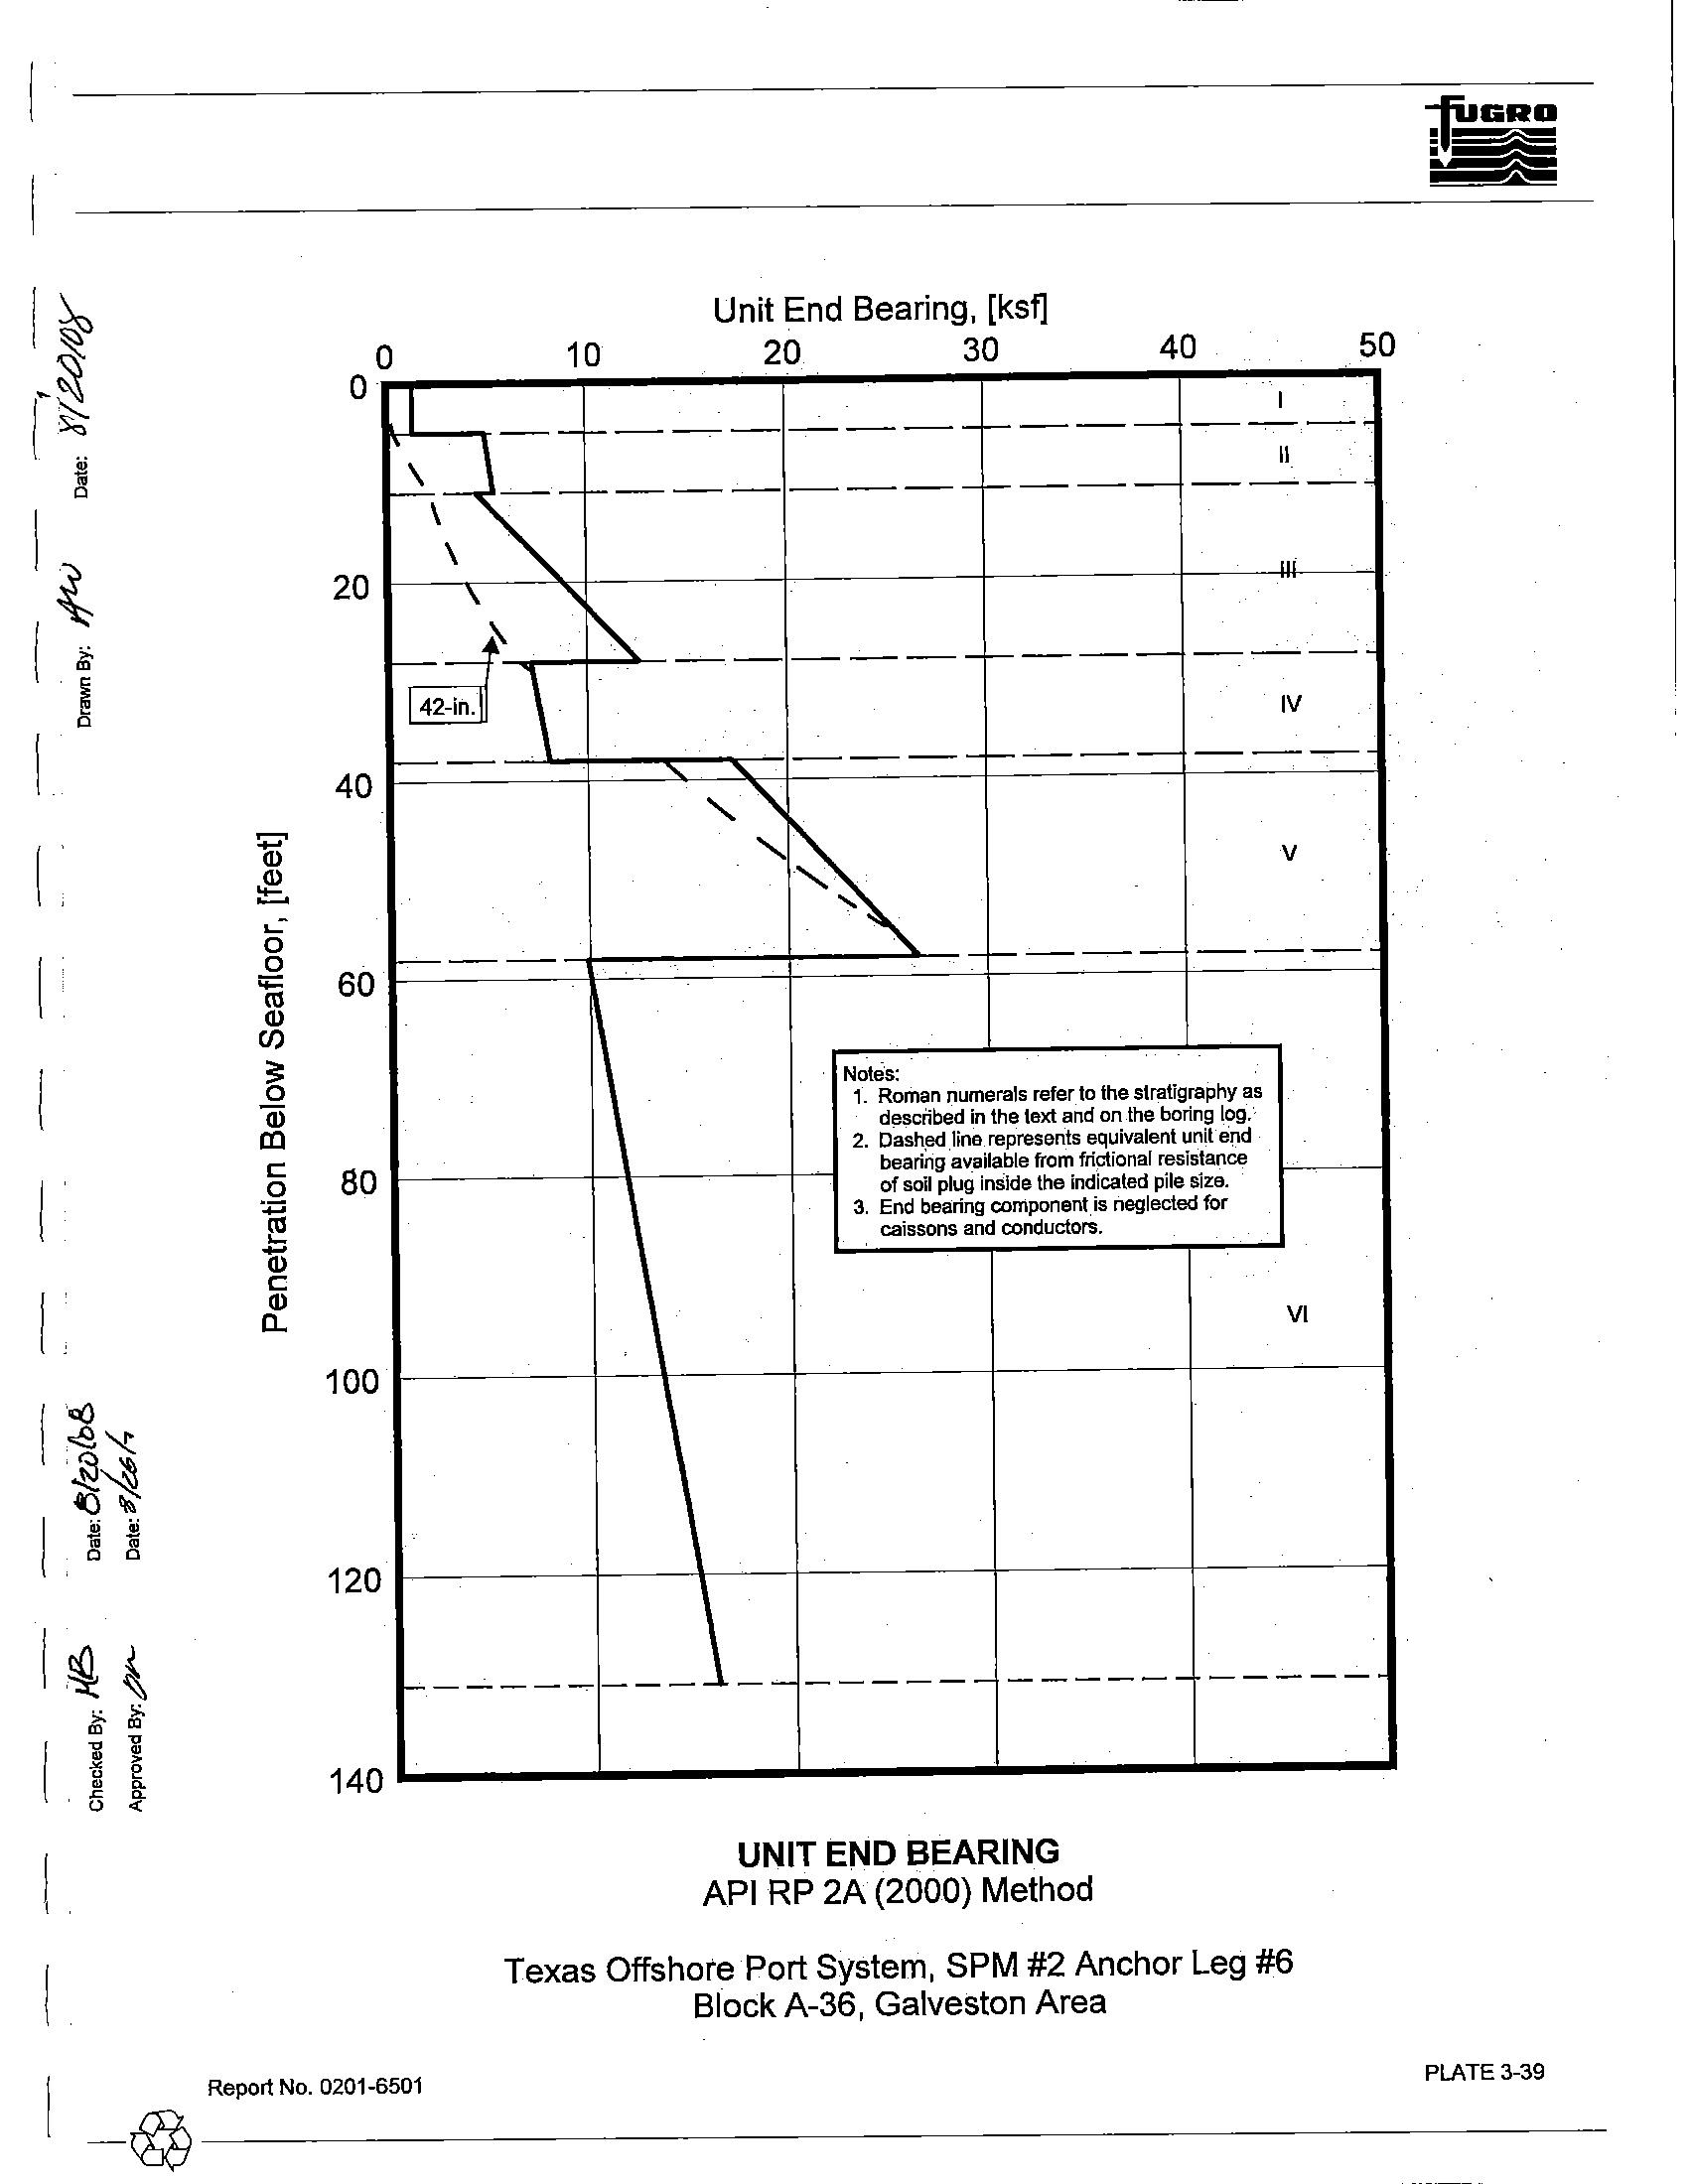
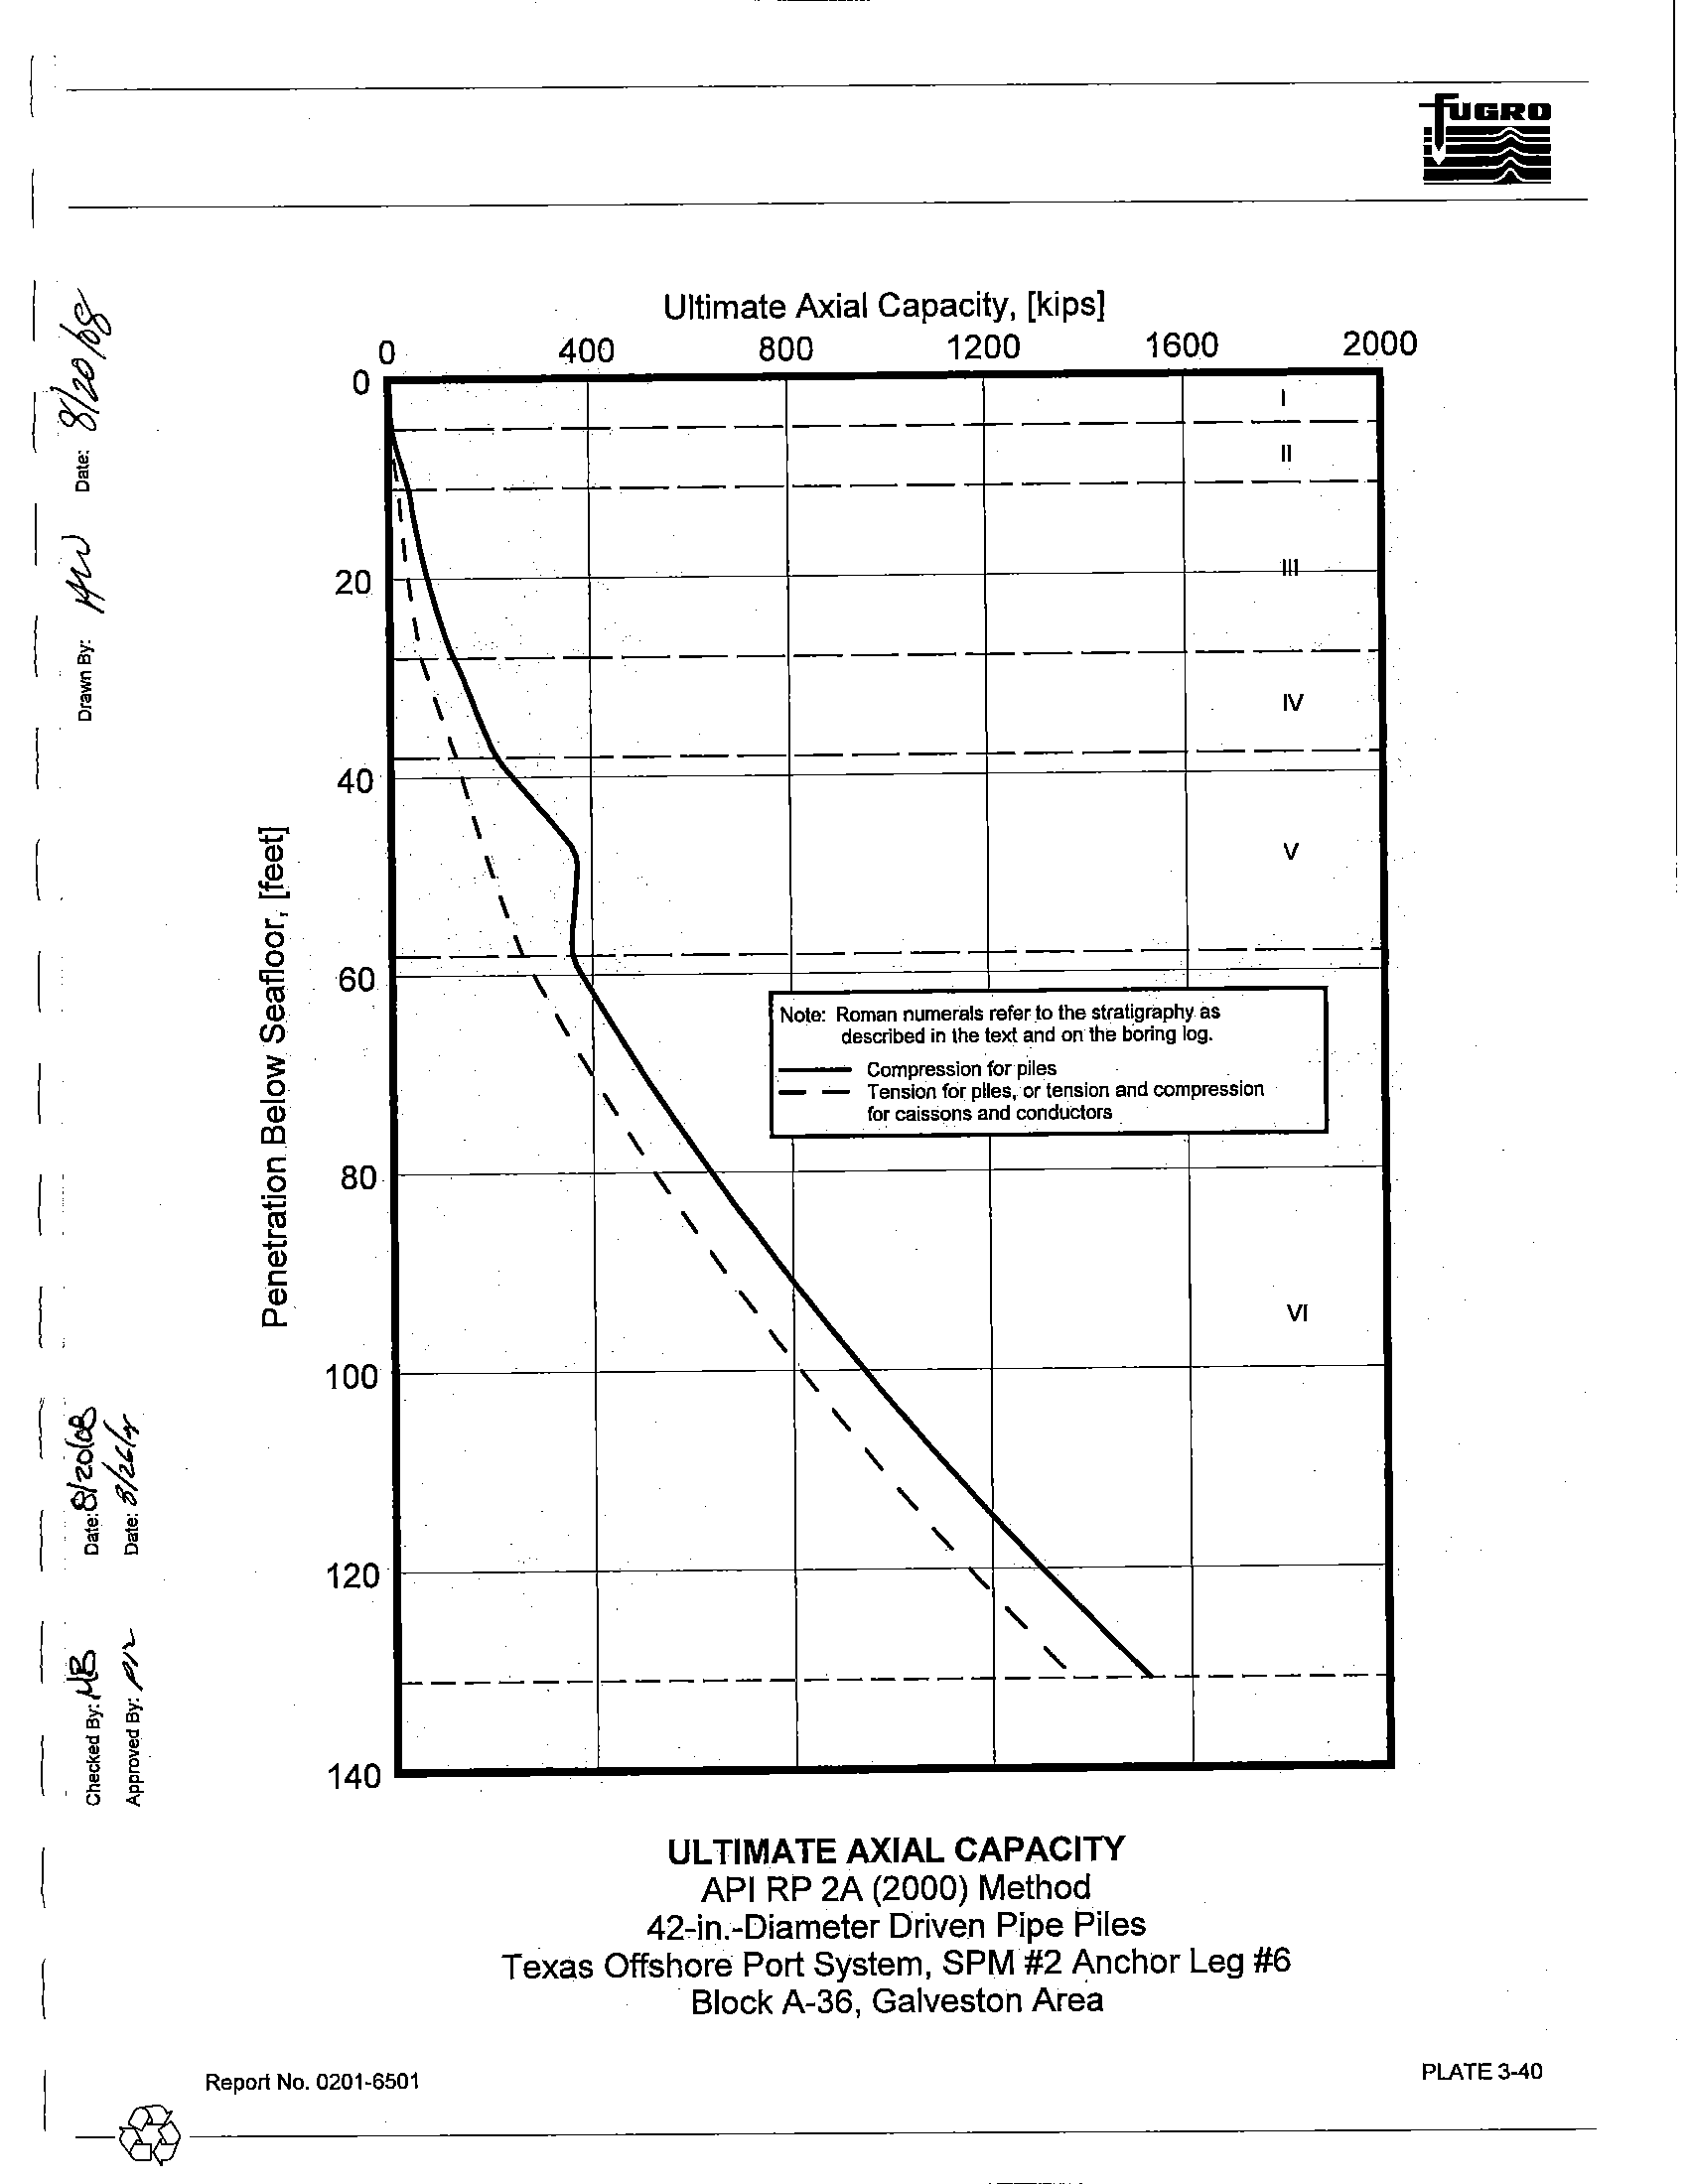
Ultimate Axial Capacity. The unit skin friction and unit end bearing values
ploUed on Plates 3-38
and 3-39. respectively, was calculated using the API
RP 2A methods described in Appendix B.
These
values were used to calculate the ultimate
aXial compressive and tensile capacities for 42-in.-diameter pipe
piles, driven to final penetration at the boring location. Capacity curves for driven pipe piles (conductors,
caissons, anchor and foundation piles) are presented
on Plate 3-40.
I
Report No. 0201-6501
.
~@-----------
3-10
API RP 2A recommends that pile penetrations be selected using appropriate factors of safety or
pile resistance factors. These factors are discussed in Section 2.5.1 of this report.
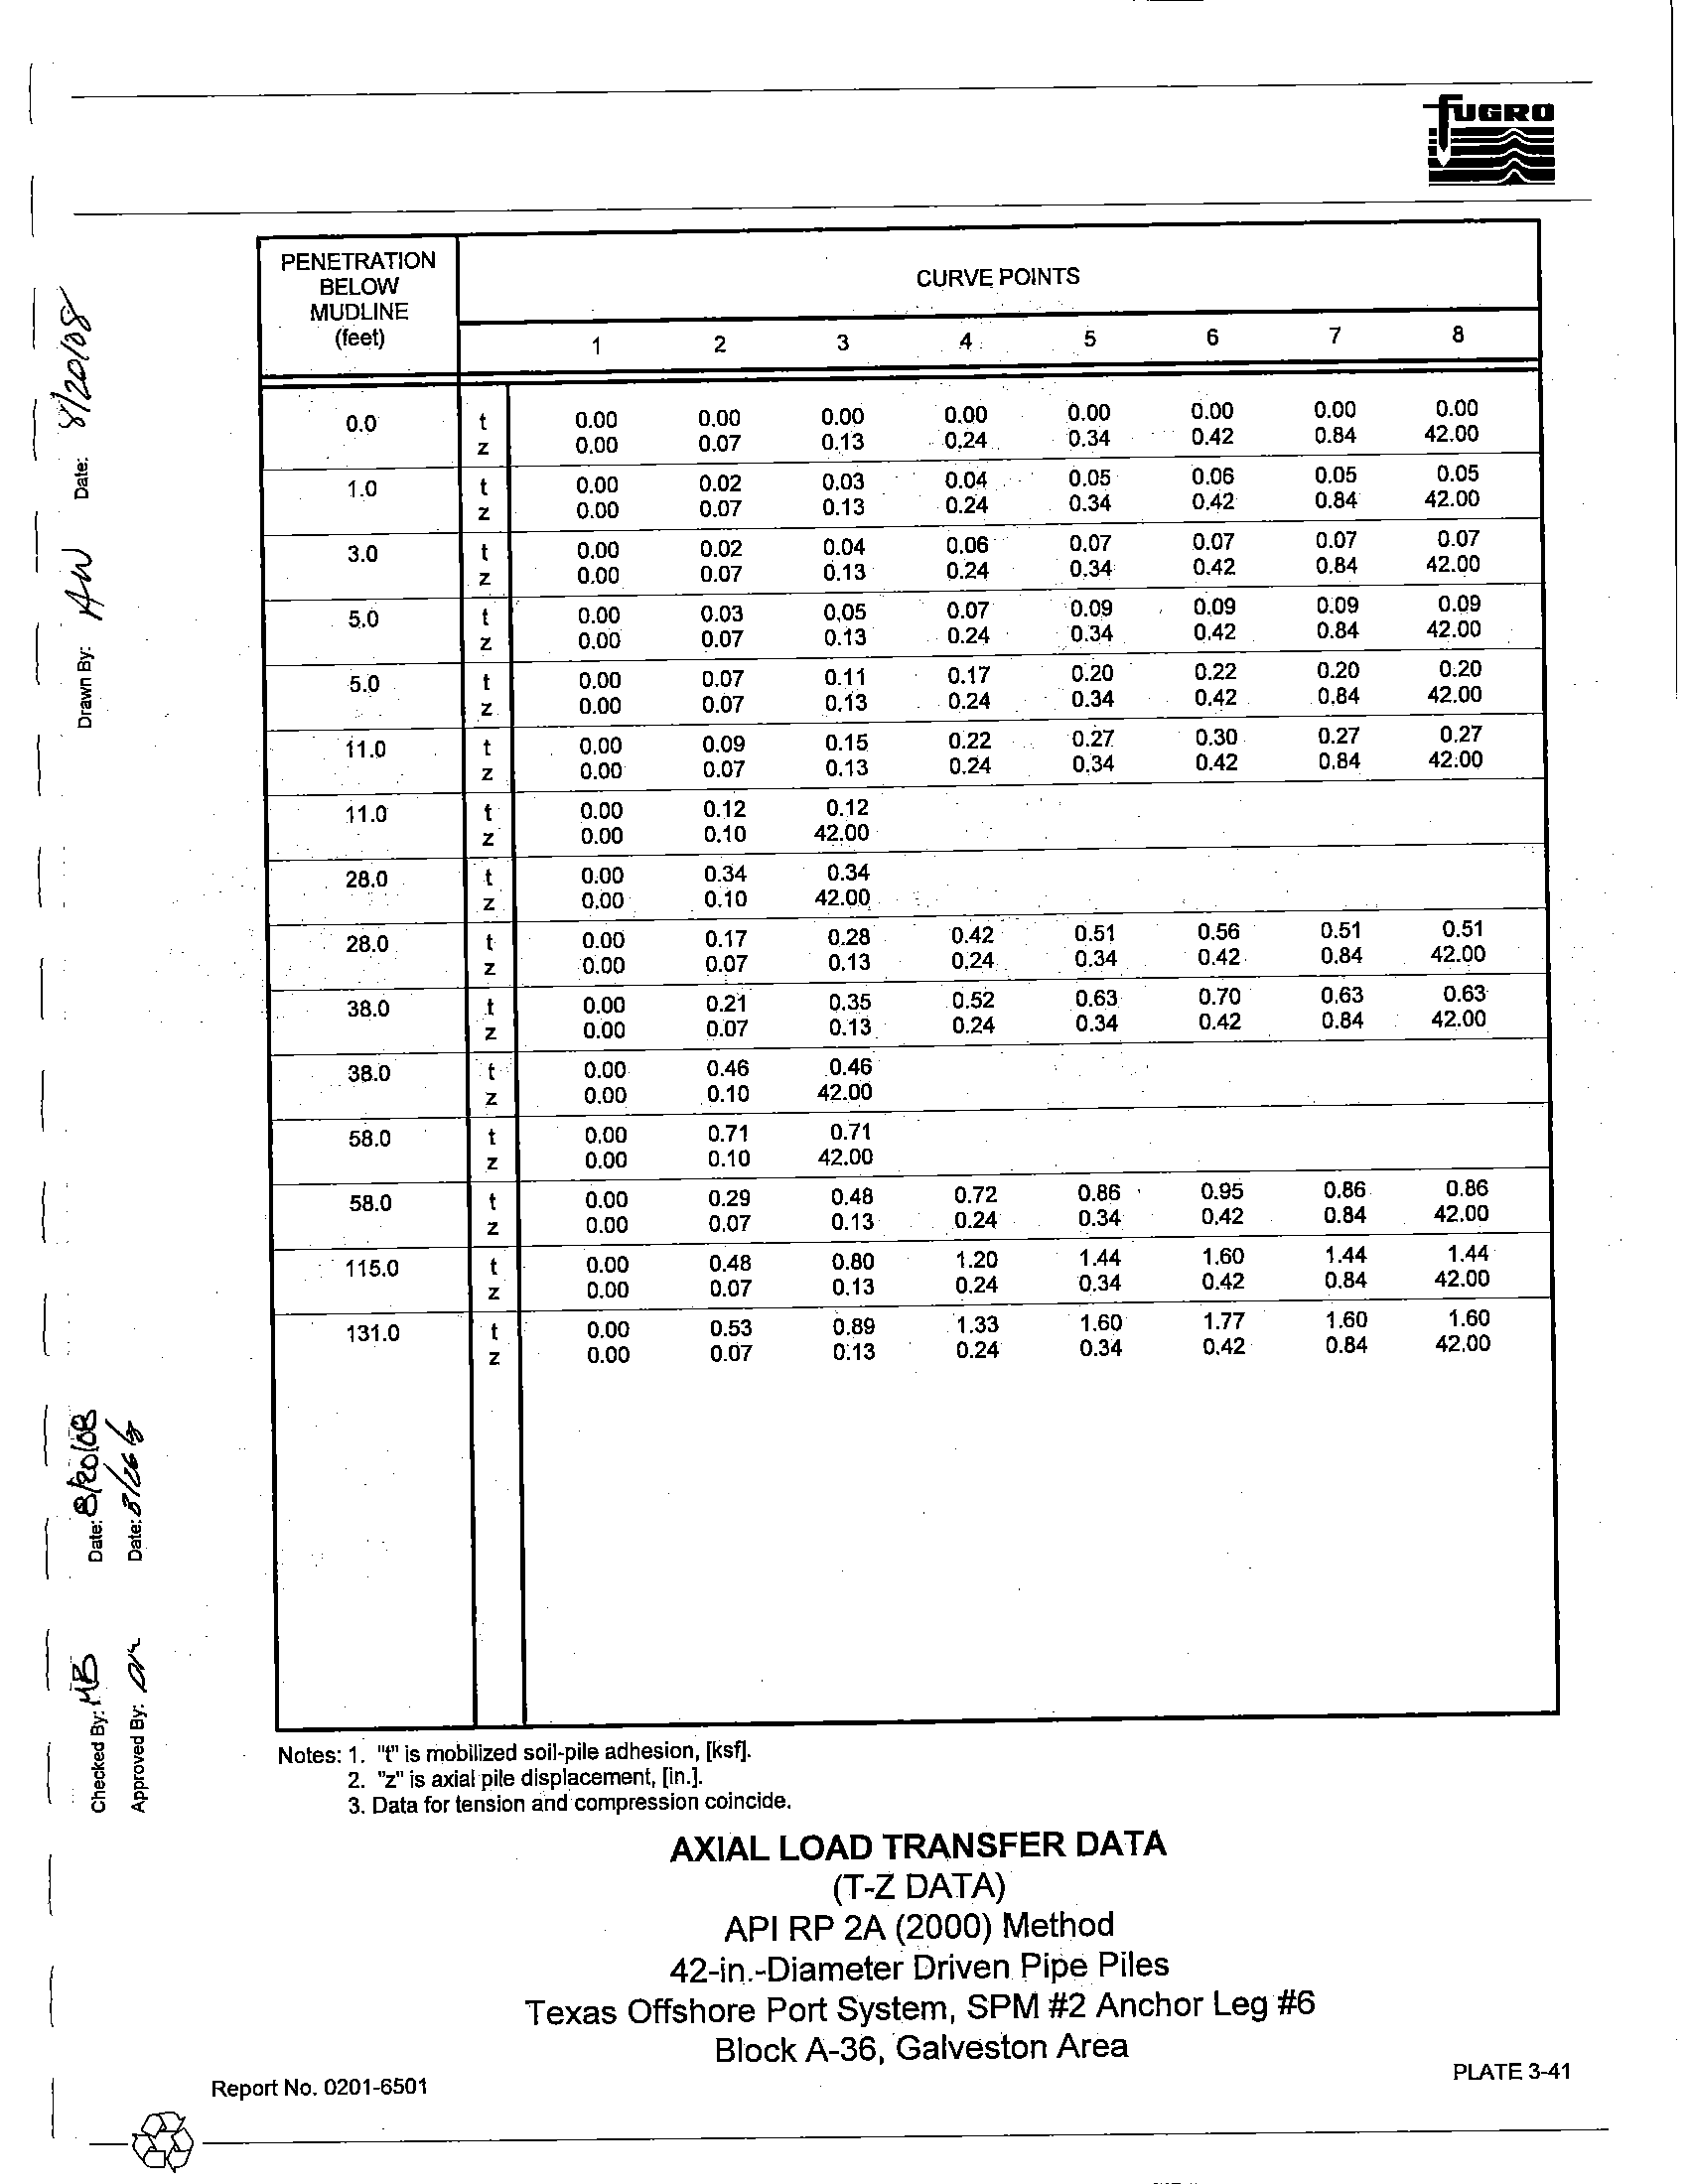
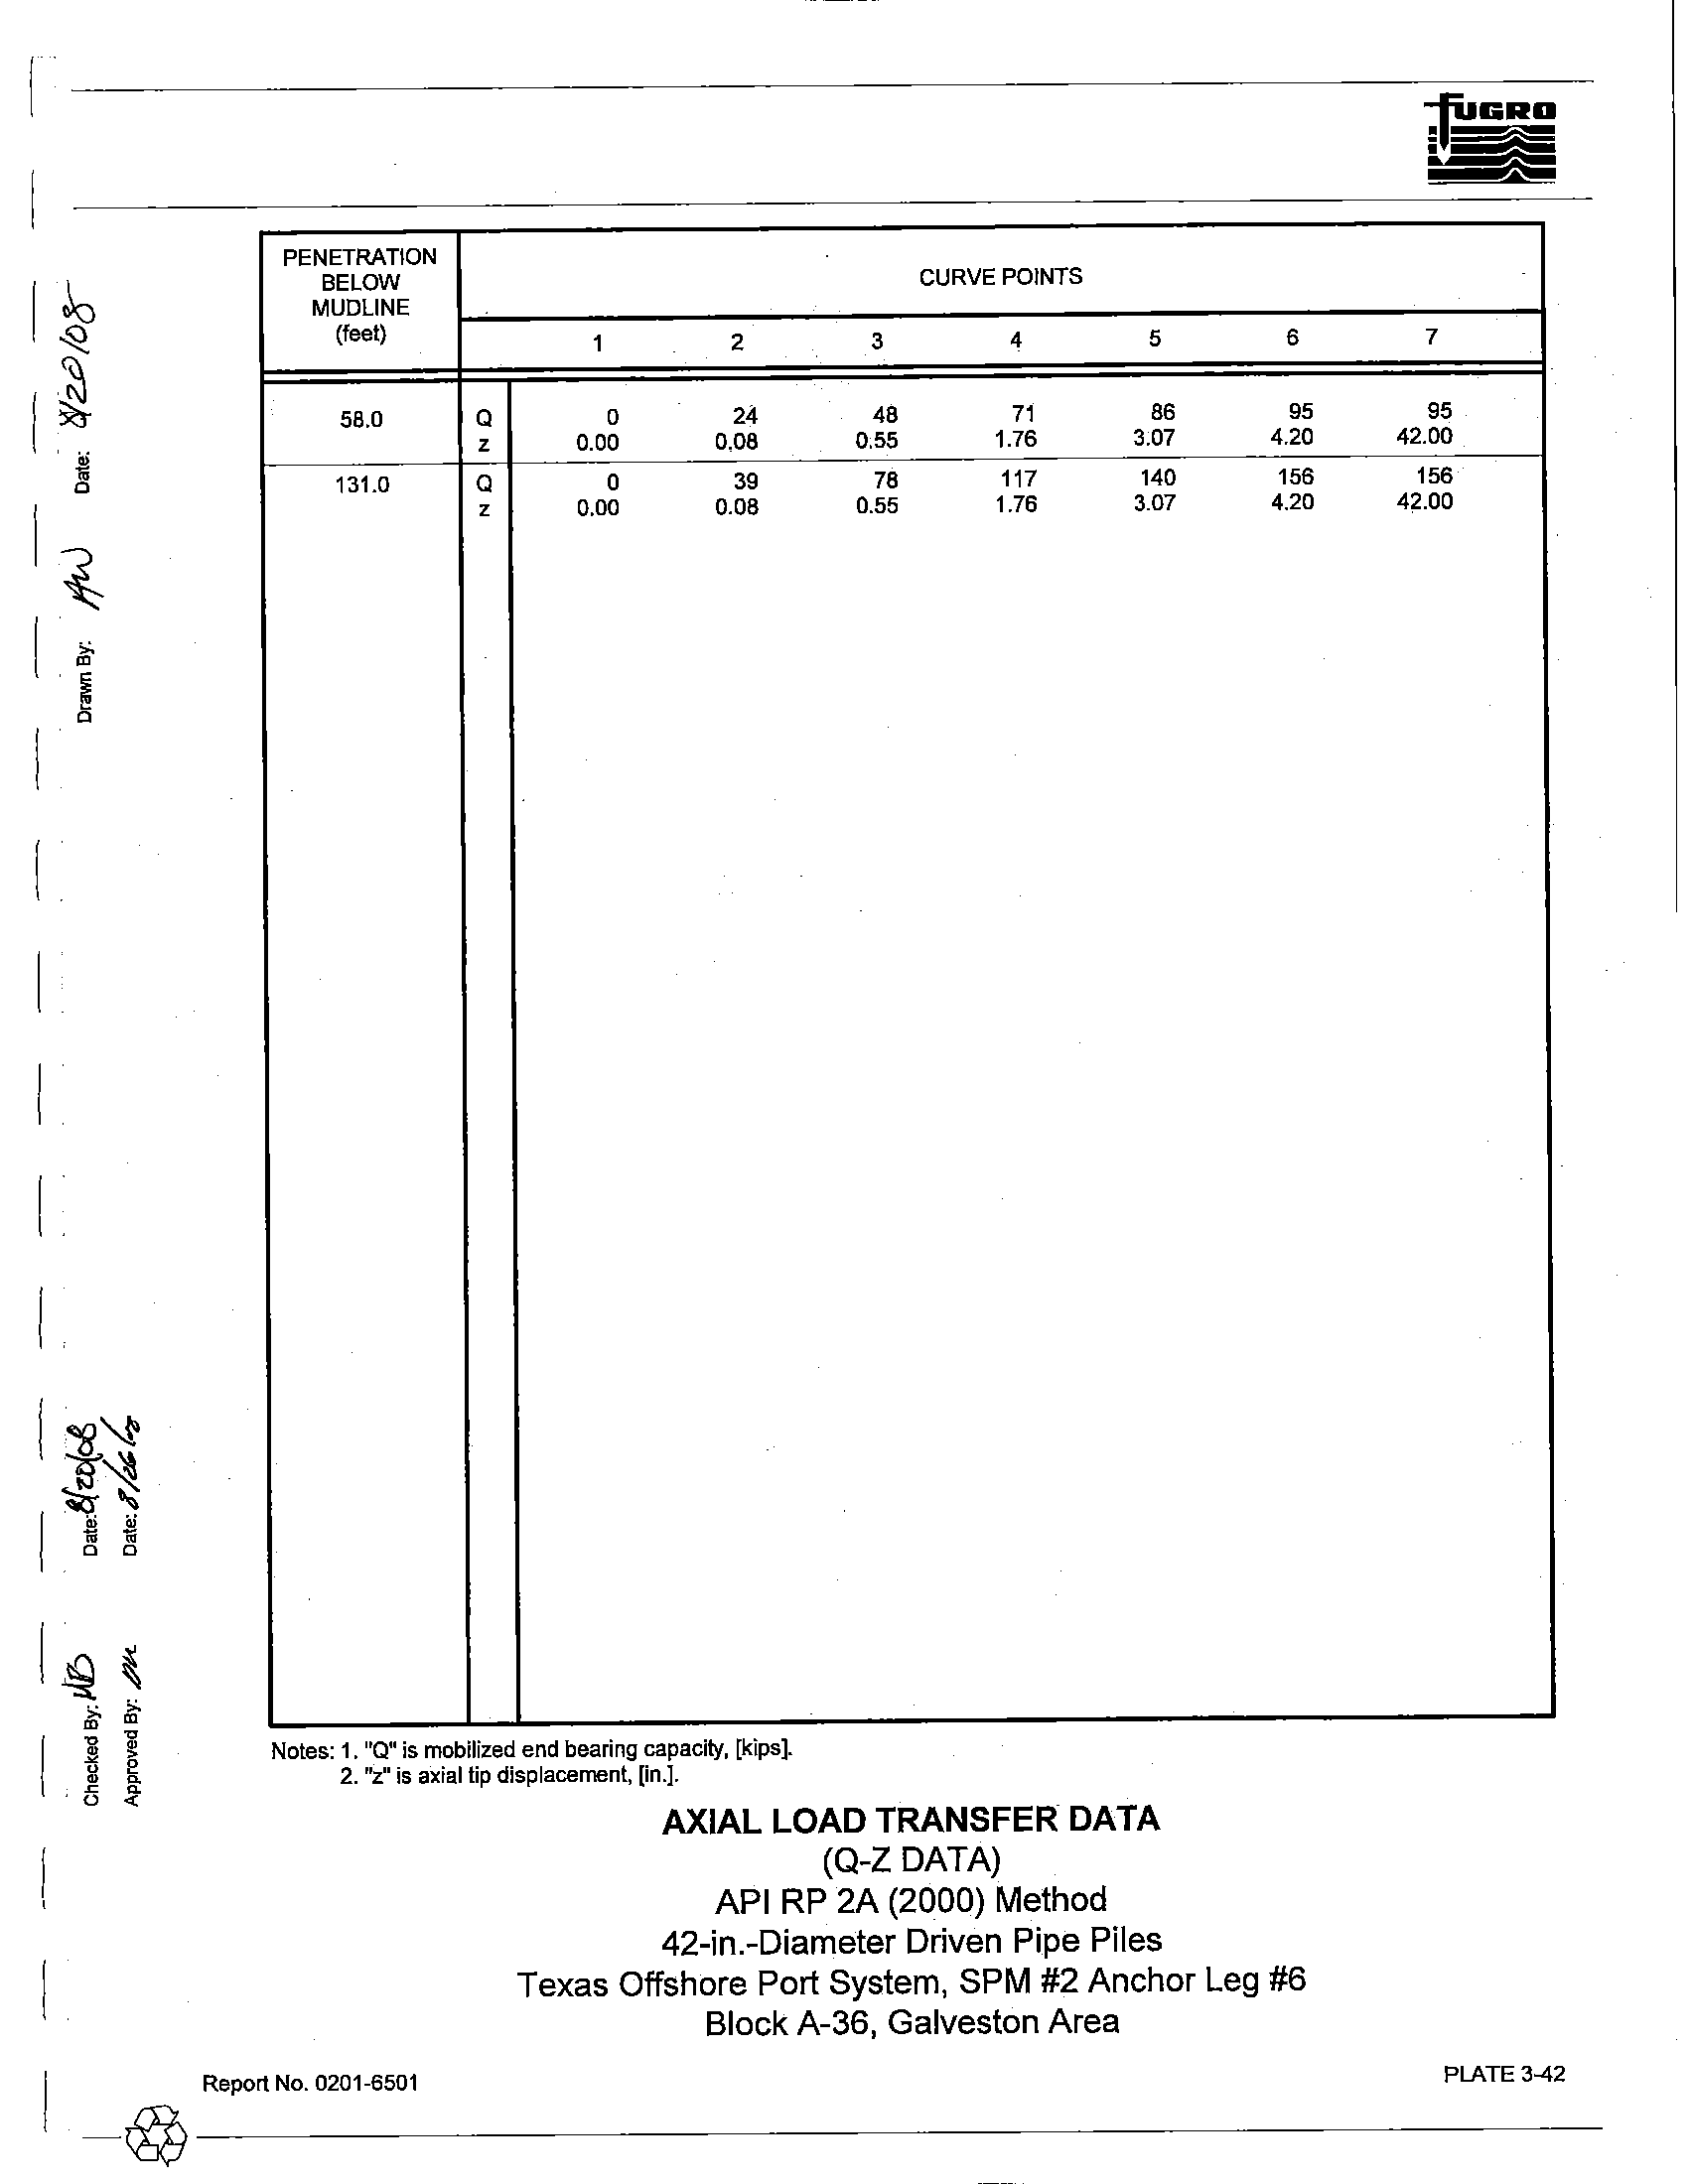
Axial Load
Transfer Data. Axial load-pile movement analyses are usually performed using a
computer solution based on methods developed by Reese (1964) or Matlock, et
al. (1976). Plates 3-41 and
3-42 present the results
as side load-side movement (t-z) and tip load-tip movement (Q-z) data for 42-in.-
diameter driven pipe piles, respectively. The Q-z data should
be used for foundation piles and neglected for
caissons and conductor design.
In developing the axial load transfer data in the cohesive soils, a post-peak
adhesion ratio of 0.90 was utilized.
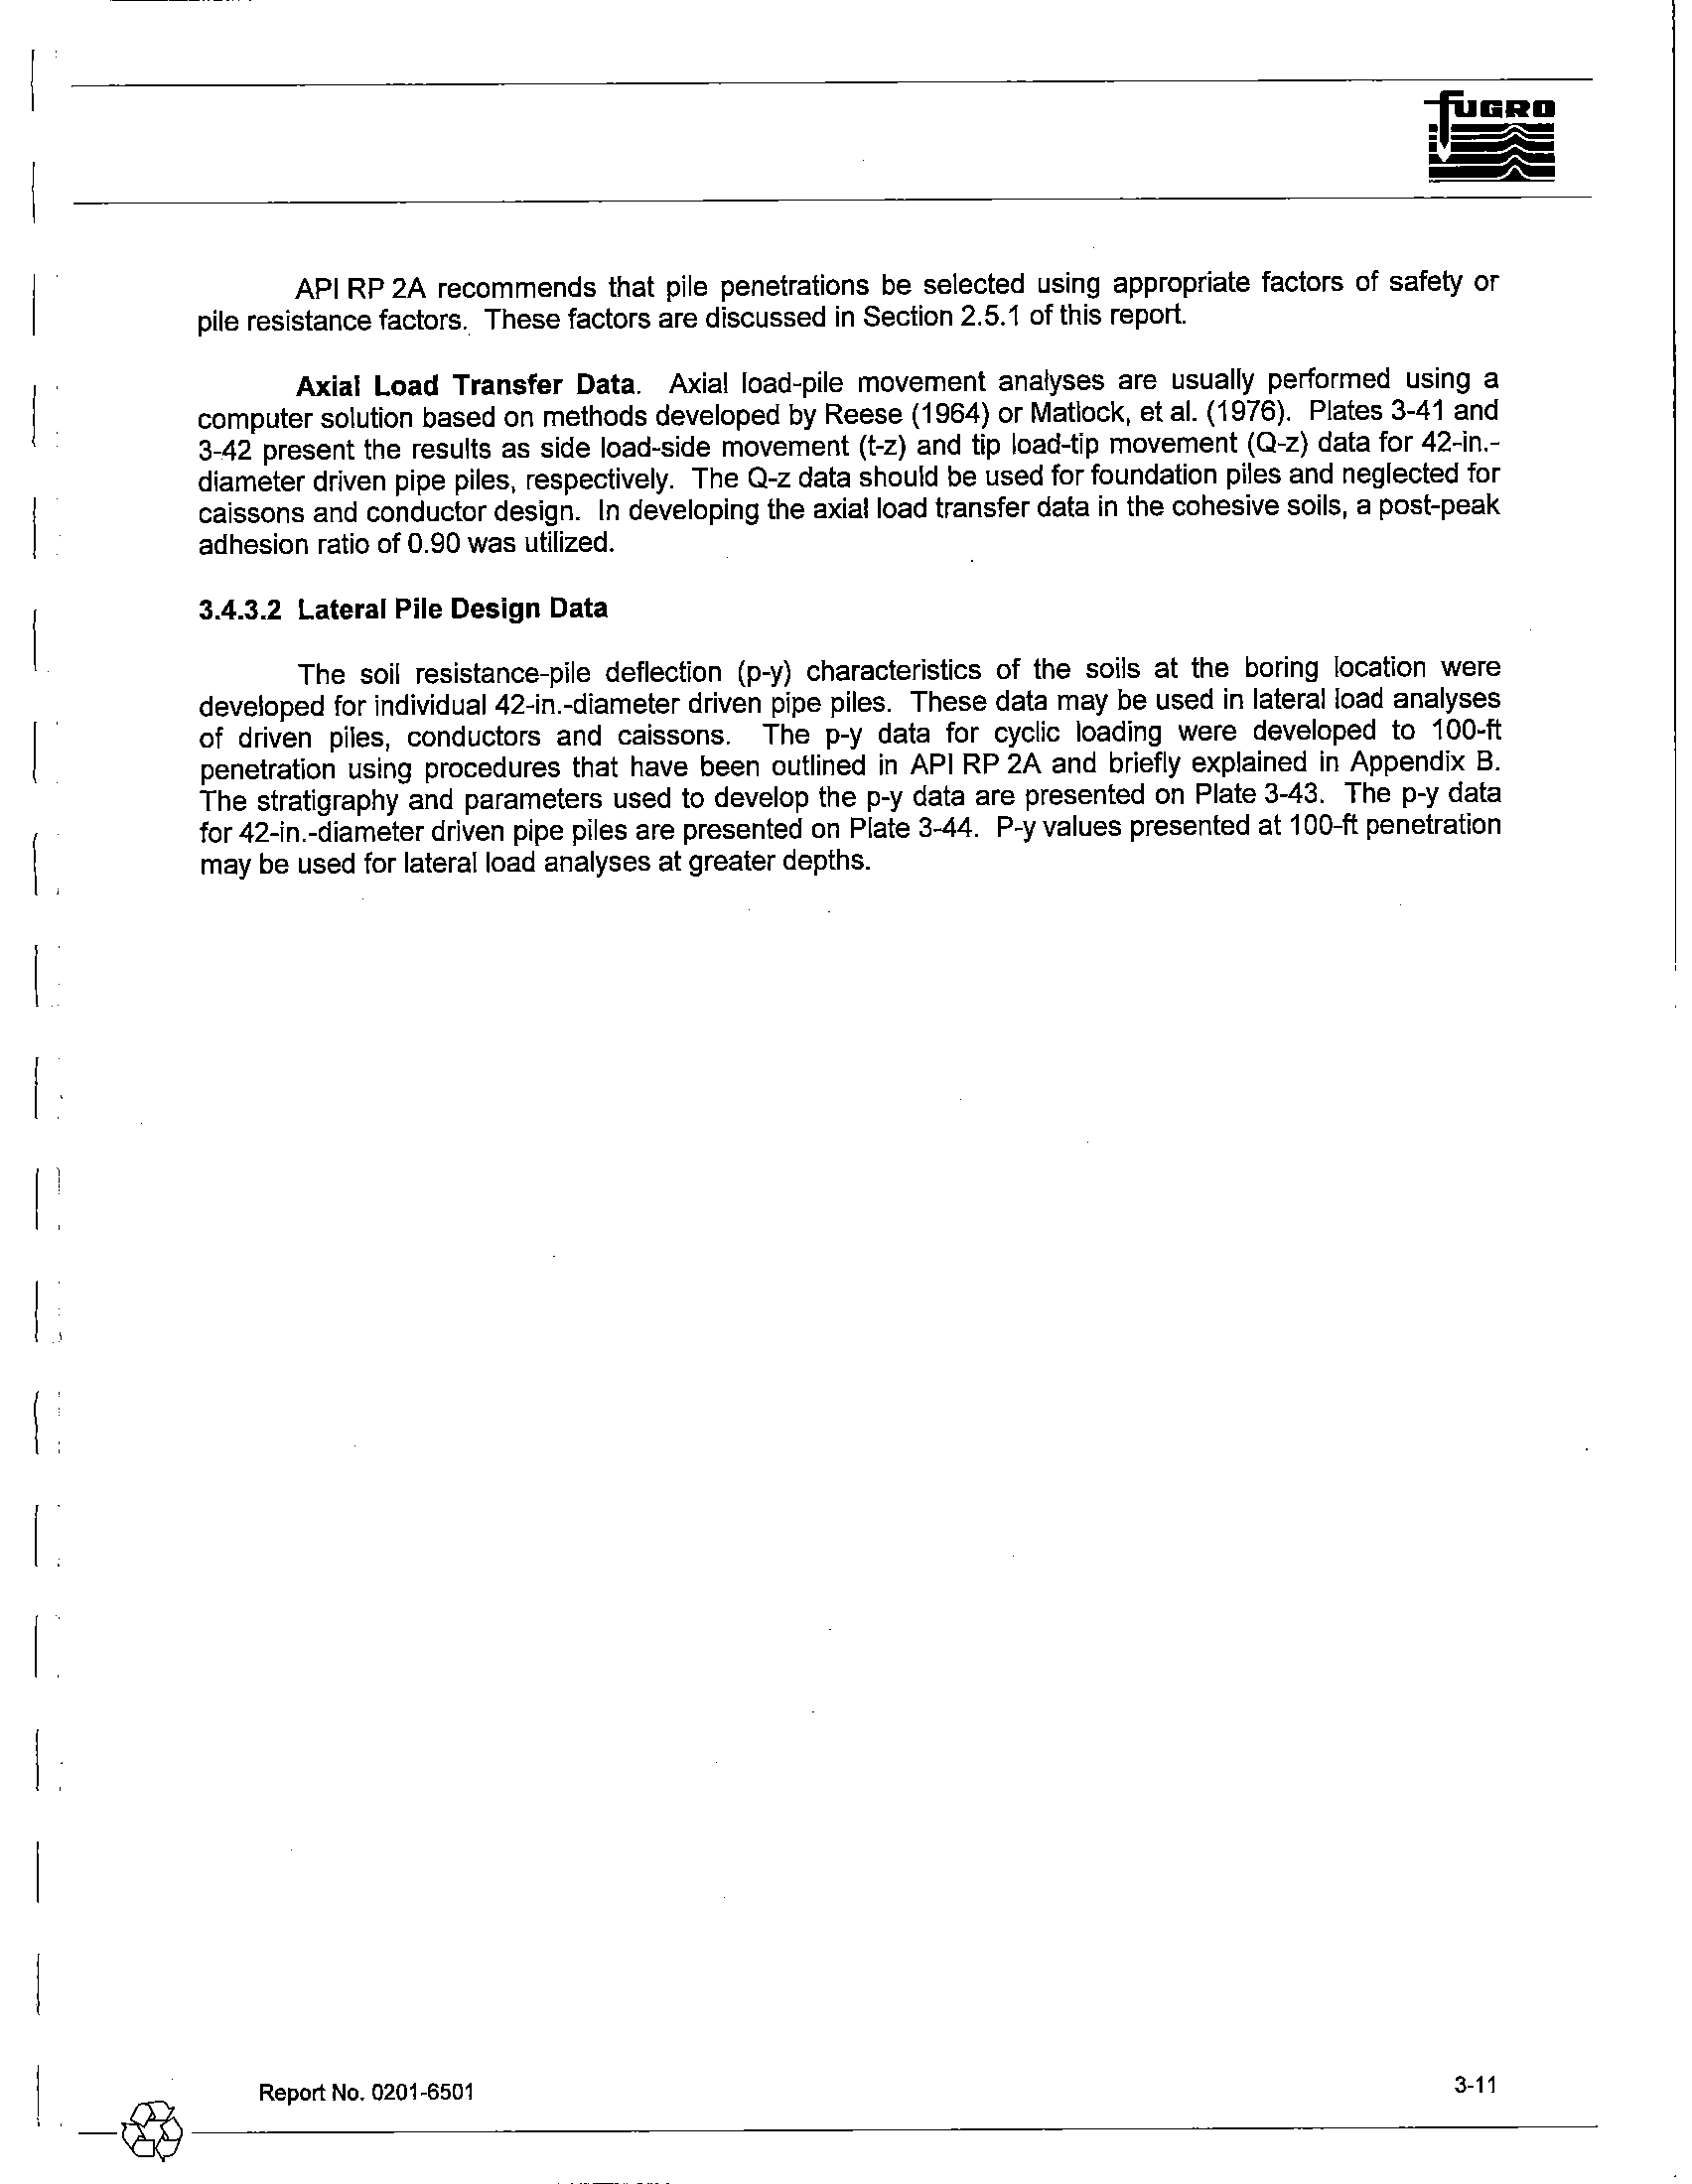
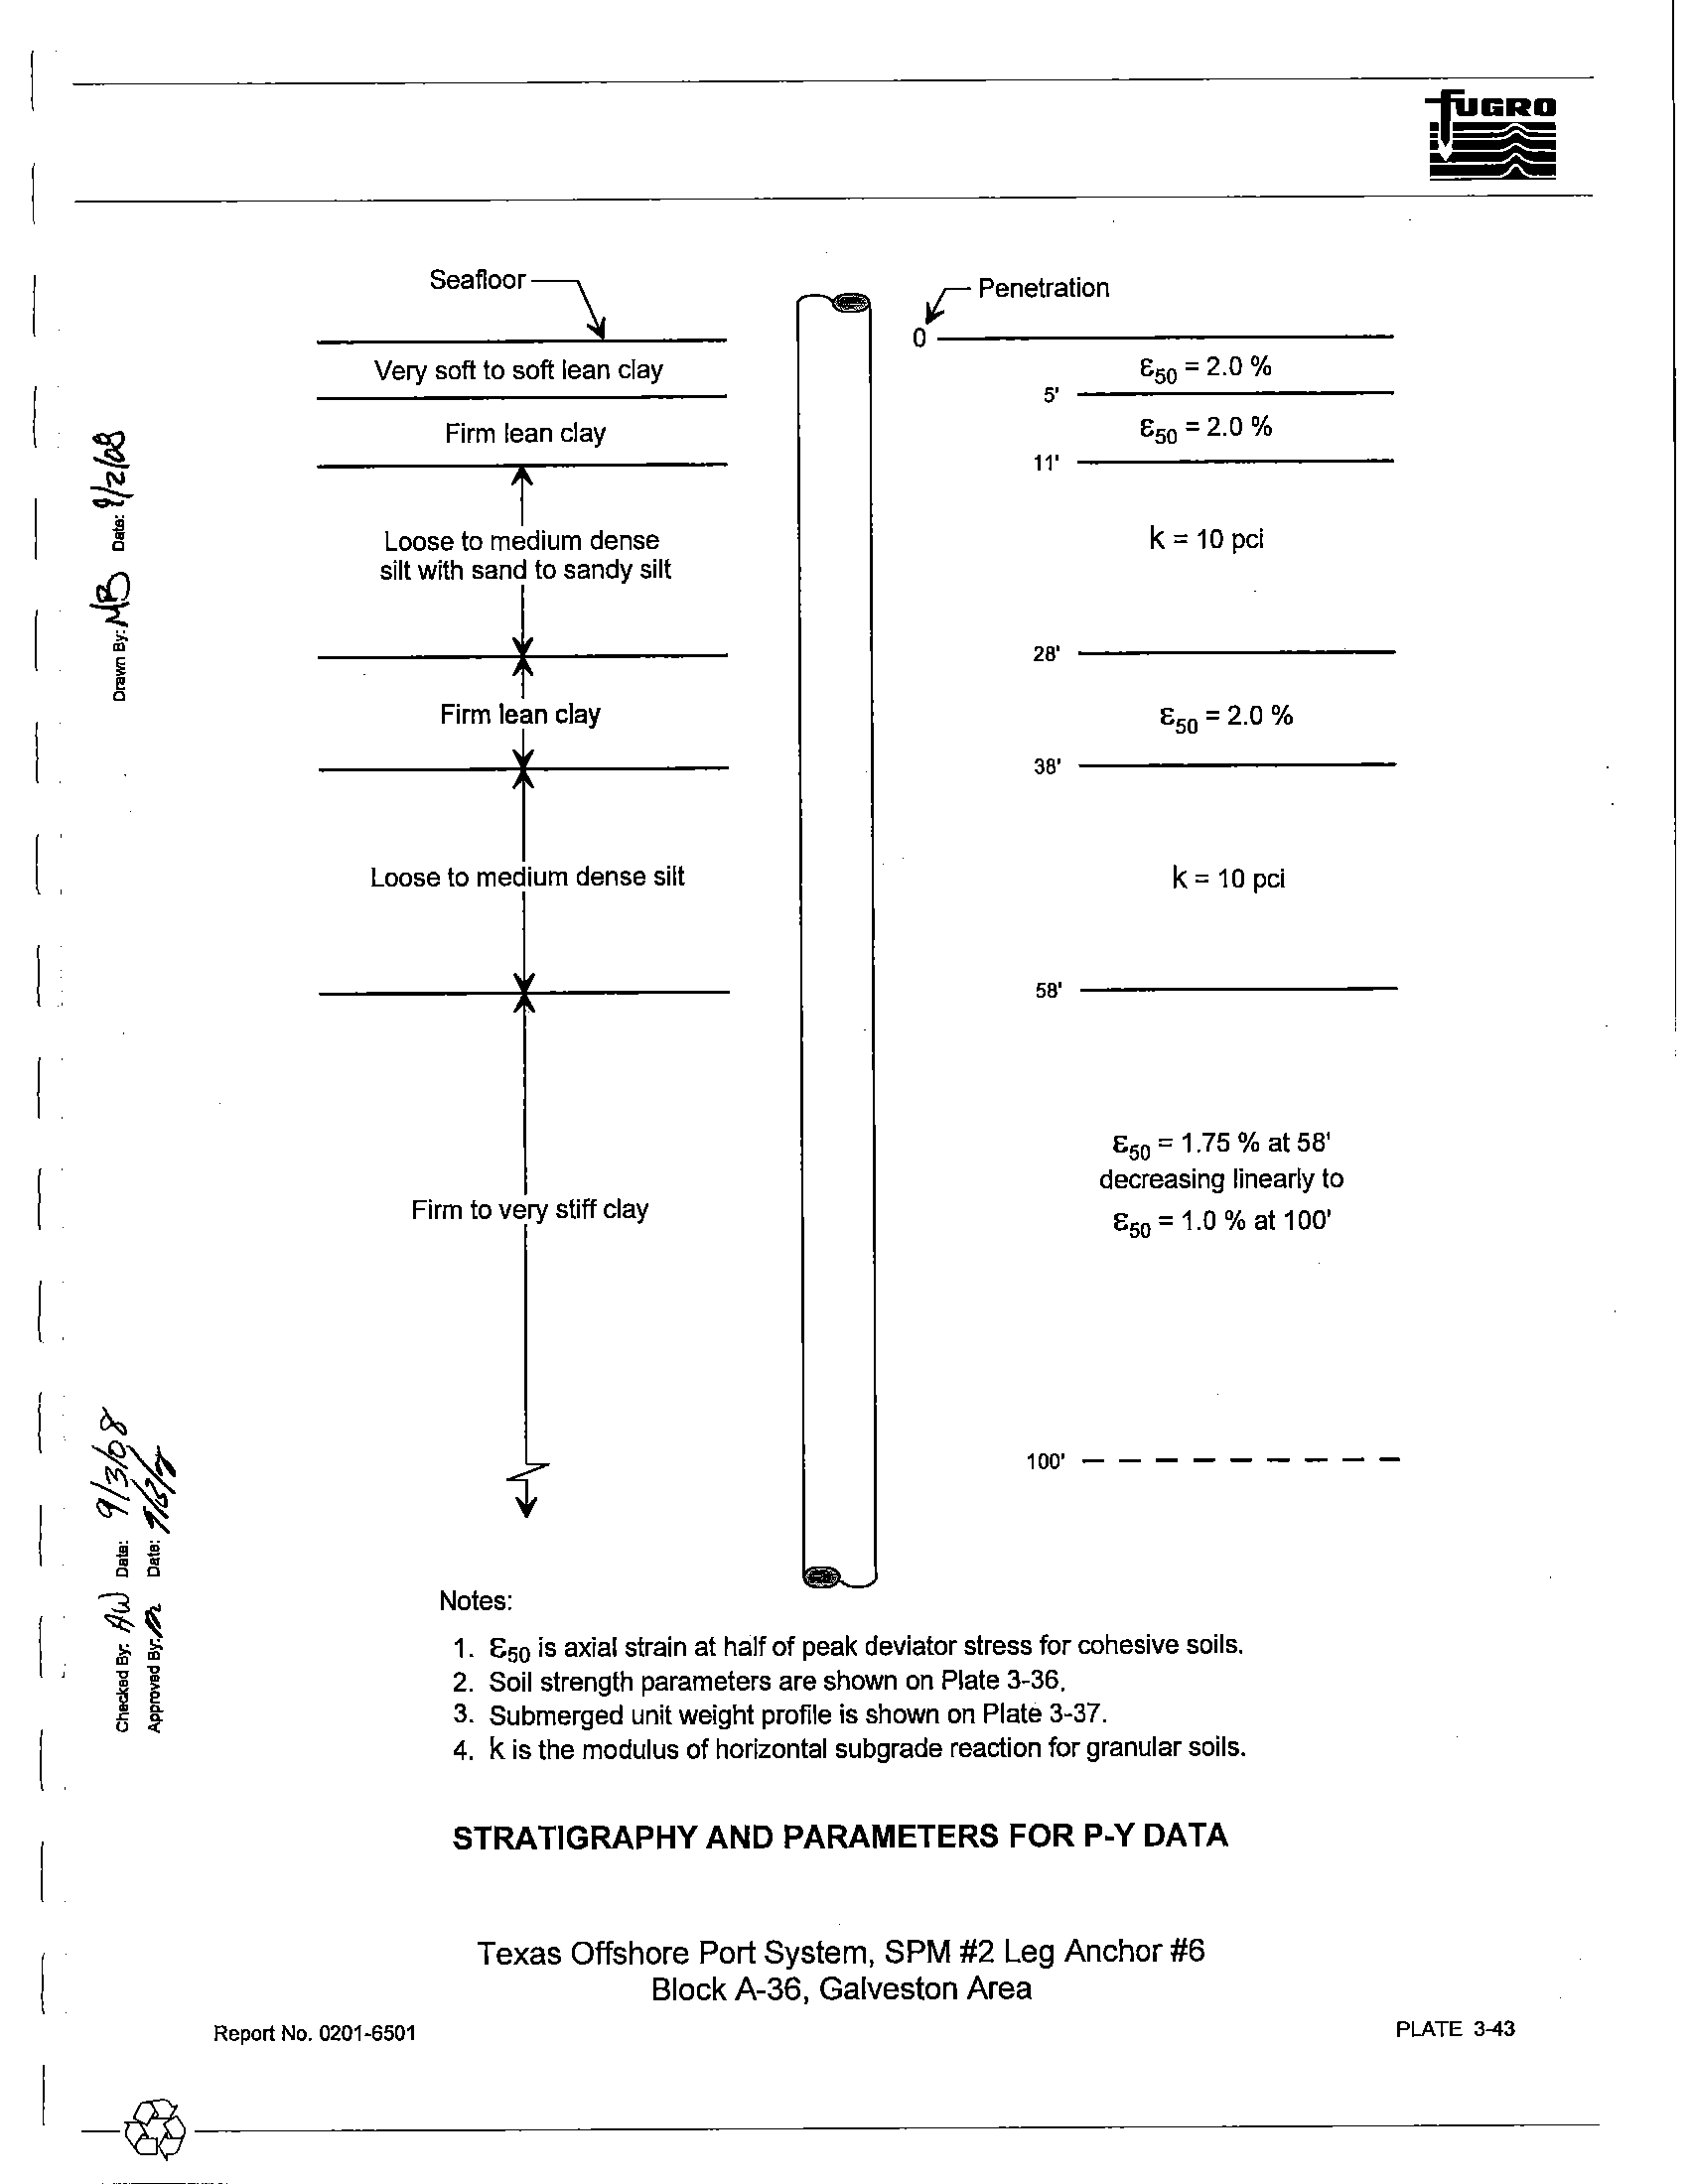
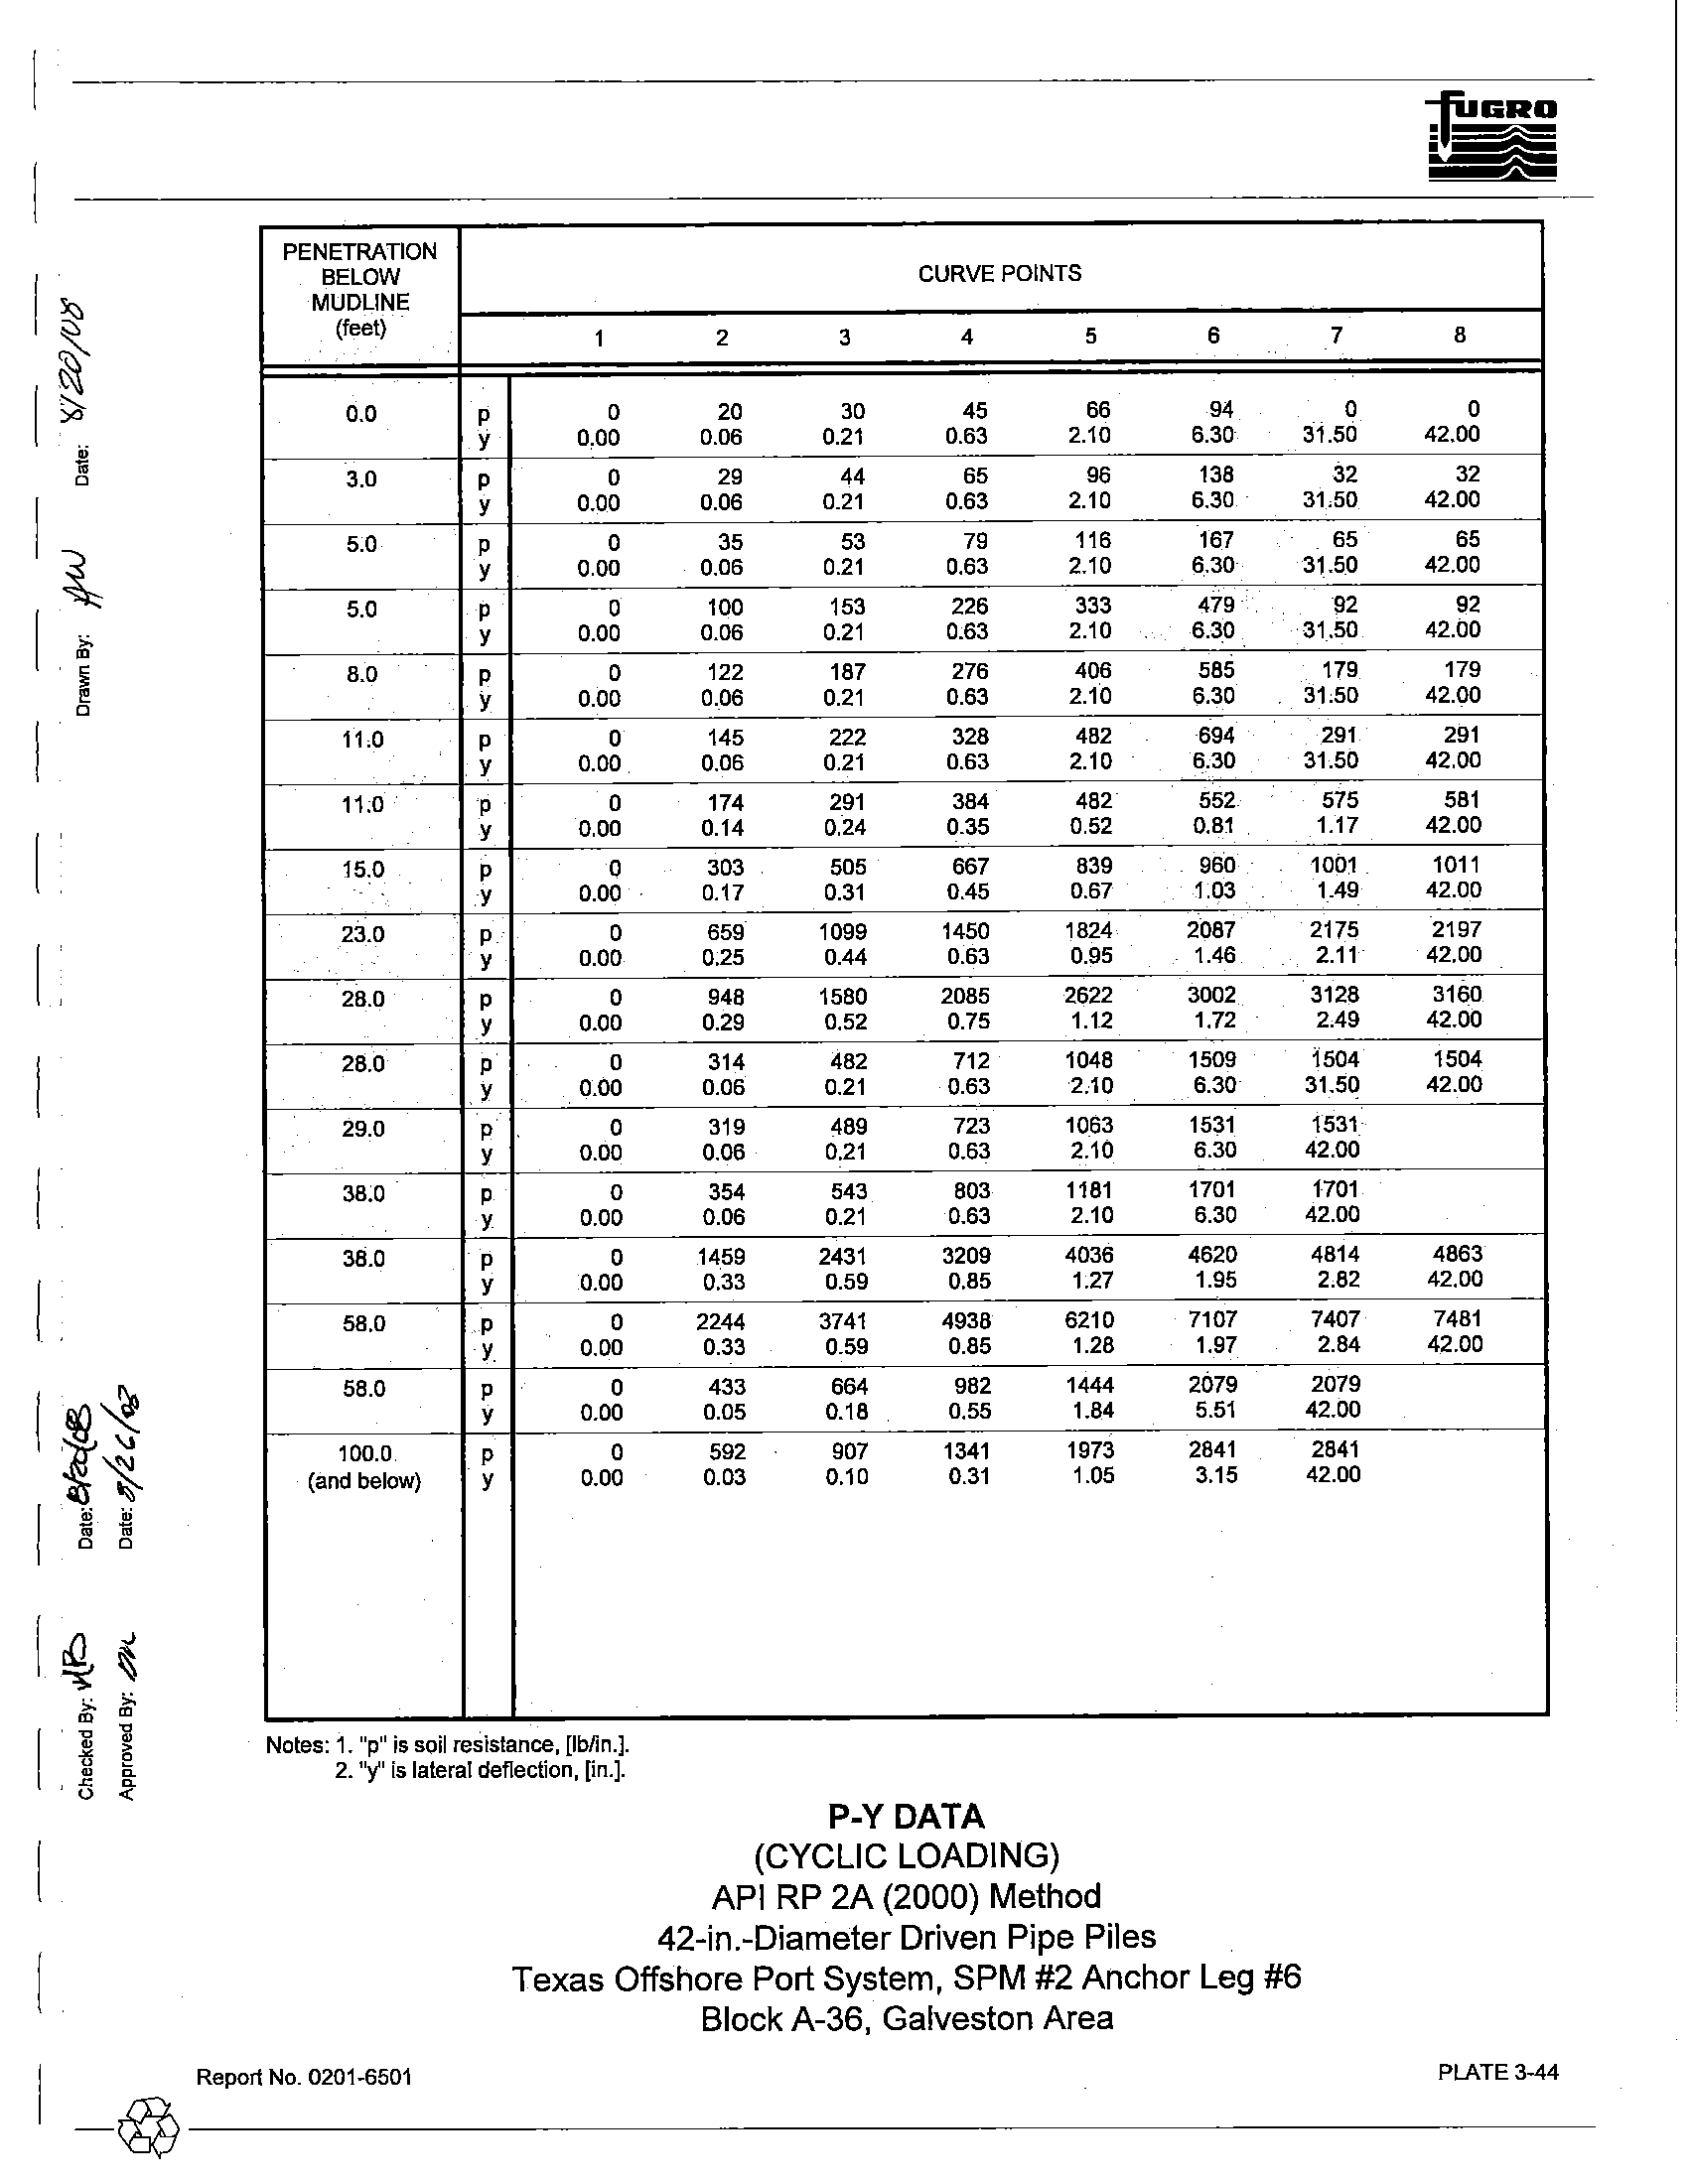
3.4.3.2 Lateral Pile Design Data
The soil resistance-pile deflection (p-y) characteristics
of the soils at the boring location were
developed for individual 42-in.-diameter driven pipe piles. These data may be used
in lateral load analyses
of driven piles, conductors and caissons.
The p-y data for cyclic loading were developed to 100-ft
penetration using procedures that have been outlined
in API RP 2A and briefly explained in Appendix B.
The stratigraphy and parameters used to develop the p-y data are presented on Plate 3-43. The p-y data
for 42-in.-diameter driven pipe piles are presented
on Plate 3-44. P-y values presented at 1OO-ft penetration
may be used for lateral load analyses at greater depths.
I
Report No. 0201.6501
3.11
,._@-----------
~
(
D
11-
I
l
1
~
(~:
...
x =
3,274,000«
~
Y =
275,800
It
N
~
...
X
=
3,279,000ft
Block A-36
Galveston Area
...
X
=
3,284,000ft
~
Y =
270,800
It
SPM.!2,.Anchor Leg #6'"
-
.....
Offshore
•
Terminal
/
,
~
Y =
265,800
It
I
SPM #1 PLET \
SPM
#1 Anchclr Leg
#21
\
•
I
\
1,470f!,
"
/
....
-
~
Y =
260,800
It
,.
.....
/
'e
I
\
...
I SPM #2 PLET \
\
1,47~1
"
.... _-
"
...
~
m
~
1l
---~-~------I---------~~----------------------------------------------I-----------
Ii!
15..
u
~
«
~
Projection: Texas South Central Zone Coordinates
__@
Report No.
0201-6501
PLAN OF BORINGS
Texas Offshore Port System, Offshore Terminal Location
BlockA-36, Galveston Area
PLATE
2-1
'"
,.
."
Report No. 0201-6501
,
,
,
,
,
j
,
LINe
82212
»>
'.00
;;::
'00
,
,
N
.00
~
~
,.
-<'","~UNeS22H
,
,
,
~
<i.e.<UHE
S22trJ
il
li!
,
!il:
+,
,
,
+
+
-,
+
•
SPM#2 Anchor Leg #6
,
~
,
, ,I,
::-+--+---'-------"'4------ll.....----+--..::..------t"---...c-----'----+---..::.-----
+,L.--<;i(,dINESlP:M
l"A;Sr
.. SPM#2 PLET
l
'"
~~~~_~
____!_________
~~~--------JL--_t----l.....l.....---------~,,------------l--_t------!0---------4-2~~-
~
_u~s~~»~sr
+
.. SPM#1 PLET
,
,
,
•
J
+
+
SPM#1 Anchor Leg #2 ,
,
,
I
1
'"
+
,
,
,
,
,
.•
..
,
,
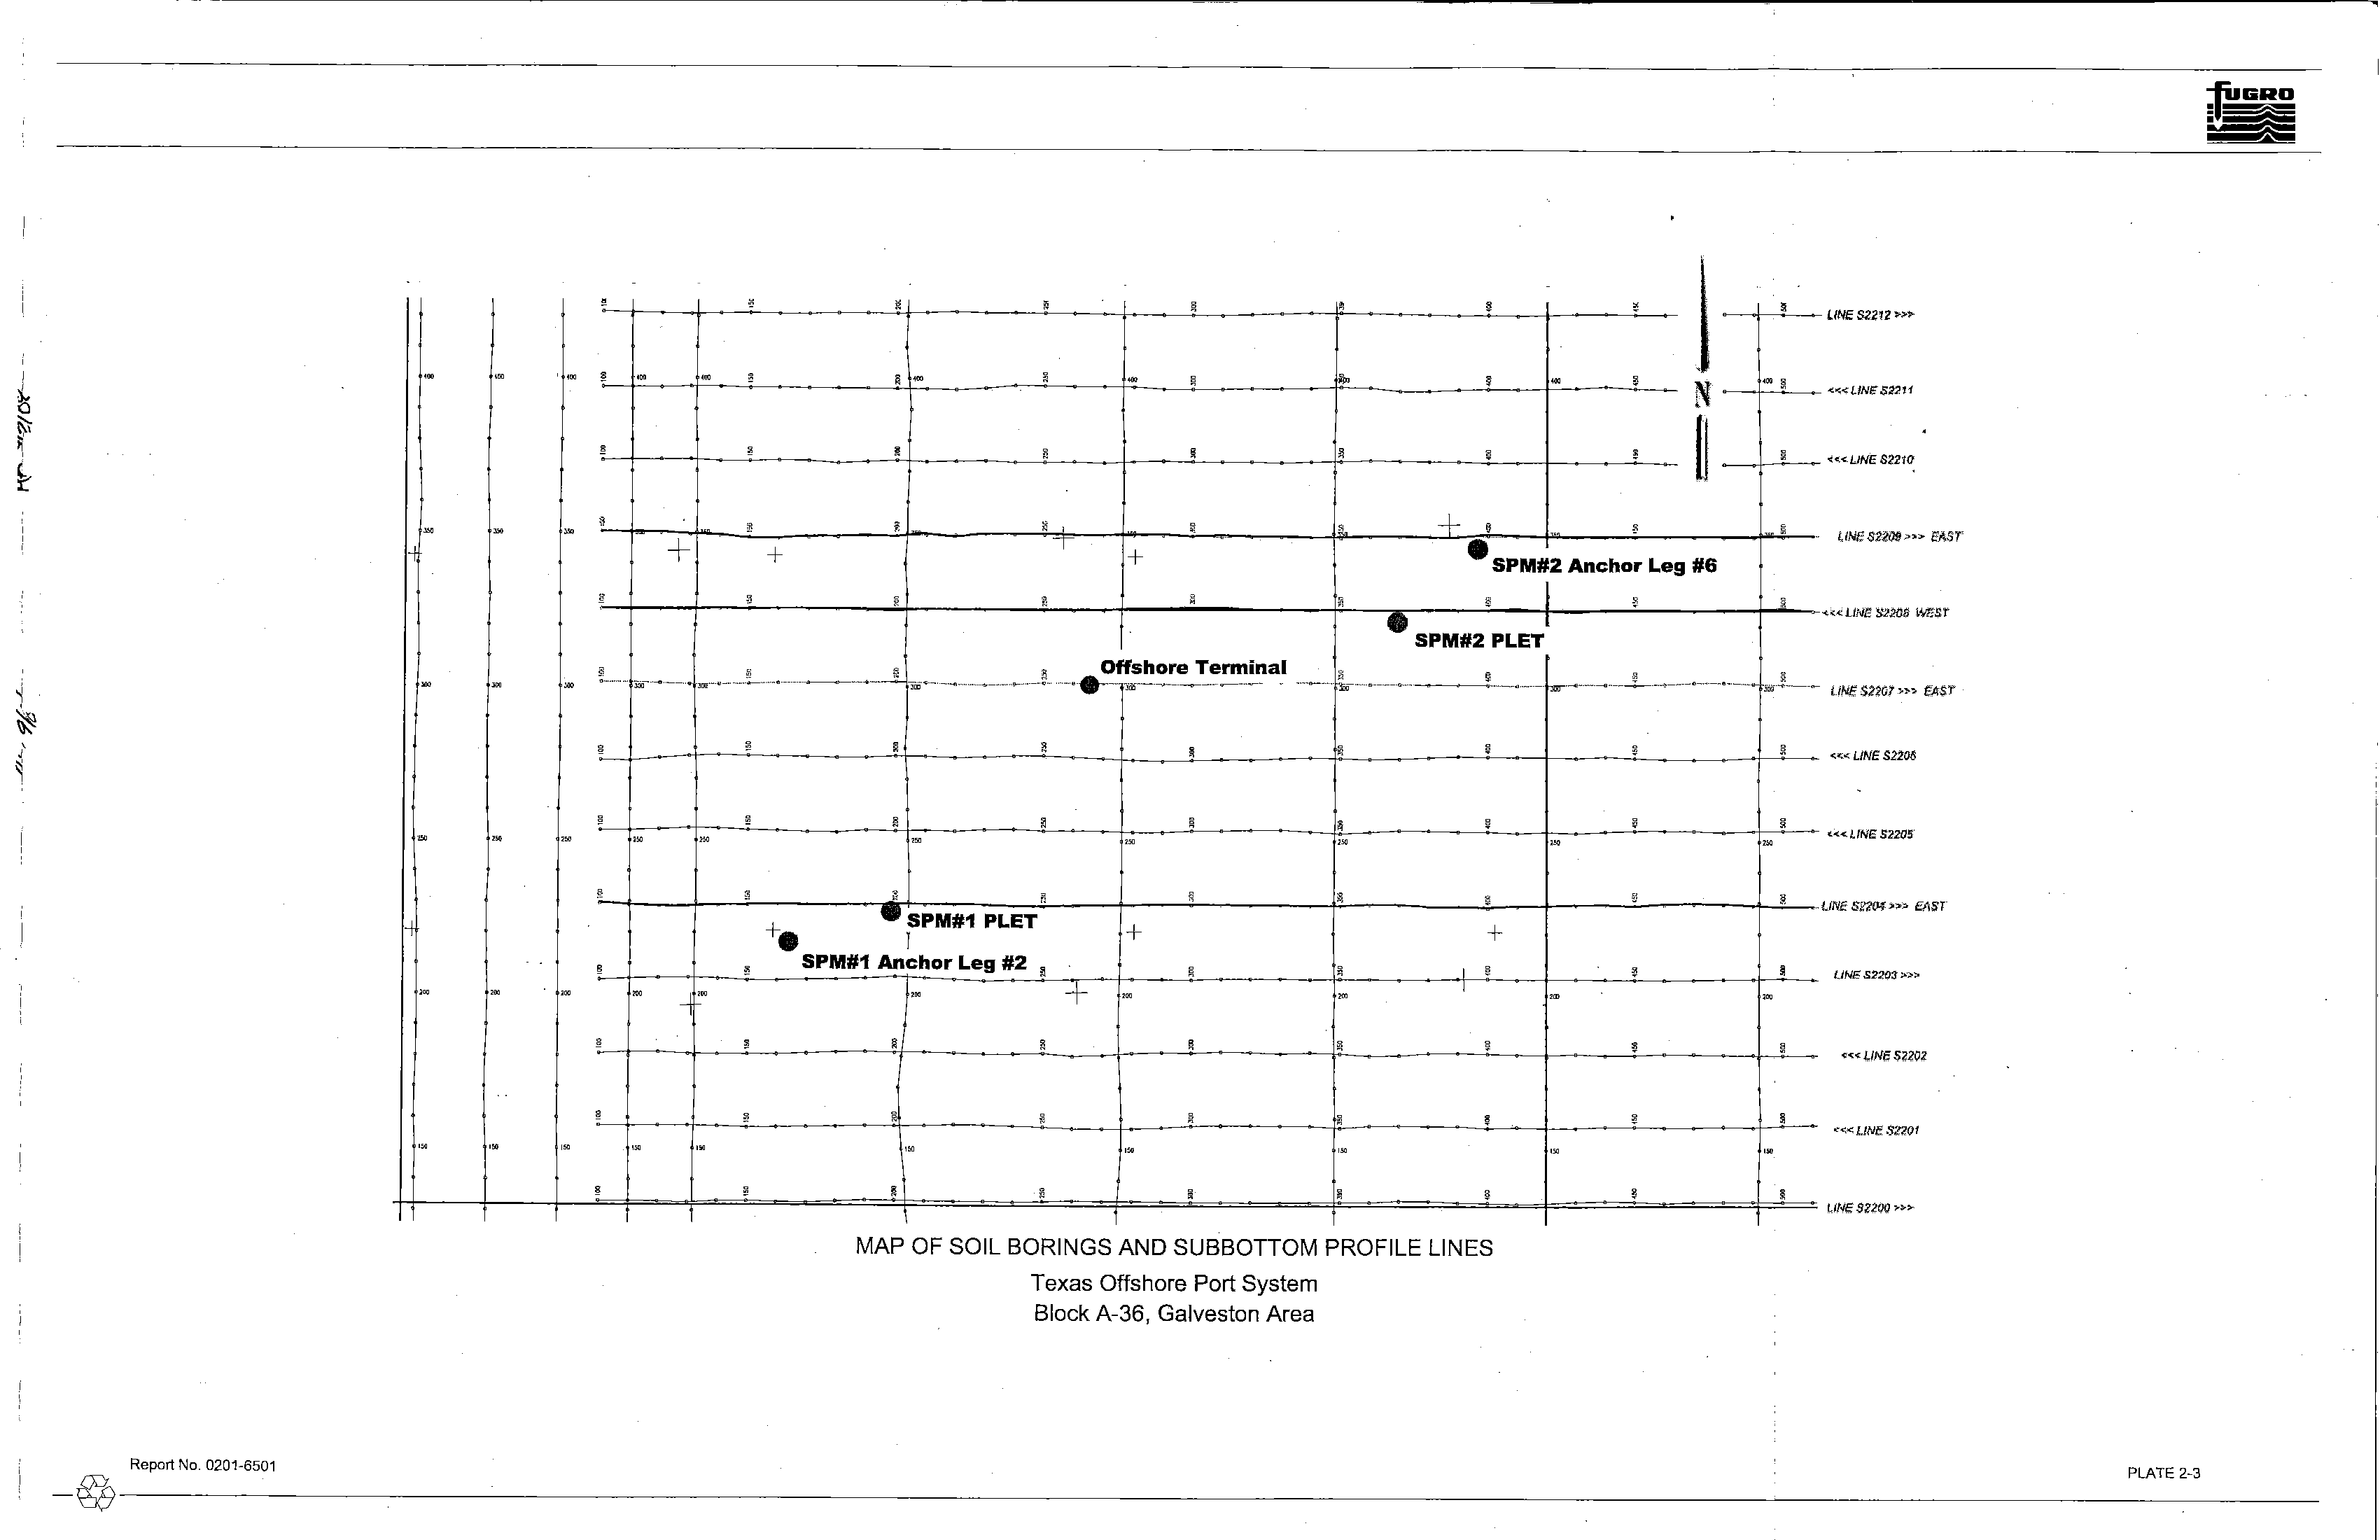
MAP OF SOIL BORINGS AND SUBBOTTOM PROFILE LINES
Texas Offshore Port System
Block A-36, Galveston Area
,
'"
,
,
....«
LINE .'5;,,'201
IJM~
$Z2Qt)
,..»
PLATE 2-3
-@-------------------------------------------------------------------------------
I
@
I
AI
~
"0
0
"
z
~
0
~
'"
in
'"
~
1if
:=.
Q)
.c-
o
0
'lij
Q)
rJ)
s:
0
Qi
ell
"
0
~
~
-
Q)
"
Q)
0..
-u
E
m
~
t
0
10
20
30
40
50
60
70
80
90
100
110
120
130
140
150
160
170
180
190
200
Checked By:
t\
~
Approved By:
&(..-
D,te,
't/r.(r;
£:,
D,te
7;;;;;
x
=
3,284,733'
y=
270,117'
BLOW
COUNT
Texas South Central Zone Coord'mates
SEAFLOOR AT EL.
~
110'
I~
~
VERY SOFT TO SOFT
OLIVE
GRAY
WOH
~
LEAN CLAY
(5.0')
WOH
f1
FIRM
OLIVE
GRAY LEAN CLAY
WOH
II
f-
..
(11.0')
PUSH
LOOSE TO MEDIUM DENSE GRAY SILT
WITH SAND TO SANDY SILT
12
...
9
I-w
Note:
See PLATE 3-34b for de1,Hed soH
I
12
stratIgraphy to 40-ft penetration.
10
(2B.D')
f-
::3111 FIRM
OLIVE
GRAY LEAN CLAY
10
IV
:-
10
(3B.D')
/'"
LOOSE TO MEDIUM DENSE
OLIVE
GRAY
15118"
f-
SILT
.with mica
-with
a trace of sand and an HzS odor below 43'
12
-with
a few
clay seams, 43' to 49'
V
-lean clay layer, with many silt pockets and seams
f-
,
at
49'
-with a few clay seams and pockets of organic
,
matter at
54'
r--
(58.0')
FIRM TO
VERY
STIFF
OLIVE
GRAY CLAY
,
f-
-with many slit pockets, partings, and seams to 75'
=
-lean to 68'
-with an
H2S odor to 60'
15
15
-
I-
PUSH
l-
•
-With silt pockets, 84' to 106'
-with mica at 85'
PUSH
I-
VI
~
-with gas blisters, 94'to 131'
PUSH
-platy, 94' to 106'
-lean and expansive, with a few light gray bands
f-
at 95'
~
-with silt seams at 105'
PUSH
f-
~
-blocky, 114' to 125'
-with a few
sm partings at 115'
PUSH
f-~
~
PUSH
c-:
~
-pl'Iy, wilh a few 'hell f""meets "
1~1~
PUSH
-
f-
f-
I
--
f-
f-
f-
SAMPLING TECHNIQUES
Number of blows of a 175-lb weight (hammer) dropped approximately 5 ft to produce a
maximum of24 in. of penetration of a 2.25-ln.-OD, 2.125-in.-ID !hin-walled tube
sampler. "PUSH" denotes a 3.00-in.-OO,
2.~-in.-ID
thin-walled tube sampler was
adVanced 24 in. with the weight of lila drill string. 'WOH" denotes a 2.50-in.-oD,
2
125-in.-ID liner sampler was advanced 24 in. with lIle wei9ht oflhe hammer.
IDENTIFICATION TESTS, [%]
20
40
60
BD
SUBMERGED UNIT WEIGHT, [kef]
0,03
0.04
0,05
0.06
+
-----
~
'El
J
+
--_e
0
0
•
•
0
•
III
~
111
•
0
•
0
+
---.--
f+
DO
•
•
0
•
0
••
•
n
•
•
0
•
n
+--.-~
+
0
..
pm
,
----
/t.----
-,0
.
~
lID
+
---
_+D
•
~
0
tt---- -
1'eD--
----
fT
-
0
-
-
CLASSIFICATION TESTS
'f' SOLUBILITY IN HCL,
[%]
•
PERCENT PASSING -200 SIEVE,
[%]
•
WATER CONTENT fYV), [%]
0
SUBMERGED UNIT WEIGHT (SUW)
PLASTIC LIMIT (PL)
LIQUID LIMIT (LL)
+----------------------+
LOG OF BORING AND TEST RESULTS
D",wn By,
lltJ
Date:
9ft?
/LJ5
UNDRAINED SHEAR STRENGTH
[ks~
0.5
1.0
1.5
2.0
~.
o
~
•
•
10
20
30
<>
•
i*'
40
I"
..
<1>
50
<1>.
60
<)
A
$
A
A<l)~
70
A
•
80
A
$ .-
A
E
90
A
~,
100
!I$
•
110
~
f>.
~
•
®
120
~
f----r-'""-
-
r--
130
140
150
160
170
180
190
STRENGTH TESTS
200
®
POCKET PENETROMETER (PPJ
$
TORVANE
(TV)
¢>
REMOTE VANE (RV)
•
MINIATURE VANE (MV) (-& RESIDUAL (MVres) VALUE)
... UNCONSOLIDATED UNDRAINED TRIAXIAL (UU)
(Open symbols Indicate remolded (r) lests)
Texas Offshore Port System, SPM #2 Anchor Leg #6
Block A-36, Galveston Area
---
I
@
;u
~
"C
0
"-
z
~
0
N
~
In
'"
~
~
~
0
5
10
'iif
~
..:
0
15
0
0=
ro
Cll
(f)
~
20
[I]
c
0
-
~
25
c
Cll
a.
Cll
30
35
40
---CheckecLa~.!:>
__
Dat.e.:....-i:U_'Zo('~~
I"'\pproVE". -'1. --;'...... '
/
,
Oat....-
.....1&
&I
X'" 3,284,733'
IDENTIFICATION TESTS,
[%]
Y=270,117'
BLOW
20
40
60
80
COUNT
Texas
South Central Zone Coordinates
SUBMERGED UNIT WEIGHT, (kef]
SEAFLOOR AT EL. -110'
0.03
0.04
0.05
0.06
J
VERY SOFT TO SOFT OLIVE GRAY LEAN
WOH
IQ
C
CLAY
+
----~
I
-With many sand pockets
-
0:
1
-with shell fragments and a few wood fragments
to 2'
~
WOH
-with a few shell fragments below 3'
.
]
FIRM OLIVE GRAY LEAN CLAY
-with many silt pockets
WOH
0
-with a few slit seams at
6'
+
r--_e
0
"
-with shell fragments and a few sand seams
f--
below 10'
PUSH
-
...
(11.0')
LOOSE
TO MEDIUM DENSE GRAY SILT
...
WITH SAND TO SANDY SILT
...
-with a few clay pockets and shell fragments to 20'
12
r-- ....
•
•
0
s
...
•
III
...
-with mica and a few sandstones at 1B'
12
r!"
•
III
I
,_
-with
many clay pockets
al23'
10
0
f--
•
•
r---
•
FIRM OLIVE GRAY LEAN CLAY
(28.0')
10
0
f--
~
- ..
IV
•
-with a few partings of organic matter at 33'
10
+---.-
f+
DO
f--
I-
(38.0')
V
~
LOOSE TO MEDIUM DENSE OLIVE
15118"
GRAY SILT
•
•
0
SAMPLING TECHNIQUES
CLASSIFICATION TESTS
Number of blows of a 175-1b weight (hammer) dropped approximately 5 ft
to
produce a
"1'-
SOLUBILITY IN HeL.
[%]
maximum of24in. ofpenetration ofa 2.25-il.-OD, 2.125-in.-ID th'n-walledllJba
•
PERCENT PASSING -200 SIEVE,
[%]
sampler. "PUSH" denotes a 3.00-in.-OD. 2.83-in.-ID thin..walled tube samplerwas
•
WATER CONTENT
fY'I), !%]
adVanced 24 In. with the weight
of
the dnll string. 'WOH" denotes a 2.50-In.-OD,
o
SUBMERGED UNIT WEIGHT (SUW')
2.125-in.-ID liner samp1erwas advanced 24 in. with the weight of the hammer.
PLASTIC LIMIT (PL)
LIQUID LIMIT (lL)
+----------------------+
LOG OF BORING AND TESTRESULTS
Texas Offshore Port System; SPM #2 Anchor Leg #6
Block A-36, Galveston Area
J1r:awtll::ly:
"-'-'U-
"1"4
'}J'
.J...JJ~
UNDRAINED SHEAR STRENGTH
Iksn
0.2
0.'
0.6
0.•
o
~
..
•
5
~
~
~
(1.26
10.0)~
10
"'"
Cll
~
15
..:
0
0
m
(f)
20
~
Cll
[I]
c
.Q
-
25
~
c
a.
Cll
•
•
,33.5) ...
J
(1.0
30
<>
$
•
35
I
.
STRENGTH TESTS
40
®
POCKET PENETROMETER (PP)
•
TORVANE(TV)
I
o
REMOTE VANE (RV)
•
MINIATURE VANE (MV)
(<$-
RESIDUAl (MVres) VALUE)
i
... UNCONSOLIDATED UNDRAINED TRIAXIAL (UU)
,
(Open symbols Indicate remolded
(Tl
tests)
~.
~
•
~
I
~
w
i
<:::.
,
0
I
~
--
"
Report No. 0201-6501
w
e\.M$iFlCAVONTESrs
•
&OU15ILITY IIHiI1.I"'j
•
rER~t:?Al.1SiNG-lMSiEVEr.r.J
ti
~S~:;;'~~i(5'.\\,l
+----------------------+
f'USm; Lf!.llT l!'tl
OQiJlO l!Mil'!U-J
125 METERS
410 FT
STREN(lIHTESTS
II POC!!ET
Pi;NH~TE!!
(!>T'j
+
iCiWMlE (1Yj
4>
R£Mmf 'o'M-"E{RW
•
Ml!ilA.l\1R~",,IM;(lAVj
j-e-
AE$lO\!AL(~lllAl.I.'5\
.Ii. UNCCW$OlJDAT=c LmOAAItf!:':[t -rw.uIJ.L
\1EUj
-.
~
_.
-
-.
-
lHlIWlED 5f£AR STRENIml
..
-
•
I~=~:~I
•
DO
~M
......hDo!OQIn ..H,a.boINu
a
•
....,._dot'_4J'b"
......
-,.
Wy
fto..,
,IIIIl~
....
IIId~oIOIJIItIo
..f"'IHn_
a
•
"fIIIn.f..jI:dotI,pdwo,lIIIi.....hll'
....
..... O'lH,! ..bllT
~
~"""'M'bll:e'
..........185'
'''''III!101n.84'bll!'
?iJ:a4'bHlll'
~
...
,.
.,r.....
,'dl1.iIwltt1lP1bni1
....., ..-..,!1f
-
&i)',l1nll5'
....,.""..
pri-gI.I'~
~
•
a
"
-
GEOPHYSICAL AND GEOTECHNICAL INTEGRATION
Texas Offshore Port System, SPM
#2 Anchor Leg
#6
Block A36, Galveston Area
E
Line 2207
PLATE 3-35
-@----------------------------------------------------------------------
(
Il
(
~~
-!~
~
a;
...
CD
..
"
..
"
.~
'"
~
'"
>.
'"
~
~
II
~
•
u
~
~
~
0
«
1if
~
..:
0
0
<;::::
!l!
Q)
en
:=
0
Q)
ra
c
0
:;:::;
...
!l!
....
Q)
c
Q)
0..
Shear Strength Profile, [ksf]
o
0.0
I
0.5
1.0
1.5
2.0
2.5
20
40
60
80
100
120
140
I
--
--_.-
r----- ---
r----.-
r-
--
---'-
r----
o-
---
"
~=7n°
,-
h~'
N.
~Rn
f.
~
1 n kof
no
- In kof
III
'----0-
""-I
--_.-
r----
o-
---
IV
,..--'- __0-
,...--
---.-
r-----
---
$
=
20',
B
=
5", N
q
;;;
B.O, f
max
=100
ksf, qmax
=
o
ksf
V
___0-
,...---
1-,-0--.-
r-----
---
VI
I
Note: Roman numerals refer to the stratigraphy as
described in the text and on the boring log.
I
,...-----
------------
--~--
-----
DESIGN STRENGTH PARAMETERS
Texas Offshore Port System, SPM #2 Anchor Leg #6
Block A-36, Galveston Area
[
_~_R_e_po_rt_N_O_.O_20_1_-6_50_1
______________________________________________________
P_~_T_E_3-_36
____
I
I~
I~
o
II
[.15:
~
"
>.
[
i
i
5
~
Submerged Unit Weight, [kcf]
o
0.00
0.02
0.04
0.06
0.08
_I ._
0.10
1if
~
..:
o
20
40
..
...
;;::::
en
Q)
ro
60
~
Q)
10
.
a
80
~
a;
c
Q)
0...
100
120
140
I
r---.-
;----
-_.-.
_.-
---
__. I
II
)---_.-
f----
-.~
--_
..
.
'"
1-----_.-
----
--
_.-
---
IV
I----
--
-
.-
_I
Nole:
-Roman
numerals refer to the stratigraphy as
I
described in the text and on the boring log.
V
I----
.-
-
.-
VI
\
------
---------1
--_\_-
------ -----
.
DESIGN SUBMERGED UNIT WEIGHT
Texas Offshore Port System, SPM #2 Anchor Leg #6
Block A-36, Galveston Area
[ __
~_R_e_po_rt_N_O._02_0_1-_65_0_1
___________________________________________________
P~
__
TE_3_-3_7___
I
I
I~
(~
0
~
I~
(
~
c
0
~
I
:;::;'
Cll
~
....:-
0
0
'iii
Cll
(J)
;;:
0
"iii
al
c
(
0
~
-
....
Cll
(
c
Cll
0..
(~~
.~~
~
"'I
[
I
•
;;
•
;;
0
0
.~ ~
;.;
;.;
'"
'"
u
:l!
•
>
0
[
•
u
~
«
~
Unit Skin Friction, [ksf]
00
05
o
\
---
1 0
1 5
20
25
20
40
60
80
..
100
120
140
1----
-----
f-----
I
\
1--._.-- ---'-
\
--
1----
-----
~_\
--_.-
------'-
\--
---'-
-,-
--
f-
.-
,---
--
~
.-
f-
--
~
Notes:
\
1. Roman numerals-refer to the stratigraphy as
\
described in the text and on the boring log.
2,
Tension and compression curves coincide.
------------------
-_\_--
UNIT SKIN FRICTION
API RP 2A (2000) Method
I
---
II
---
...
-----
IV
V
VI
------
Texas Offshore Port System, SPM #2 Anchor Leg #6
Block A-36, Galveston Area
(
Report No. 0201-6501
PLATE 3-38
-~--------------------------------
"'"
Q)
.l!!
~
..:
0
0
<;::
(\)
en
Q)
~
Q)
m
c
0
""
-
~
Q)
c
a.
Q)
.<>:)
.~"t
~~
fjr"
~
M
•
Cl
Cl
.~
~
m
'"
m
'"
~
•
~
•
e
>
•
u
~
~
~
()
'"
Unit End Bearing, [ksf]
o
o
I
10
20
30
40
50
20
40
60
80
100
120
140
I
------------e-----
--.----.
-\--.; ----
II
---
--_.-
i-----
---
,'"
'\
,,'
",
:-,.
!42-i}
--
---.-'------
-----
IV
I--
\
.-
-
--
--
"-~
~
"-
V
I--
-
-
--
Note's:
1. Roman numerals refer to the stratigraphy as
descnbed in the text and on the boring log.
2. Dash,ed Hne represents equivalent unit end
bearing av_ailable from frictional resistance
of soil plug inside the indicated pile Size.
3. End bearing component. is neglected for
caissons and conductors.
VI
-------
__ 1 __
------
------
-----.
UNIT END BEARING
API RP
2A (2000) Method
Texas Offshore Port System, SPM #2 Anchor Leg #6
Block A-36 , Galveston Area
PLATE 3-39
I
Report No_ 0201-6501
-@--------------------------------
Il
1
I.
jl~
o
~
~~
;;
•
~
"
"
~
)
;;
\
>.
"'
"'
~
•
~
•
~
~
•
0
~
~
~
()
«
I
~
Q)
~
....
0
-
0
Ii=
co
Q)
(J)
s:
0
Q)
m
c
0
15
a;
....
c
Q)
0-
Ultimate Axial Capacity, [kips]
o
o
400
800
1200
1600
2000
20
40
60
80
100
120
140
~-
.. -.-
~--.-
\
\
\
\
\
IT.
-.-.-
\
f--
- ..
-
\.
'\
\
\.
\
i-'---i-
\
,
\
.
---~...,...-
.
I
~---
--_.---_.-
---
II
;-----
----
--_.-
---
'"
.
----
--_.-
--_.-
---
IV
----
--_.-
--_.-
---
V
~.---
--_.-
f---.-
---
Note: Roman numerals refer to the stratigraphy as
described in the text and on the boring log.
--
Compression for piles
--
Tension for plies, or tension and compression
for caissons and conductors
"\
'\
,
~
VI
,
,,~
"
~
"'
------
~-----
,,~-
------
ULTIMATE AXIAL CAPACITY
API RP 2A (2000) Method
42cin.-Diameter Driven Pipe Piles
Texas Offshore Port System, SPM #2 Anchor Leg #6
Block A-36, Galveston Area
I __
~
__
Re_p_ort_N_O_.O_20_1_-6_50_1___________________________________________________
P_~_T_E_3~_O
___
.!i
0
•
m
"
c
0
~
~
~
0
.!i
•
m
"
I,~
(
~
0
.I
~
>.
m
~
PENETRATION
BELOW
CURVE POINTS
MUDLINE
(feel)
1
2
3
4
5
0.0
I
0.00
0.00
0.00
0.00
0.00
z
0.00
0.07
0.13
. 0.24
0.34
1.0
I
0.00
0.02
0.03
0.04
0.05
z
0.00
0.07
0.13
0.24
0.34
3.0
I
0.00
0.02
0.04
0.06
0.Q7
z
0.00
0.Q7
0.13
0.24
0.34
5.0
I
0.00
0.03
0.05
0.07
0.09
z
0.00
0.07
0.13
0.24
0.34
5.0
I
0.00
0.07
0.11
0.17
0.20
.
z
0.00
0.Q7
0.13
0.24
0.34
11.0
t
0.00
0.09
0.15
0.22
0.27
z
0.00
0.07
0.13
0.24
0.34
11.0
I
0.00
0.12
0.12
z
0.00
0.10
42.00
28.0
~.
0.00
0.34
0.34
z
0.00
0.10
42.00
28.0
I
0.00
0.17
0.28
0.42
0.51
z
0.00
0.07
0.13
0.24
0.34
38.0
I
0.00
0.21
0.35
0.52
0.63
z
0.00
0.07
0.13
0.24
0.34
38.0
I
0.00
0.46
0.46
z
0.00
0.10
42.00
.
58.0
I
0.00
0.71
0.71
z
0.00
0.10
42.00
58.0
I
0.00
0.29
0.48
0.72
0.86
z
0.00
0.07
0.13
0.24
0.34
.. 115.0
I
0.00
0.48
0.80
1.20
1.44
z
0.00
0.07
0.13
0.24
0.34
131.0
I
0.00
0.53
0.89
1.33
1.60
z
0.00
0.07
0:13
0.24
0.34
Notes: 1. "t" is mobilized soil.pile adhesion, [ksf].
2. "z" is axial pile displacement, [in.].
3. Data for tension and compression coincide.
AXIAL LOAD TRANSFER DATA
(T-Z DATA)
API RP
2A (2000) Method
42-in.-Diameter Driven Pipe Piles
6
0.00
0.42
0.06
0.42
0.07
0.42
0.09
0.42
0.22
0.42
0.30
0.42
0.56
0.42
0.70
0.42
0.95
0.42
1.60
0.42
1.77
0.42
Texas Offshore Port System, SPM #2 Anchor Leg #6
Block A-36, Galveston Area
7
8
0.00
0.00
0.84
42.00
0.05
0.05
0.84
42.00
0.Q7
0.07
0.84
42.00
0.09
0.09
0.84
42.00
0.20
0.20
0.84
42.00
0.27
0.27
0.84
42,00
0.51
0.51
0.84
42.00
0.63
0.63
0.84
42.00
0.86
0.86
0.84
42.00
1.44
1.44
0.84
42.00
1.60
1.60
0.84
42.00
.
I
Report No.
0201-6501
PLATE 3-41
-~---------------------------------
0
~
>.
'"
~
I~
I
0
I
"-t>
"
0
"
~
'"
0
"
~
>.
>.
'"
'"
~
PENETRATION
BELOW
CURVE POINTS
MUDLINE
(feet)
1
2
3
4
5
6
58.0
Q
0
24
48
71
86
95
z
0.00
0.08
0.55
1.76
3.07
4.20
131.0
Q
0
39
78
117
140
156
z
0.00
0.08
0.55
1.76
3.07
4.20
Notes: 1.
"Q"
is mobilized end bearing capacity, [kips].
2.
liZ"
is axial tip displacement [in.].
AXIAL LOAD TRANSFER DATA
(Q-Z DATA)
API RP 2A (2000) Method
42-in.-Diameter Driven Pipe Piles
Texas Offshore Port System, SPM #2 Anchor Leg #6
Block A-36, Galveston Area
7
95
42.00
156
42.00
I
Report No. 0201-6501
PLATE 3-42
-~---------------------------------
~
~
--
ii
c
~
c
~
•
.iii
c
•
l!i
c
•
seafloor~
r
Penetration
0
Very soft to soft lean clay
eso = 2.0 %
5'
Firm lean clay
eso = 2.0 %
t
11'
Loose to medium dense
k=10pci
silt with sand to sandy silt
t
28'
"mr'"
Eso = 2.0 %
38'
Loose to medium dense silt
k=10pci
58' ---------
Report No.
0201-6501
Firm to very stiff clay
ESO
=
1.75
% at
58'
decreasing linearly to
e50
= 1.0 % at 100'
100' -
-
-
-
-
-
-
-
-
Notes:
1.
1::50
is axial strain at half of peak deviator stress for cohesive soils.
2. Soil strength parameters are shown on Plate 3-36.
3. Submerged unit weight profile is shown on Plate 3-37.
4. k is the modulus of horizontal subgrade reaction for granular soils.
STRATIGRAPHY AND PARAMETERS FOR P-Y DATA
Texas Offshore Port System, SPM #2 Leg Anchor #6
Block A-36, Galveston Area
PLATE 3-43
I_@______________________
0;
"
0
~
~
I~
I
0
0
2
•
if
I
>.
"'
~
"
'k
~
,.
0;
0
.J
~
>.
"'
~
PENETRATION
BELOW
MUDLINE
(feet)
1
0.0
P
0
y
0.00
3.0
P
0
Y
0.00
5.0
P
0
Y
0.00
5.0
P
0
Y
0.00
8.0
P
0
Y
0.00
11.0
P
0
Y
0.00
11;0 .
p
0
Y
0.00
15.0
P
0
Y
0.00
23.0
P
0
Y
0.00
28.0
P
0
Y
0.00
28.0
P
0
Y
0.00
29.0
P
0
Y
0.00
38.0
P
0
Y
0.00
38.0
P
0
Y
0.00
58.0
P
0
Y
0.00
58.0
P
0
Y
0.00
100.0
P
0
(and below)
y
0.00
Notes: 1. lip" is soil resistance, [Iblin.].
2.
"'I'
is lateral deflection, [in.].
CURVE POINTS
2
3
4
5
20
30
45
66
0.06
0.21
0.63
2.10
29
44
65
96
0.06
0.21
0.63
2.10
35
53
79
116
0.06
0.21
0.63
2.10
100
153
226
333
0.06
0.21
0.63
2.10
122
187
276
406
0.06
0.21
0.63
2.10
145
222
328
482
0.06
0.21
0.63
2.10
174
291
384
482
0.14
0.24
0.35
0.52
303
505
667
839
0.17
0.31
0.45
0.67
659
1099
1450
1824
0.25
0.44
0.63
0.95
948
1580
2085
2622
0.29
0.52
0.75
1.12
314
482
712
1048
0.06
0.21
0.63
2,10
319
489
723
1063
0.06
0.21
0.63
2.10
354
543
803
1181
0.06
0.21
0.63
2.10
1459
2431
3209
4036
0.33
0.59
0.85
1.27
2244
3741
4938
6210
0.33
0.59
0.85
1.28
433
664
982
1444
0.05
0.18
0.55
1.84
592
907
1341
1973
0.03
0.10
0.31
1.05
P-Y DATA
(CYCLIC LOADING)
API RP
2A (2000) Method
42-in.-Diameter Driven Pipe Piles
6
94
6.30
138
6.30
167
6.30
479
6.3.0
585
6.30
694
6.30
552
0.81
960
1.03
2087
1.46
3002
1.72
1509
6.30
1531
6.30
1701
6.30
4620
1.95
7107
1.97
2679
5.51
2841
3.15
Texas Offshore Port System, SPM #2 Anchor Leg #6
Block A-36, Galveston Area
7
8
0
0
31.50
42.00
32
32
3UO
42.00
65
65
31.50
42.00
92
92
31.50
42.00
179
179
31,50
42.00
291
291
31.50
42.00
575
581
1.17
42.00
1001
1011
lA9
42.00
2175
2197
2.11
42.00
3128
3160
2.49
42.00
1504
1504
31.50
42.00
1531
42.00
1701
42.00
4814
4863
2.82
42.00
7407
7481
2.84
42.00
2079
42.00
2841
42.00
I ___
~_R_e_po_rt_N_O_._02_0_1_-6_5_01
______________________________________________________________
P_LA_T_E_3_4_4___
I
@
I
il'
"C
a
"
Z
P
o
'"
~
.;,
~
'"
."
:;-
~
'"
Checked
By:
-.l
13
Date
:
'i'/e
l
oe.
Drawn
8y:-r;,flt~1
Date:
1
0
/
c~
"
•
A'~
/'~f-
"-
I
J
o
b
No.:
0201-65014
02-Sep.2008
(Ver.
#6)
Summary of Test Results
Bo
r
ing: Texas Offshore Port System, SPM #2 Anchor Leg
#6
Bl
ock: A.36
Area: Galveston
Identificat
i
on Tests
S
trength Esti
m
ate
Miniature
V
ane Tests
Compression Tests
Passing
(ksf)
(ksf)
Uquid
Plasllc
MoistvAI
Submerged
No
.
ZOO
Mo!sture
Confining
Undisturbed
Remolded
&~
SubmeJ11ed
F
a
ill"".
Sample
Depth
Uquidity
Umit
Umit
Cont.nt
Unit Weight
Sie""
Type
Content
PressuAI
Stre
n
gth
St...nglh
Str.lln
Unit Weight
Str
a
In
Type
01
N
••
I'J
Index
I%)
I%)
[%J
Io<f)
[%J
Penetrometer
T
orvane
Undisturbed
Remolded
Ruidual
Tu,
[%J
(psi)
Iw)
Iw)
[%J
""l
[%
J
Failu
re
1
0
,
50
46
2
1
.
00
46
3
1
.
50
49
0.
1
4
4
2.00
1.09
40
15
42
4
2
.
00
41
0.05
4
2
.
00
44
0.12
0.05
•
3
,
00
49
6
3
.
50
48
0.27
7
5
,
00
0
.
06
7
5
.
00
1.06
38
14
39
7
5
.
00
46
0.32
•
6
,
50
45
0.61
9
7
.
30
35
54
0.41
0
.
1
3
J
9
7
.
30
.93
35
16
34
I
10
10
,
00
0.17
I
10
10
.
00
1.00
1.00
1.26
UU
35
121
0
.
61
2.1
51
16
A
J
11
10
.
50
12
1
1
.
00
.65
47
15
36
,
13
14
.
00
26
62
52
14
17.00
28
55
69
1
.
19.50
27
58
74
16
24.00
55
N
O
T
ES
:
TYPE OF
TE
S
T
TYPE OF FA
IL
UR
E
P
l
us Signs [+] denote tests
which
exceeded the
U
- Unco
n
fined Compression
A
.
Bulge
capacity of the measur
i
ng device.
UU- Unconsolidated-Undrained
T
riaxial
B
- Single Shear Plane
C
U
- Conso
l
idate
d
-
U
ndrained
T
riaxial
C
- Multiple Shear Plane
NP = Non Plastic Material
0- Vertical
F
racture
I
@
1
6'
"8
"-
z
?
Z
a,
~
~
.,
"
~
0>
'"
Checked By:
vt~
Approved By:-o»t.
Summary of Test Results
Date7/2/<>J!,
Date:
90;';;'
-
Drawn By:
'
rr:~"~
1
Date:
qI2/0",(
Jo
b
No.:
0201-6501-4
02-Sep-2008
(Ver
.
#6)
Boring: Texas Offshore Port System
,
SPM #2
Anchor
L
eg
#6
Block: A-36
A
rea: Galveston
Identification
T
ests
Strength Estimate
Miniature
Vane Tests
Compression Tests
Passing
(ksf)
(ksf)
Uquid
Plutlc
Moisture
Subm.rg~d
No. 2.00
Moisture
Confining
UndLsturt>ed
Remolded
E.
SlIlImuged
F.lIilure
Sample
Oepth
Uquldity
Limit
Urnl!
Content
UnitWeillht
Sieve
Type
Content
Pressur1l
Strength
Stnmlilth
Strain
Unit Welllht
SUain
Type of
No.
("
Index
(%'
(%
'
("
,,,0
(
%
J
Penetrometer
Torv
enl
Undisturbed
Remolded
Resldull
Ttst
{'!oj
(psi)
'''0
'''0
,%,
(pet]
)%'
Faliu
re
17
24.50
31
84
117
28
.
50
1.00
18
29
.00
57
1.
29.50
28
0.47
1.
29.50
1
.
00
29
18
29
20
33.50
35
53
0
.
50
UU
32
120
1.03
5
.6
56
20
AB
21
34.00
.
61
43
17
33
0.71
21
34
.
00
0.17
22
39
.
00
28
55
48
23
44
.5
0
31
56
89
24
49
.00
93
25
49,50
0.10
25
49
.5
0
57
1
.
12
UU
29
121
0.75
3.5
57
21
A
26
50
.
00
.49
43
16
29
1
.
67
27
55
.00
33
53
88
28
59.00
1.00
2'
59
.50
54
0
.
72
30
60
.
00
.43
42
16
27
30
60
.00
38
0.82
31
64.00
0.35
31
64.00
48
UU
37
120
0
.
65
1.8
48
19
A
32
64
.
50
1
.
1
6
NOTE
S
:
TY
P
E OF
TEST
TYP
E
OF FAILURE
Plus Sig
n
s [+J denote tests wh
ic
h
exceeded the
U
- Unconfined Compression
A - Bulge
capacity of the measuring device
.
UU-
Unco
n
solidated-Undrained Triaxial
B - Si
n
gle S
h
ear Plane
CU
-
Consolidated-Undrained
Triaxial
C -
Multiple Shear Plane
NP = Non
Plastic
Material
0
-
Vertical
Fracture
i
i
I
I
@
;0
ro
'C
~
Z
?
0,
~
~
'1l
~
l'
g'
Checked By
:
J/ e,
Approved By:
P'''L
Summary of Test Results
Date:Woe
Date: .,
;i;6J'
Drawn By:
-rr:.,,,.1
Date:
q
(
:<
/
0
S
J
ob No.:
0201
-
6501-4
02-Sep-2008
(Ver
.
#6)
Boring: Texas Offshore Port System
,
SPM
#2 Anchor Leg
#6
Block
:
A-36
Area:
Ga
l
veston
Identification Tests
S
trength Estimate
Miniature Vane Tests
Comp
r
ession
Tests
Pu,ing
(ksf)
(ksf)
Uqu;d
PI:astle
Moistu
..
Submerged
No. 200
Moisture
Confining
Und
i
sturbed
Remolded
6.
Subrnertred
Fallul'1l
Sample
Depth
Uquldity
Limit
Umit
Content
UnltWlill1lt
Sieve
,.,,,
Content
Pressure
Sttf:ngth
Strength
Strain
UnilWelght
Strlln
Type
of
".
Iftl
h'ldU;
I%(
1%1
1%1
led)
1%)
Penetromele.r
TaNane
Undisturbed
Remolded
RasidWlI
T.~
1%)
(psi)
''"'
",,'
1%)
(pc")
('M
Failure
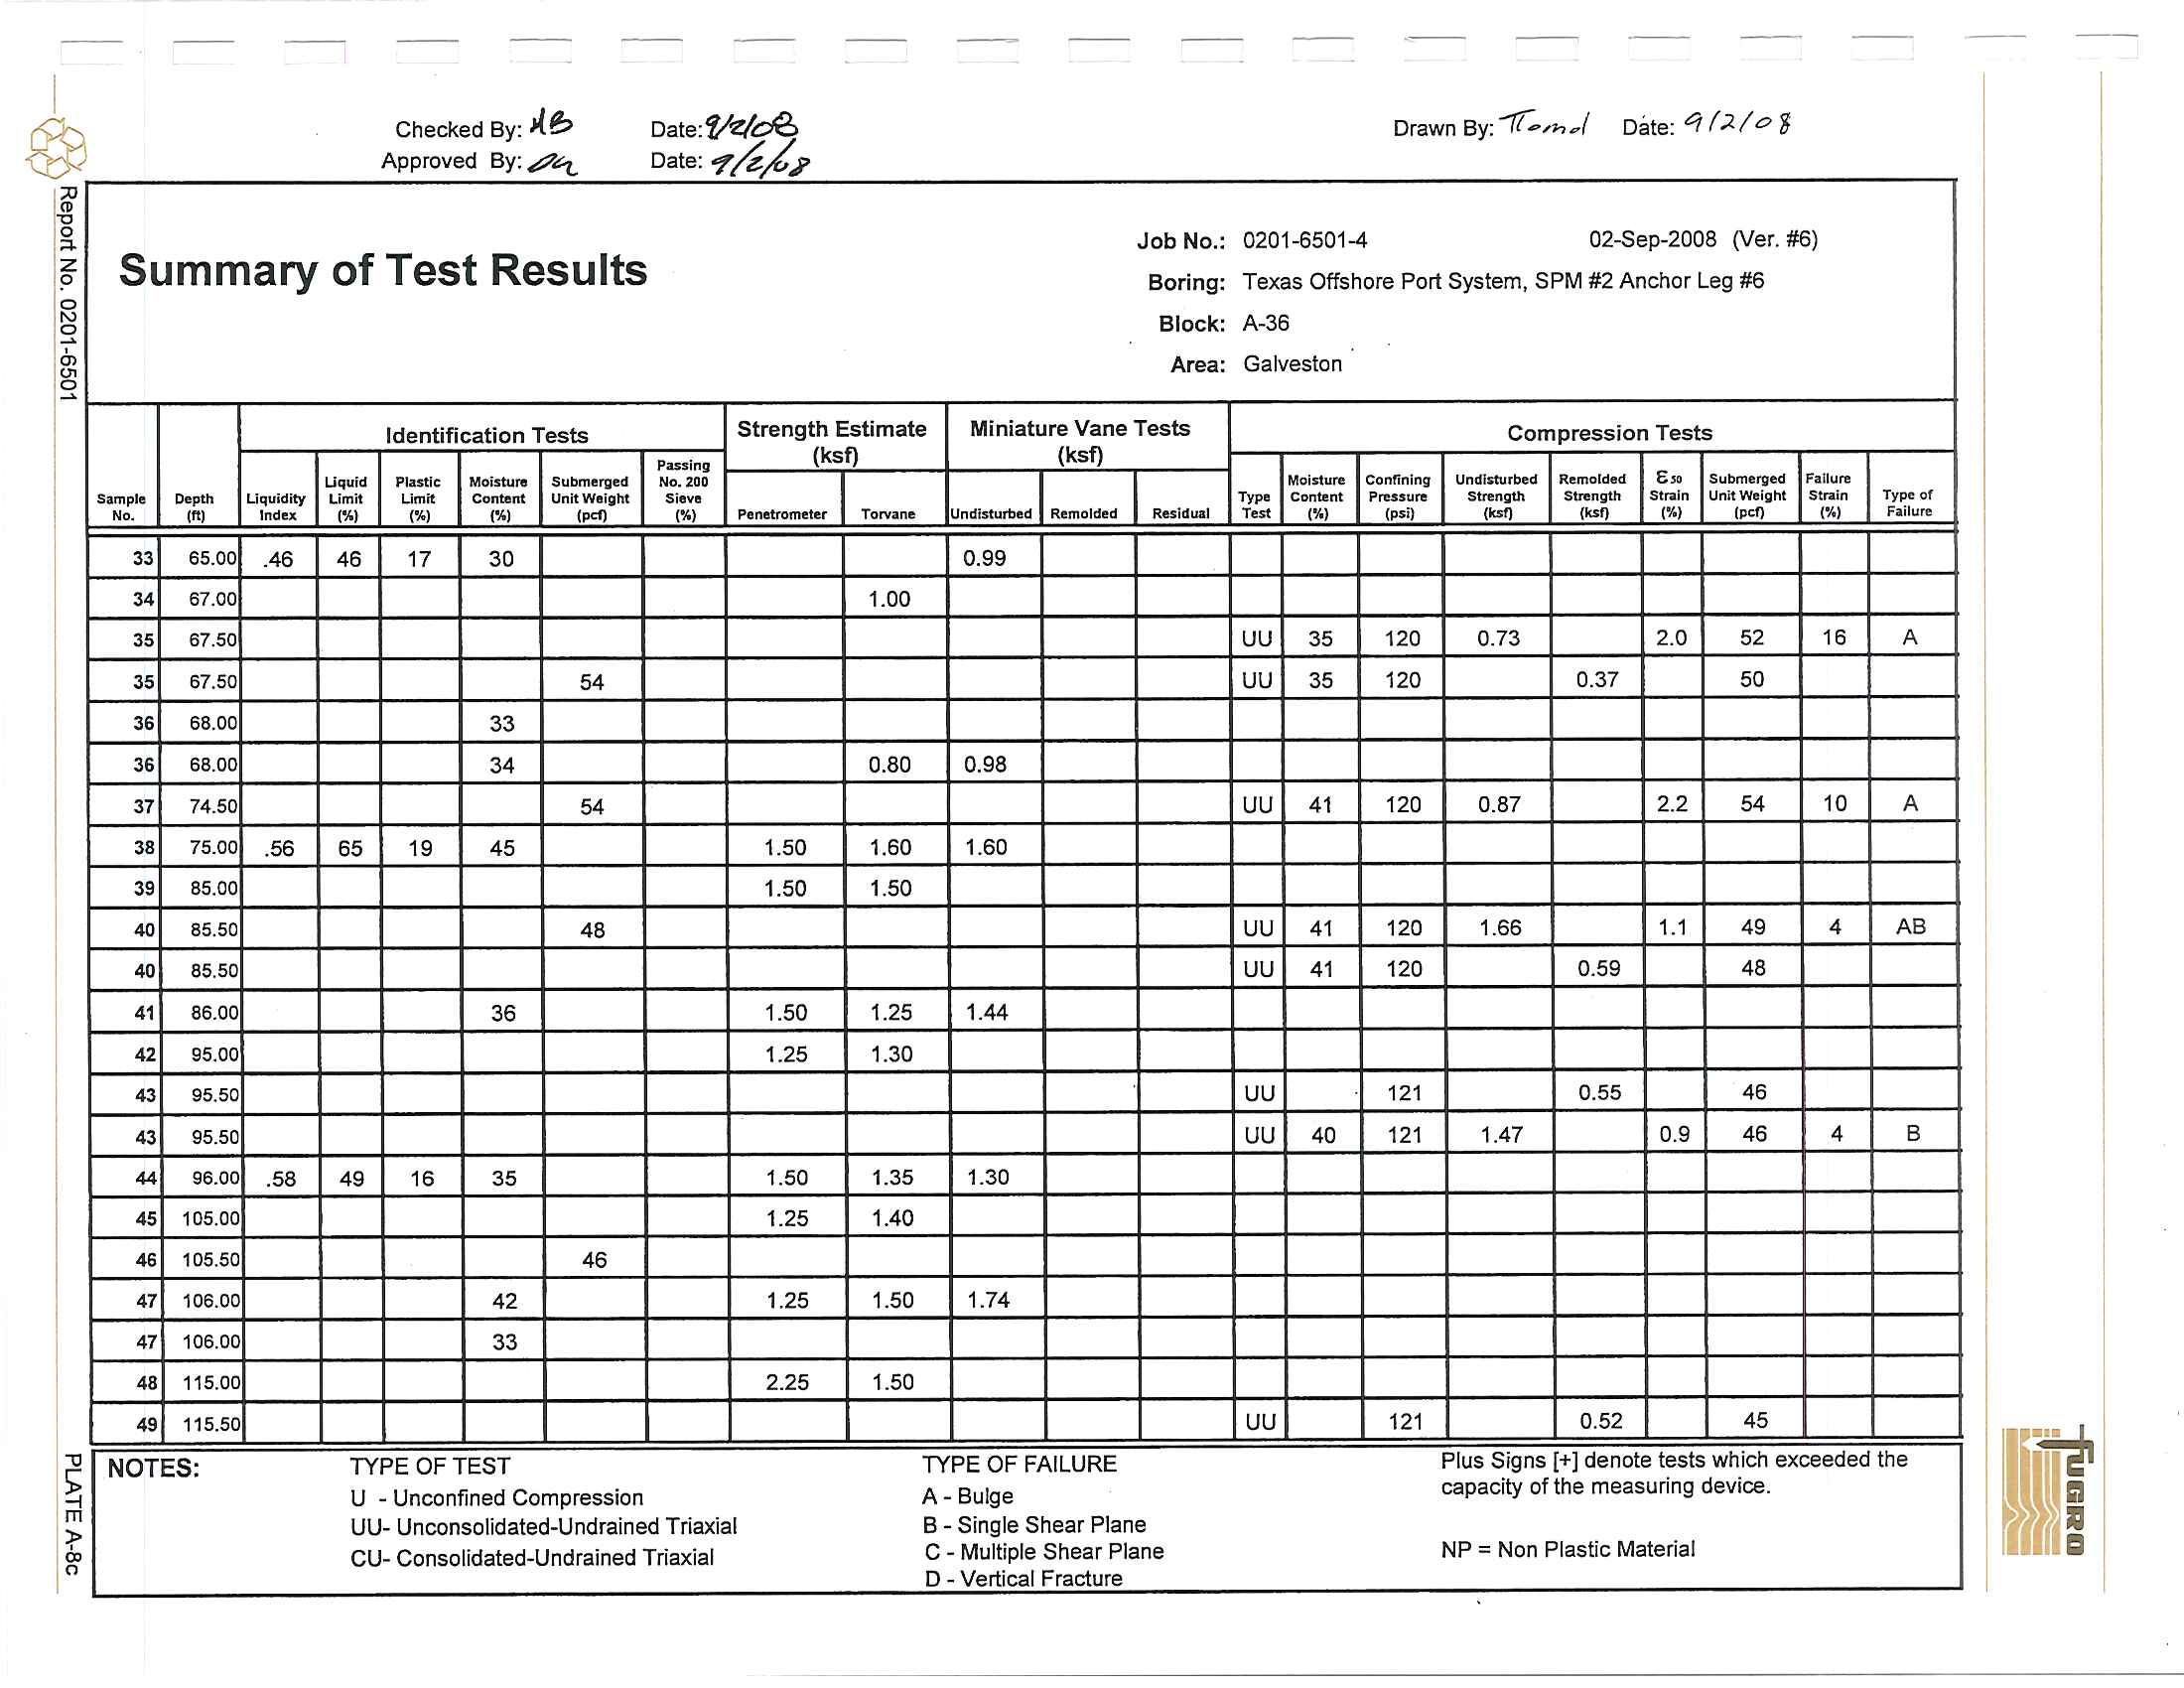
33
65.00
.
46
46
17
30
0.99
34
6
7.
00
1.00
3.
67
.
50
UU
35
120
0
.
73
2.0
52
16
A
3.
67
.
50
54
UU
35
120
0
.
37
50
3.
68.00
33
3.
68.00
34
0.80
0.98
37
74
.
50
54
UU
41
120
0.87
2.2
54
10
A
38
75.00
.
56
65
19
45
1
.
50
1.60
1
.
60
39
85
.
00
1.50
1
.50
40
85
.
5
0
48
UU
41
120
1.66
1.1
49
4
AB
4
0
85
.
50
UU
41
120
0
.
59
48
41
86.00
36
1.50
1
.25
1
.44
42
95.00
1
.
25
1.30
43
95
.
50
UU
12
1
0
.
55
46
43
95
,
50
UU
40
12
1
1
.
47
0.9
46
4
B
44
96.00
.
58
49
16
35
1
.
50
1.35
1.30
45
105
.
00
1.25
1.40
4
.
105
.
50
46
47
106.00
42
1
.
25
1.50
1.74
47
106
.
00
33
48
1
15
.
00
2
.
25
1
.
50
49
115
.
50
UU
121
0
.
52
45
N
O
TE
S
:
TYP
E
OF
T
EST
TYP
E
OF
F
AILURE
Plus
Signs [+]
denote
tests
which
exceeded the
U
-
Unconfined Compression
A -
B
ulge
capacity
of
the measuring device.
UU-
U
nconsol
i
da
t
ed-Undra
in
ed
T
riaxial
B -
Si
n
gle Shear Pla
n
e
CU- Consolidated-Undrained Triaxial
C
- Multiple Shear Plane
NP
=
Non Plastic Material
D
- Vertical Fracture
I
@
I
"0
i:'
o
;,.
z
!>
Ii:l
~
0,
~
Checked
By
:
M.~
Approved
By
:
p",-
Summary of Test Results
Identification
T
ests
Liquid
P!astl~
Moisture
Submerlled
Samp
le
Depth
Uqllidity
Limit
Urnl!
Conblnt
Unit Weight
"".
I')
Index
I.,
I.,
I.,
"."n
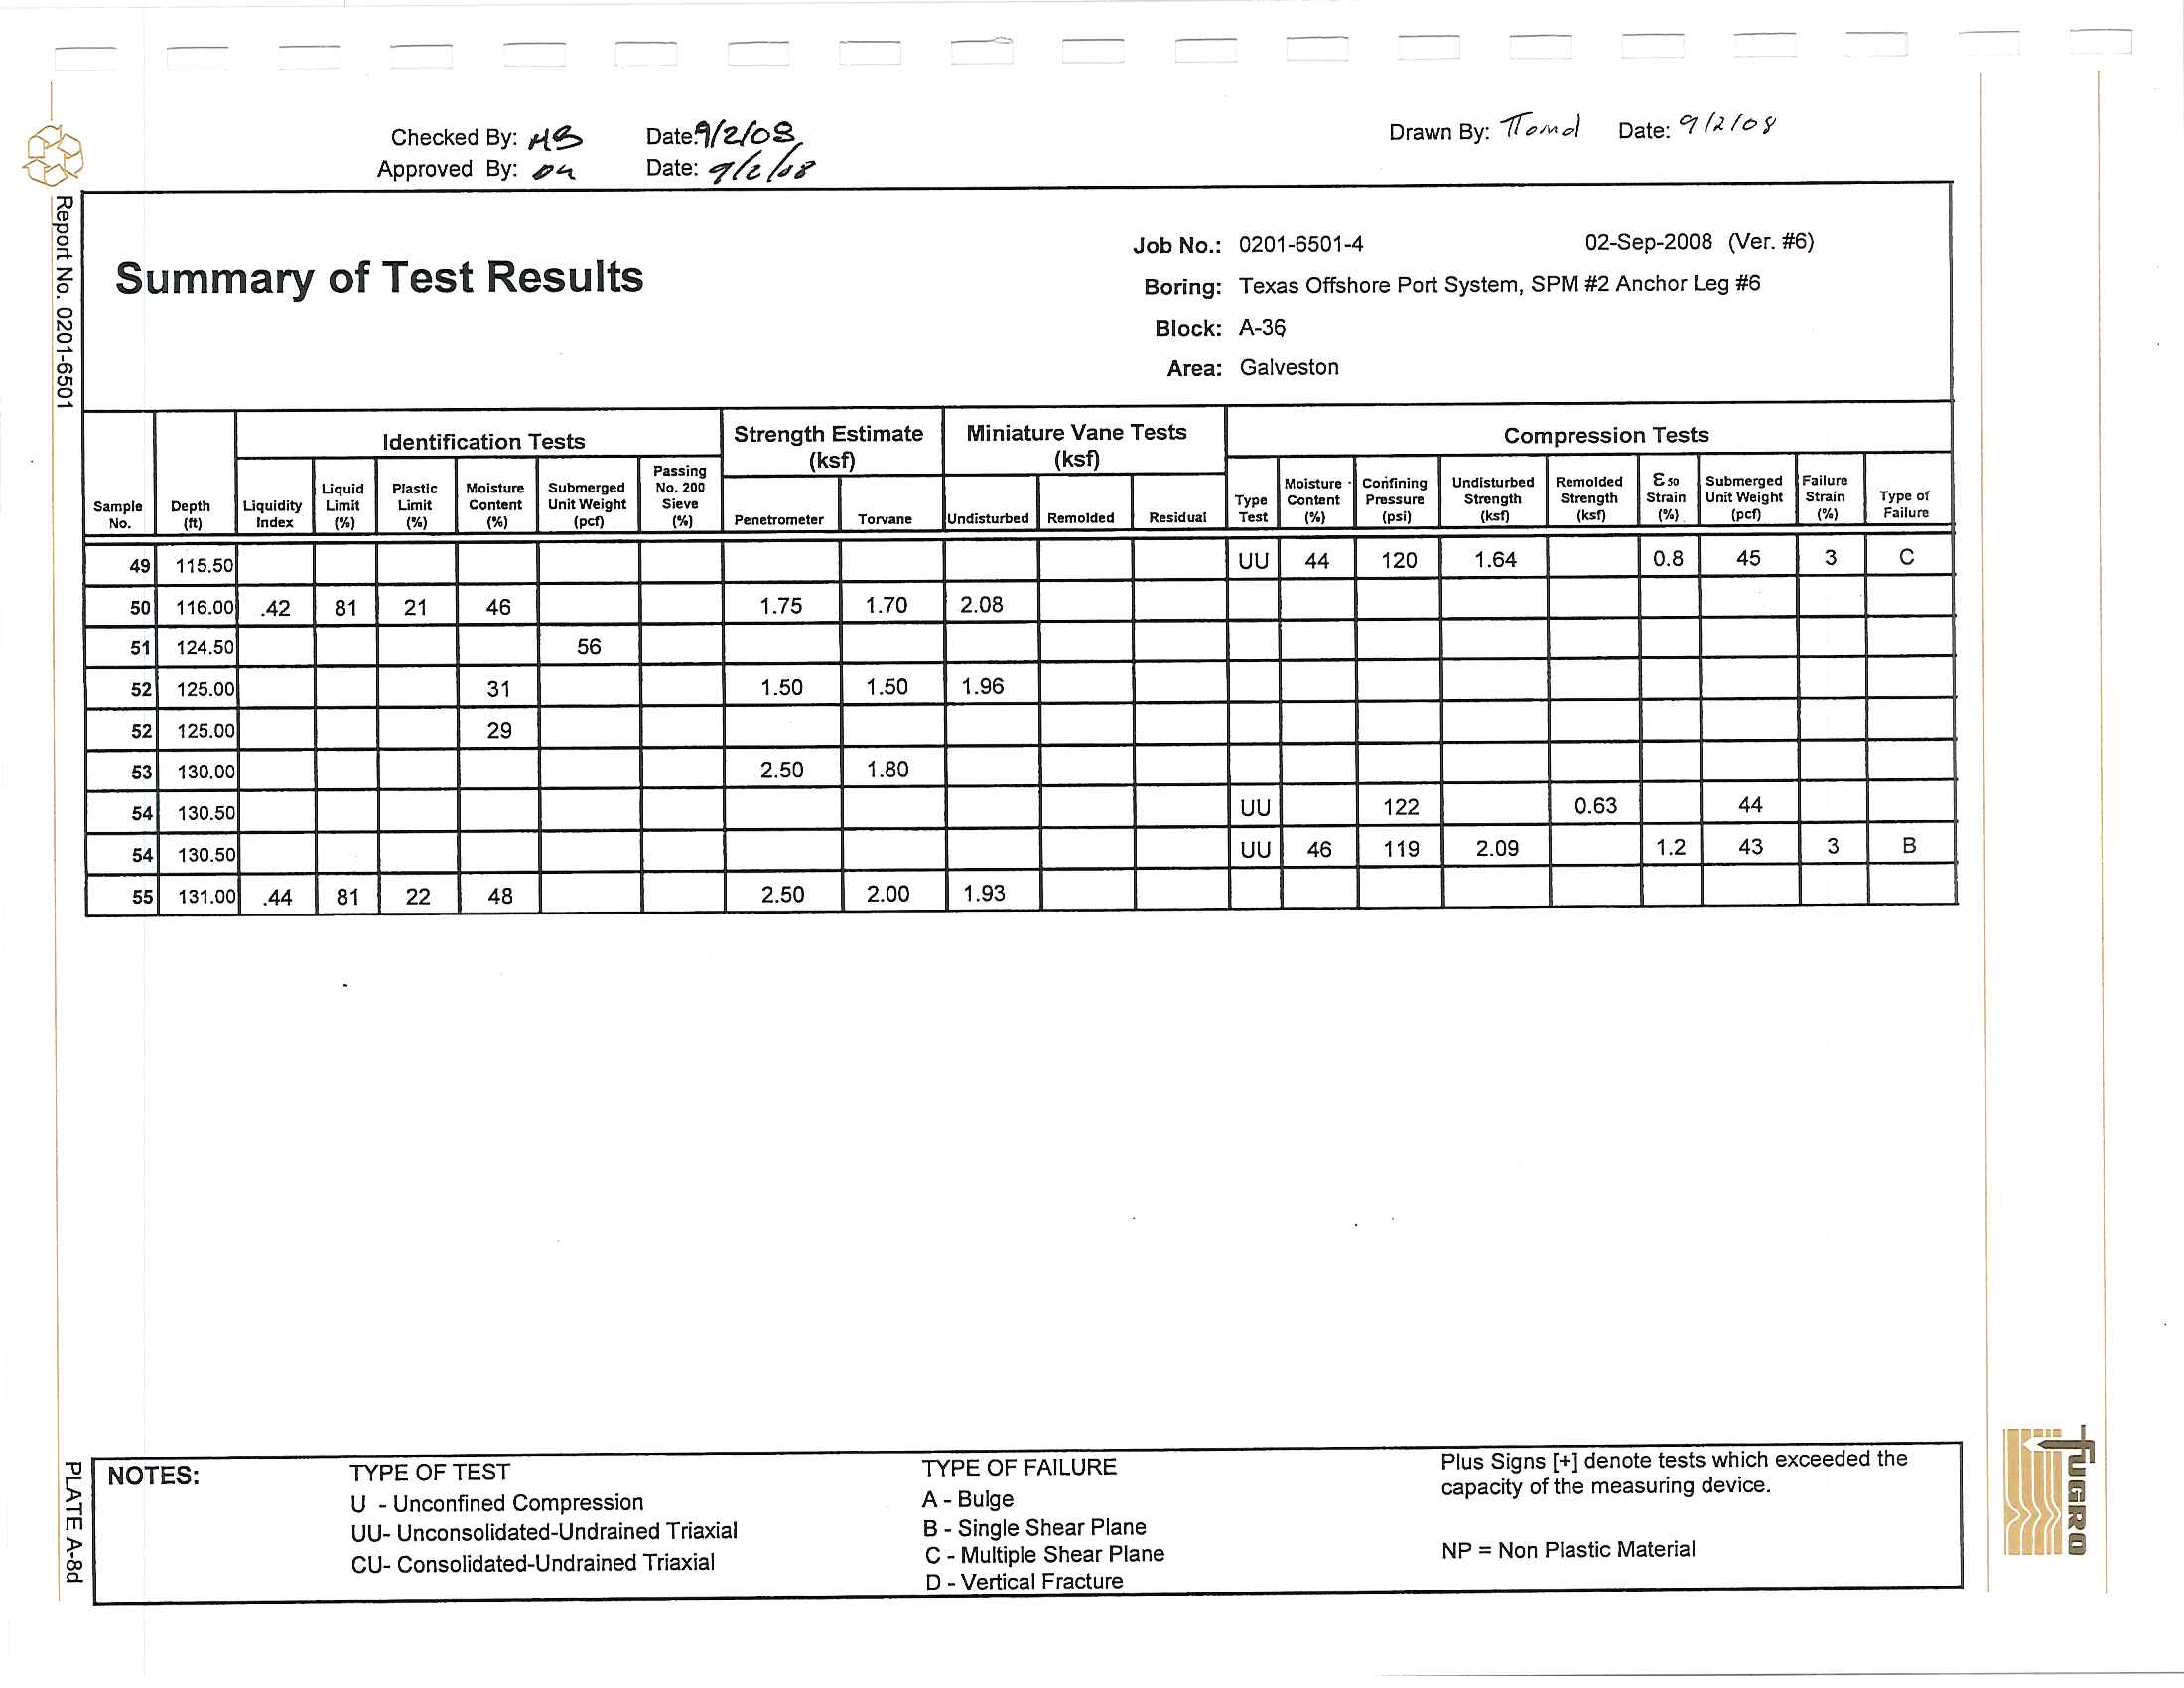
4.
115
.
50
50
116
.
00
.42
81
21
46
51
1
24.50
56
52
125.00
31
52
125.00
29
53
130
.
00
54
130
.50
54
130.50
55
131
.
00
.
44
81
22
48
Date"lfZ/oS
Date
:
'T/?
~,j'
Strength
Estimate
Passing
Iksf)
No. 200
SieV1l
..I
Penetrometer
TONane
1.75
1.70
1.50
1
.
50
2.50
1.80
2.50
2.00
~
Drawn
By:
1(;,
M
e>/
Date:
'7
("
101'
Job No.:
0201-6501-4
02-8ep-2008
(Ver
.
#6)
Boring: Texas Offshore Port
System, SPM
#2 Anchor Leg #6
Block:
A-36
Area:
Galveston
Miniature
Vane
Tests
Compression Tests
Iksf)
Moisture
'
Corifinlng
UndlstLllbed
Remolde.d
E.
Submerged
F~ilu",
"po
Content
PI1l$sure
Streng
th
Strength
Str.llin
UnllWel"ht
Strain
Type of
Undisturbed
Remolded
Residual
Test
..
I
(psi)
I...,
I"n
I.,
[pcl)
(
'/o
j
Falhll1l
UU
44
120
1
.
64
0.8
45
3
C
2
.
08
1.96
UU
122
0.63
44
UU
46
119
2.09
1.2
43
3
B
1.9
3
~
NOTES:
TYPE OF TEST
TYPE OF FAILURE
Plus Signs
[+
]
denote tests
which
exceeded
the
-I
U
_Unconfined Compression
A _ Bulge
capacity of
the measunng dev1ce.
;
UU- Unconsolidated-Undrained Triaxial
B
- Single Shear Plane
Co
CU- Consolidated-Undrained
Triaxial
C - Multiple Shear Plane
a.
0
_
Vertical Fracture
NP = Non Plastic Material
I
@
il'
"
0
"
z
?
0
'"
0
~
0,
'"
~
"
~
!:
'"
w
100
90
80
I
f-
70
'"
~
60
>-
"'
'"
;;;
50
'f)
'f)
..:
0-
f-
z
w
40
~
W
0-
30
20
10
0
100
Checked by
;
A~
Approved
by
:
.t?~
U.S.
STANDARD
SIEV
E
SIZES IN INCHES
3
2
I
Coarse
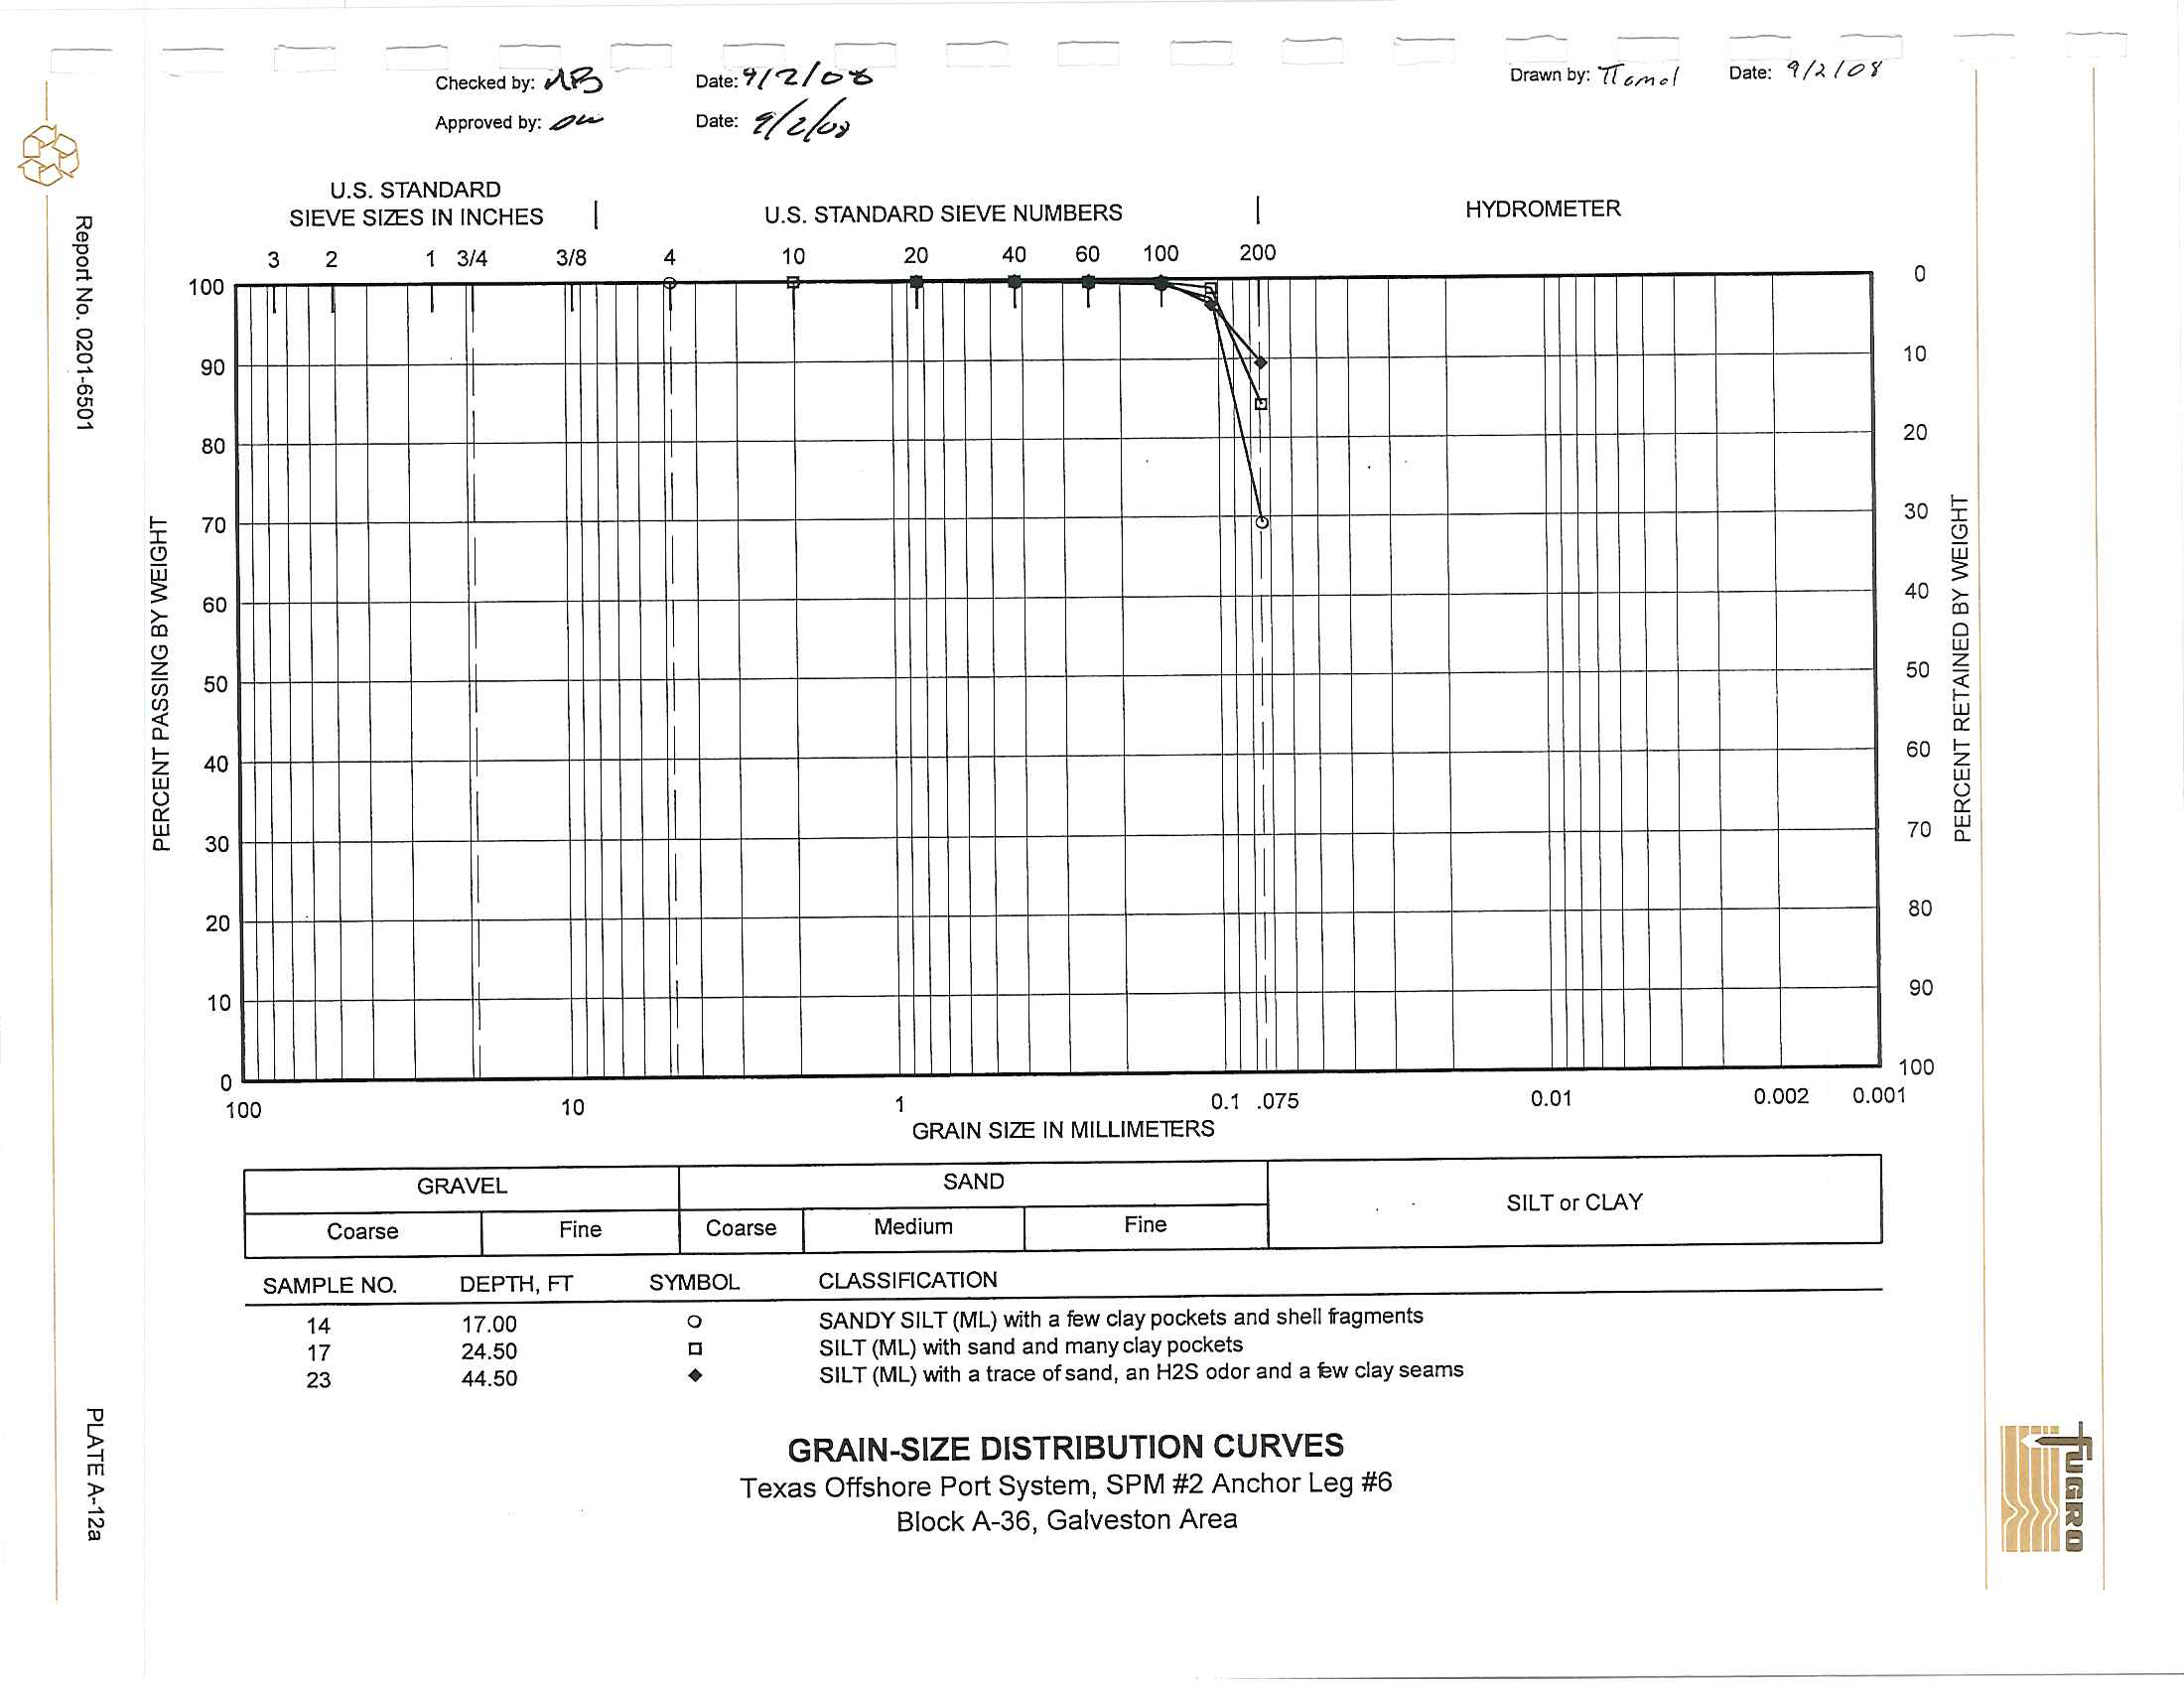
SAMPLE NO.
14
17
23
1
3
/
4
3
/
8
I
I
I
10
GRAVEL
I
Fine
DEPTH, FT
17
.
00
24.50
44
.
50
Dateo'l/'2/
Co
"6
Date
~t0
U
.
S
.
STANDARD
SIEVE NUMBERS
4
10
20
40
60
100
200
I
T~
!
I
!
I
I
I
I
J
.
I
I
I
I
I
I
I
1
0
.
1 .075
GRAIN S
IZE
IN
MILLIMETERS
SAND
Coarse
I
Medium
I
Fine
SYMBOL
CLASSIACATION
o
c
•
SANDY SILT
(ML)
with a
few
clay
pockets
and shell tagments
SIL
T
(M
L
) with sand
and
many clay
poc
k
ets
SILT
(ML) with
a
t
ra
ce
of sand, an H2S
odor and a ew clay seams
GRAIN-SIZE DISTRIBUTION CURVES
Texas Offshore Port System, SPM #2
Anchor
Leg
#6
Block A-36, Galveston Area
Drawn by
:
7T
&
/t'I
~
{
Date
:
"1
1
.>..
!t?
f
HYDROMETER
0
1
0
2
0
30
j:
'"
4
0
>-
~
"'
0
w
5
0
z
a::
w
~
60
~
w
0
a::
7
0
g:
80
90
1
00
0
.
01
0
.
002
0.001
S
ILT
or
CLAY
I
@
;0
ro
"C
0
:l.
Z
?
0
'"
~
C,
'"
~
."
~
!:
'"
C'
100
90
80
f-
70
I
t9
>-
~
OJ
60
z
t9
iii
50
«
en
"-
f-
z
40
LU
()
'"
LU
"-
30
20
10
0
100
3
Chec
k
ed
by
:
;(@,
Approved by:
.;t?~
U
.
S
.
STANDARD
SIEVE
SIZES
IN
INCHES
2
1
314
I
I
I
I
GRAVEL
Coarse
I
318
10
Fine
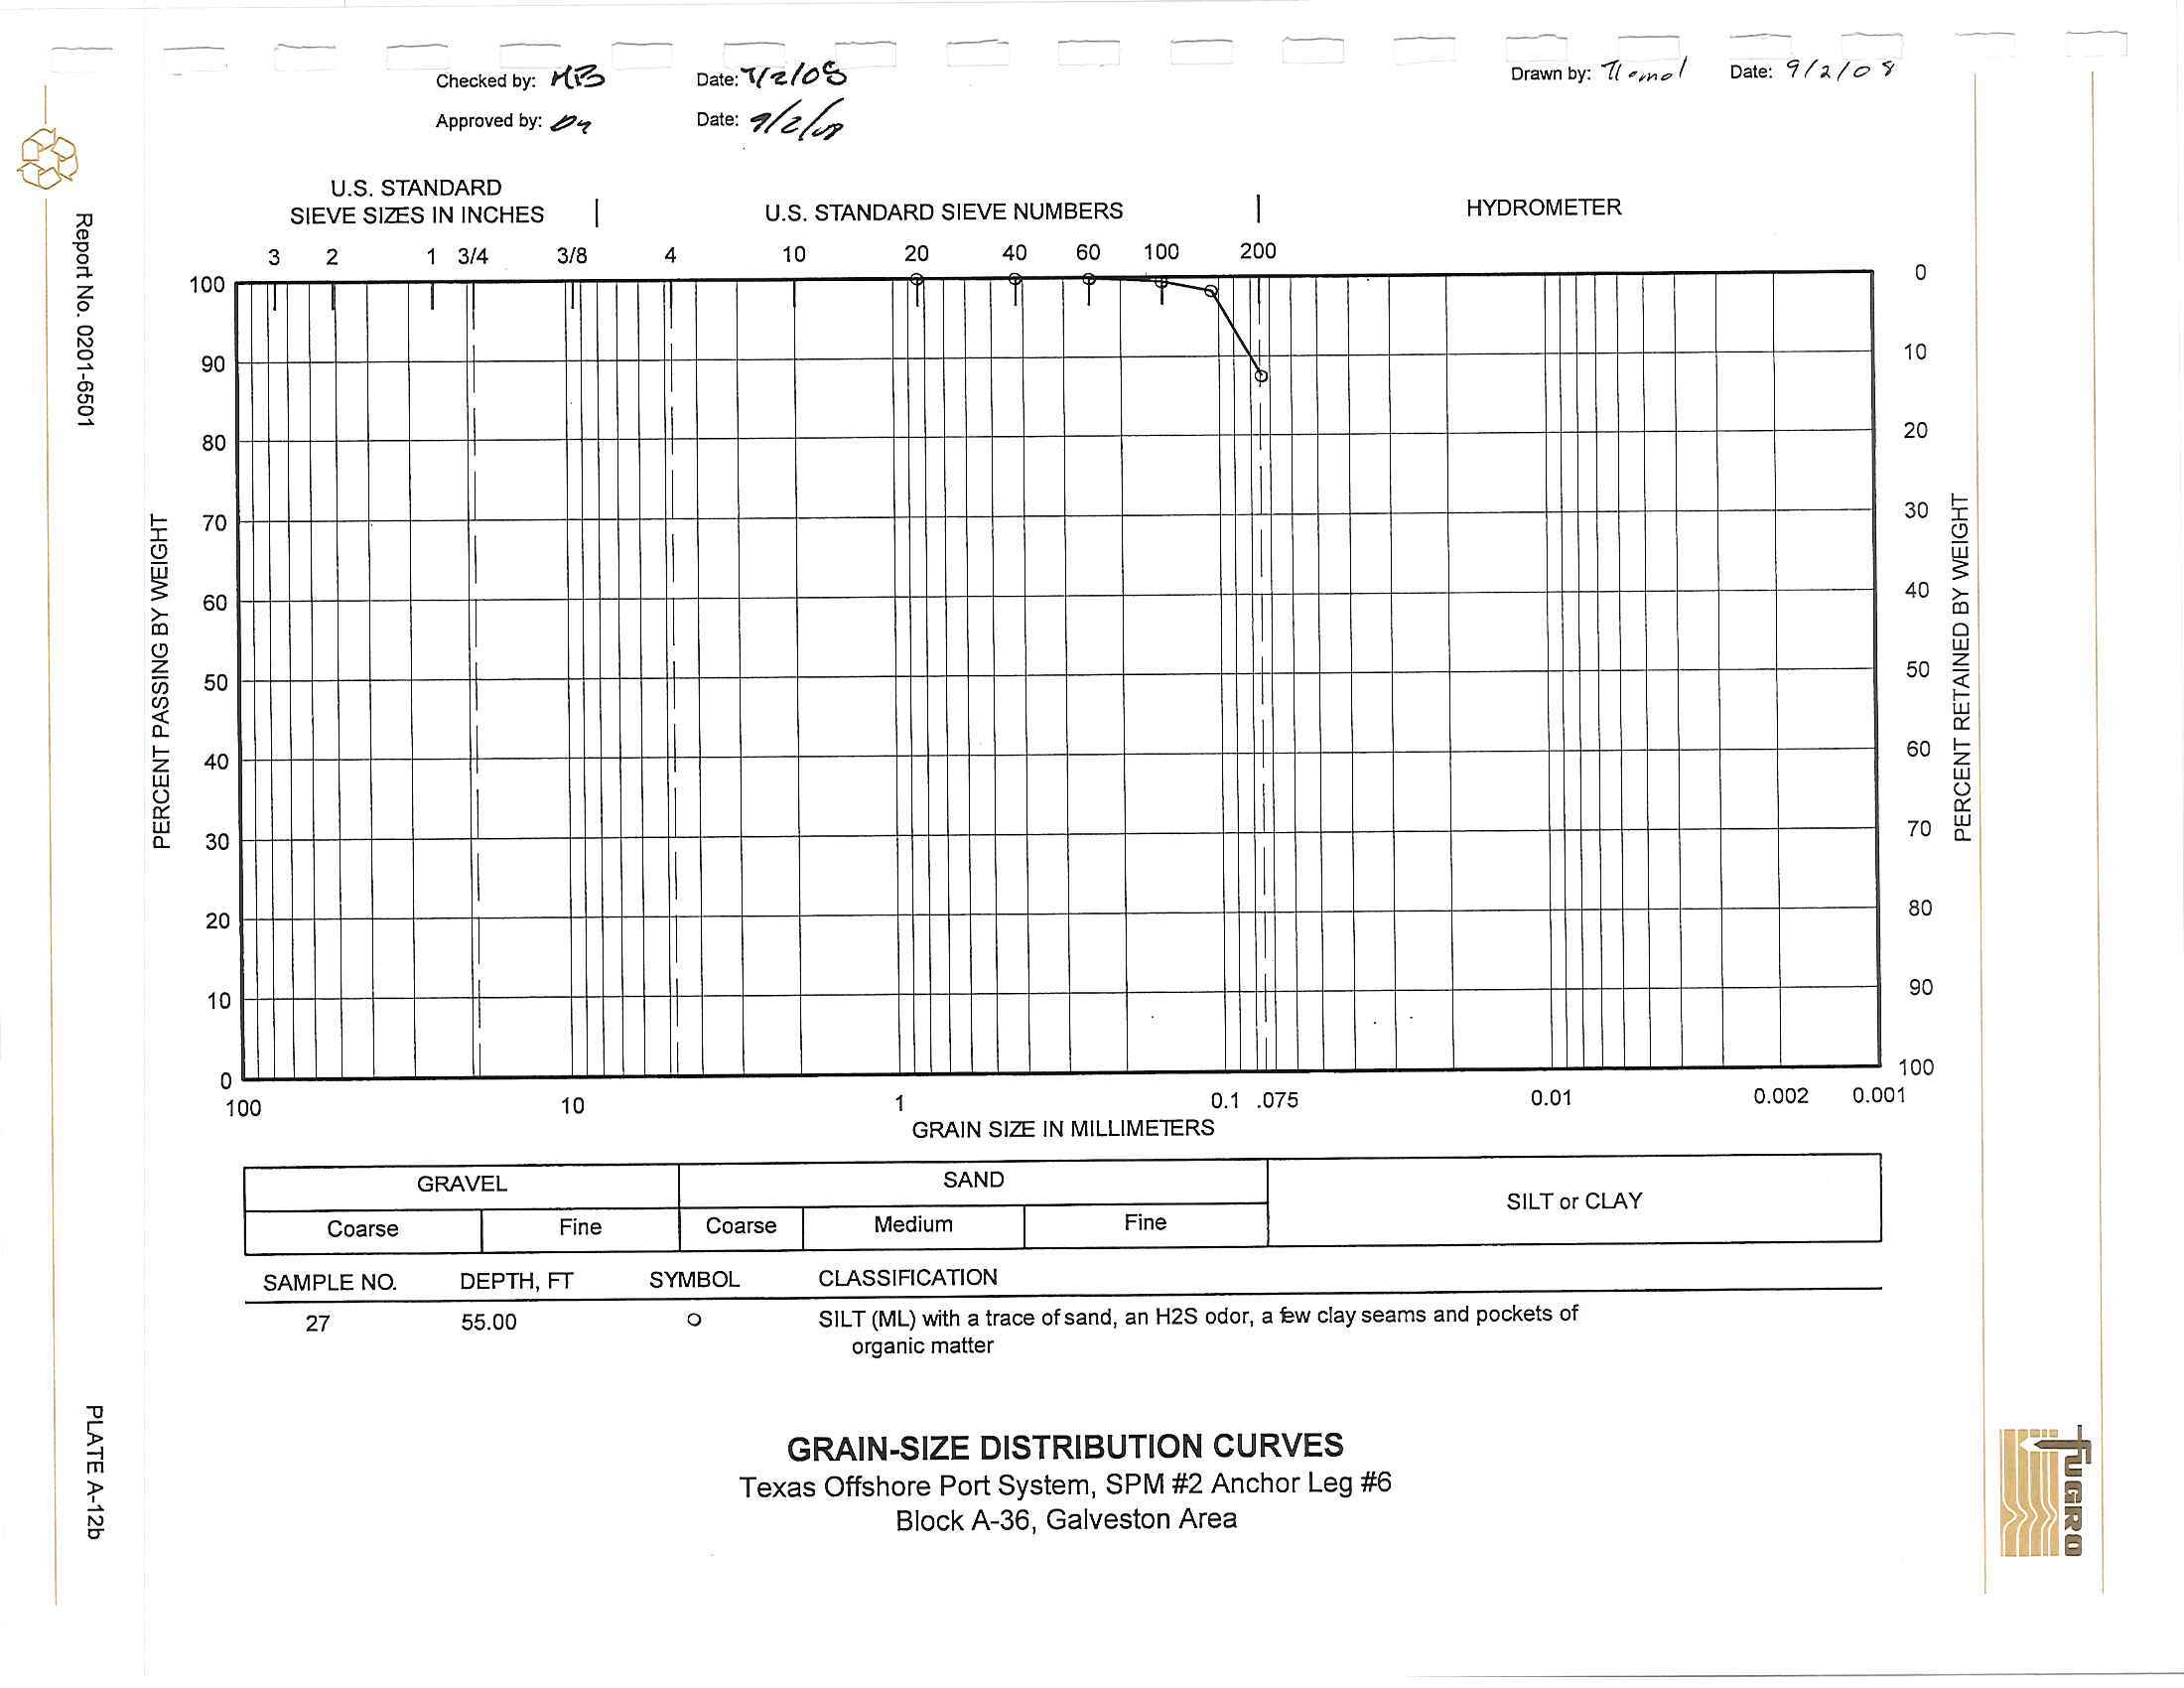
SAMPLE NO.
DEPTH, FT
27
5
5.0
0
Dale,
"If-z:
It)
'b
D
ale'
?~h
Orawn by
:
{f
',,~g
I
D
ate; '1
f" 10
5'
U.S
.
STANDARD SI
E
VE
NUMBERS
HYDROMETER
4
10
20
40
60
100
200
T
T ...
I
I
I
'
I
I
I
1
0
.
1
.
075
0.01
GRAIN
S
IZE
IN
MILLIMETERS
SAND
Coarse
I
I
S
ILT
or
CLA
Y
Medium
Fine
SYMBOL
CLASSIFICATION
o
SILT
(ML) with
a
trace
o
f
sand
,
an
H
2S
odo
r
, a i:!:w c
l
ay seams and
p
ockets
of
organic
matter
GRAIN-SIZE DISTRIBUTION CURVES
Texas Offshore Port System
,
SPM #2 Anchor Leg #6
Block A-36, Galveston Area
0
10
2
0
30
40
50
60
70
80
90
100
0.002
0.001
f-
I
>2
~
OJ
>-
0
LU
z
«
f-
LU
'"
f-
Z
LU
()
'"
LU
"-
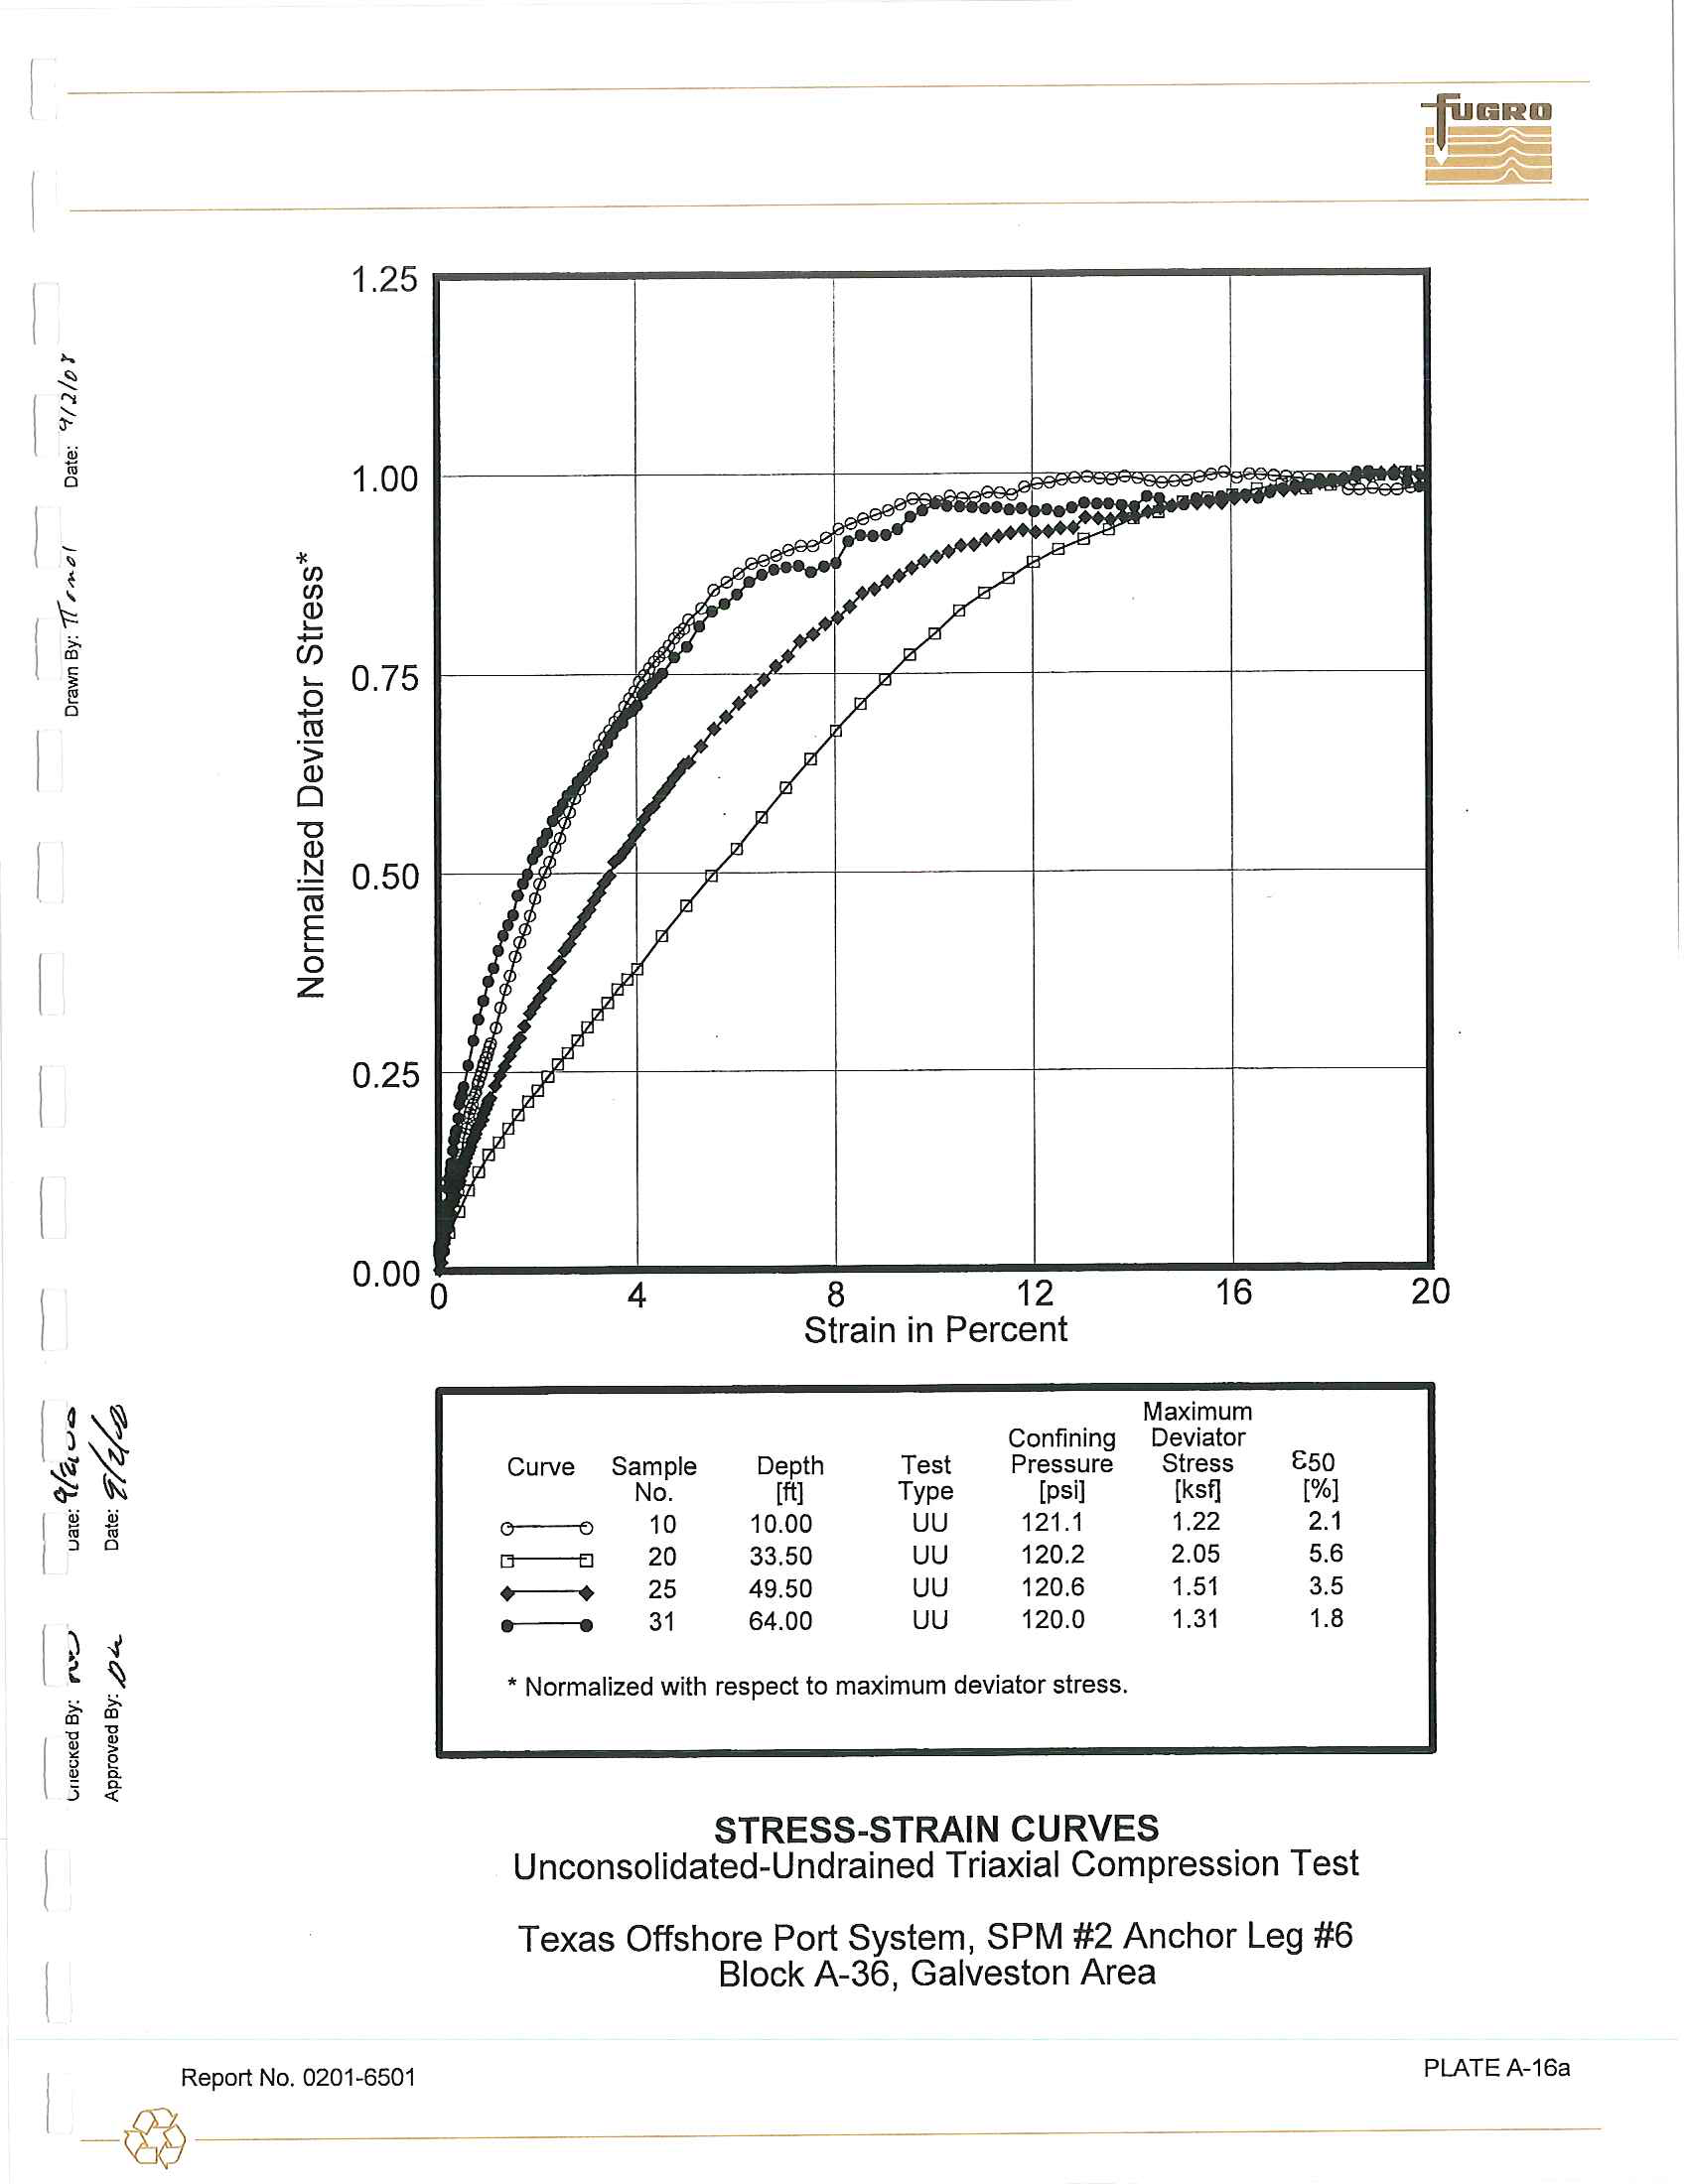
1.25
...
~
....
,.
"-
~
1.00
0
..
!
•
(f)
~
(f)
Q)
I
~
-
...
U)
~
...
0
0.75
0
-
I
C1l
.:;
Q)
0
'0
Q)
N
0.50
C1l
E
...
0
z
0
.
25
0.00
4
8
12
16
Strain
in
Percent
Maximum
Confining
Deviator
C
urv
e
Sample
Depth
Te
st
Pressure
St
res
s
GSO
No.
[It]
T
ype
[psi]
[ksij
[%]
cr----tl
10
10
.00
UU
121.1
1.22
2.1
"
El
20
33.50
UU
120
.
2
2.05
5.6
•
•
25
49
.5
0
UU
120
.
6
1.51
3.5
•
•
31
64.00
UU
120
.
0
1.31
1.8
• Normalized with
respect
to maximum deviator stress.
STRESS-STRAIN CURVES
Unconsolidated-Undrained Triaxial Compression Test
Texas
Offshore Port System, SPM
#2
Anchor
Leg
#6
Block A-36
,
Galveston Area
20
PLATE
A-16a
I
Report
No
.
0201-650
1
-
~
---------------------------------
,
'"
~
~
(S-
0
1i
•
..,
•
~
C/)
~
C/)
(])
~
>-
....-
<D
(/)
~
~
"
0
0
....-
.
;;:
C1l
(])
0
""0
(])
.!:::!
C1l
E
~
z
0
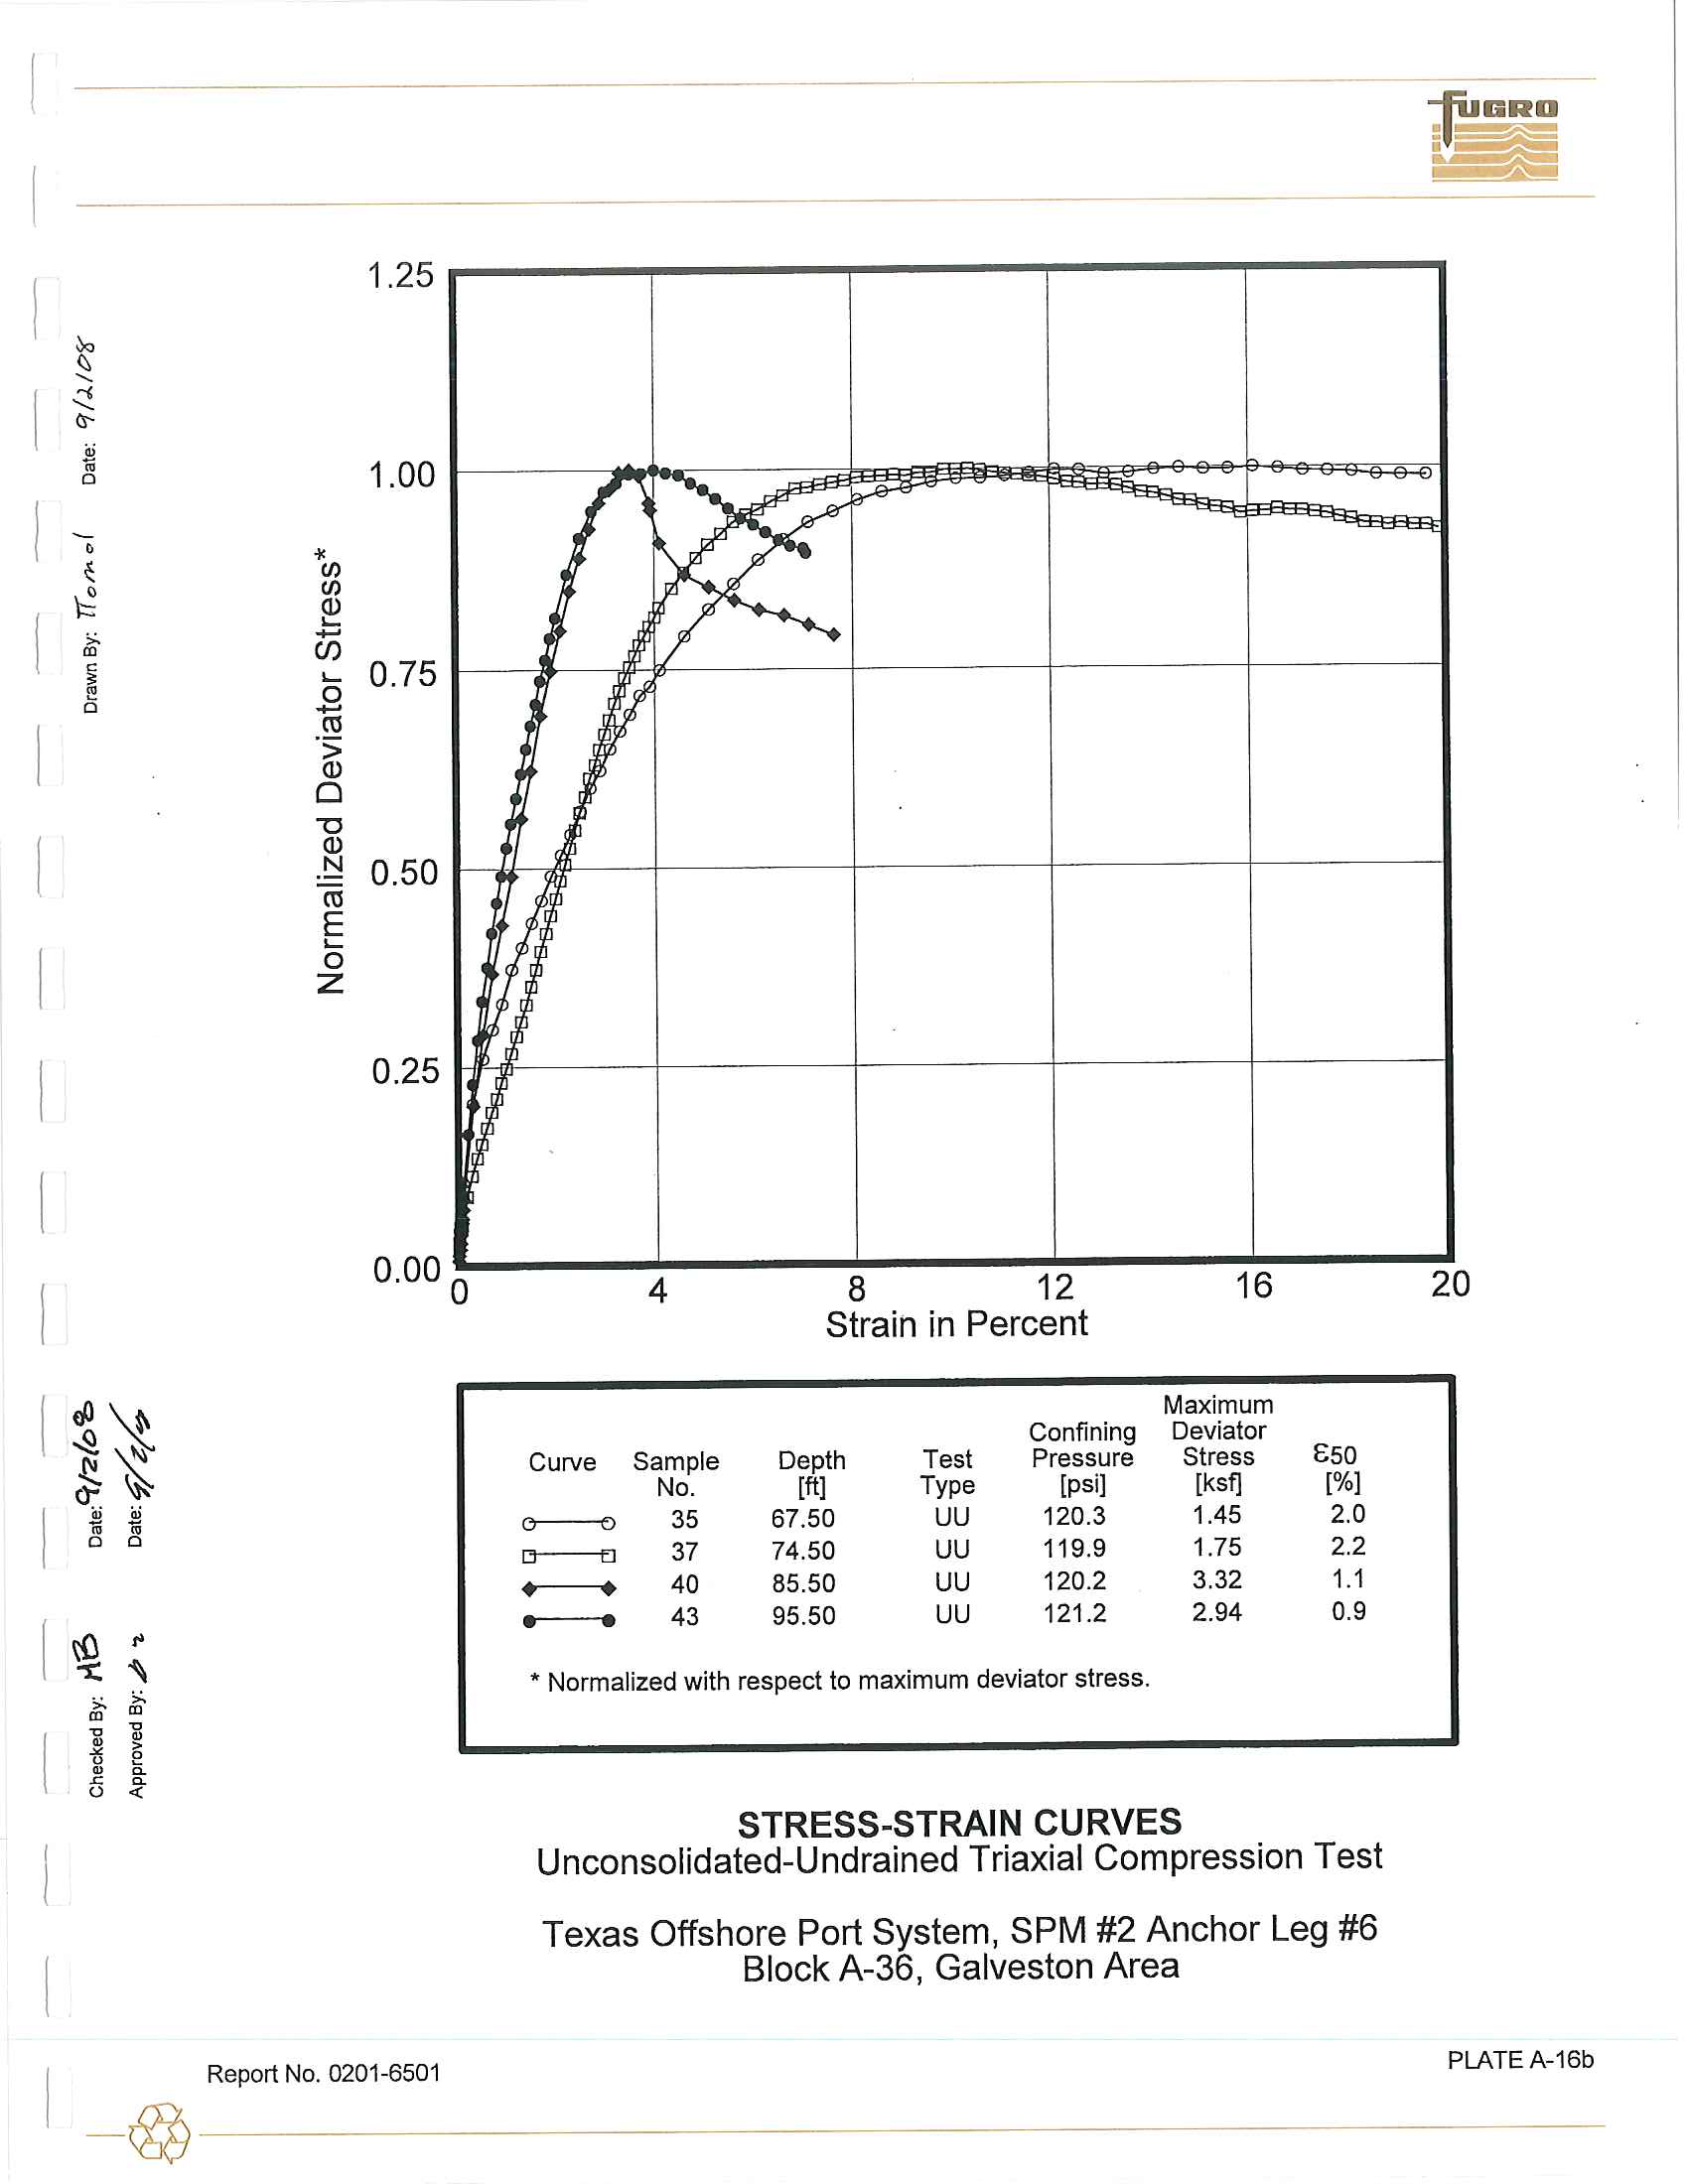
1.25
1.00
i"""
0
.
75
J
r,t
I
0.50
0.25
~
f
0.000
4
8
12
16
Strain
in Percent
Maximum
Confining
Deviator
Curve
Sample
Depth
Test
Pressure
Stress
E50
No
.
[tt]
Type
[ps
i
]
[ksfj
[
%
]
e>------<>
35
67.50
UU
120
.
3
1.45
2.0
[}--"!'J
37
74.50
UU
119
.
9
1
.75
2.2
•
•