1----
:x,
l
i
~
..
~-
[j.
•
•
I
,
•
•
"
'
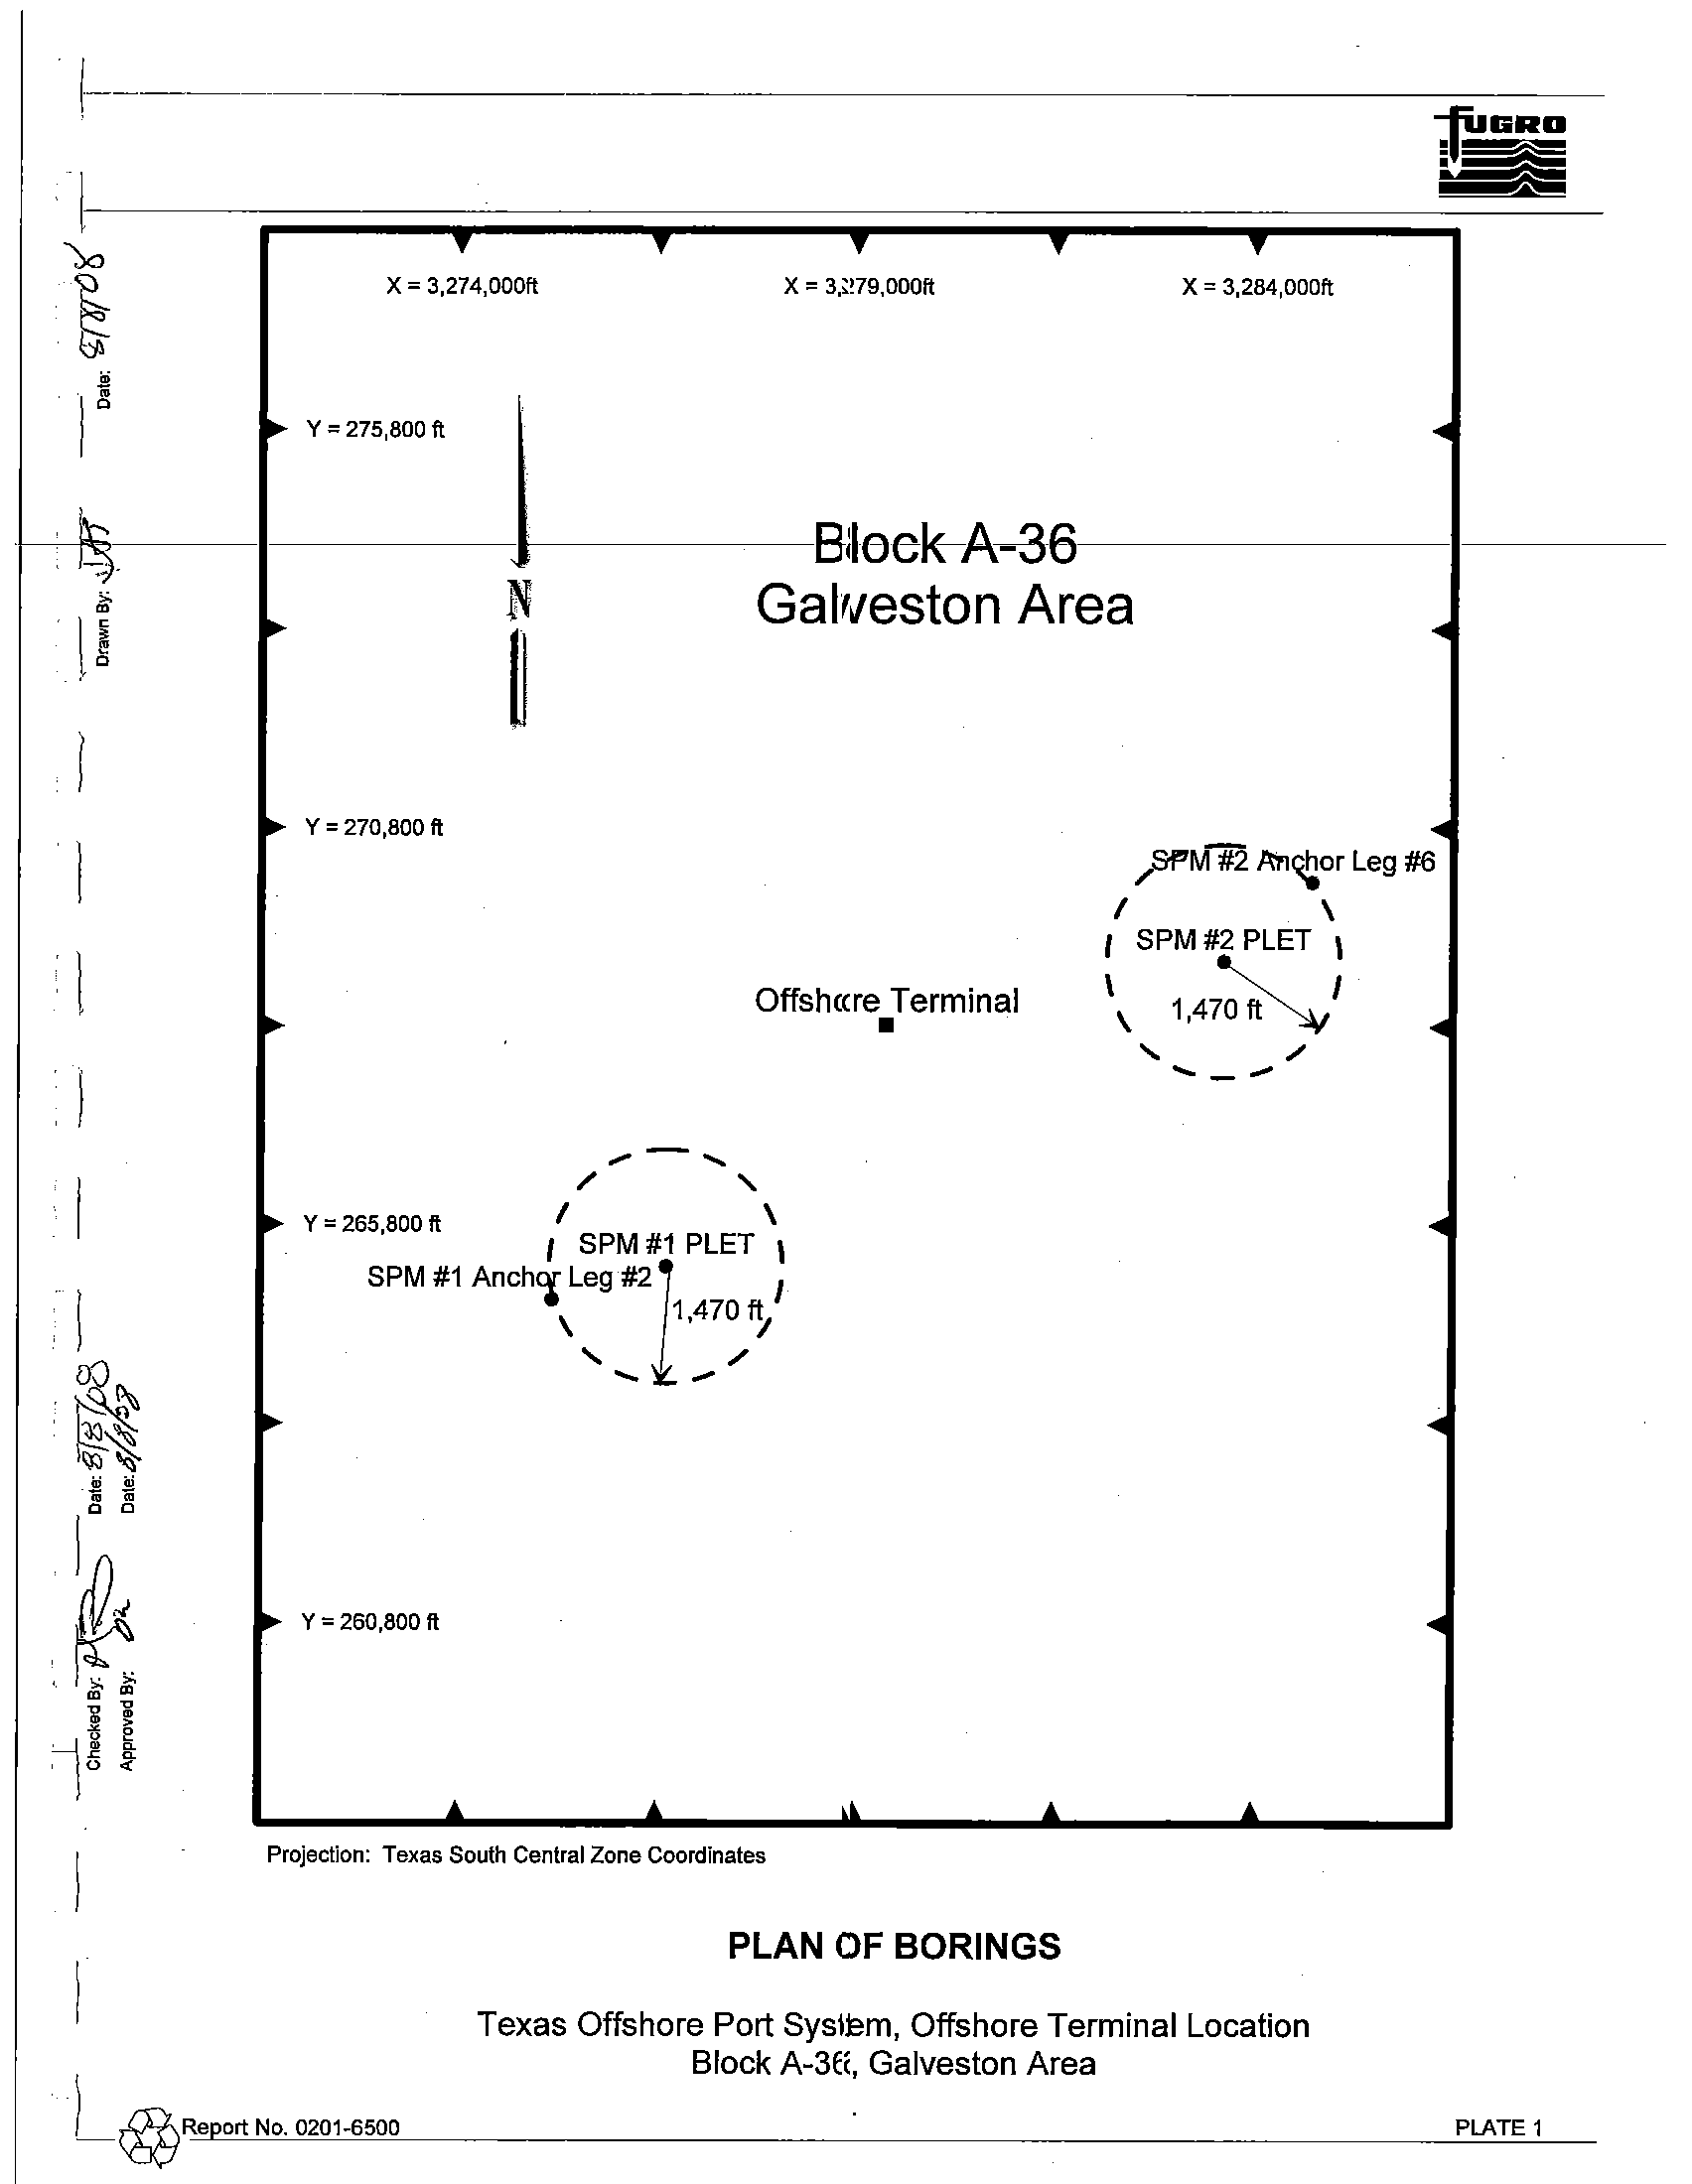
x =
3,274,000ft
x =
3,279,000ft
x =
3,284,000ft
Y
=
275,800 ft
I .
fie
1
I
Bleek-A--36
1---
~
[I
i
1
\
I
1
I
.~
~~
~
*
1
0
0
~~
~
m m
i
1ii
,
~~
)0
~
I
N
Galveston Area
~
Y
=
270,800 ft
Offshore
•
Terminal
"
-
-
......
;'
,
I
\
Y
=
265,800 ft
,
SPM #1 PLET ,
SPM #1 Anch'l Leg
#21
I
\
1,470 f!,
"
....
~
....
/
Y
=
260,800 ft
Projection: Texas South Central Zone Coordinates
PLAN OF BORINGS
)'f'M'#2
lI?1~or
Leg
#6
I
\
, SPM #2 PLET ,
\
"I
\
1,470ft~
"
....
_
....
/
)_@Re
p
ortNo.0201-6500
Texas Offshore Port System, Offshore Terminal Location
Block A-36, Galveston Area
PLATE 1
I
@
I
;>J
"0
0
"-
z
~
0
:1
'"
0,
"'
0
0
I
.:
o
'iii
Q)
(f)
(jj
~
OJ
o
c
~
C5
c
a.
Q)
-u
S
m
'"
ru
2
5
7
10
12
15
17
20
22
25
27
30
32
35
37
40
42
45
47
50
Checked By:
Approved By:
1)1'
5A1
1.)'"
DateY/rk-
Date!/7k
Drawn By:
t"r
Dale: "/7't..
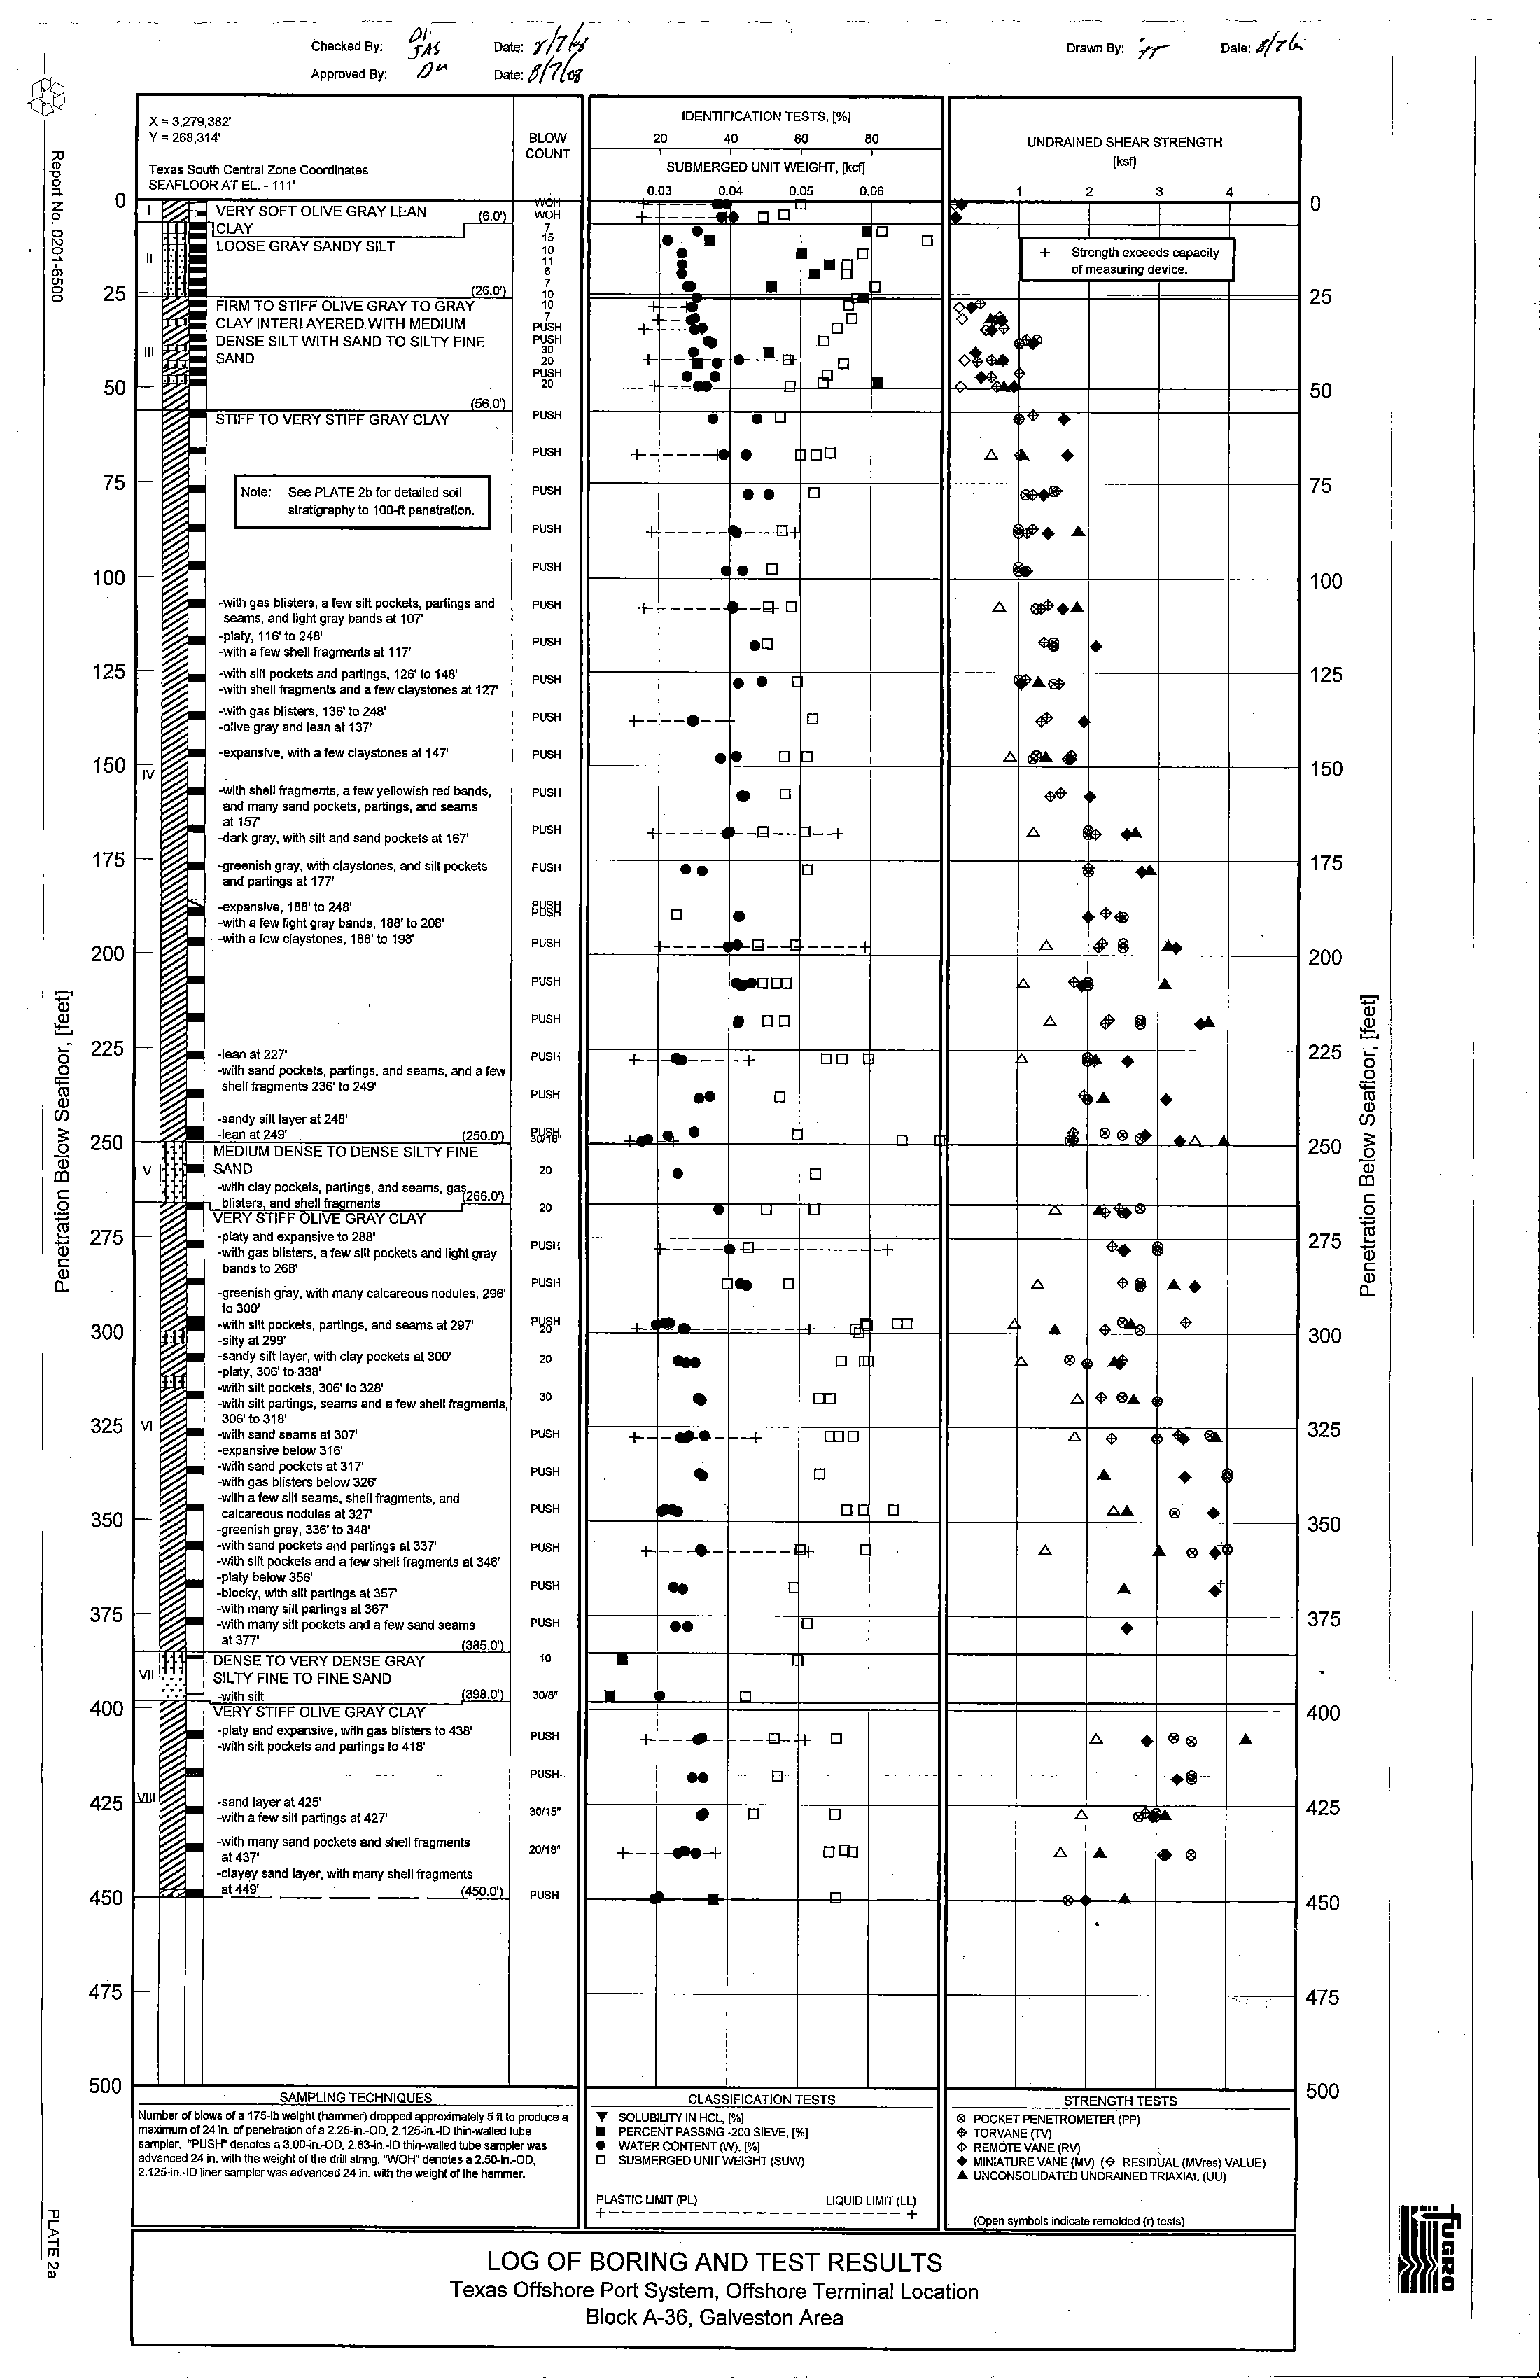
x =
3,279,382'
IDENTIFICATION TESTS, [%]
I
Y
=
268,314'
BLOW
20
40
60
80
UNDRAINED SHEAR STRENGTH
COUNT
[ksf}
Texas South Central Zone Coordinates
SUBMERGED UNIT WEIGHT,
[kef}
SEAFLOORATEL-111'
0.03
0.04
0.05
0.06
1
2
3
4
I
Po
VERY SOFT OLIVE GRAY LEAN
(S.O')
WOH
+
-::ti
0 0
ri''-~I==:±
I==±==:::!;__,
.::!!
~
CLAY
LOOSEGRAYSANDYSILT
"-----,'5.
10
•
••
0
•
0
0
+
Sirengih exceeds capacily
IJ :.:.:
~
1
•••
B
of measuring device.
= . 'IF
(2S.0'
,70
••
b
...
~
FIRM TO STIFF OLIVE GRAY TO GRAY
~
,
~-S
',!;
I~_
~
CLAYINTERLAYEREDWITHMEDIUM
PUSH
+[=$
DO
<> *"' ....
~
DENSE SILT WITH SAND TO SILTY FINE
P~gH
• •
•
0
••
,.....
III
~
SAND
20
+---.-.-re---Ei-
0
<.><1>*
f- ...
~
P~gH!-.
n J9
III
I"
*_
J5S.01
STIFF TO VERY STIFF GRAY CLAY
PUSH
•
•
U
,w
•
!-
PUSH
+- ---____ •
DO
£:> '"
•
I- '"
I
Note:
See PLATE 2b for detaIled soil
J
PUSH
• •
0
~
stratigraphy to 100-ft penetration.
'"
PUSH
-t -----1---.0-
~
.....
I-
!-
PUSH
I •
0
I--_----'lr.~
_
_+--+--+_--
;.. -wilhgas blisters, a few silt pockets, partings and
PUSH
+t-----
""-Q- 0
L:l.
~
....
seams, and light gray bands at 107'
~
-platY,116't0248'
PUSH
.0
~
•
-with a few shell fragments
at
117'
I-
;- -with silt pockets and partings, 126' to 148'
PUSH
••
[
r"'~
-with shell fragments and a few claystones at 127'
-with gas blisters, 136' to 248'
PUSH
+ __
-e-_
0
#
-olive gray and lean at 137'
_
~
-expansive, with a few claystones at 147'
PUSH
• •
0 0
L:l.
...
IV
..
-with shell fragments, a few yellowish red bands,
PUSH
•
0
~
and many sand pockets, partings, and seams
•
al157'
PUSH" ____
O--g--~--+
£:>
1>. ....
-dark gray, with sill and sand pockets at 167'
,=I'
...,
-
_
-greenish gray, with claystones, and silt pockets
PUSH
• •
0
.....
and partings at 177'
.
~
-expansive, 188' to 248'
~~~~
D.
-$.
-with a few light gray bands, 188' to 208'
_
~
. -with a few claystones, 188' to 198'
PUSH
C---~
.e_g-----G ----of
L:l.
$' 8
....
'"
PUSH"ODO
l>.
~
:...
'"
PUSH. DO
£:>
~
II
....
f-
•
,lean at 227'
PUSH
+ ____
+
0 0 [
".. •
-with sand pockets, partings, and seams, and a few
~
shell fragments 236' to 249'
PUSH
..
0
~
...
•
_~d_at_
[__
.. -lean al 249'
(250.0')
~M~~'
.lJL •
n
.is
® ®
~
...
MEDIUM DENSE TO DENSE SILTY FINE
V
~
SAND
20.
0
-with clay pockets, partings, and seams,
ga~266
0"
blisters and shell fraaments
~
20
•
U
I I I
D.
I
~".IO'
VERY STIFF OLIVE GRAY CLAY
I -
I . -
I--
I..
-platy and expansive ta 288'
PUSH
~
I
r
-with gas blisters, a few sill packets and light gray
11- - - -
.Q-
-+
..
bands ta 26B'
A>.
Q,
!-
PUSH" 0
£:>
w., .....
-greenish gray, with many calcareous nodules, 296'
to 300'
~.
l-
~
-with silt pockets, partings, and seams
at
297'
P~8H
~
w.
r;:(
IT]
1....
4
~
$-
I
••
~
-silty at 299'
~
-sandy silt layer, with clay pockets at 300'
za
_
0 a
~
®
..
-platy. 306' to.338'
... i-.
-with silt pockets, 306' to 328'
30
rn
L:l.
$-
®...
r
-with silt partings, seams and a few shell fragments,
•
-l-.<I
306't0318'
1~---;-+-;;a..+--;--+-'nnt----jII----+---At--.;----;J
..
~.cl-----1
v
I
-with sand seams at 307'
PUSH
+- _
...
_
-+
IT]
0
L:!..
$
~ ~
-expansive below 316'
~
-with sand pockets at 317'
PUSH
•
0
...
•
~
-with gas blisters below 326'
~...
-with a few silt seams, shell fragments, and
PUSH
I-.
0 ,..
0
L::...A.
I
-
~
r
calcareous nodules at 327'
,.....
I L
®
-greenish gray, 336' to 348'
•
-with sand pockets and partings
at 337'
PUSH
+ __
--* _____ Jt-
[
L:l.
®
~
-with silt pockets and a few shell fragments at 346'
• -platy below 356'
PUSH"
C
....
•
-blocky, with silt partings at 357'
;
~
-with many silt partings at 367'
~
-with many silt pockets and a few sand seams
PUSH
••
0
•
al 377'
(3B5.0')
DENSE TO VERY DENSE GRAY
'0_
VII ,_ ,
SILTY FINE TO FINE SAND
)
~
• •
VERY
-w;Ih ,;II
STIFF OLIVE GRAy CLAY
.@9B.01
3018"
II=---~==!~==:j::':::
n==I===:j====i
~===1F===i====t===1F===j
~
-platy and expansive, with gas blisters to 438'
PUSH
+ __ ...... _ __
Q....
+
0
L:l.
•
® ®
...
-wilh silt pockets and partings to 418'
-"-- '"
--
PUSH
..
0
.tt-
i
~I
I..
-,and layer at 425'
30115".
~OL
"'" ...
r-
-with a few silt partings at 427'
~
, I
.. -with many sand pockets and shell fragments
20118'
+ _
__.-1-
0 OJ
L:l....
•
®
r
al437'
-clayey sand layer, with many shell fragments
)
~
at 449' ______
----.i4~
PUSH
.......
il-
l
SAMPLING TECHNIQUES
CLASSIFICATION TESTS
STRENGTH TESTS
Number of blows
of
a 175-[b weight (hammer) dropped approximately 5
f(
to produce a
...
SOLUBILITY [N HCL, [%]
®
POCKET PENETROMETER (PPJ
maximum of 24 in. of penetration of a 2.25-in.-OD, 2.125-in.-[D thin-walled tube
•
PERCENT PASSING -zoo S[EVE,
[%]
•
TORVANE
(lV)
sampler.
~PUSH"
denotes a 3.00-in...QD, 2.83-ln.-[0 thin-waUed tube sampler was
•
WATER CONTENT
f:Nj, ['Yo]
~
REMOTE VANE (RV)
,
advanced 24 in. with the weight of the drill shing. 'WOH" denotes a 2.SO-in.-OD,
D
SUBMERGED UNIT WE[GHT (SUW)
•
M[NIATURE VANE (MV)
($-
RESIDUAL (MVres) VALUE)
Z.1Z5-in..ID liner sampler was advanced 24 in. with the weight of the hammer.
... UNCONSOLIDATED UNDRAINED TRIAXIAL (UU)
PLASTIC LIMIT (PL)
LlQU[D LlM[T (LL)
+- - - - - - - - - - - - - - - - - - - - - - +
(Open symbols indicate remolded (r) tests)
LOG OF BORING AND TEST RESULTS
Texas OffshDre Port System, Offshore Terminal Location
BIDCk A-36, Galveston Area
L-______________________________________________________________ -- ___
_____
o
25
50
75
100
125
150
175
200
16
~
225
.:
0
0
0::
III
Q)
(f)
250
;::
0
(jj
OJ
c
0
:;::;
275
III
~
-
Q)
c
a.
Q)
300
325
350
375
400
425
450
475
500
I
~8
I
;0
ro
~
0
"-
z
?
0
N
0
,
'"
0
0
'g
:l!!.
...::
0
0
<=
'"
CD
(J)
:;:
0
Qj
(!J
c
0
:;:;
'"
~
iii
c
CD
D..
m
"
~
N
<T
0
5
10
15
20
25
30
35
40
45
50
55
60
65
70
75
80
85
90
95
100
f}1
Checked By:
7
f!
Approved By:
,tit..--
Daie:
f/;I...
Date
1
(7'
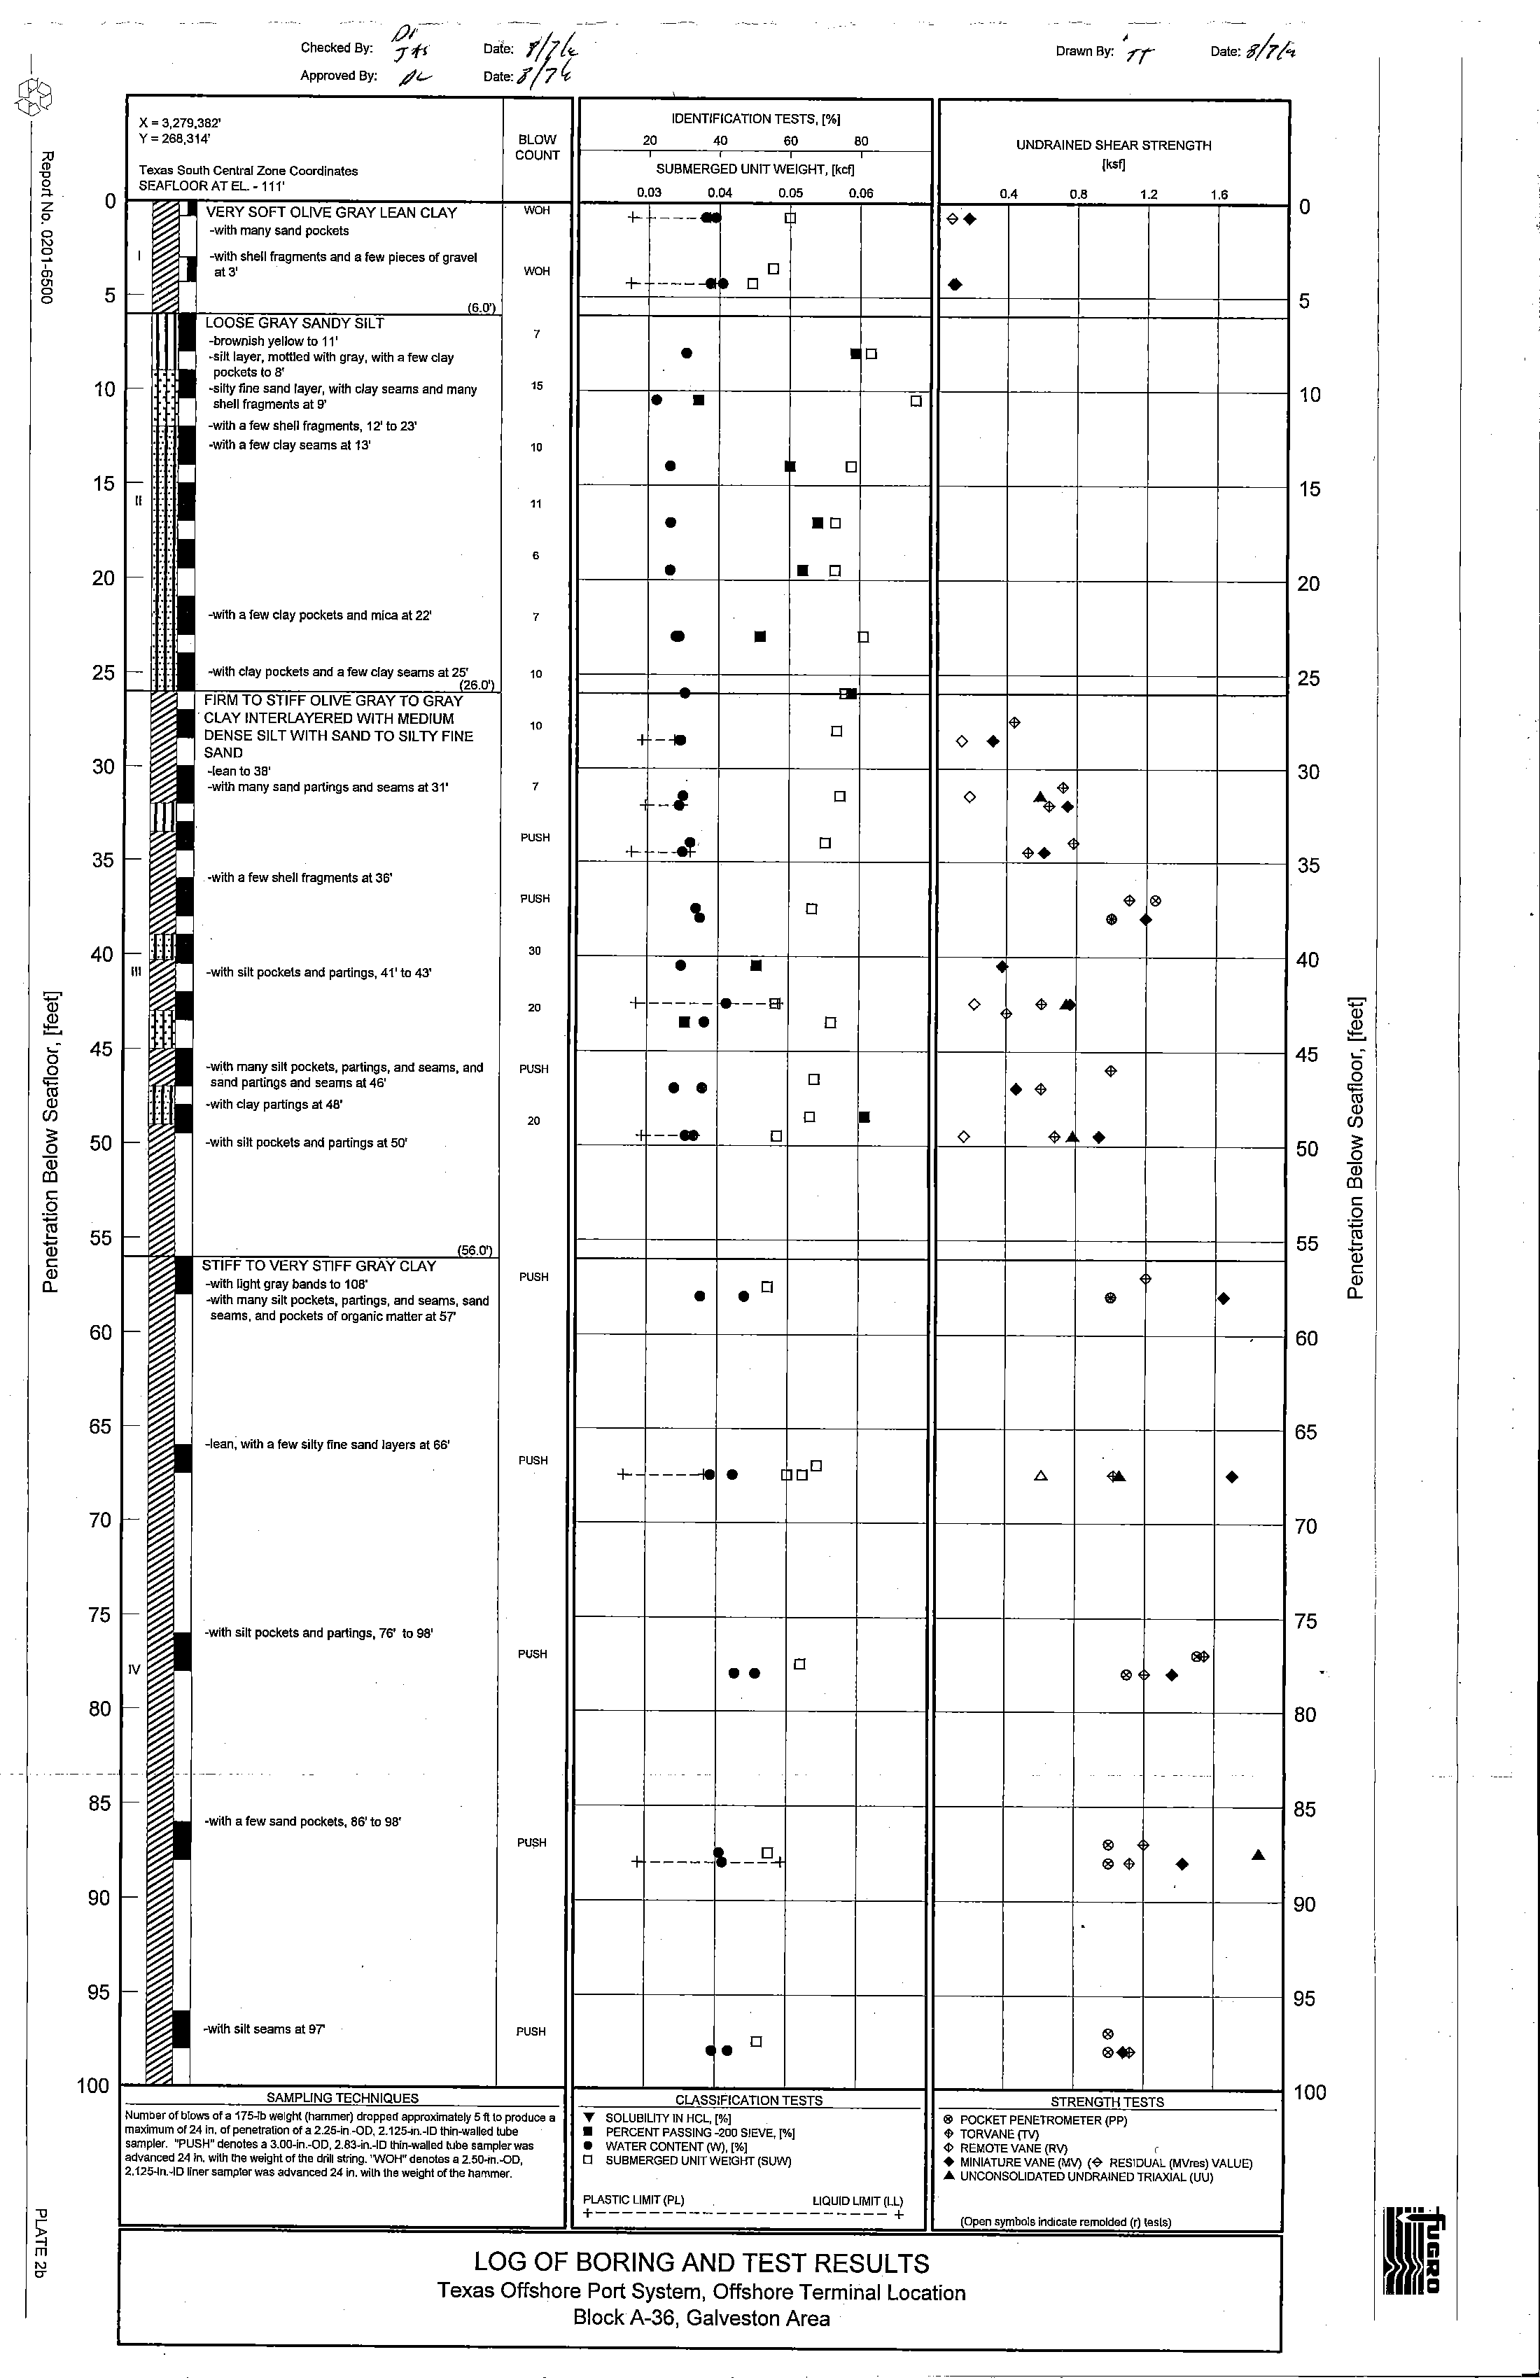
x
=
3,279,382'
y=
268,314'
BLOW
COUNT
Texas South Central Zone Coordinates
SEAFLOOR AT
EL
-111'
~
__ VERY SOFT OLIVE GRAY LEAN ClAY
WOH
-with many sand pockets
I
]
-with shell fragments and a few pieces of gravel
at3'
WOH
f-
(6.0')
LOOSE GRAY SANDY SILT
-brownish yellow to 11'
7
-silt layer, mottled with gray, with a
few clay
pockets to 8'
f-
-silty fine sand layer, with clay seams and many
15
shell fragments
at 9'
-with a few shell fragments, 12' to 23'
-with a few clay seams at 13'
10
f-:
"
11
6
f-:
-with a few clay pockets and mica at 22'
7
f-:
-with clay pockets and a few clay seams at 2
7
;6.0')
10
I-
FIRM TO STIFF OLIVE GRAY TO GRAY
.
ClAY INTERIAYERED WITH MEDIUM
10
DENSE SILT WITH SAND TO SILTY FINE
SAND
[-
~Iean
to 38'
~with
many sand partings and seams
at
31'
7
PUSH
f-
-with a few shell fragments at 36'
PUSH
[- «.
30
III
~with
silt pockets and partings, 41' to 43'
20
[-
~with
many silt pockets, partings, and seams, and
PUSH
sand partings and seams at 46'
-with clay partings
at
48'
..
20
I-
-with silt pockets and partings at 50'
I-
l-
(56.01
I"
STIFF TO VERY STIFF GRAY ClAY
-with light gray bands to 108'
PUSH
-with many silt pockets, partings, and seams, sand
seams, and pockets of organrc matter at 57'
[-
I-~
I
-lean, with a few silty fine sand layers at 66'
PUSH
I-~
~
I-~
I
-with silt pockets and partings, 76' to 98'
PUSH
IV
f-
-
-_
..
-
-
~
-w;lh a few ,and pockets, 86' 10 9B'
PUSH
l-
f-
~
-w," s;(t ,earns at 97'
PUSH
SAMPLING TECHNIQUES
Number of blows of a 175-!b weight (hammer) dropped approXimately 5ft to produce a
maximum of
24 in. of penetration of a 2.25-in -00, 2.125-m.-10 thin-walled tube
sampler. "PUSH" denotes a 3.00-in.-00,2.83-in.-I0 thin-walled rube
sam~erwas
advanced 24 in. with the weight of the drill string. 'WOH" denotes a 2.50-in...QD,
2.125-1n.-ID liner sampler was advanced 24 in. with the weight
of
the hammer.
IDENTIFICATION TESTS, [%1
20
40
60
BO
SUBMERGED UNIT WEIGHT, [kef]
0.03
0.04
0.05
0.06
+-
---
..
0
+-
---_e
• 0
•
I
0
•
•
0
•
0
•
.0
•
•
0
•
•
p
1
---
0
-I
0
+-
-~
0
\
0
•
•
+------
i----
EIf
••
0
• •
0
0
•
,
--R
0
•
.0
+--
----
•
DO
••
0
+ -----
~--P.,
,
.
0
CLASSIFICATION TESTS
..,.. SOLUBILITY IN HCl, [%]
•
PERCENT PASSING -200 SIEVE,
[%]
•
WATER CONTENT
f'N), [%]
0
SUBMERGED UNIT WEIGHT (SUW)
PLASTIC
LIMIT (Pl)
liQUID liMIT (ll)
+----------------------+
LOG OF BORING AND TEST RESULTS
Drawn By:
rr
Date:
8'/r;:.
UNDRAINED SHEAR STRENGTH
[ksij
0.4
O.B
1.2
1.6
~.
•
~
<>
•
<>
"'*~
$.
<
~
®
•
~
<>
$ ...
~
•
$
<>
$
•
•
•
'"
<[010.
•
~
®
•
®
....
®~
•
®
®*
STRENGTH TESTS
®
POCKET PENETROMETER (PP)
~
TORVANE
(TV)
<I> REMOTE VANE (RY)
c
•
MINIATURE VANE (MY)
(-e-
RESIDUAL (MVres) VALUE)
..... UNCONSOLIDATED UNDRAINED TRIAXIAL (UU)
(Open symbols indicate remolded
(r) tesLs)
Texas Offshore Port System, Offshore Terminal Location
Block A-36, Galveston Area
o
5
10
15
20
25
30
35
40
'g
:l!!.
45
~-
0
0
<=
'"
CD
(J)
50
~
Qj
(!J
.Q
-
"
55
ro
~
-
CD
"
CD
D..
60
65
70
75
80
85
90
95
100
1-
l.
~
h
r.
T
"
D
~
l
D
~
1
~
.
.
~
I\;
0;",
\
I D
"
jj
.
D
.
~
..
J
. /'!;-
~
>.
>.
m m
I
~ ~
>
-~
"
£
~
U
~
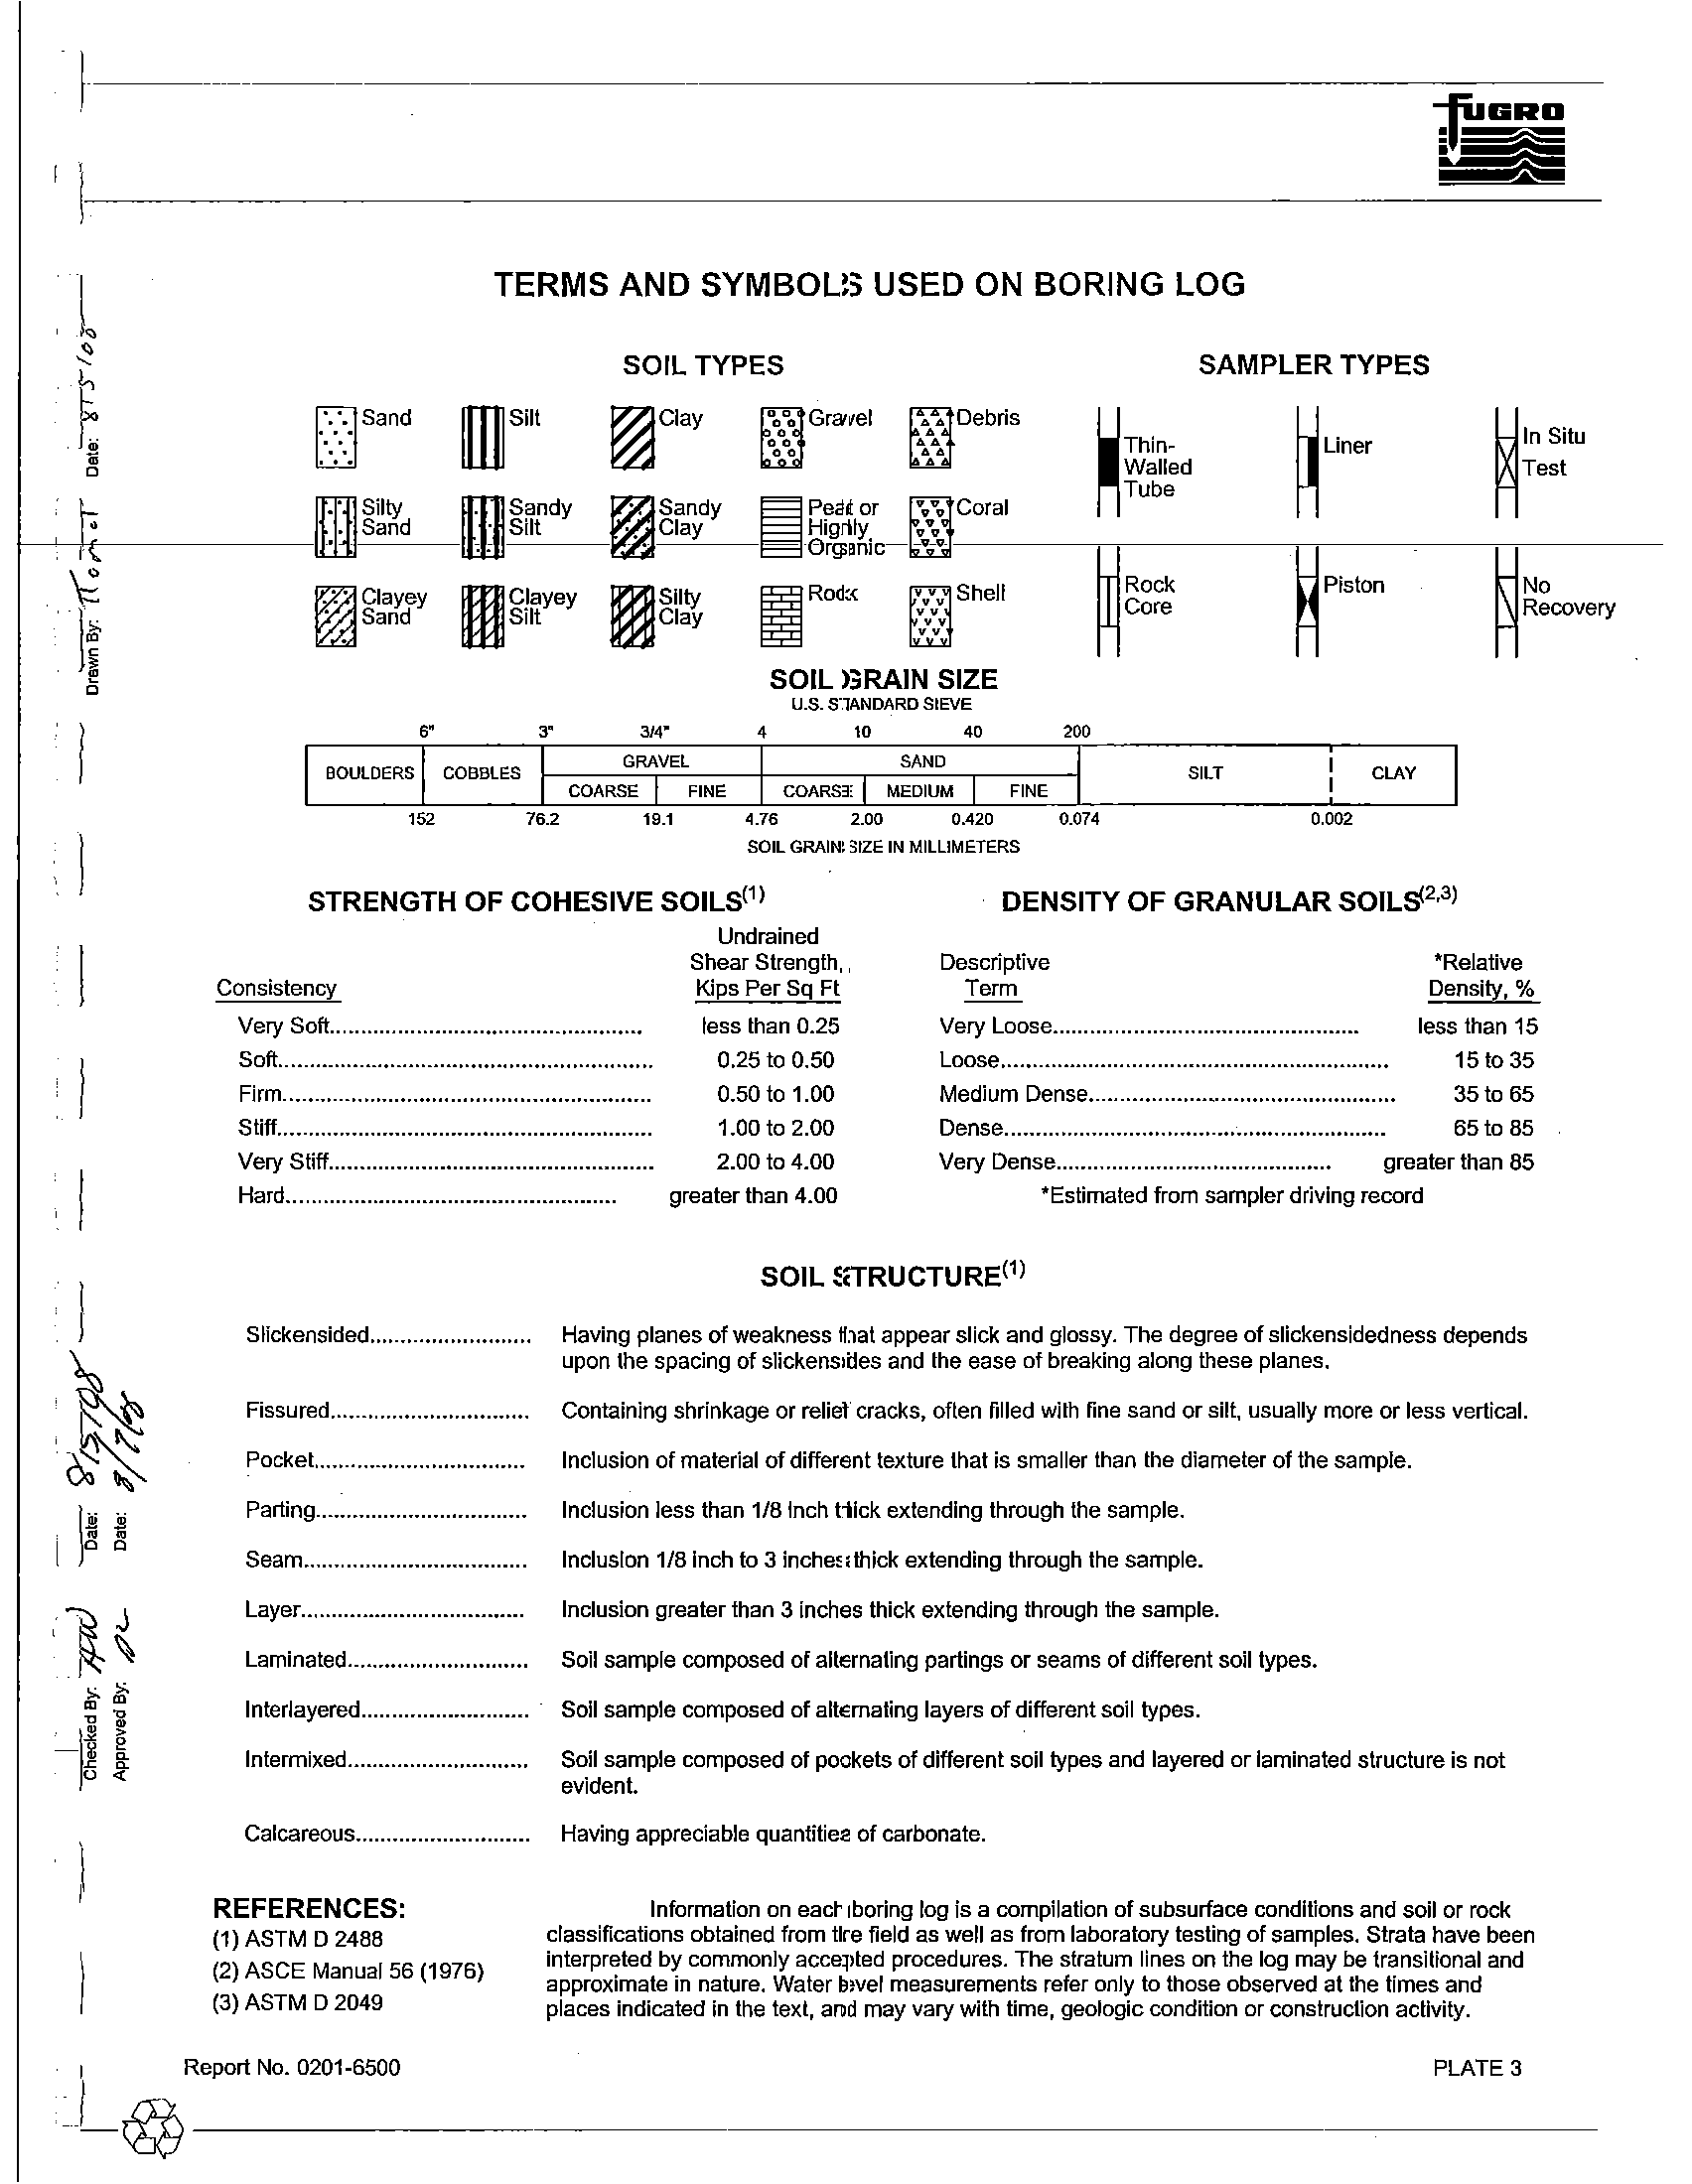
TERMS AND SYMBOLS USED ON BORING LOG
SOIL TYPES
SAMPLER TYPES
[ISand
m
Siit
~Clay
DODO
Gravel
[J0ebriS
~Liner
•
~In
Situ
••
•
•
~Thin-
...
••
•
•
Walled
Test
Tube
IITll
Silty
mSandY
~SandY
~
Peat or
",,""v
Coral
• Sand
. Silt
. Clay
Highly
,,"v
-0rganic-
_v_v_
~Piston
~Clayey
mClayey
m
SlIty
I
Rock
:v:v
Shell
~ROCk
~NO
Core
Recovery
•
Sand
Silt
Clay
yYvV
SOIL GRAIN SIZE
u.s. STANDARD SIEVE
,"
3"
314"
4
I.
4.
200
GRAVEL
SAND
SILT
CLAV
COARSE
FINE
COARSE
MEDIUM
FINE
152
76.2
19.1
4.76
2.00
0.420
0.074
0.002
SOIL GRAIN SIZE IN MILLIMETERS
STRENGTH OF COHESIVE SOILS(1)
Undrained
DENSITY OF GRANULAR SOILg(2.3)
Consistency
Very Soft..................................................
Soft............................................................
Firm...........................................................
StilL.........................................................
Shear Strength,
Kips Per Sq
Ft
Descriptive
Term
Very Loose.................................................
Loose....•........................................................•
Medium Dense.................................................
Dense.............................................................
*ReJative
Density,
%
less than 15
15t035
35 to 65
65 to
85
Very Sliff....................................................
less than 0.25
0.25 to 0.50
0.50101.00
1.00 to 2.00
2.00 to 4.00
Very Dense............................................ greater than 85
Hard..................................................... greater than 4.00
*Estimated from sampler driving record
SOIL STRUCTURE(1)
Slickensided..........................
Having planes of weakness that appear slick and glossy. The degree of slickensided ness depends
upon the spacing
of slickensides and the ease of breaking along these planes.
Fissured................................
Containing shrinkage or relief cracks, often filled with fine sand
or silt, usually more or less vertical.
PockeL...............................
Inclusion
of material of different texture that is smaller than the diameter of the sample.
Parting..................................
InclUsion less than
1/Binch thick extending through the sample.
Seam....................................
InclusIon
1/8
Inch to 3 inches thick extending through the sample.
Layer... ................................. Inclusion greater than 3 inches thick extending through the sample.
Laminated.............................
Soil sample composed
of alternating partings or seams of different soil types.
Interlayered...........................
Soli sample composed
of alternating layers of different soil types.
Intermixed.............................
Soil sample composed of pockets
of different soil types and layered or laminated structure is not
evident.
Calcareous............................
REFERENCES:
(1) ASTM D 2488
(2) ASCE Manual 56 (1976)
(3) ASTM D 2049
Having appreciable quantities of carbonate.
Information on each boring log is a compilation of subsurface conditions and soil or rock
classifications obtained from the field as well as from laboratory testing
of samples. Strata have been
interpreted
by commonly accepted procedures. The stratum lines on the log may be transitional and
approximate in nature. Water level measurements refer only to those observed at the times and
places indicated in the text, and may vary with time, geologic condition or construction activity.
I
Report No. 0201-6500
PLATE 3
I_@ ____
~----------
~
~
lr,
:1
'::Z
il
t
.
1,-
i
il
1~
c:J~
oJ
J
r
m
>-
"1
~
0
I
,
490
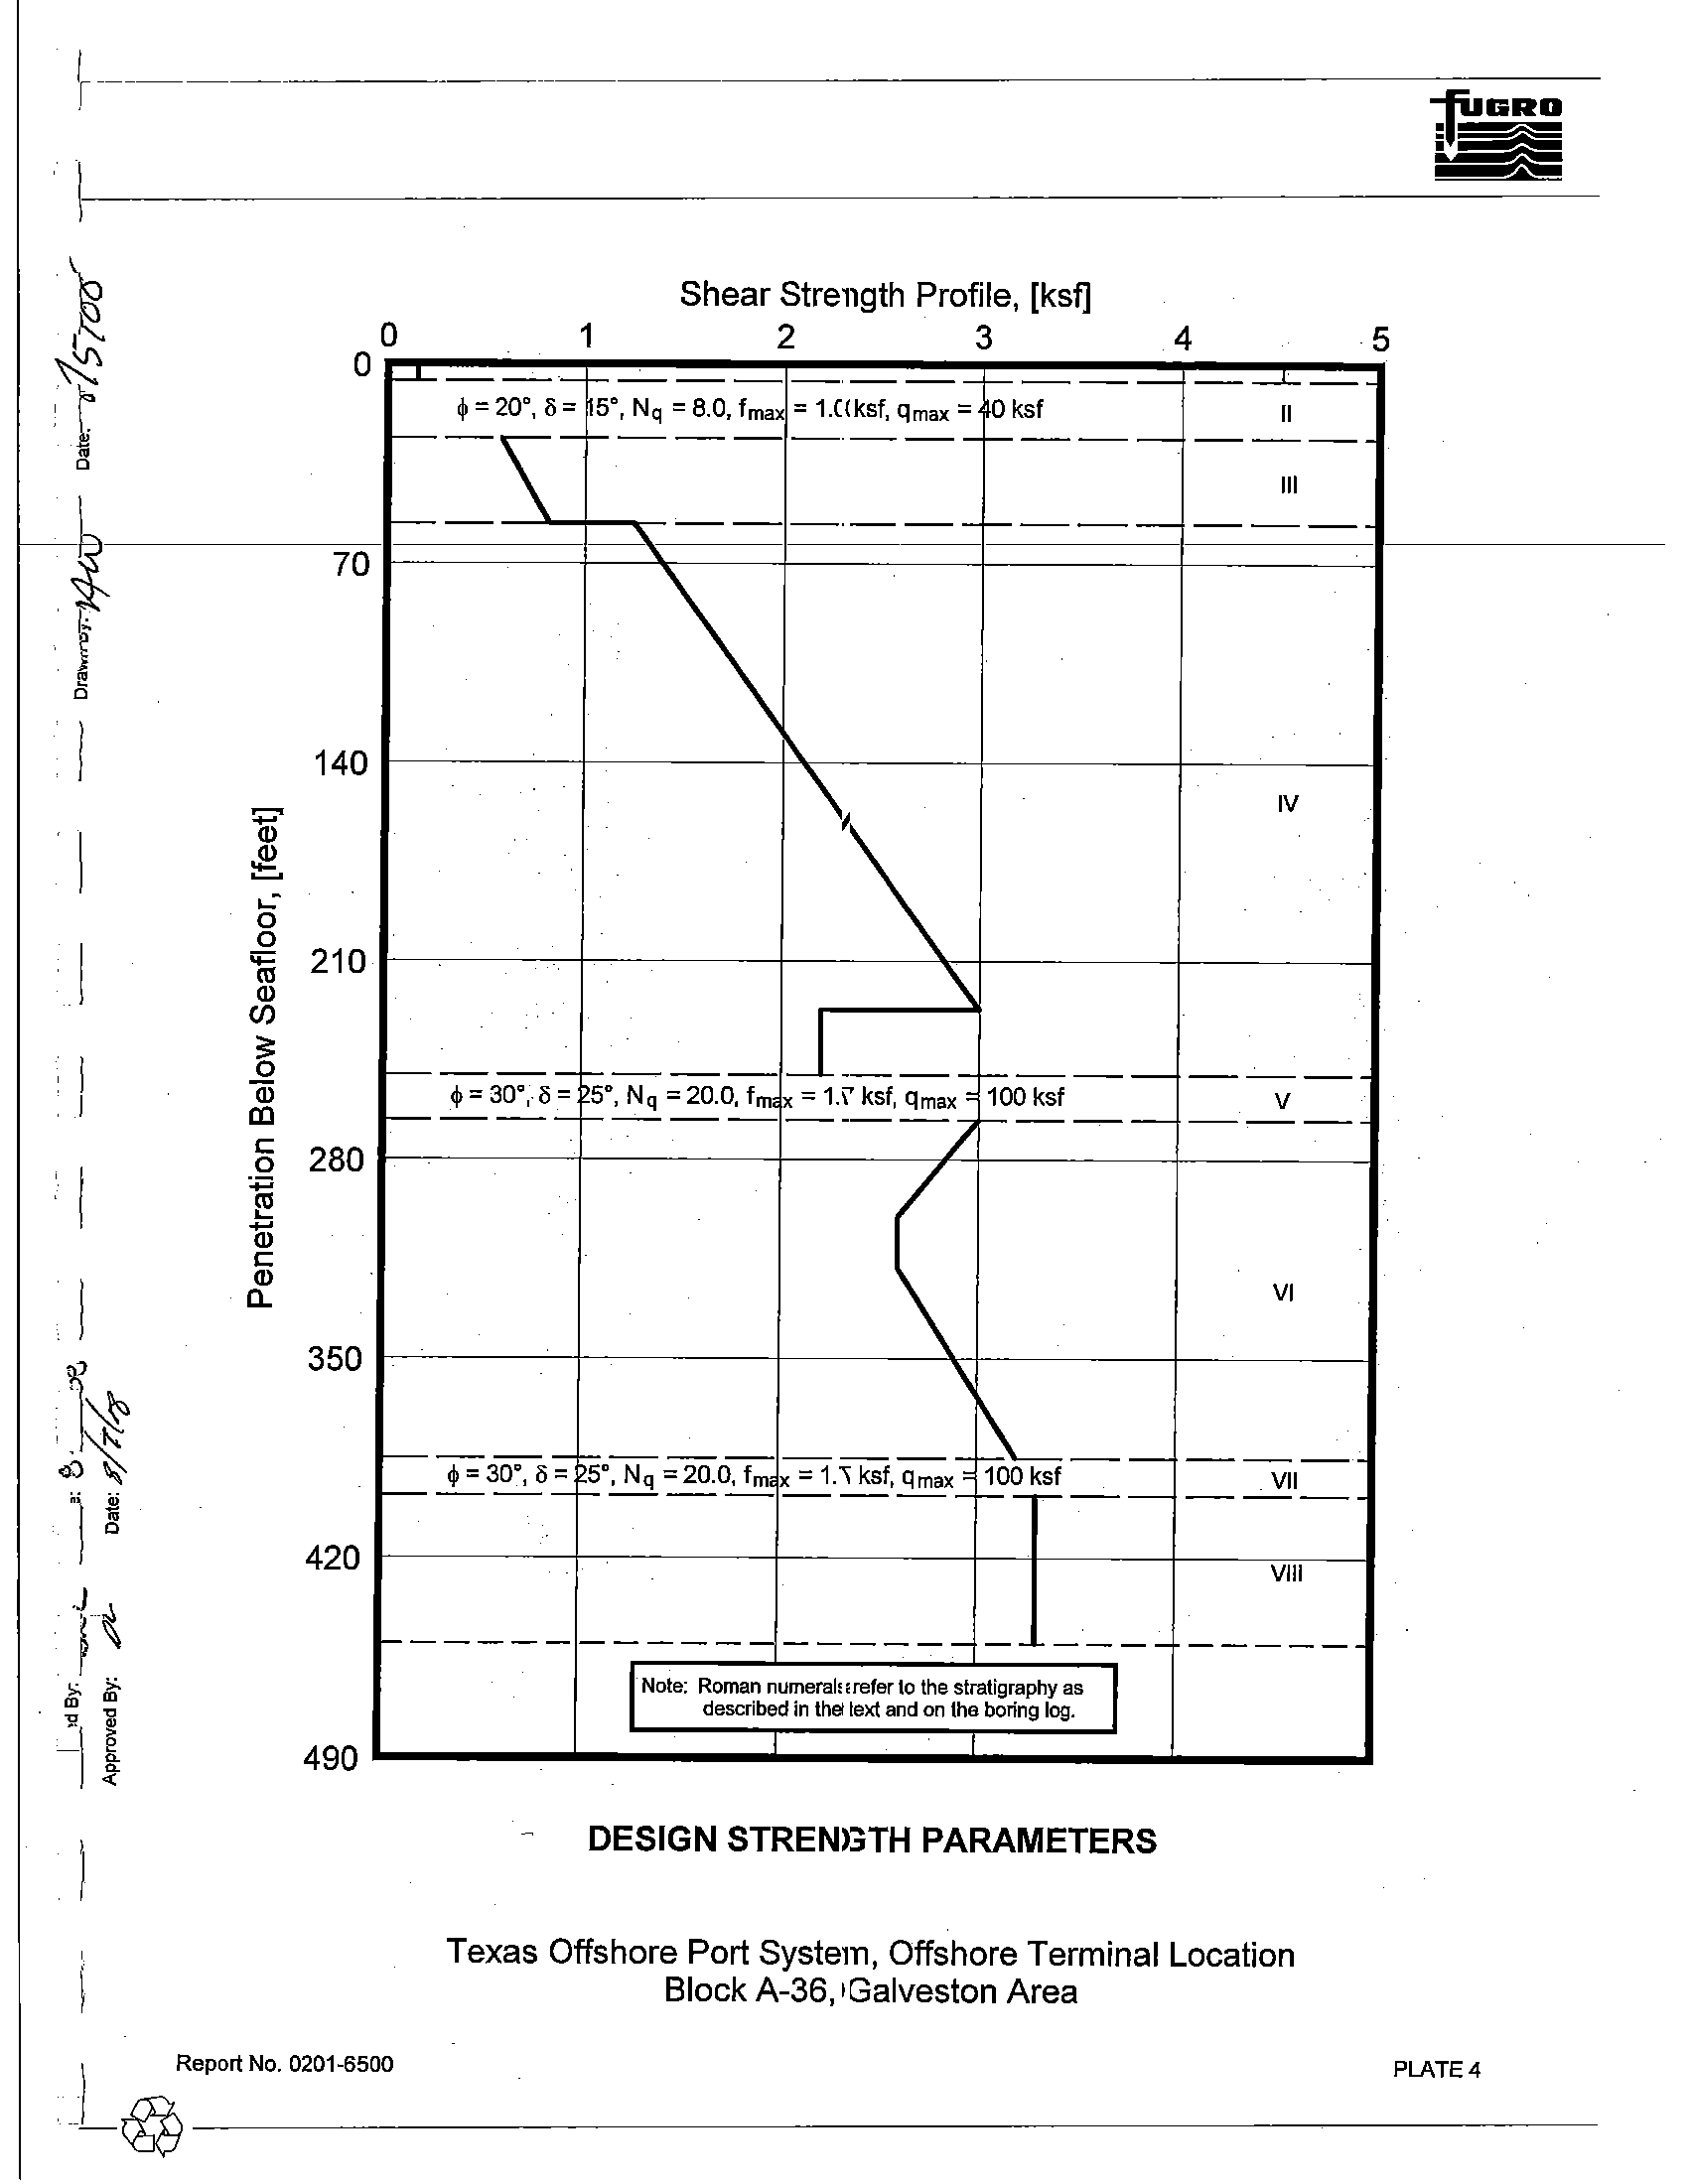
Shear Strength Profile, [ksf]
o
1
2
3
4
5
1--1----.-
---------
-
_.-
.--"-_.-
-
~:-~=-
5°, Nq : 8.0,
Imax
: 1.0 ksl,
qmax
=
o
ksf
II
------------- ------
III
f--
--
'-
--
\
,
IV
..
'\
f...-----1----
11 ____
1-----
------
$=30°,~=
5°, Nq = 20.0,
1m
x:
1.7 ksf,
qmax '
100 ksf
V
f------
1-----
---;
1----- -----
7
\
VI
,
f-- $ = 300, i; ;-
tc----
r\
x
= 1.7 ksf,
qmax '
100ksf---
------
;S,
Nq =20.0,
1m
VII
1------
1----
--_:.-
1--,----
------
VIII
1------
------ ------
-
---- ------
rNote: Roman numerals refer to the stratigraphy as
I
described in the text and on the boring log.
I
DESIGN STRENGTH PARAMETERS
Texas Offshore Port System, Offshore Terminal Location
Block A-36, Galveston Area
PLATE 4
I
Report No. 0201-6500
...-@----------------
·~
I
~
o
"
'~
\!
o
~
I
<fl
1
0
~
0~
..
~
o
~
0
~
,
...)
I
~
,
>.
>.
'"
'"
I
OJ
OJ
1i
.
~
~
~
~
o
:t
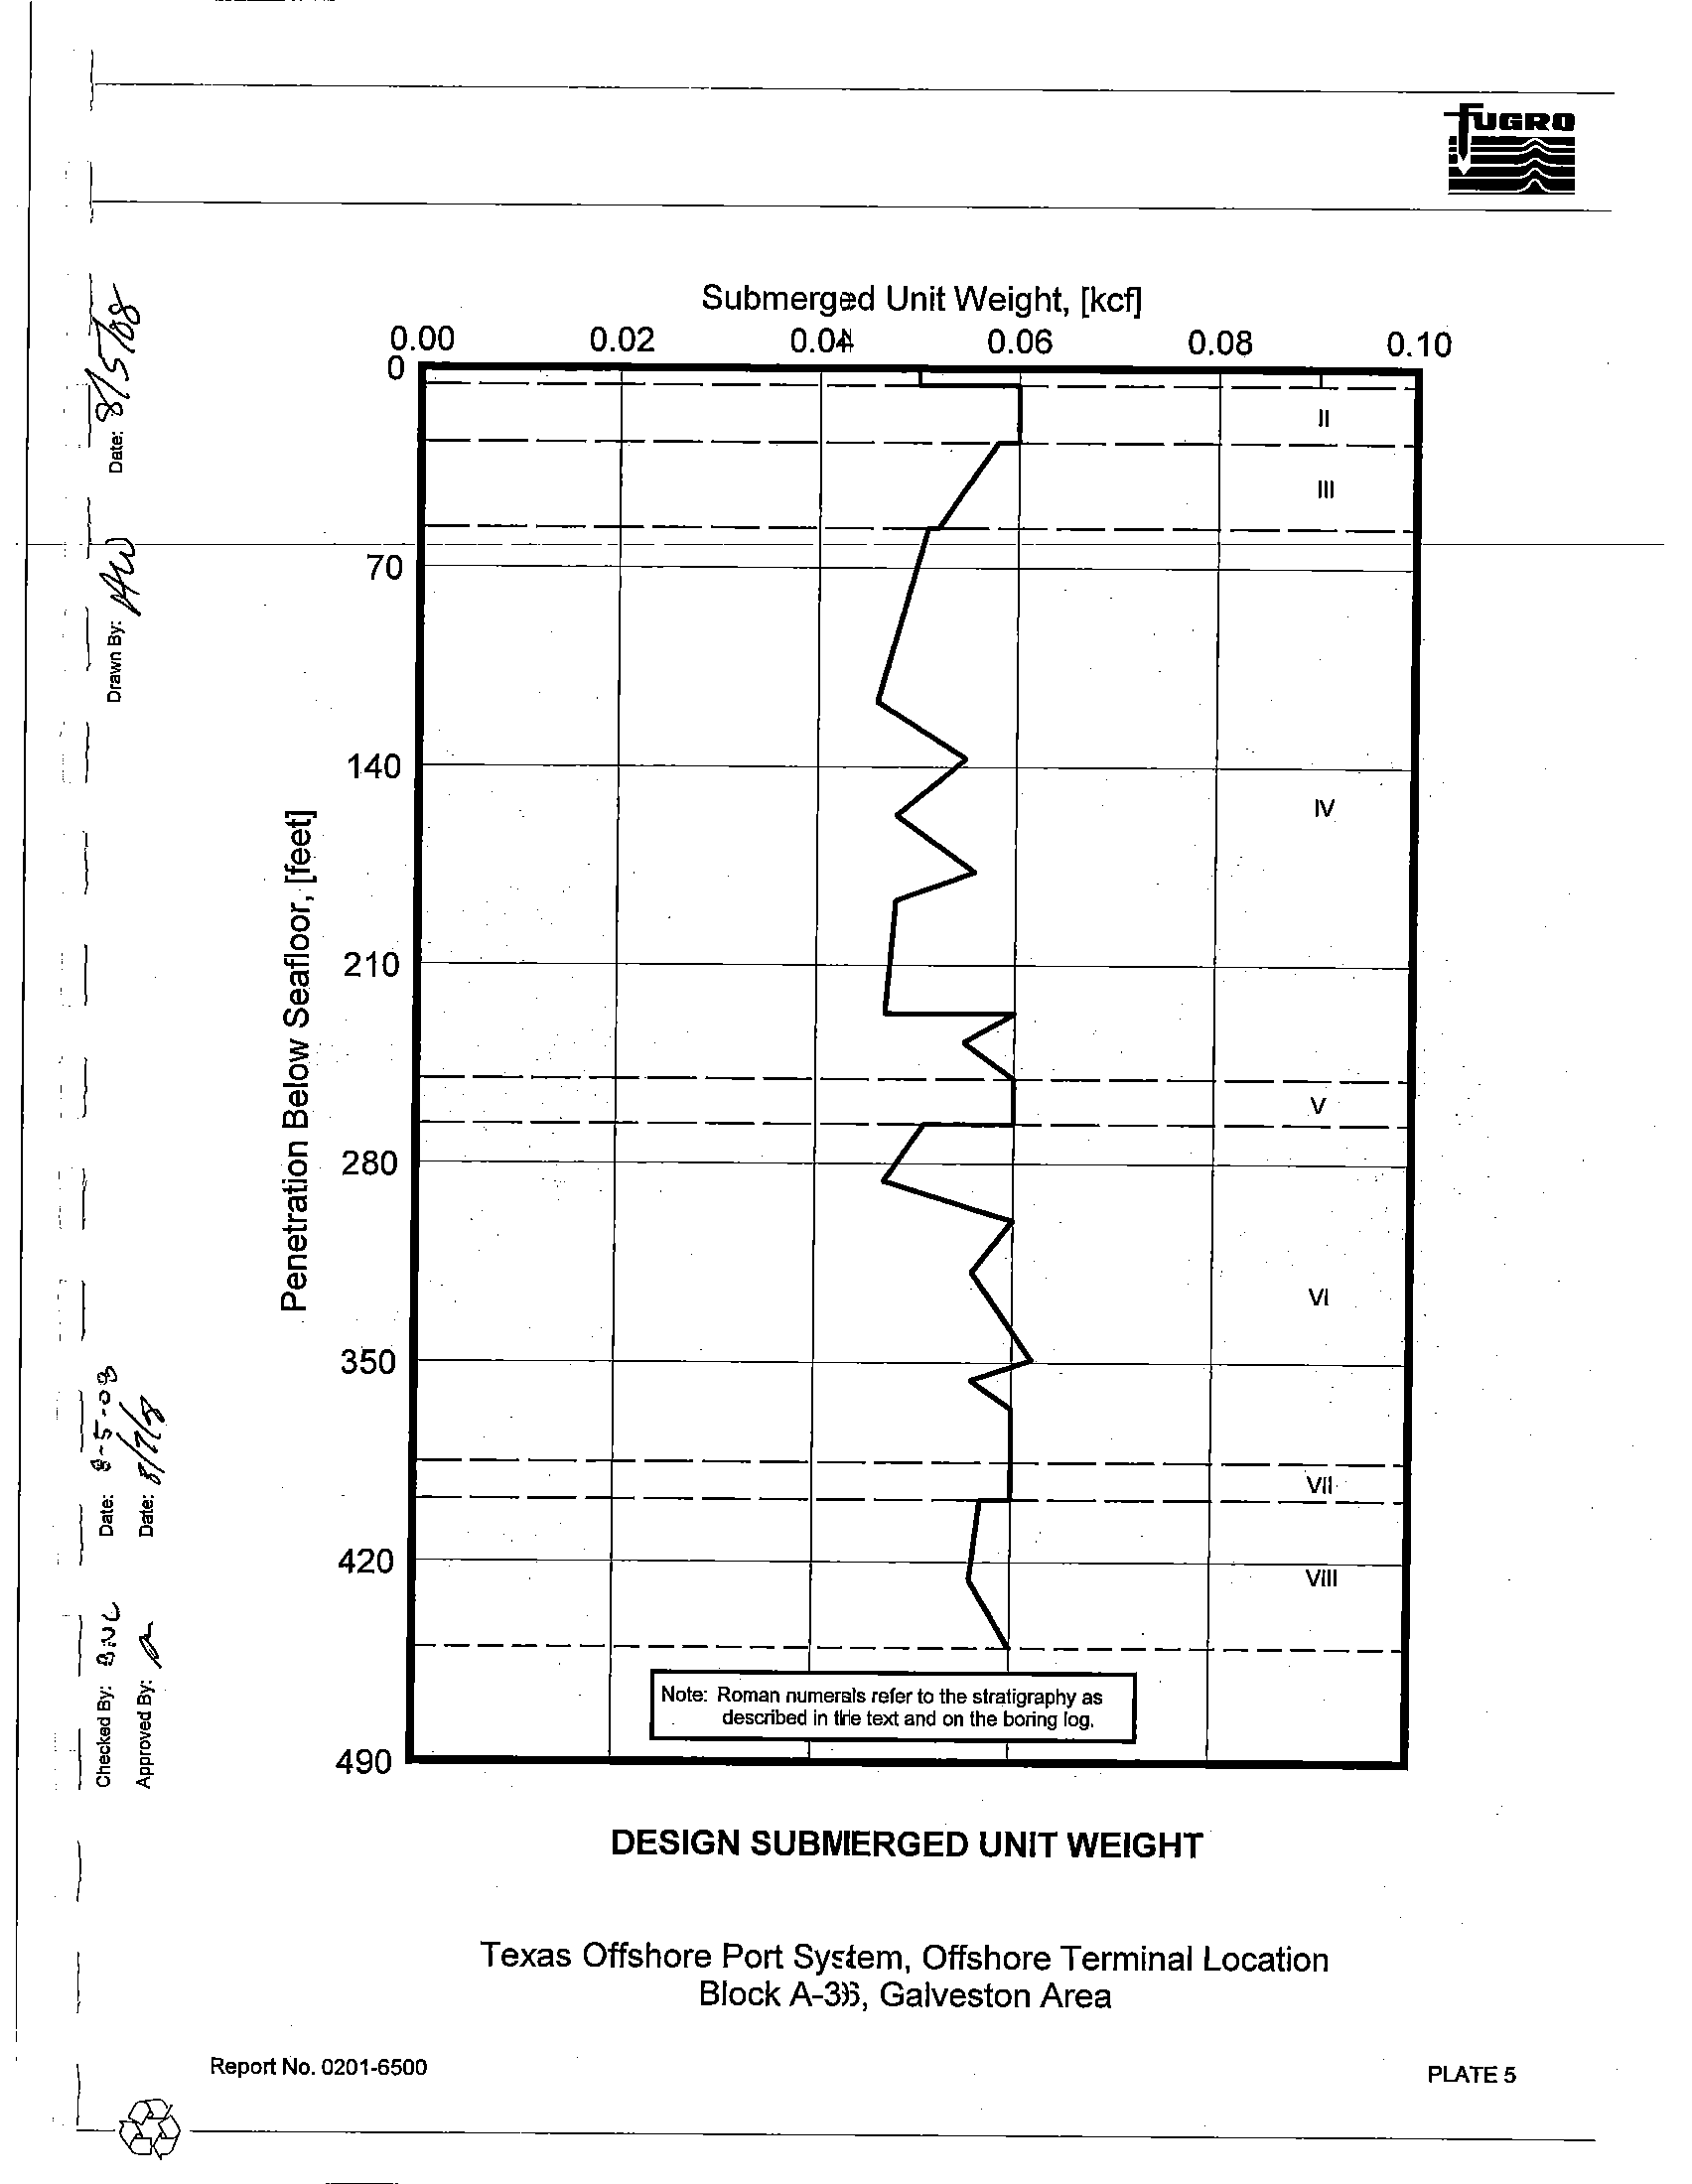
Submerged Unit Weight, [kcf]
o
0.00
r-----
0.02
0.04
0.06
0.08
0.10
.--L
~
~
..:
o
70
140
iii
210
Q)
(/)
;=
.Q
Q)
m
c
.Q 280
~
c
a.
Q)
350
420
490
.-
-
-
II
1---,-
----
--7
'----
------
III
r-------.-
----
,-
----------
--------
I
,
S
IV
---.-
1----
--~
r---,-
------
V
--,---'.-
1----
-/
--'-
------
,
'<
VI
r\
"
1---'-
----
---,-
f----.-
------
1---,-
----
-.-
VII
----
------
VIII
1------
------
----_\ ------
------
Back to top
I
Note: Roman numerals refer to the stratigraphy as
I
_
described in the text and on the bOring log.
,
,
DESIGN SUBMERGED UNIT WEIGHT
Texas Offshore Port System, Offshore Terminal Location
Block A-36, Galveston Area
I
Report No.
0201-6500
PLATE 5
-~---------------------------------
I--
I
-<2a
or:
;~
1'1
-1-
I~
0
~
I
"'"
Ql
~
..:-
0
0
'iii
Ql
(J)
~
Ql
OJ
c
0
:;::>
~
-
c
Ql
. )
c..
Ql
.p
0)
ll.
~
,~
0::>.)
'"
I" -.
iii tl
Q
0
J
I~ ~
~
if;
log
og
g E
~
~
o
:t
Unit Skin Friction, [ksf]
o
1
o
~=
2
3
4
I-
.-
_ --L...
70
140
210
280
350
420
490
--
1------
1------
r----.-
--_.-
------
:-
.-
II
----
--_.-
r---.-
------
III
----
--_.-
1----- ------
"'-
Notes:
1. Roman numerals refer to the stratigraphy as
.described in the text and on the boring log.
2. Tension and compression curves coincide.
-
IV
'\.
I
-
-
--
----
---_.-
--_
..
I
V
--
_.-
--_.-
/
/
\
VI
"
f--
\
_.-
------
I
VII
1--
_.-
------
VIII
------ ------ -- ---- -----
UNIT SKIN FRICTION
API RP
2A (2000) Method
Texas Offshore Port System, Offshore Terminal Location
Block A-36, Galveston Area
5
)
Report No. 0201.6500
PLATE 6
-~@-----------
1-
I
~
.~
I~
"
\
.~
I
"
~
I
OJ
~
.:
0
I
;;::::
0
ctI
OJ
rn
:I
s:
0
OJ
III
c:
,I
0
:;:::;
-
....
ctI
c:
OJ
I
a.
OJ
..l)
()
li,~
\~
<0
...
I
~
~
Ii \\
~
{j;
~
~
~i
•
e
>
~
-<
~
I
iii
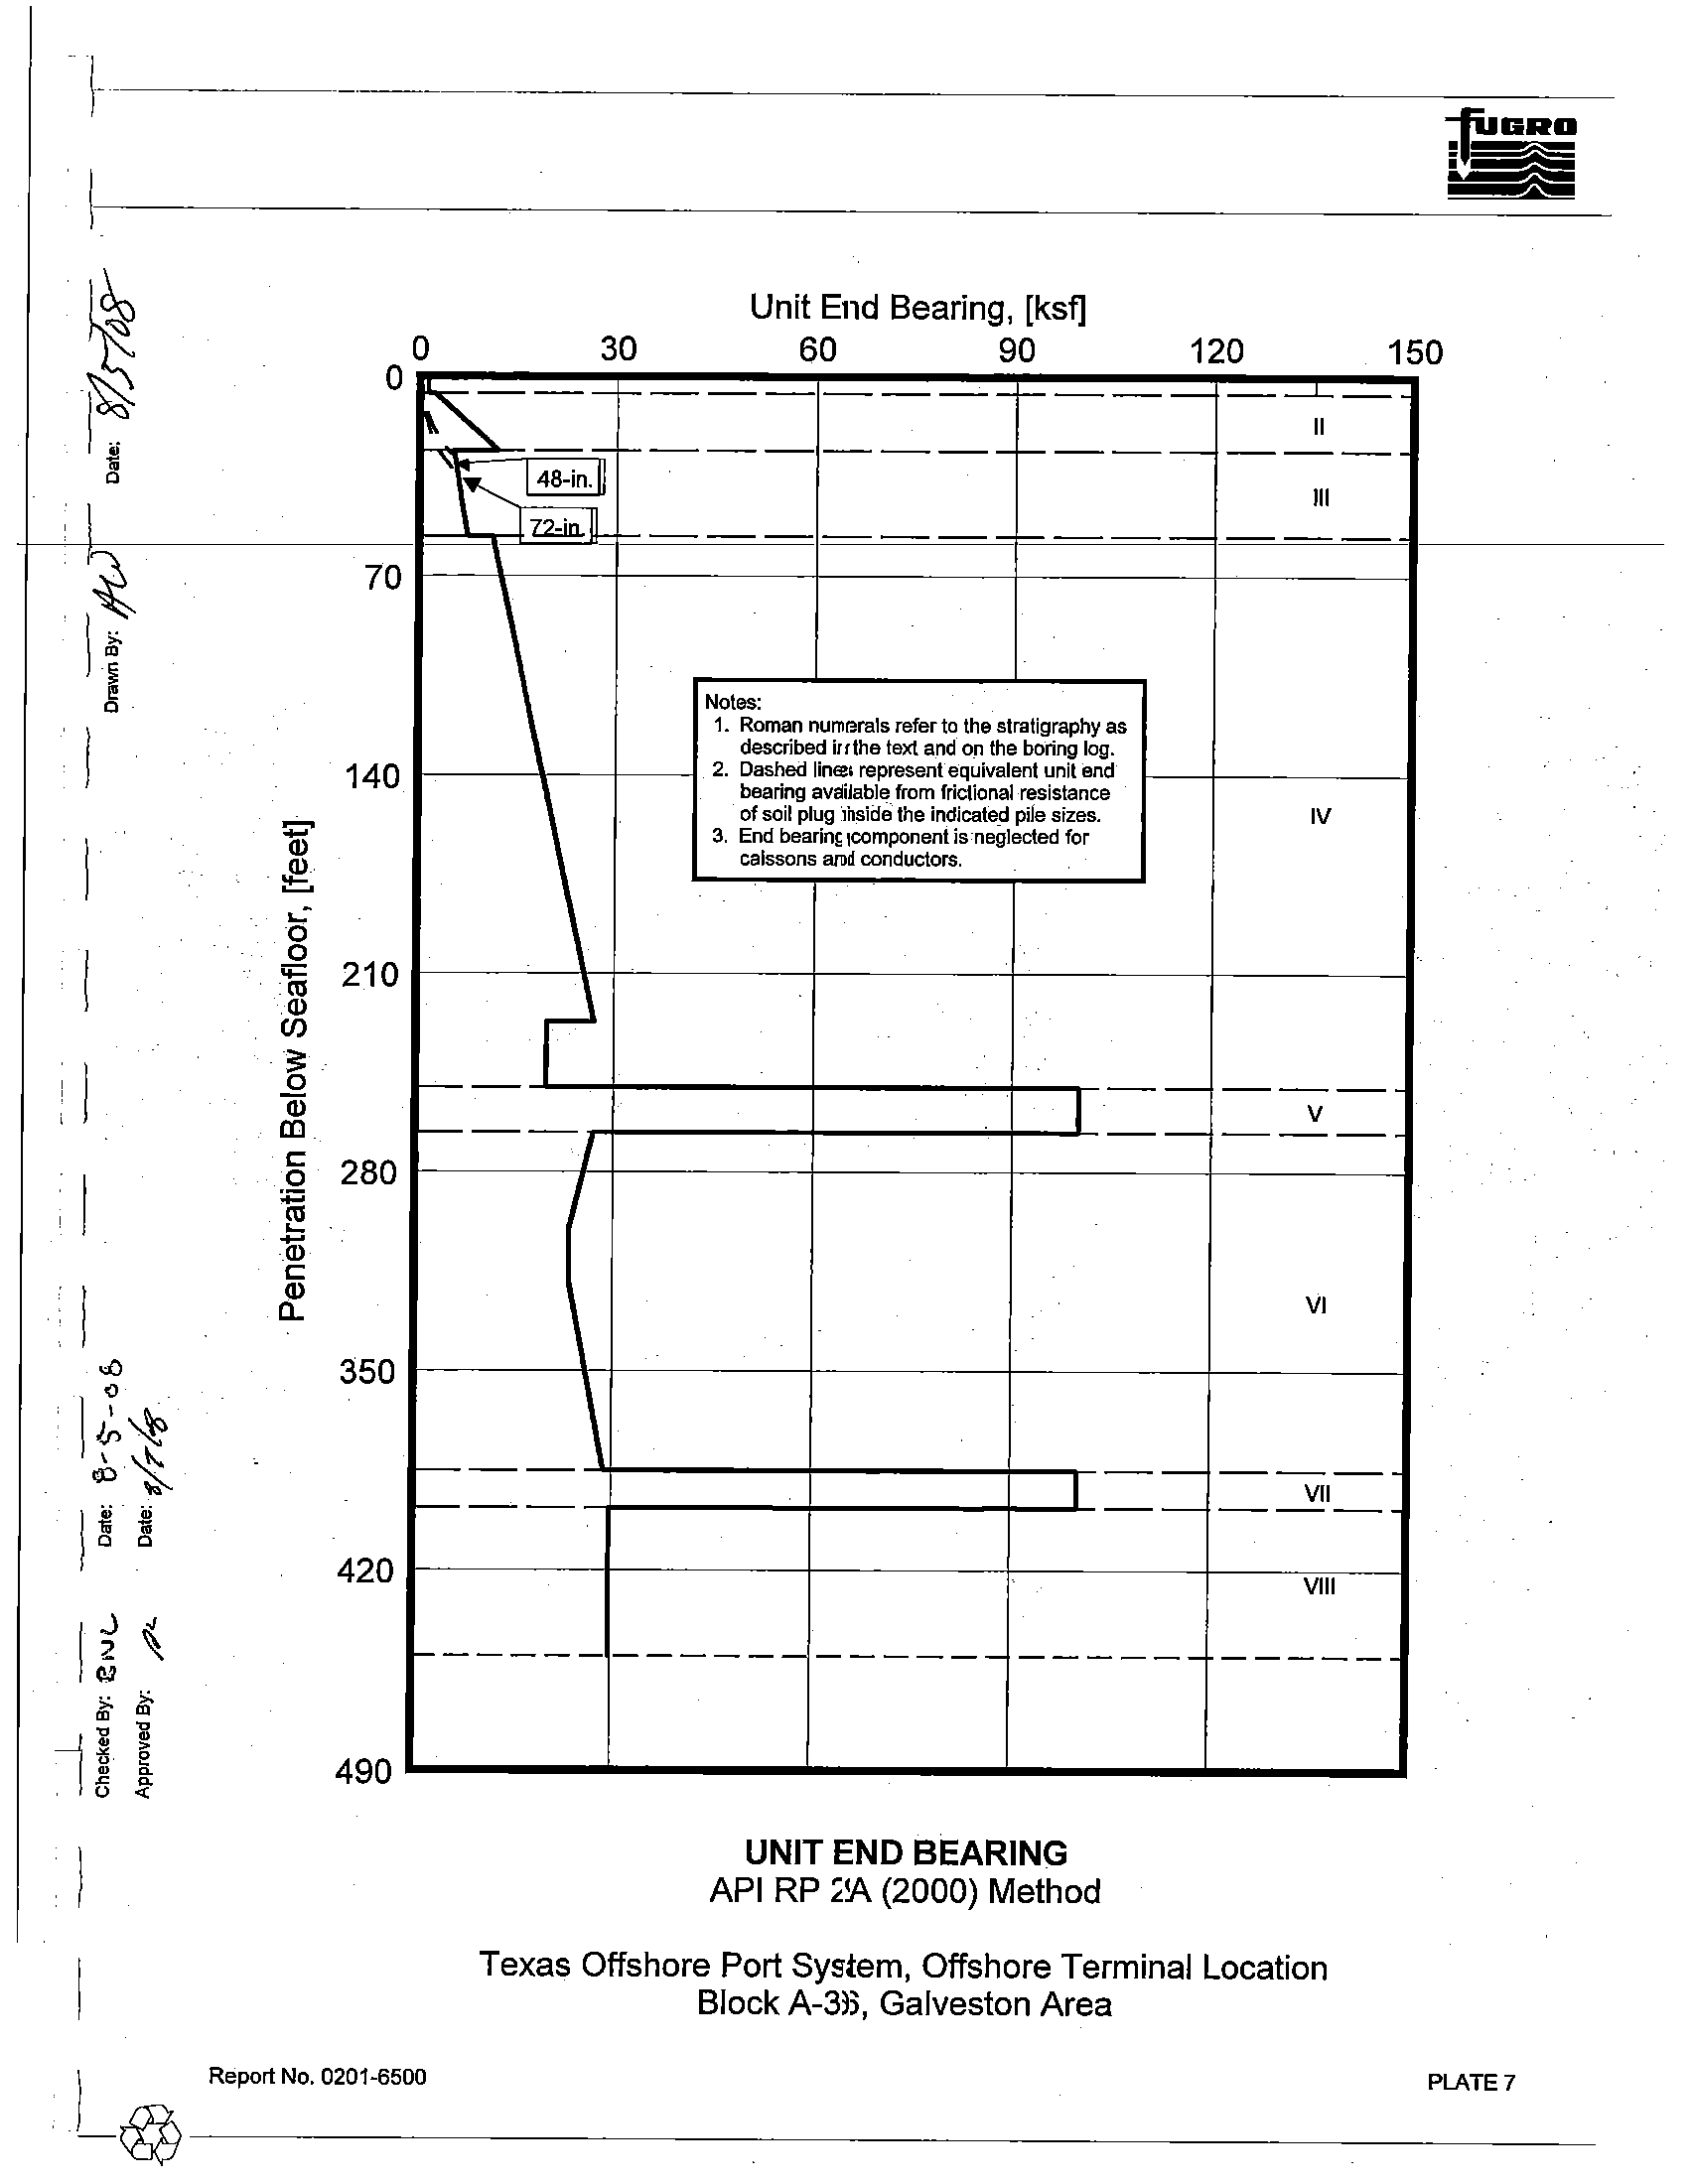
Unit End Bearing, [ksf]
0
30
60
90
120
150
o~
--c-
--
f-
.-
_--L
II
f---.-
70
140
210
280
350
420
490
---
-----
---
~
48-in.1I
III
I
Z2:in.1l
\
Notes:
1. Roman numerals refer to the stratigraphy as
\
described in the text and on the boring log.
2. Dashed lines represent equivalent unit end
\
bearing available. from frictional resistance
of soil plug inside the indicate_d pile sizes.
IV
3. End bearing component is -neglected for
caissons and conductors.
r
c---
.-
--_.-
I
V
'----I
_.-
---
I
VI
---
.-
---
,----
I
_.-
_~I_.-
VIII
------
------------
------1 -----1
UNIT END BEARING
API RP
2A (2000) Method
Texas Offshore Port System, Offshore Terminal Location
Block A-36, Galveston Area
I
Report No. 0201-6500
PLATE 7
-~---------------------------------
~------
-
iii
~
-~
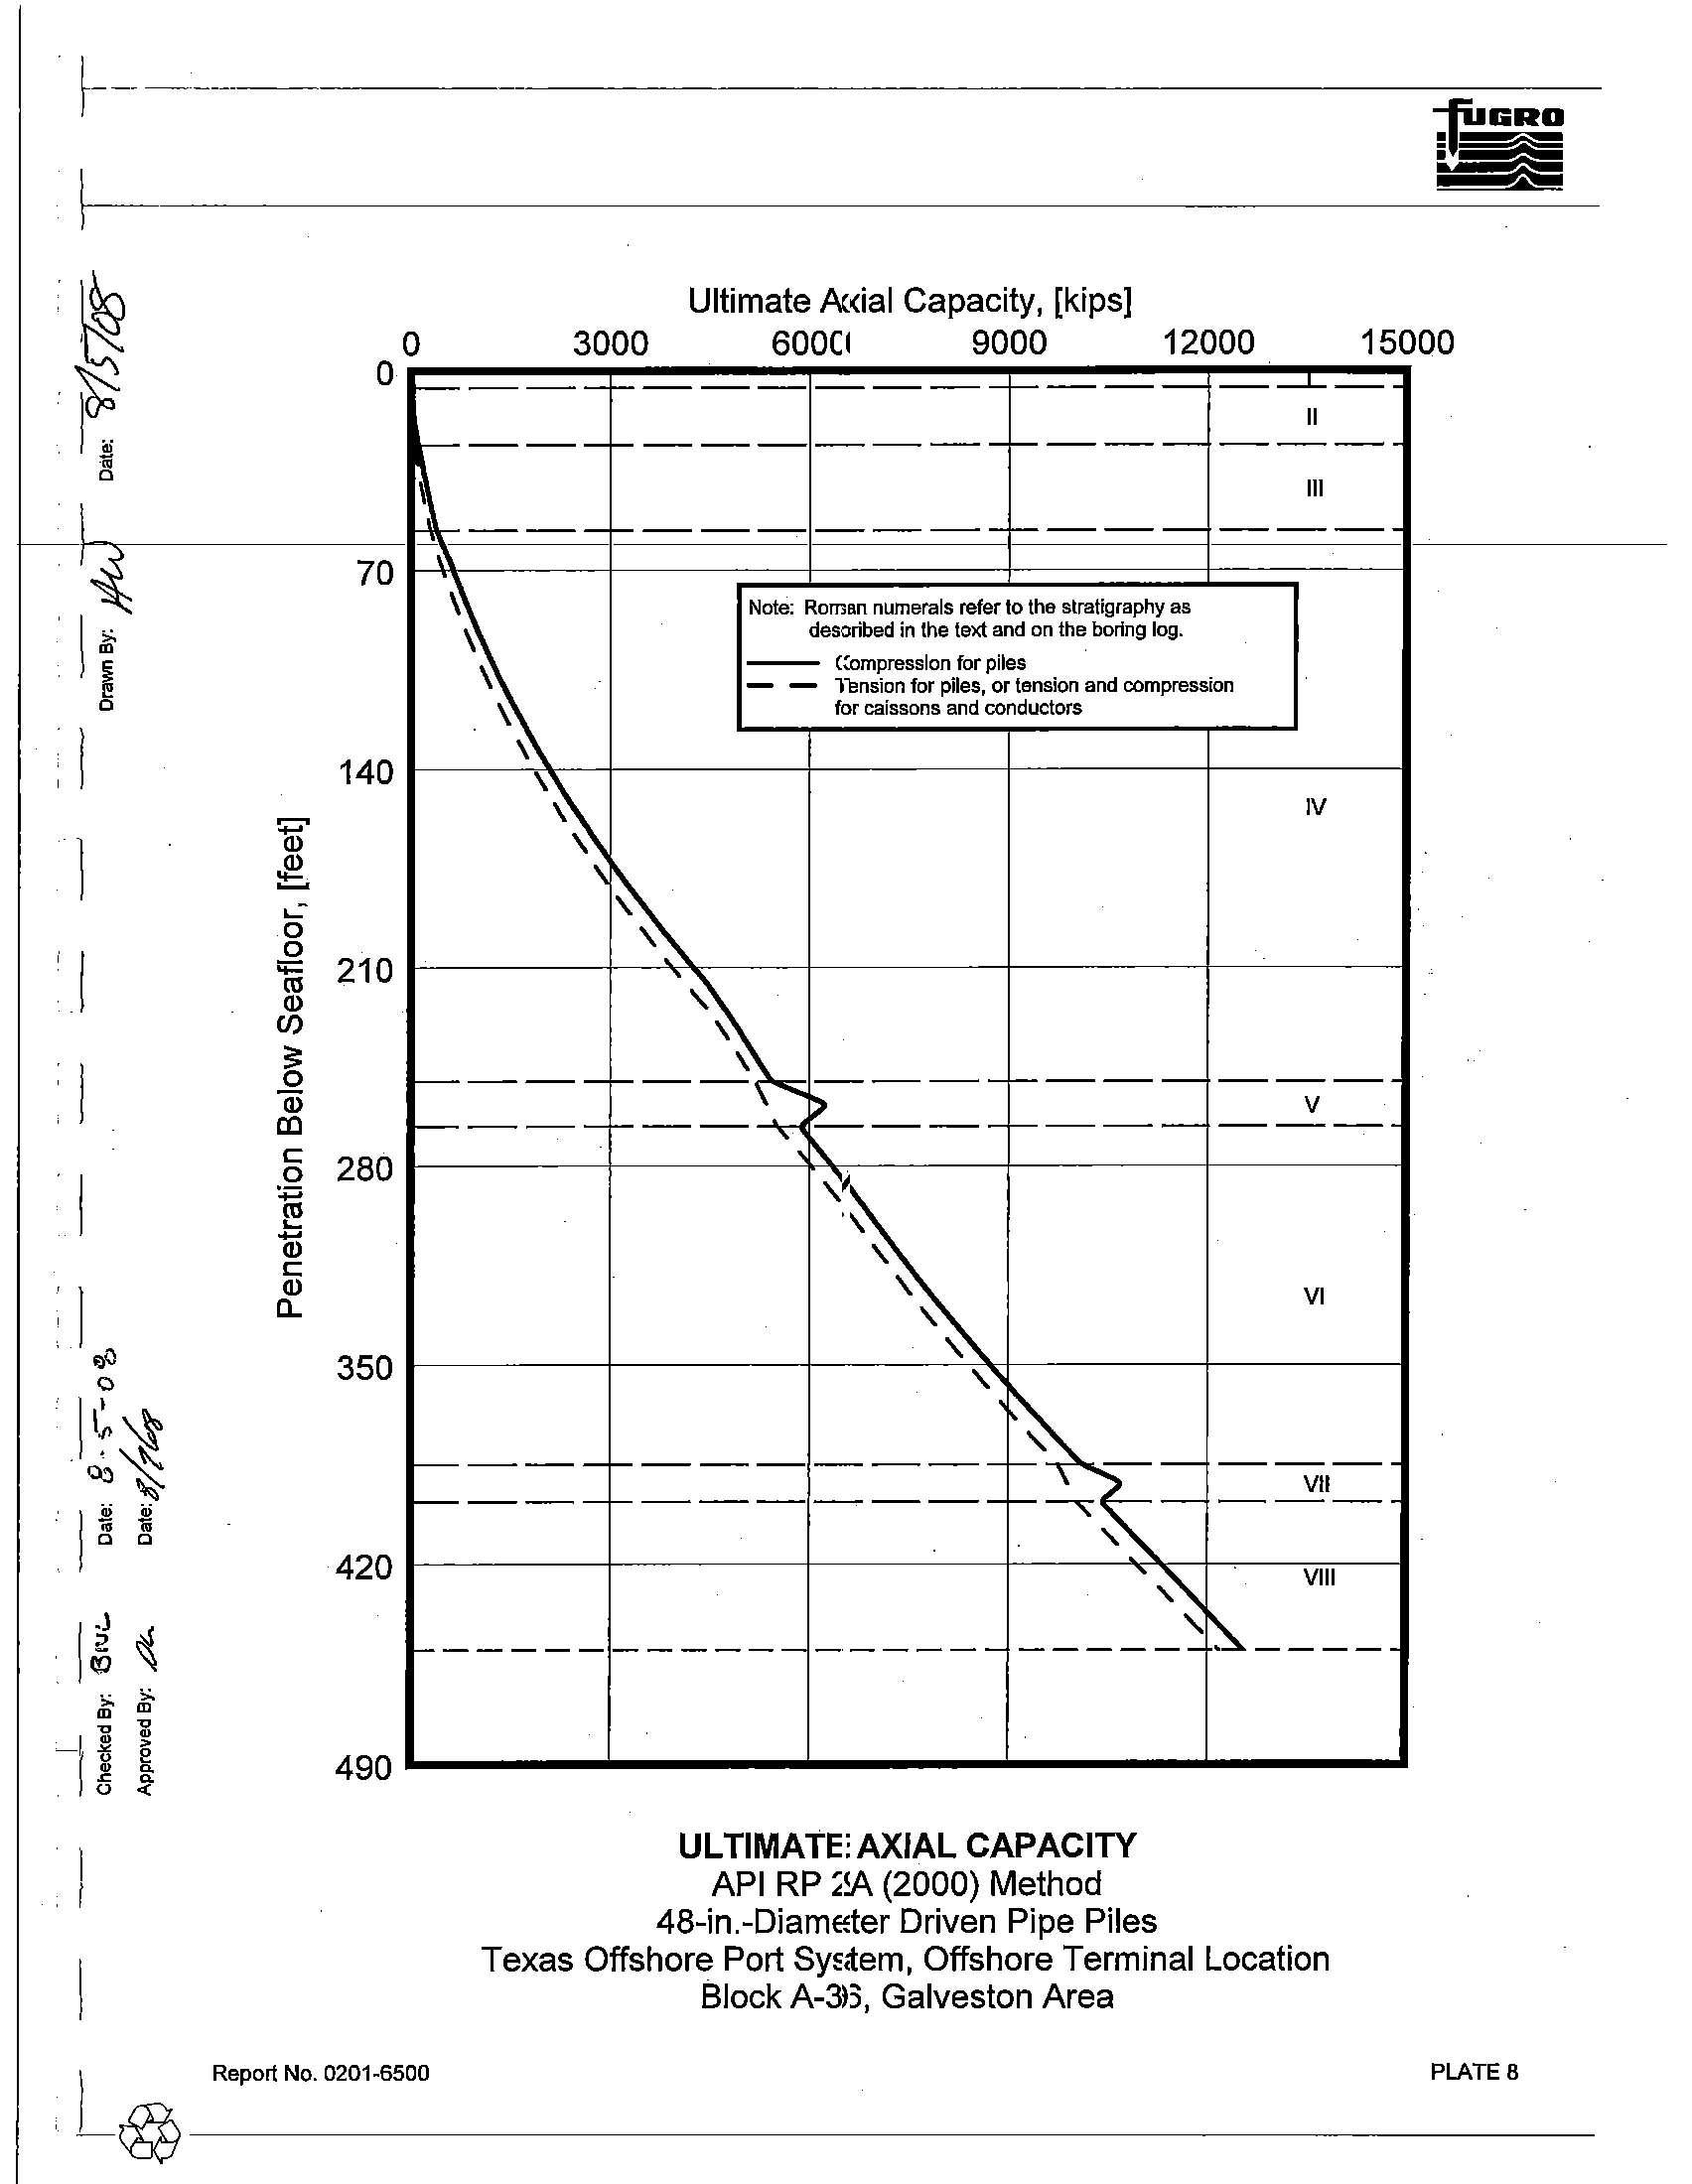
Ultimate Axial Capacity, [kips]
0
3000
6000
9000
12000
15000
or:
01--
.-
f-
--
f-
--
_---L
II
c---.-
f----
--_.-
f------
-----
•
D
III
I~
\--_.-
f----
----
--_.-
---
70
\\
\
Note: Roman numerals refer to the stratigraphy as
\.,;
\
described in the text and on the boring log.
\
--
Compression for piles
~
-
-
Tension for piles, or tension and compression
D
\
for caissons and conductors
,I
140
,
'\
IV
"'"
1
Q)
~
-;
~
.:
I
0
i
I
0
I;::
210
(\l
~~~
Q)
CI)
I
:l:
0
----
--_.-
_.
__
.-
---
"iii
L __._
V
III
----
---.~
---_.-
---
c
280
,
r-...
I
0
:;:>
"
(\l
.....
"
-
Q)
"
C
,I
Q)
"
VI
Il..
"
.}j
350
"
II~~
<>
--_.-
----
-----
"
~-
---
~""
--_.-
f----.;- --
VII
l;.j
;.j
--_.-
----
---
D
D
-
,
.
420
'~
-
VIII
I~
IP
~
------------
------ ------
"
~----
iii
..
m
>.
-g
~
-I
'Ii
. e
490
~
o
~
«
~
I
ULTIMATE AXIAL CAPACITY
I
API
RP 2A (2000) Method
48-in.-Diameter Driven Pipe Piles
I
Texas Offshore Port System, Offshore Terminal Location
Block A-36, Galveston Area
_I@
Report No. 0201-6500
PLATE 8
1-
~
I~
1i
-~~
Ii
il
0.)
o
·I~~
~'{::
I~
J
1
-2
!l:>
m
'"
-.)
~
~
a:
.
0
'"
u
I
I
,
Ultimate Axial Capacity, [kips]
o
4000
8000
12000
16000
20000
f--
--
i--
--
----
.-
r-
--
.--L __
,
II
k-----
i----
-----
r---.-
-------
\
III
~----
i----
--_.-
f----
------
_\~
\
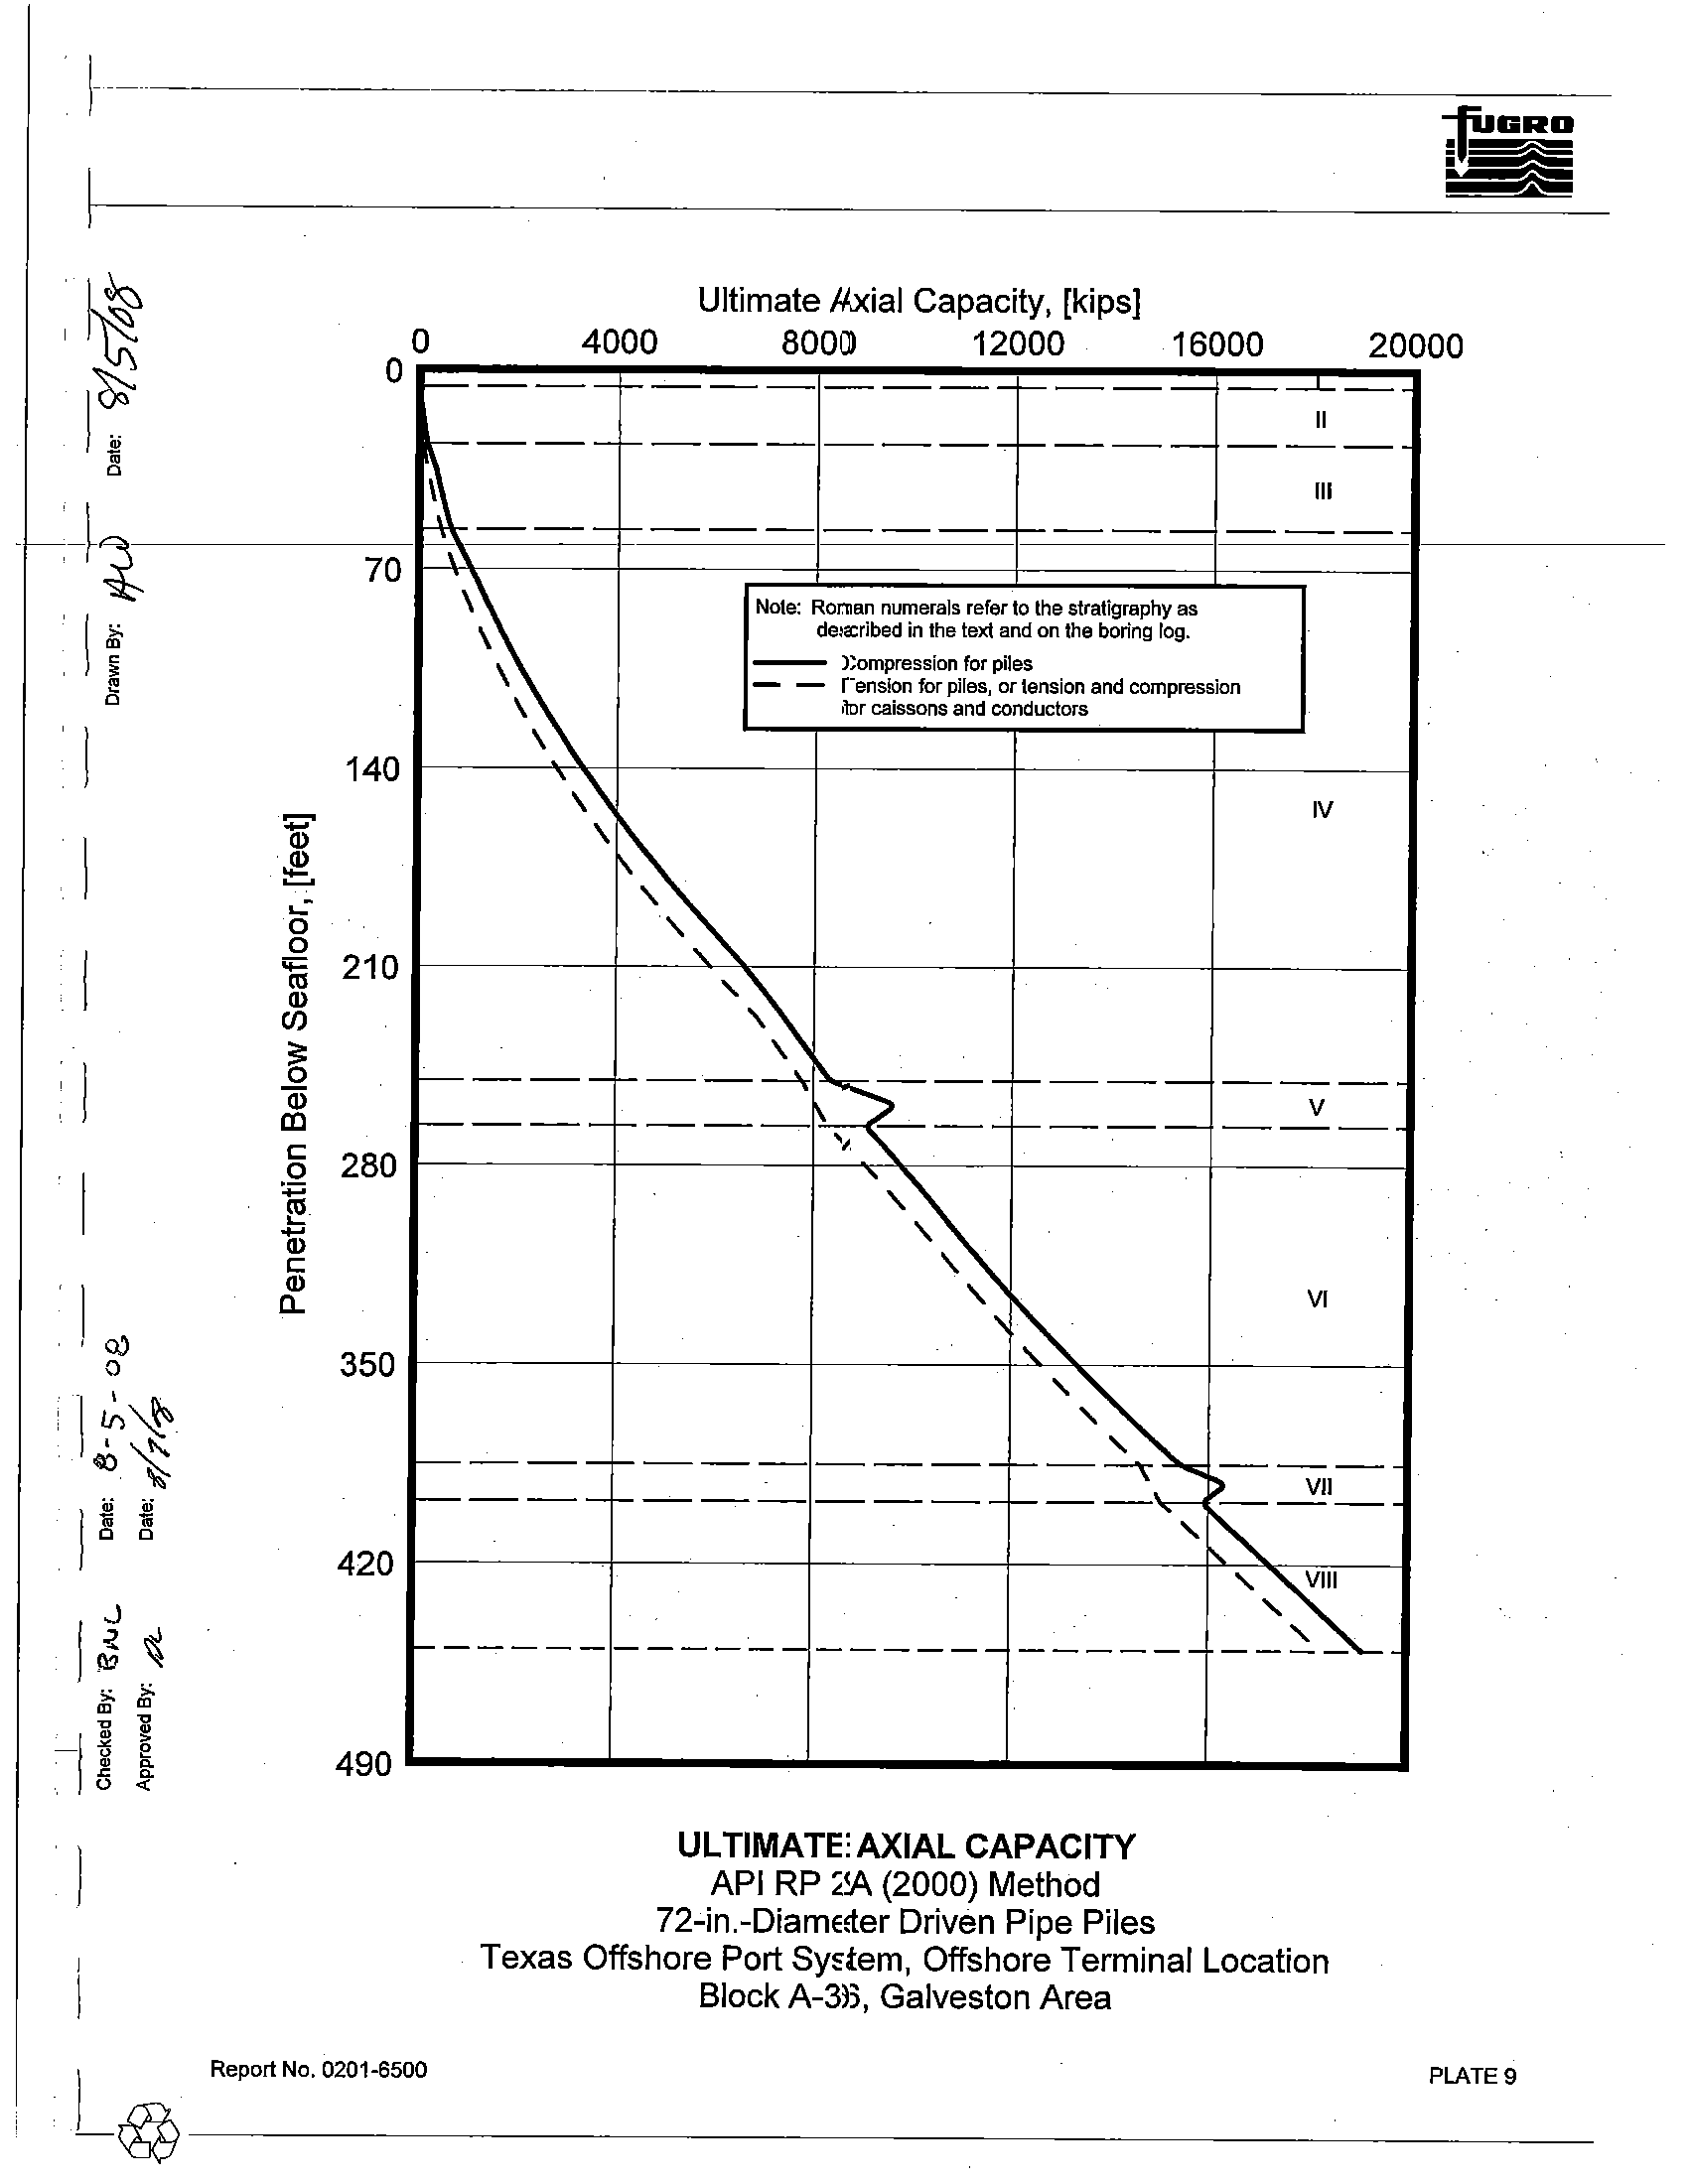
Note: Roman numerals refer to the stratigraphy as
\
described in the text and on the boring log.
--- Compression for piles
\
-
-
Tension for piles, or tension and compression
\
for caissons and conductors
\
\\
'~
"
,
,
--_.-
--_.-
----
----
C------
'\
----\-
~---
--_.-
r---
,
----r---.-
"\
,
~
i----
--_.-
r-'~
C----
---.-
f----~
,
------
------ ------
ULTIMATE AXIAL CAPACITY
API RP 2A (2000) Method
72-in.-Diameter Driven Pipe Piles
IV
----.
V
------
VI
~_---vil-
~--
~~
Texas Offshore Port System, Offshore Terminal Location
Block A-36, Galveston Area
I
)
Report No. 0201.6500
PLATE 9
-~---------------------------------
I-~~------·---
I
~
~
i'i
-~
I
~
~
..
"
•
0
~
on
'"
n
l
~
o
~
.
~
~
~
.
u
«
.
PENETRATION
BELOW
CURVE POINTS
MUDLINE
(feel)
1
2
3
4
5
6
7
8
0.0
1
0.00
0.00
0.00
0.00
0.00
0.00
0.00
0.00
z
0.00
0.08
0.15
0.27
0.38
0.48
0.96
48.00
1.0
1
0.00
0.02
0.03
0.04
0.05
0.06
0.05
0.05
z
0.00
0.08
0.15
0.27
0.38
0.48
0.96
48.00
3.0
1
0.00
0.02
0.04
0.06
0:07
0.07
0.07
0.07
--z-
~-0:00-~0:08---0:15---0:27---0:38---0:48---0:96--48:00--
6.0
1
0.00
0.03
0.05
0.08
0.10
0.11
0.10
z
0.00
0.08
0.15
0.27
0.38
0.48
0.96
6.0
1
0.00
0.06
0.06
z
0.00
0.10
48.00
26.0
1
0.00
0.32
0.32
z
0.00
0.10
48.00
26.0
1
0.00
0.14
0.23
0.35
0.42
0.47
0.42
z
0.00
0.08
0.15
0.27
0.38
0.48
0.96
56.0
1
0.00
0.24
0.40
0.60
0.72
0.80
0.72
z
0.00
0.08
0.15
0.27
0.38
0.48
0.96
56.0
1
0.00
0.30
0.50
0.74
. 0.89
0.99
0.89
z
0.00
0.08
0.15
0.27
0.38
0.48
0.96
117.0
1
0.00
0.51
0.85
1.27
1.52
1.69
1.52
z
0.00
0.08
0.15
0.27
0.38
0.48
0.96
137.0
1
0.00
0.58
0.96
1.44
1.73
1.92
1.73
z
0.00
0.08
0.15
0.27
0.38
0.48
0.96
157.0
1
0.00
0.65
1.08
1.62
1.94
2.16
1.94
z
0.00
0.08
0.15
0.27
0.38
0.48
0.96
177.0
1
0.00
0.72
1.20
1.79
2.15
2.39
2.15
z
0.00
0.08
0.15
0.27
0.38
0.48
0.96
187.0
1
0.00
0.75
1.25
1.88
2.26
2.51
2.26
z
0.00
0.08
0.15
0.27
0.38
0.48
0.96
227.0
1
0.00
0.89
1.48
2.21
2.66
2.95
2.66
z
0.00
0.08
0.15
0.27
0.38
0.48
0.96
227.0
1
0.00
0.66
1.10
1.65
1.98
2.20
1.98
z
0.00
0.08
0.15
0.27
0.38
0.48
0.96
250.0
1
0.00
0.66
1.10
1.65
1.98
2.20
1.98
.
z
0.00
0.08
0.15
0.27
0.38
0.48
0.96
250.0
1
0.00
1.70
1.70
z
0.00
0.10
48.00
266.0
1
0.00
1.70
1.70
z
0.00
0.10
48.00
266.0
1
0.00
0.90
1.50
2.25
2.70
3.00
2.70
z
0.00
0.08
0.15
0.27
0.38
0.48
0.96
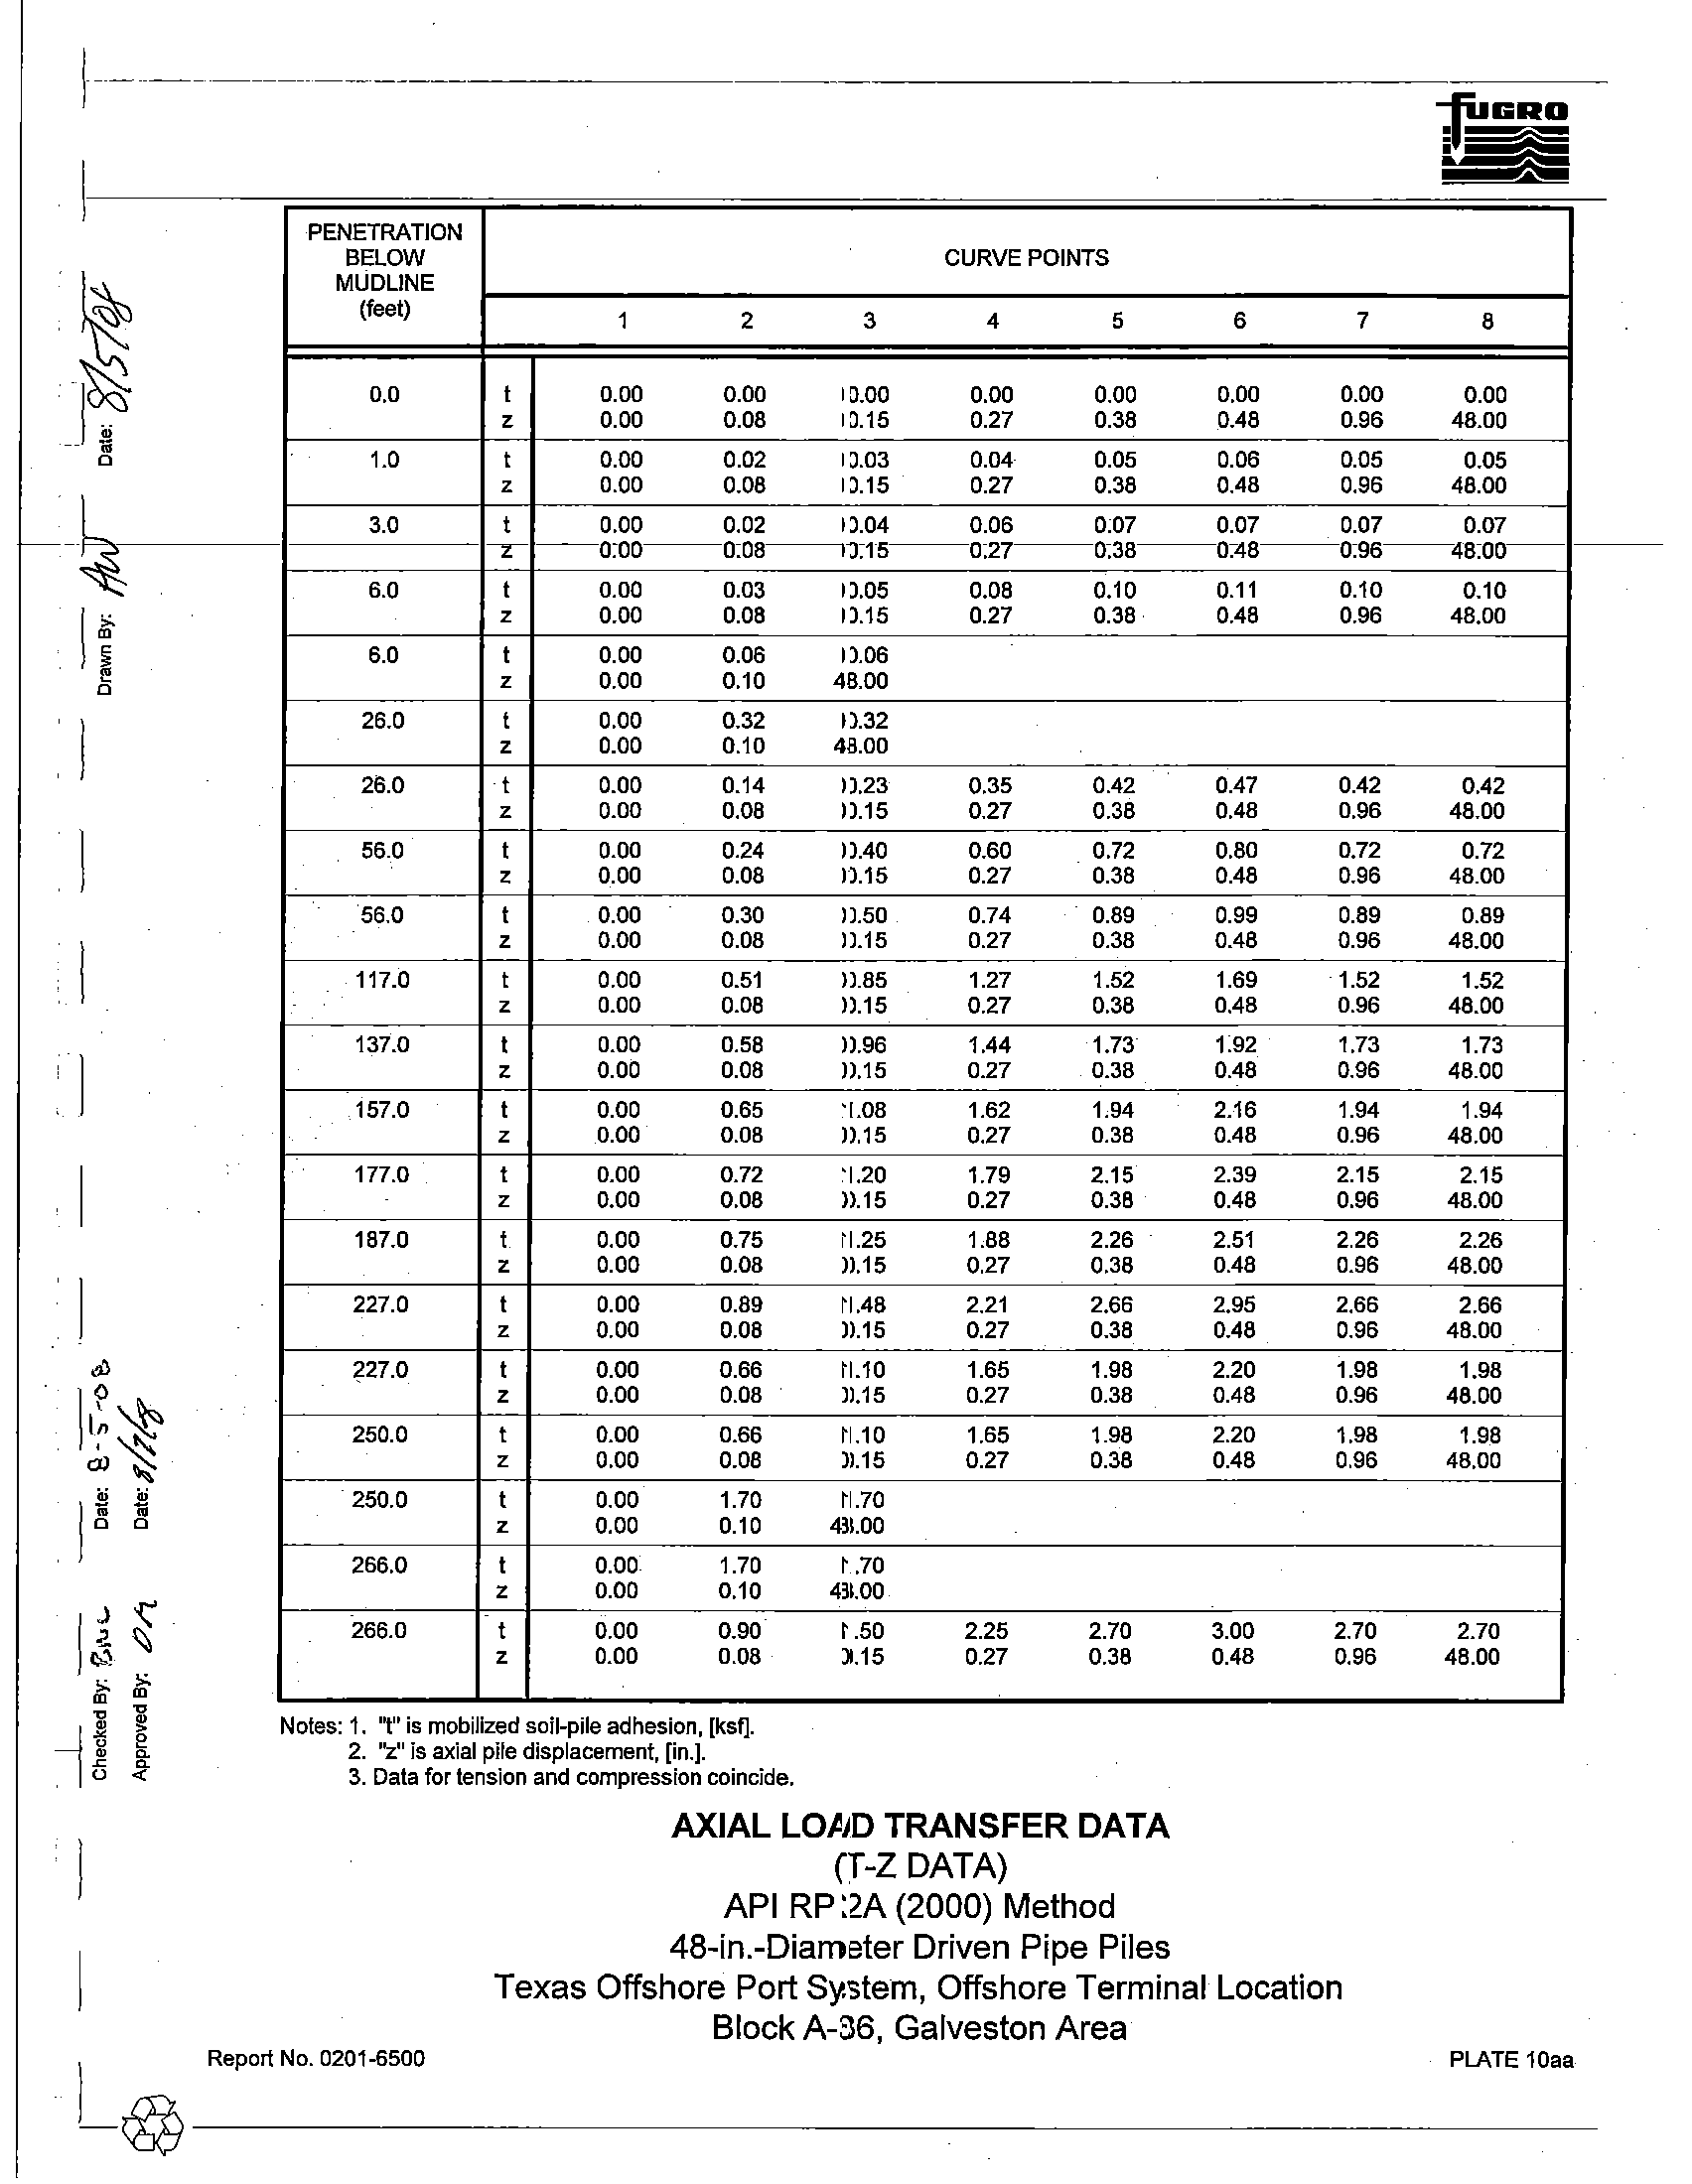
Notes: 1. ''t'' is mobilized soil-pile adhesion, [ksfl.
2. ''z'' is axial pile displacement, [in.].
3. Data for tension and compression coincide.
AXIAL LOAD TRANSFER DATA
(T-Z
DATA)
API RP
2A (2000) Method
48-in.-Diameter Driven Pipe Piles
Texas Offshore Port System, Offshore Terminal Location
Block A-36, Galveston Area
0.10
48.00
0.42
48.00
0.72
48.00
0.89
48.00
1.52
48.00
1.73
48.00
1.94
48.00
2.15
48.00
2.26
48.00
2.66
48.00
1.98
48.00
1.98
48.00
2.70
48.00
.
I
Report No. 0201-6500
PLATE 10aa
-~--------------------------------~
f--
,---
~
~
~
...
~
"
~
>.
m
~
l
~
.
~
~
~
~
I,
()
<:(
-------.-----
--
PENETRATION
BELOW
CURVE POINTS
MUDLINE
(feel)
1
2
3
4
5.
300.0
I
0.00
0.78
1.30
1.95
2.34
z
0.00
0.08
0.15
0.27
0.38
318.0
I
0.00
0.78
1.30
1.95
2.34
z
0.00
0.08
0.15
0.27
0.38
385.0
I
0.00
0.96
1.60
2.40
2.88
z
0.00
0.08
0.15
0.27
0.38
385.0
I
0.00
1.70
1.70
z
0.00
0.10
48.00
398.0
I
0.00
1.70
1.70
z
0.00
0.10
48.00
398.0
I
0.00
0.99
1.65
2.47
2.97
z
0.00
0.08
0.15
0.27
0.38
450.0
I
0.00
0.99
1.65
2.47
2.97
z
0.00
0.08
0.15
0.27
0.38
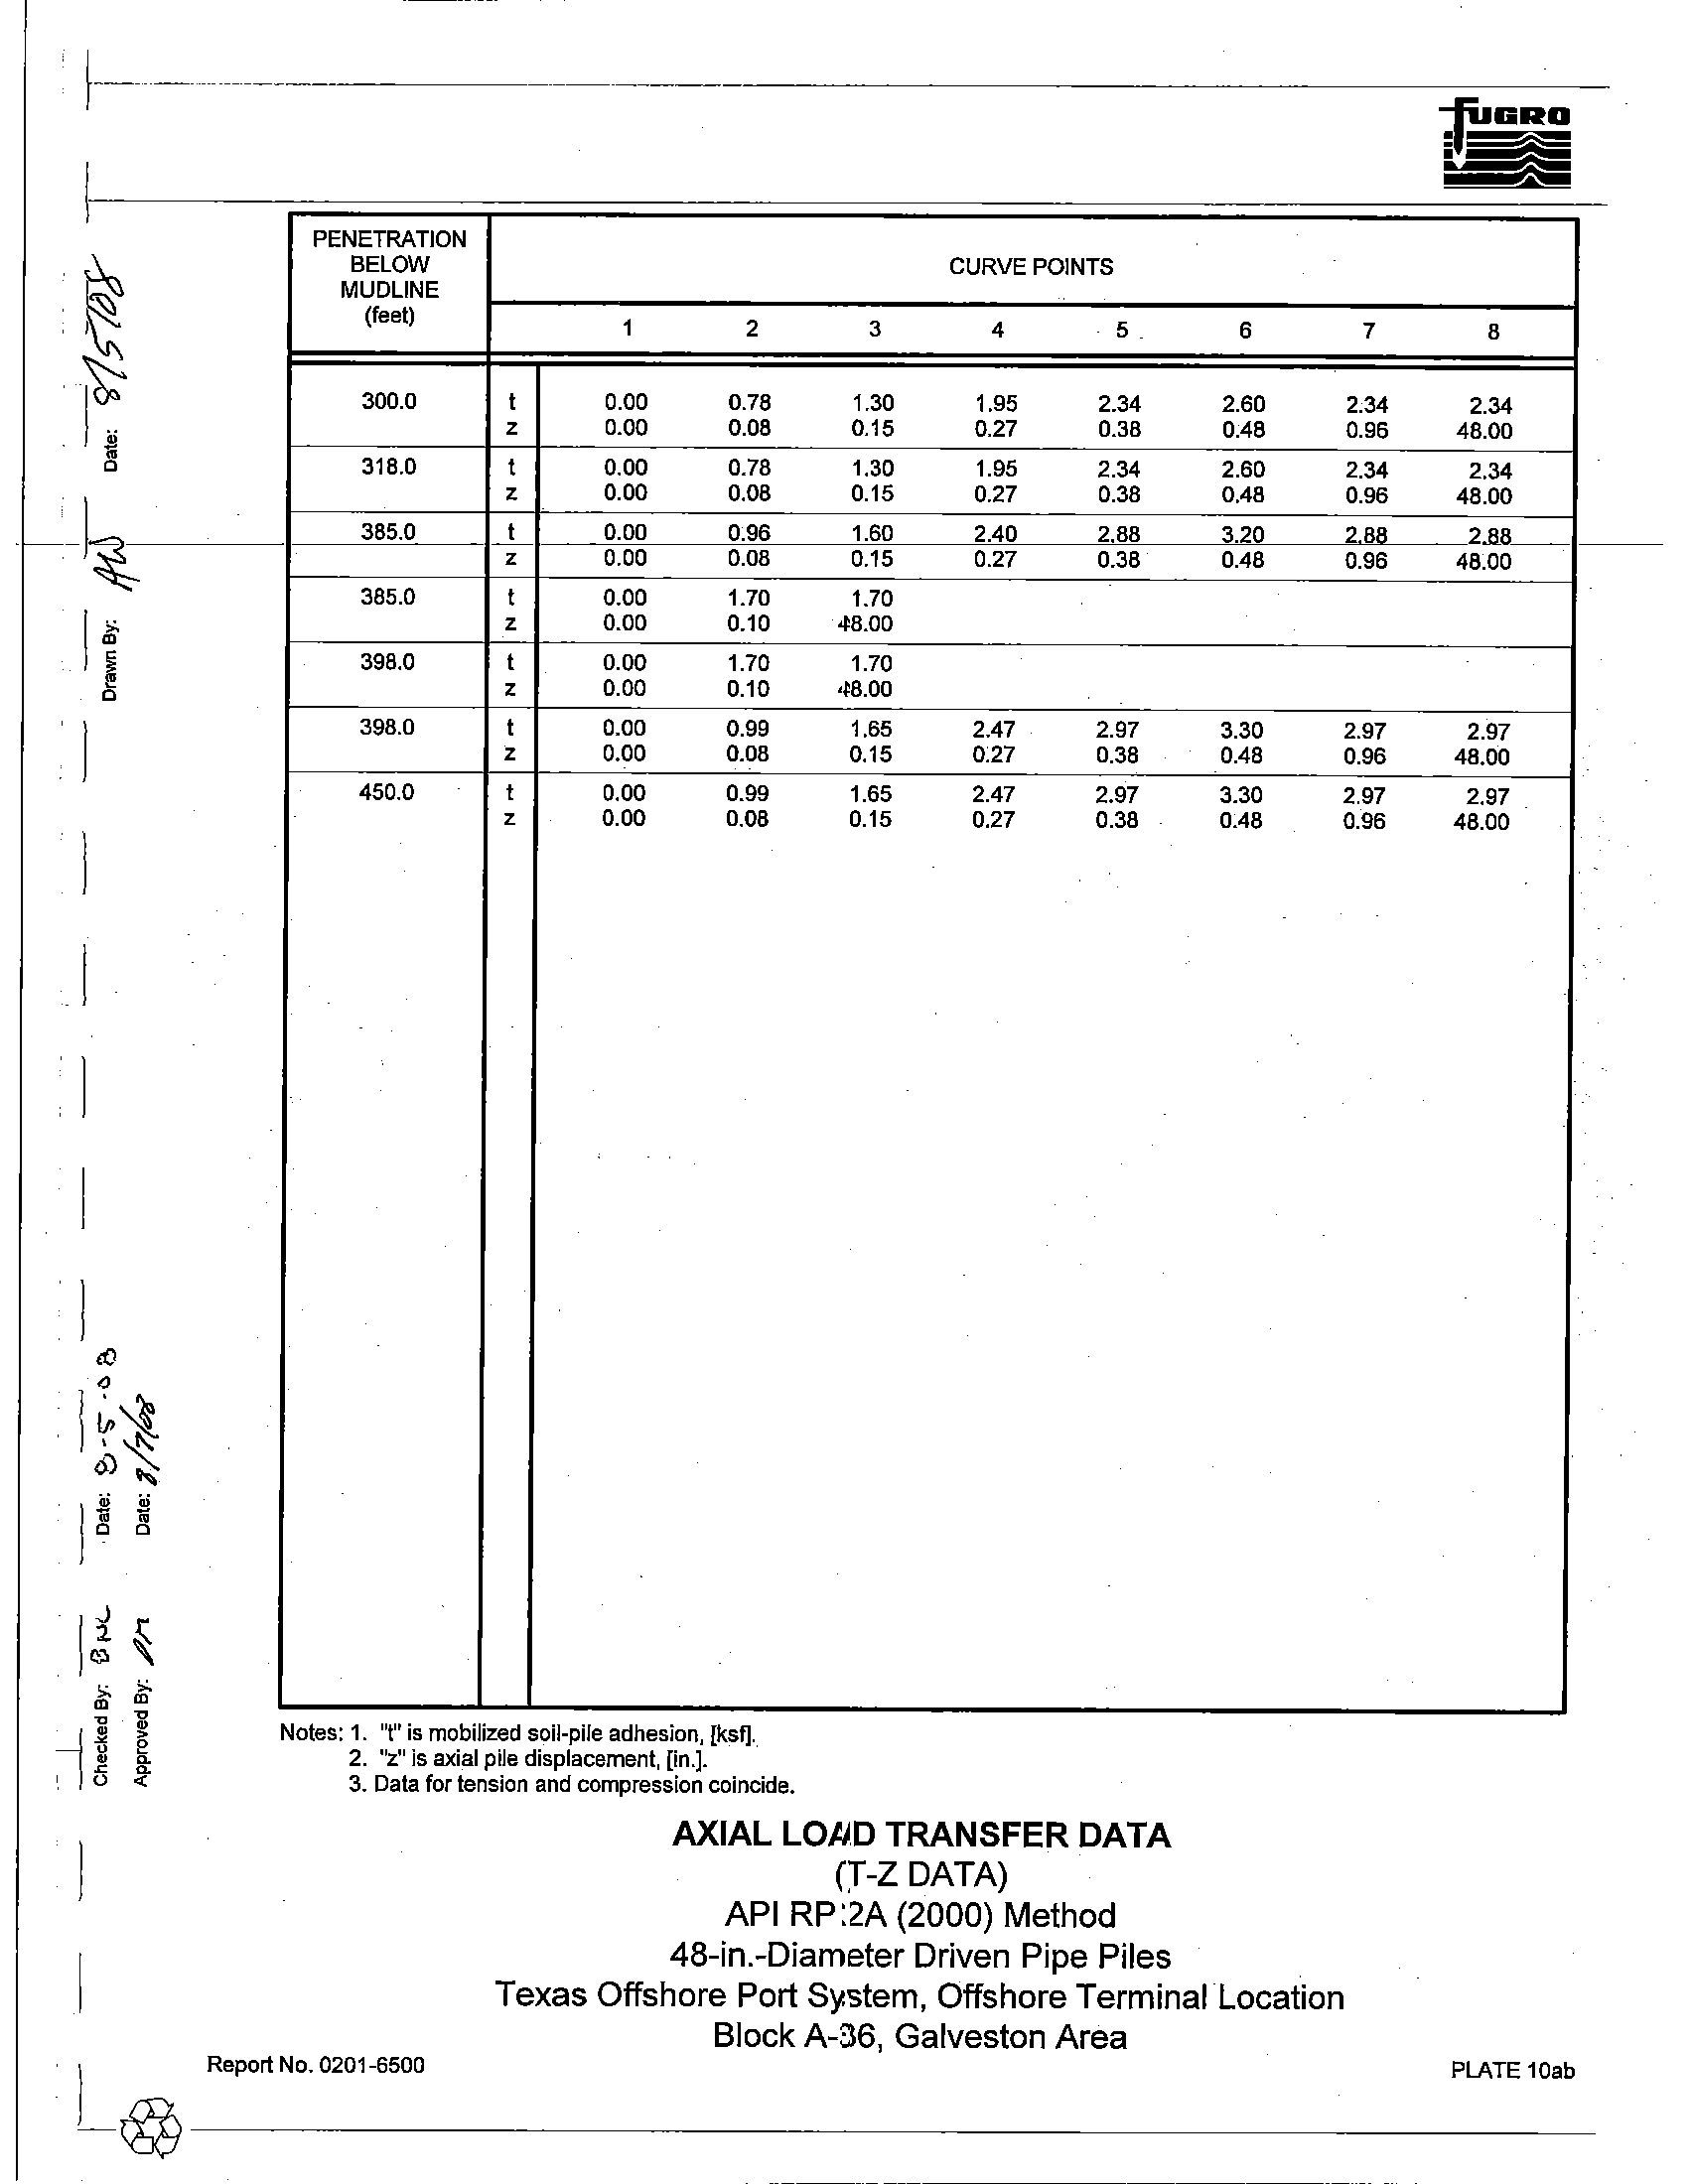
Notes: 1. "t" is mobilized soil-pile adhesion,
lksf].
2. "z" is axial pile displacement, [in.].
3. Data for tension and compression coincide.
AXIAL LOAD TRANSFER DATA
(T-Z DATA)
API RP
2A (2000) Method
48-in.-Diameter Driven Pipe Piles
6
7
2.60
2.34
0.48
0.96
2.60
2.34
0.48
0.96
3.20
288
0.48
0.96
3.30
2.97
0.48
0.96
3.30
2.97
0.48
0.96
Texas Offshore Port System, Offshore TerminalLocation
Block A-36, Galveston Area
-fuURU
8
2.34
48.00
2.34
48.00
2.!i8
__
48.00
.
2.97
48.00
2.97
48.00
)
Report
No. 0201-6500
PLATE 10ab
-@----------------------
1-------
PENETRATION
BELOW
MUDLINE
(feet)
2
CURVE POINTS
345
'tl-
~
I
100.0
Q
0
48
96
144
173
i
z
0.00 .
0.10
0.62
2.02
3.50
il
215.0
Q
0
81
163
244
293
z
0.00
0.10
0.62
2.02
3.50
b-
1-----.22Z~I.J;l-1
0
62
124
t87
224
J~
z
0.00
0.10
0.62
2.02
3.50
250.0
Q
0
62
124
187
224
>.
.
Z
0.00
0.10
0.62
2.02
3.50
'"
~
258.0
Q
0
230
460
691
829
Ii
z
0.00
0.10
0.62
2.02
3.50
""
o
li~
.
~
I"
o 0
Il
.J
Ij {
>.
>..
'" '"
1
o
e
~
~
~
g;
.
0
"
266.0
Q
0
85
170
254
305
z
0.00
0.10
0.62
2.02
3.50
300.0
I
Q
0
74
147
221
265
318.0
385.0
392.0
398.0
450.0
z
0.00
0.10
0.62
2.02
3.50
Q
z
Q
z
Q
z
Q
z
Q
z
o
74
0.00
0.10
o
90
0.00
0.10
o
204
0.00
0.10
o
93
0.00
0.10
o
93
0.00
0.10
147
0.62
181
0.62
407
0.62
187
0.62
187
0.62
221
2.02
271
2.02
611
2.02
280
2.02
280
2.02
265
3.50
326
3.50
733
3.50
336
3.50
336
3.50
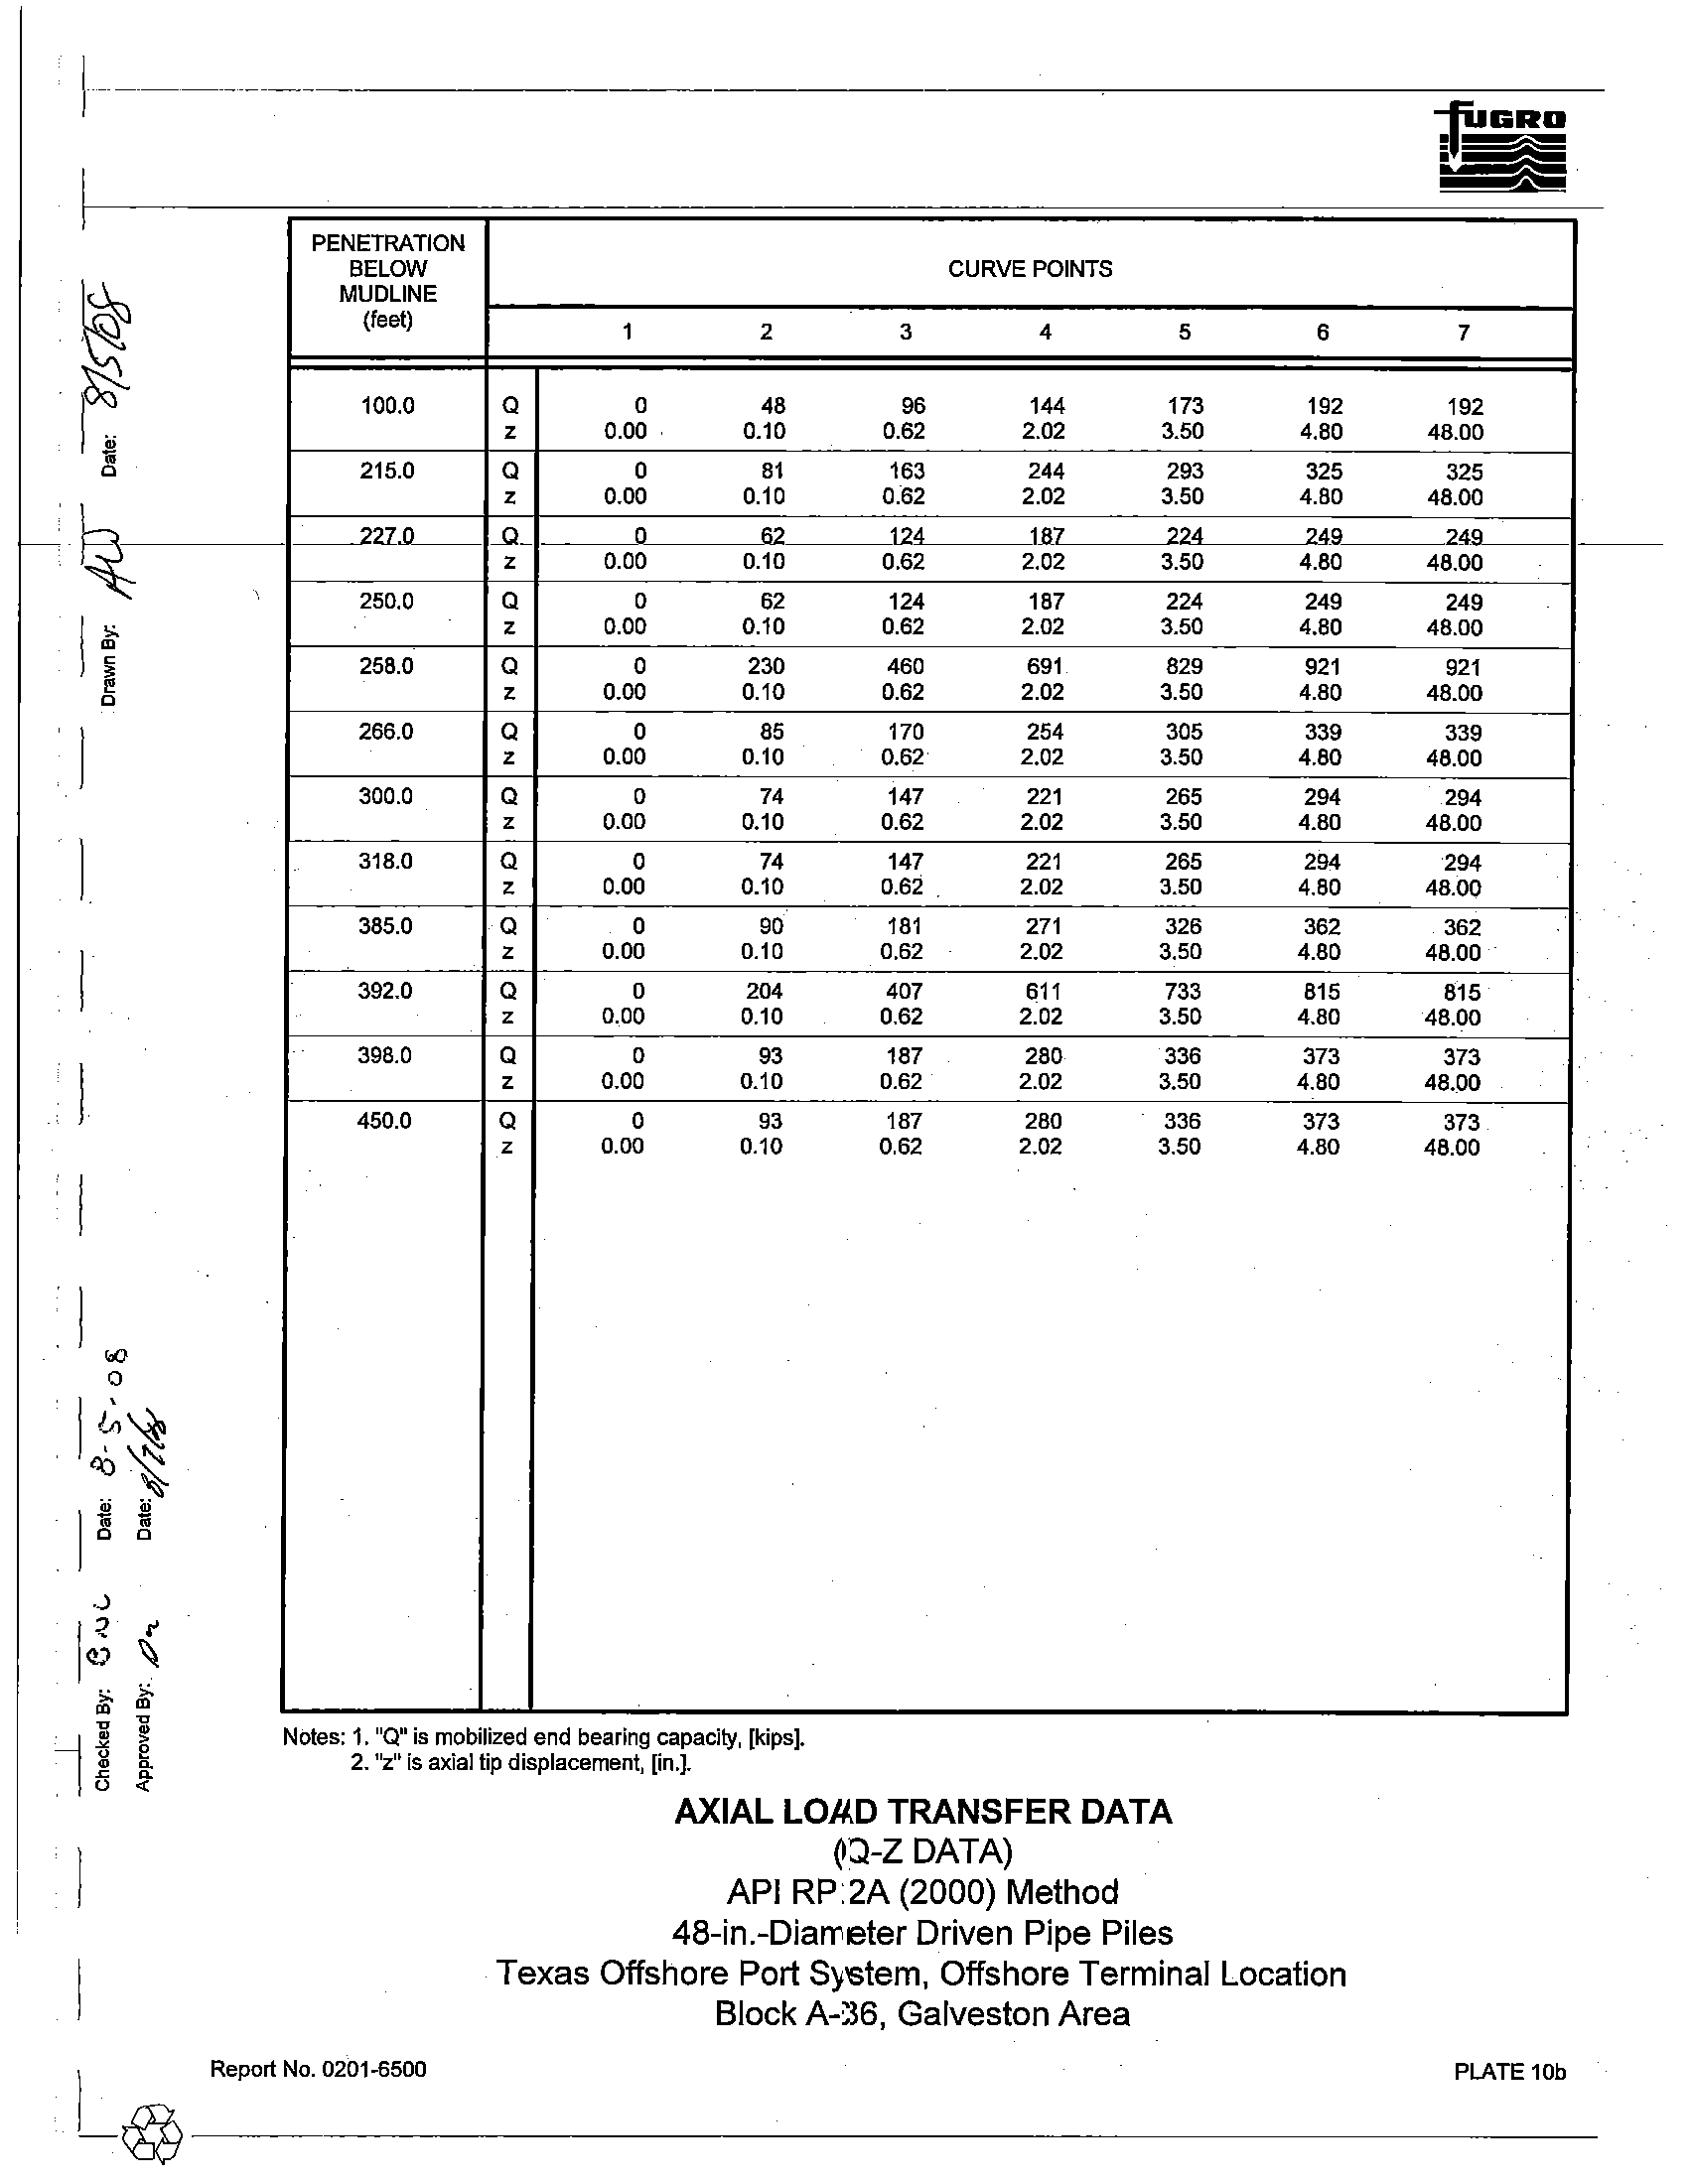
Notes: 1.
"Q"
is mobilized end bearing capacity, [kips].
2. "z" is axial tip displacement, [in.].
AXIAL LOAD TRANSFER DATA
(Q-Z
DATA)
API
RP
2A (2000) Method
48-in.-Diameter Driven Pipe Piles
6
7
192
192
4.80
48.00
325
325
4.80
48.00
249
2~9
1___
4.80
48.00
249
249
4.80
48.00
921
921
4.80
48.00
339
339
4.80
48.00
294
294
4.80
48.00
294
294
4.80
48.00
362
362
4.80
48.00
815
815
4.80
48.00
373
373
4.80
48.00
373
373
4.80
48.00
Texas Offshore Port System, Offshore Terminal Location
Block A-36, Galveston Area
I
Report No.
0201-6500
-~---------------------------------
PLATE 10b
j--- .-.--.------.-.-----------
-tUURD
I
,
~
~
...
I
"
~
;:.
m
j
~
~
-
g
~
~
~
u '"
~
PENETRATION
BELOW
CURVE POINTS
MUDLINE
(feel)
1
2
3
4
5
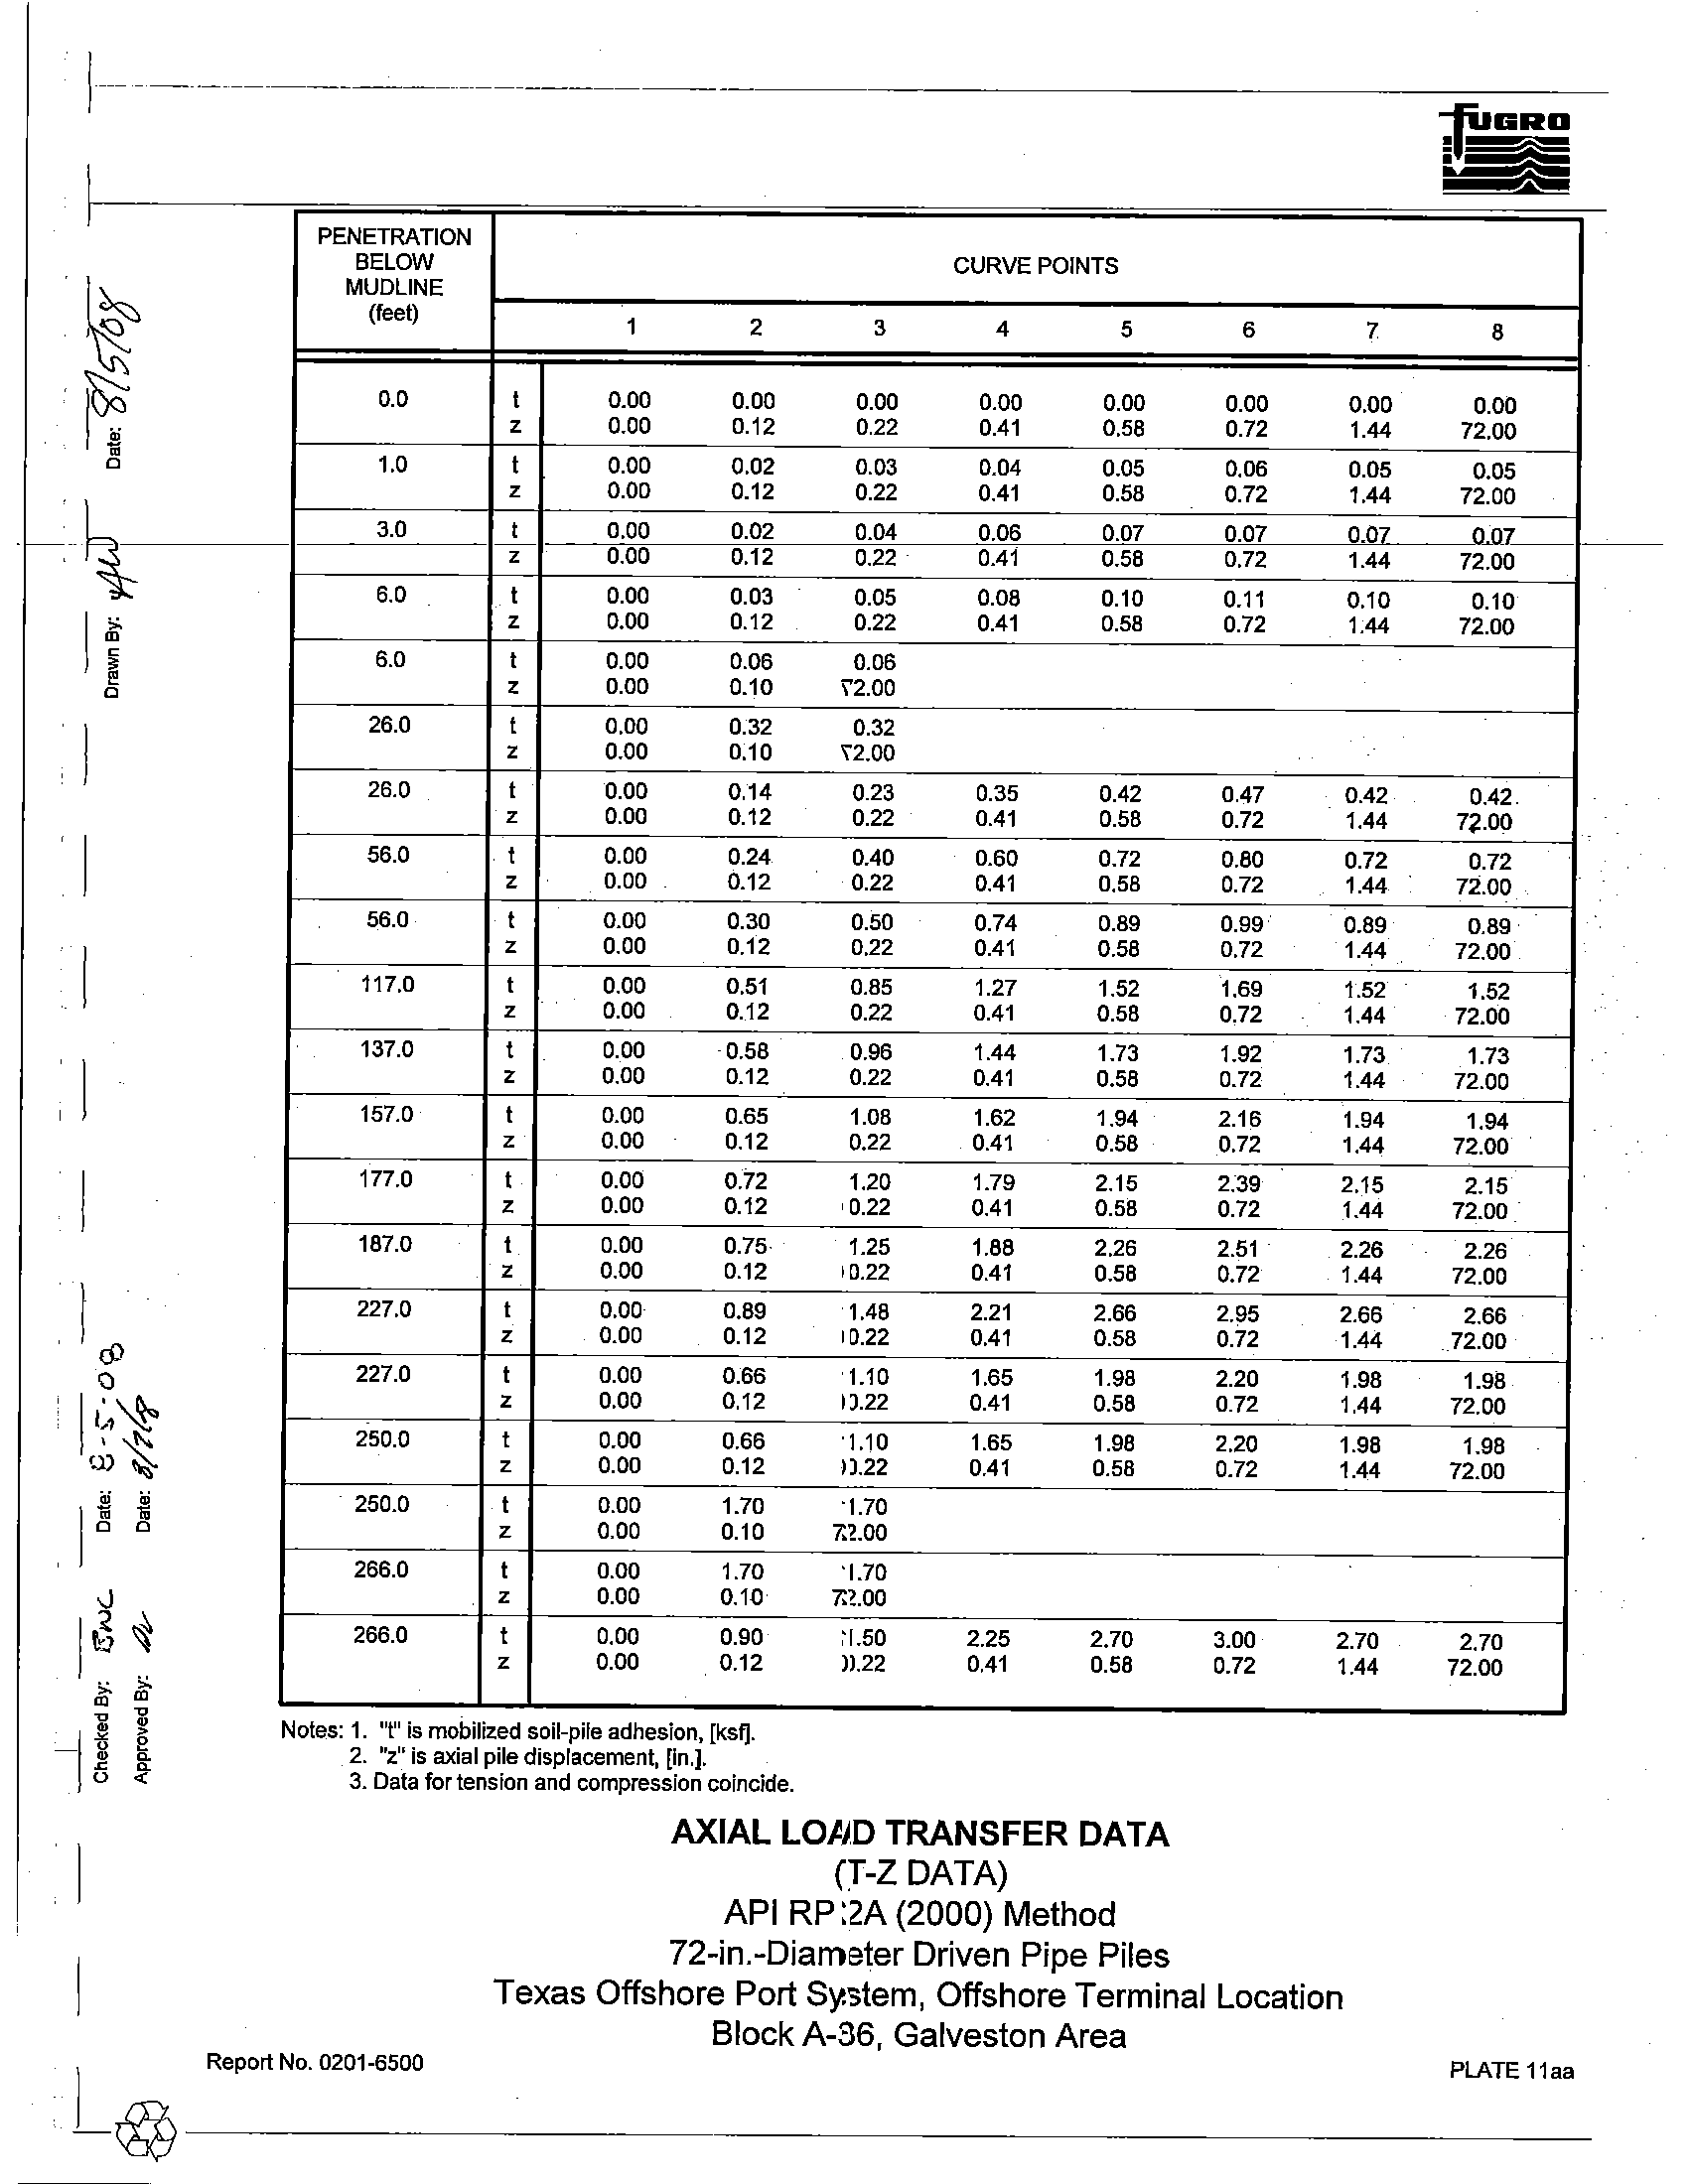
0.0
I
0.00
0.00
0.00
0.00
0.00
z
0.00
0.12
0.22
0.41
0.58
1.0
I
0.00
0.02
0.03
0.04
0.05
z
0.00
0.12
0.22
0.41
0.58
3.0
I
0.00
0.02
0.04
0.06
0.07
z
0.00
0.12
0.22
0.41
0.58
6.0
I
0.00
0.03
.
0.05
0.08
0.10
z
0.00
0.12
0.22
0.41
0.58
6.0
I
0.00
0.06
0.06
z
0.00
0.10
72.00
26.0
I
0.00
0.32
0.32
z
0.00
0.10
72.00
26.0
I
0.00
0.14
0.23
0.35
0.42
z
0.00
0.12
0.22
0.41
0.58
56.0
I
0.00
0.24
0.40
0.60
0.72
z
0.00
0.12
0.22
0.41
0.58
56.0
I
0.00
0.30
0.50
0.74
0.89
z
0.00
0.12
0.22
0.41
0.58
117.0
I
0.00
0.51
0.85
1.27
1.52
z
0.00
0.12
0.22
0.41
0.58
137.0
I
0.00
0.58
0.96
1.44
1.73
z
0.00
0.12
0.22
0.41
0.58
157.0
I
0.00
0.65
1.08
1.62
1.94
z
0.00
0.12
0.22
0.41
0.58
177.0
I
0.00
0.72
1.20
1.79
2.15
z
0.00
0.12
0.22
0.41
0.58
187.0
I
0.00
0.75
1.25
1.88
2.26
z
0.00
0.12
0.22
0.41
0.58
227.0
I
0.00
0.89
1.48
2.21
2.66
z
0.00
0.12
0.22
0.41
0.58
227.0
I
0.00
0.66
1.10
1.65
1.98
z
0.00
0.12
0.22
0.41
0.58
250.0
I
0.00
0.66
1.10
1.65
1.98
z
0.00
0.12
0.22
0.41
0.58
250.0
I
0.00
1.70
1.70
z
0.00
0.10
72.00
266.0
I
0.00
1.70
1.70
z
0.00
0.10
72.00
266.0
t
0.00
0.90
1.50
2.25
2.70
z
0.00
0.12
0.22
0.41
0.58
Notes: 1. "t" is mobilized soil-pile adhesion, [ksf].
2. liZ" is axial pile displacement, [In.].
3. Data for tension and compression coincide.
AXIAL LOAD TRANSFER DATA
(T-Z DATA)
API RP
2A (2000) Method
72-in.-Diameter Driven Pipe Piles
6
7
0.00
0.00
0.72
1.44
0.06
0.05
0.72
1.44
0.07
O.OZ
0.72
1.44
0.11
0.10
0.72
1.44
0.47
0.42
0.72
1.44
0.80
0.72
0.72
1.44
0.99
0.89
0.72
1.44
1.69
1.52
0.72
1.44
1.92
1.73
0.72
1.44
2.16
1.94
0.72
1.44
2.39
2.15
0.72
1.44
2.51
2.26
0.72
1.44
2.95
2.66
0.72
1.44
2.20
1.98
0.72
1.44
2.20
1.98
0.72
1.44
3.00
2.70
0.72
1.44
Texas Offshore Port System, Offshore Terminal Location
Block A-36, Galveston Area
8
0.00
72.00
0.05
72.00
OOZ
72.00
0.10
72.00
0.42.
7~.00
0.72
72.00
0.89
72.00
1.52
72.00
1.73
72.00
1.94
72.00
2.15
72.00
2.26
72.00
2.66
72.00
1.98
72.00
1.98
72.00
2.70
72.00
-
_1_~-R-e-p-ort-N-O.-0-2-01---65-0-0--------------------
______________P_LA_T_E_1_1_aa_
I
r:
I~
"
•
L
.
"--I~
.
~
~
G
~
PENETRATION
BELOW
CURVE POINTS
MUDLINE
(feel)
1
2
3
4
5
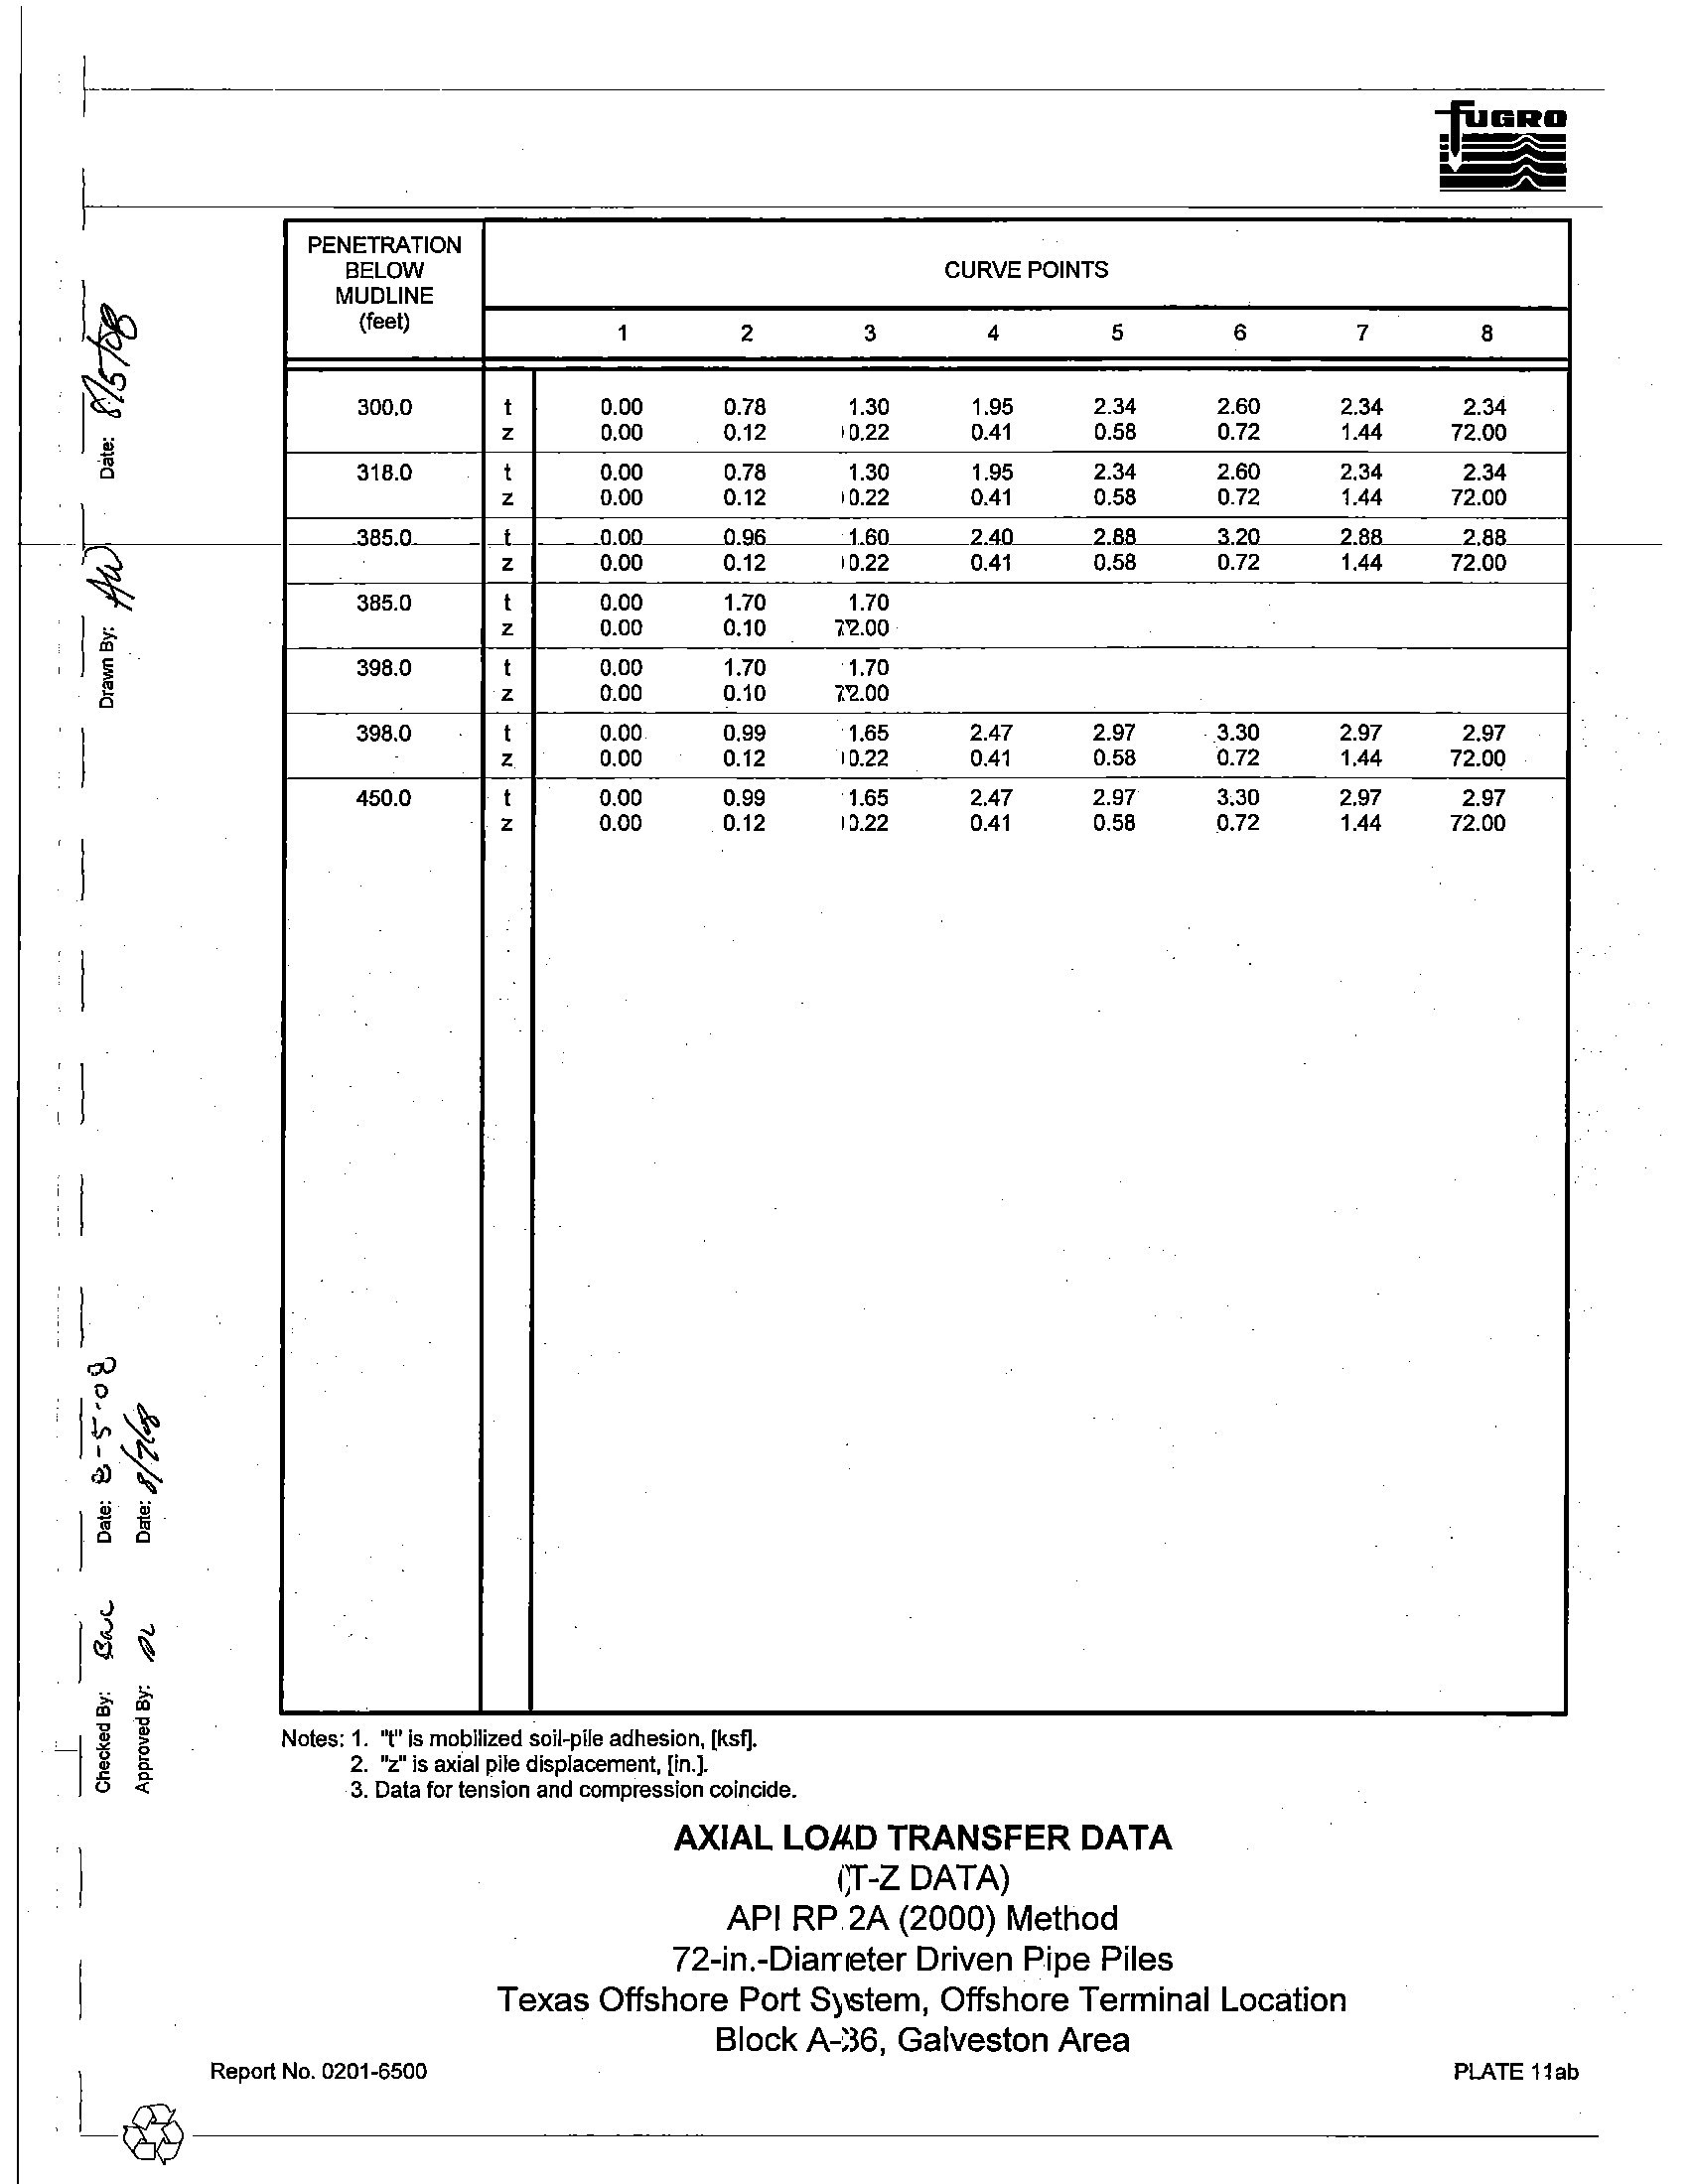
300.0
I
0.00
0.78
1.30
1.95
2.34
z
0.00
0.12
0.22
0.41
0.58
318.0
I
0.00
0.78
1.30
1.95
2.34
z
0.00
0.12
0.22
0.41
0.58
------385.0__
_L
__0.00
0.96
___1.60___2.40
2.88
Z
0.00
0.12
0.22
0.41
0.58
385.0
I
0.00
1.70
1.70
z
0.00
0.10
72.00
398.0
I
0.00
1.70
1.70
z
0.00
0.10
72.00
398.0
I
0.00
0.99
1.65
2.47
2.97
z
0.00
0.12
0.22
0.41
0.58
450.0
I
0.00
0.99
1.65
2.47
2.97
z
0.00
0.12
0.22
0.41
0.58
.
.
Notes: 1. "t" Is mobilized soil-pile adhesion, [ksf].
2.
liZ"
is axial pile displacement, [in.J.
3. Data for tension and compression coincide.
AXIAL LOAD TRANSFER DATA
(T-Z DATA)
API RP 2A (2000) Method
72-in.-Diameter Driven Pipe Piles
6
7
2.60
2.34
0.72
1.44
2.60
2.34
0.72
1.44
320
2.86
0.72
1.44
3.30
2.97
0.72
1.44
3.30
2.97
0.72
1.44
Texas Offshore Port System, Offshore Terminal Location
Block A-36, Galveston Area
8
2.34
72.00
2.34
72.00
2.88
__
72.00
2.97
72.00
2.97
72.00
I
Report No. 0201-6500
PLATE 11ab
-~---------------------------------
~~--
I
I~
~
1M
m
0
I
l
~
.
o
e
~
~
~
~
()
""
.
PENETRATION
BELOW
CURVE POINTS
MUDLINE
(feel)
1
2
3
4
5
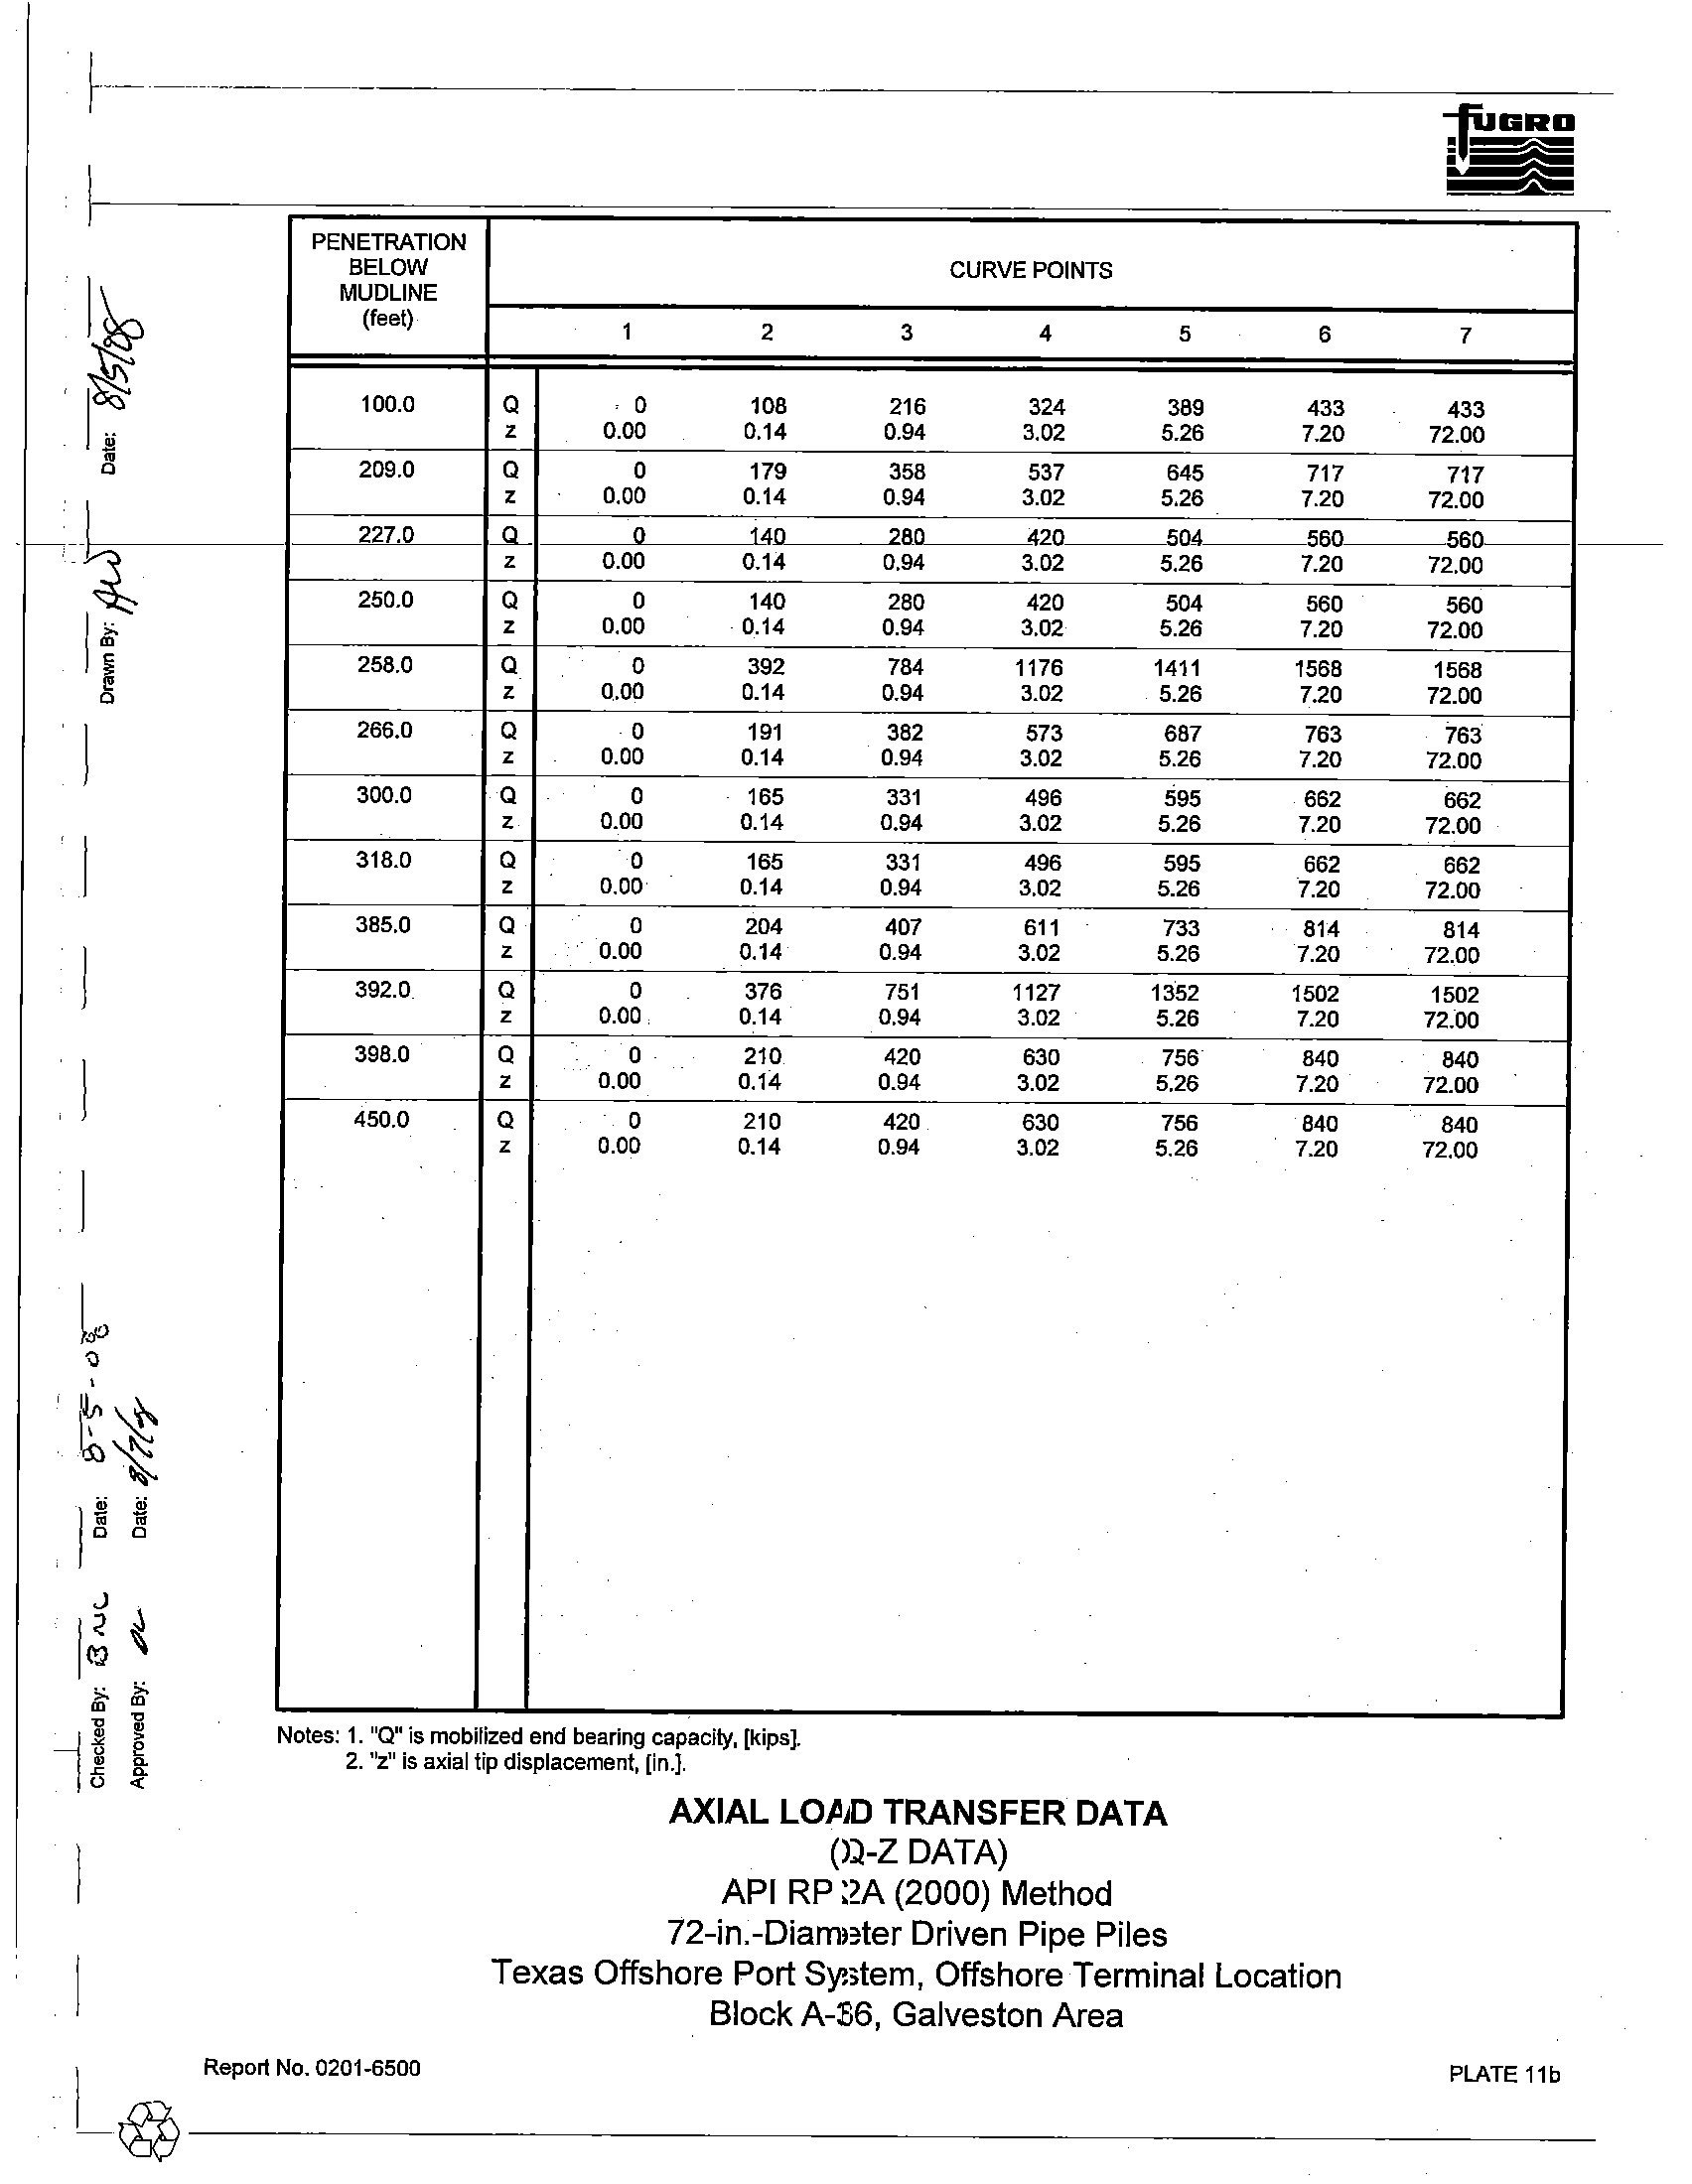
100.0
Q
0
108
216
324
389
z
0.00
0.14
0.94
3.02
5.26
209.0
Q
0
179
358
537
645
z
0.00
0.14
0.94
3.02
5.26
227.0
.J.L
0
140
28.0
420
504
z
0.00
0.14
0.94
3.02
5.26
250.0
Q
0
140
280
420
504
z
0.00
0.14
0.94
3.02
5.26
258.0
Q
0
392
784
1176
1411
z
0.00
0.14
0.94
3.02
5.26
266.0
Q
0
191
382
573
687
z
0.00
0.14
0.94
3.02
5.26
300.0
Q
I
0
165
331
496
595
z
0.00
0.14
0.94
3.02
5.26
318.0
Q
0
165
331
496
595
z
0.00
0.14
0.94
3.02
5.26
.
385.0
Q
0
204
407
611
733
z
0.00
0.14
0.94
3.02
5.26
392.0
Q
0
376
751
1127
1352
z
0.00
0.14
0.94
3.02
5.26
398.0
Q
0
210
420
630
756
z
0.00
0.14
0.94
3.02
5.26
450.0
Q
0
210
420
630
756
z
0.00
0.14
0.94
3.02
5.26
Notes: 1.
"Q"
is mobilized end bearing capacity, [kips].
2.
liZ"
is axial tip displacement, [in.}.
AXIAL LOAD TRANSFER DATA
(O-Z
DATA)
API
RP 2A (2000) Method
72-in.-Diameter Driven Pipe Piles
6
433
7.20
717
7.20
560
7.20
560
7.20
1568
7.20
763
7.20
662
7.20
662
7.20
814
7.20
1502
7.20
840
7.20
840
7.20
Texas Offshore Port System, Offshore Terminal Location
Block A-36 , Galveston Area
7
433
72.00
717
72.00
560---
72.00
560
72.00
1568
72.00
763
72.00
662
72.00
662
72.00
814
72.00
1502
I
72.00
840
72.00
840
I
72.00
.
PLATE 11b
I
Report No.
0201-6500
-~--------------------------------
I~
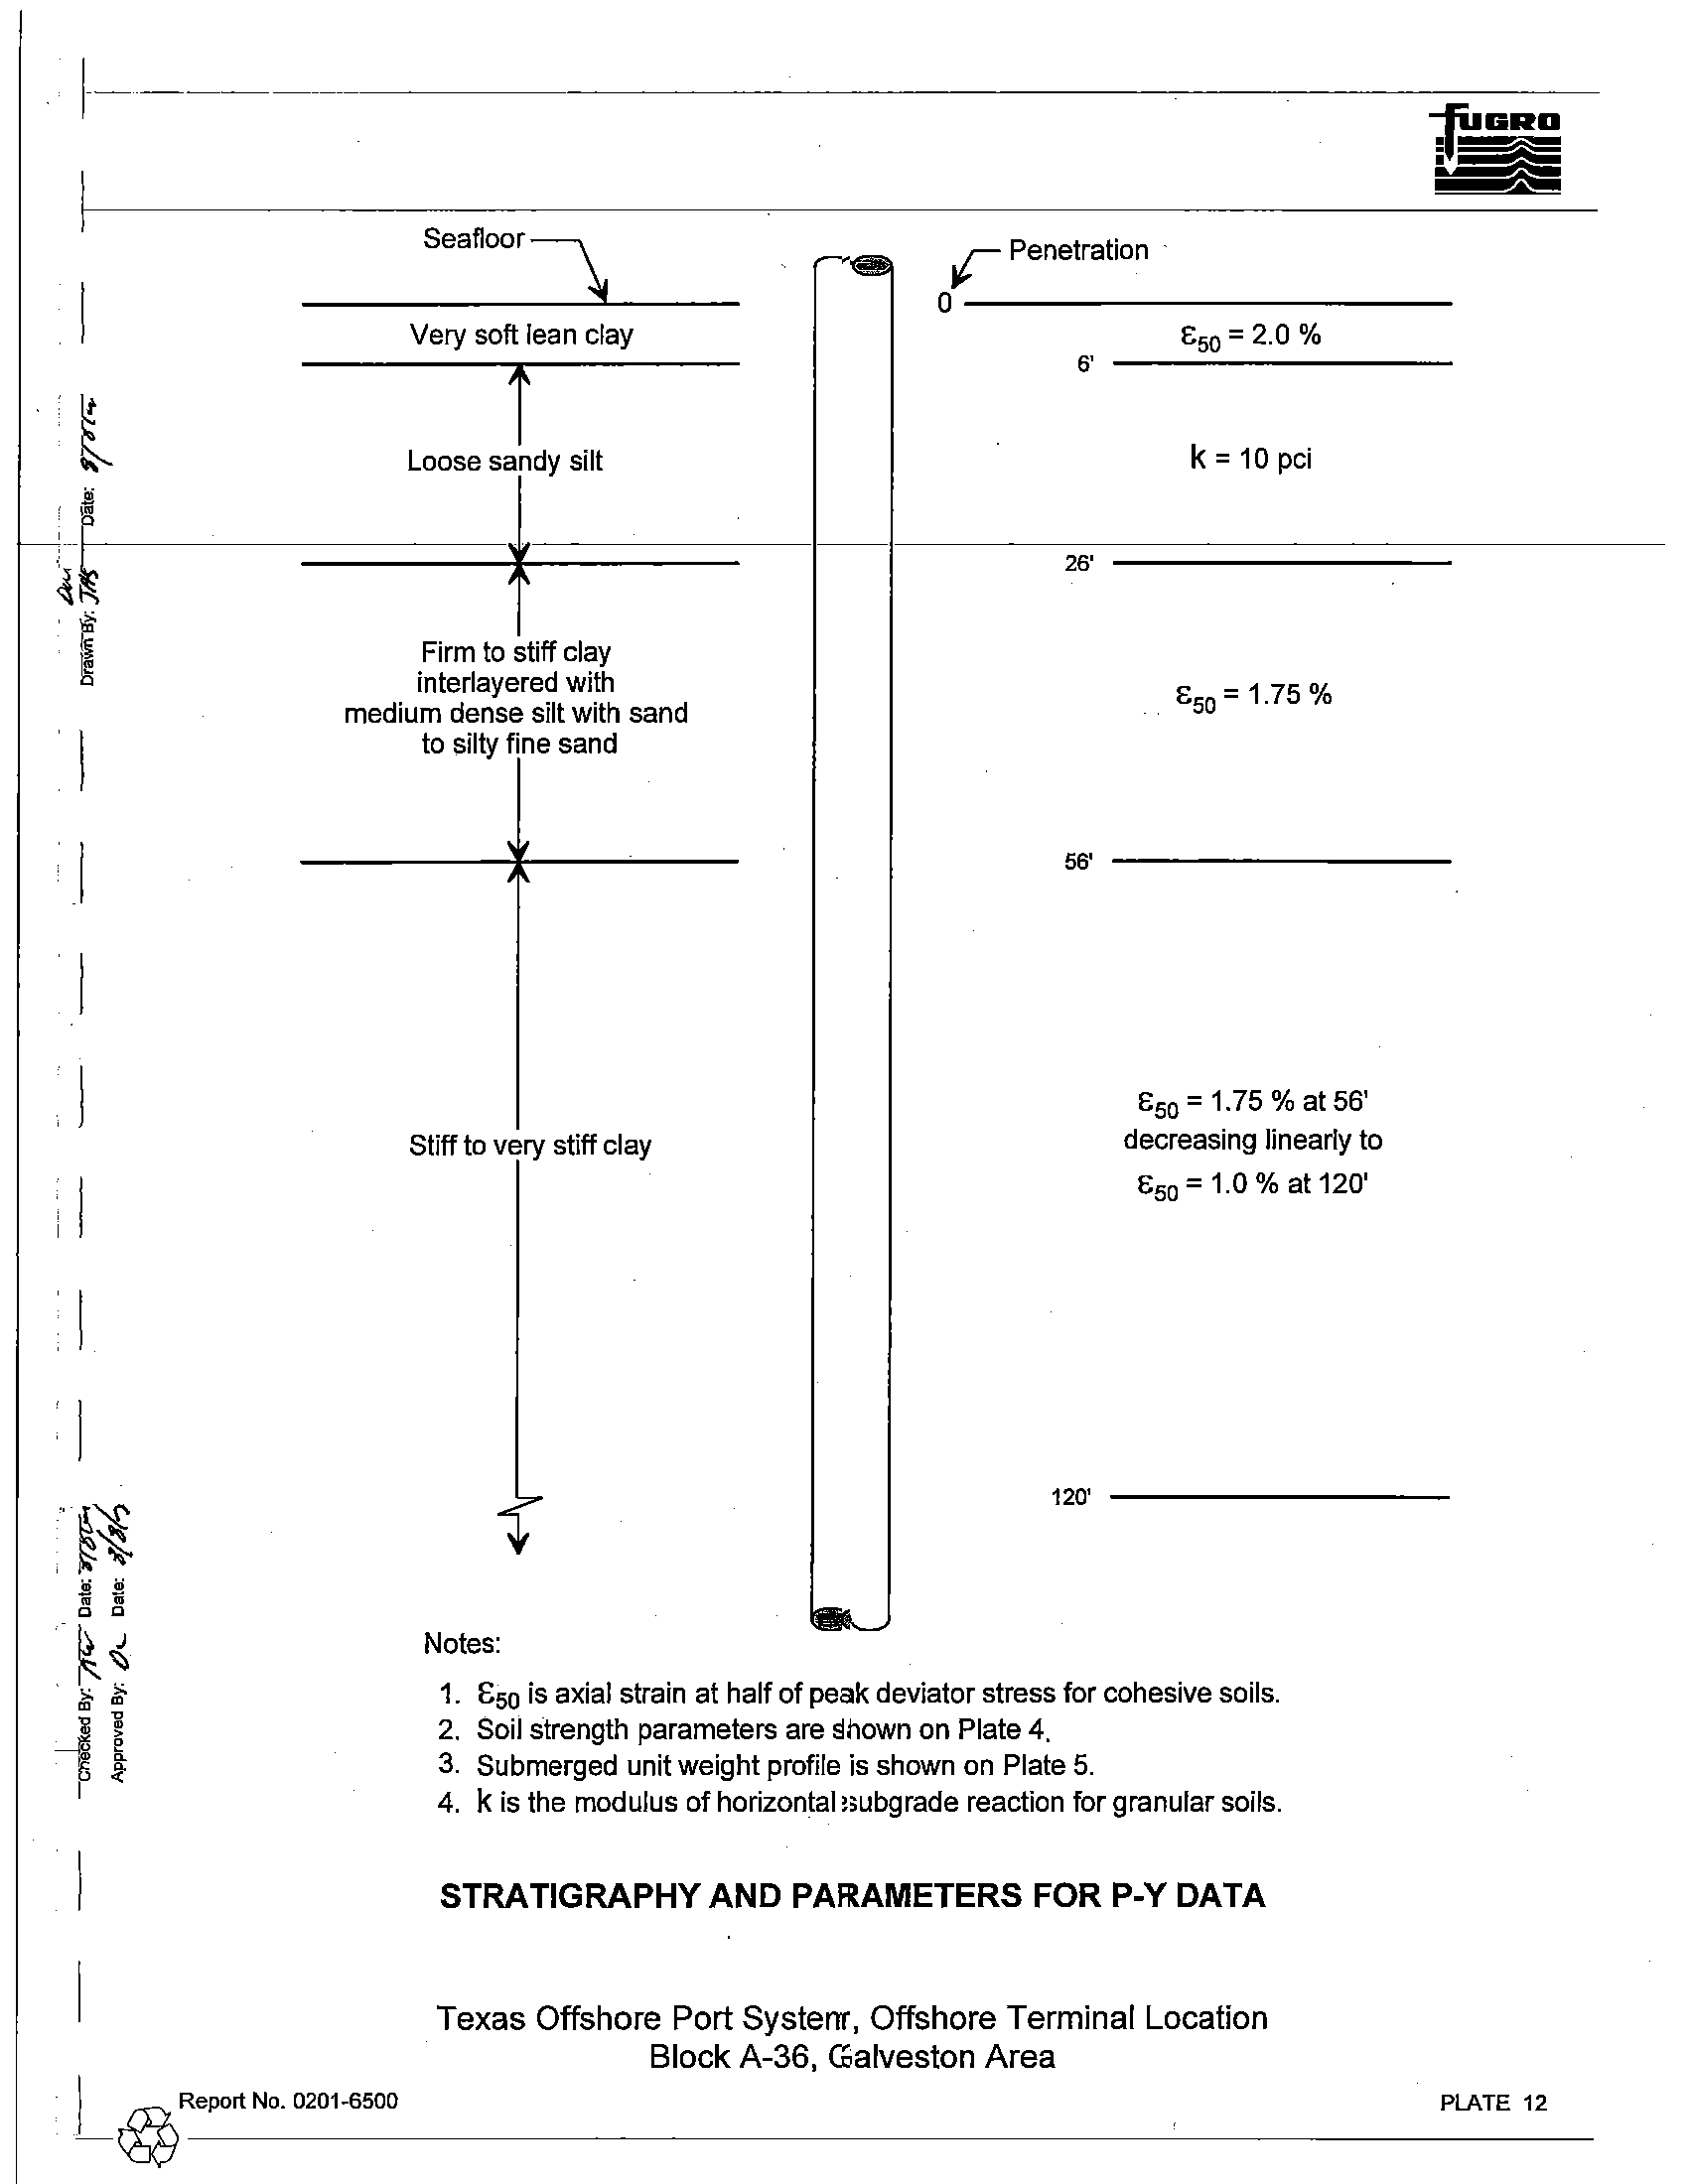
seaftoor~
r
Penetration.
I
Very soft lean clay
n
0
E50 =
2.0 %
6'
l
Loose sldY silt
k = 10 pci
,0
f
~~
~
26'
I
Firm to stiff clay
interlayered with
E =1 75 %
medium dense silt with sand
50
.
0
.1
to~'r~d
~
I
I
.~~
.~~
.l!i
.l!i
c
•
c
•
l~
>.
>.
m
m
--Jl
1) 3:
I
~
I @Report No. 0201-6500
Stiff to very stiff clay
t
---
Notes:
120'
ESO =1.75 %
at
56'
decreasing linearly to
Eso = 1.0 % at 120'
1.
E50
is axial strain at half of peak deviator stress for cohesive soils.
2. Soil strength parameters are shown on Plate 4.
3. Submerged unit weight profile is shown on Plate 5.
4. k is the modulus of horizontal subgrade reaction for granular soils.
STRATIGRAPHY AND PARAMETERS FOR P-Y DATA
Texas Offshore Port System, Offshore Terminal Location
Block A-36, Galveston Area
PLATE 12
1---------------
.
i
, 1
~
~
;;
•
'<i
0
~
>.
"
~
1
~
.
~
.
e
G
~
PENETRATION
BELOW
MUDLINE
(feet)
1
0.0
p
0
y
0.00
3.0
P
0
Y
0.00
6,0--
-p
0
Y
0.00
6.0
P
0
Y
0.00
10.0
P
0
Y
0.00
14.0
P
0
Y
0.00
18.0
P
0
Y
0.00
22.0
P
0
Y
0.00
26.0
P
0
Y
0.00
26.0
P
0
Y
0.00
27.0
P
0
Y
0.00
56.0
P
0
Y
0.00
56.0
P
0
Y
0.00
120.0
P
0
(and below)
y
0.00
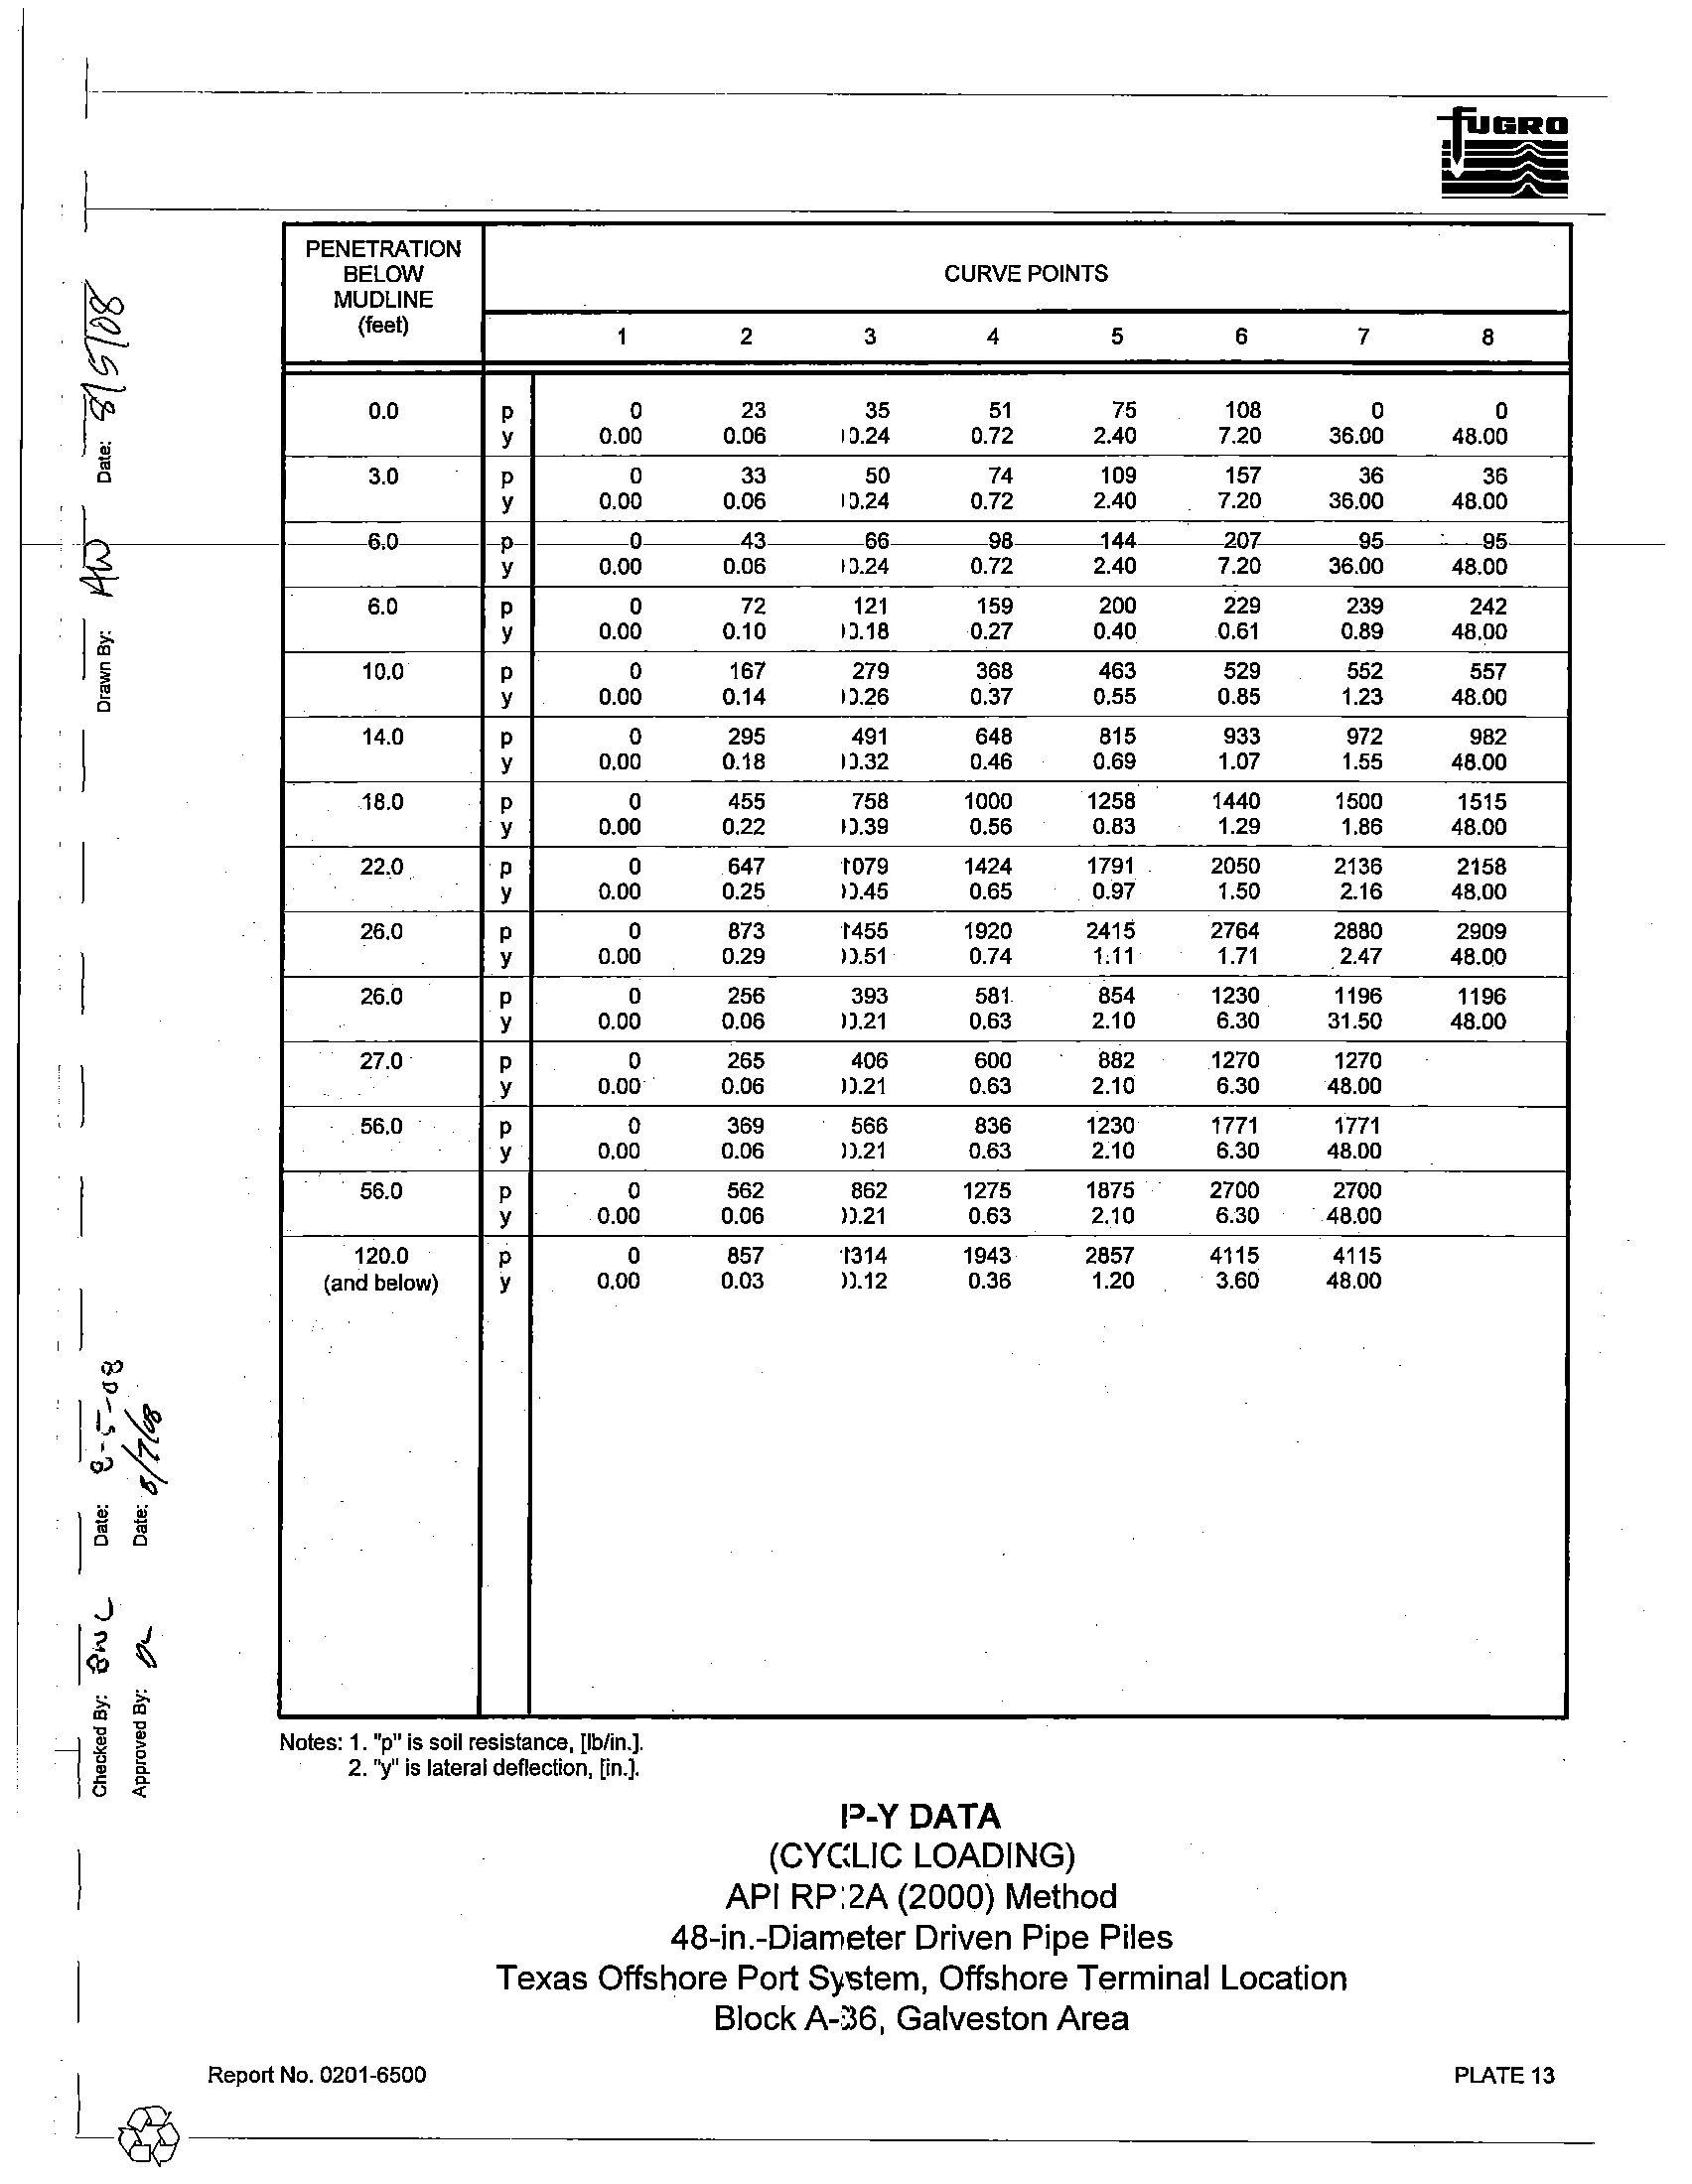
Notes: 1. lip" is soil resistance, lib/in.].
2.
"y"
is lateral deflection, [in.].
CURVE POINTS
2
3
4
5
23
35
51
75
0.06
0.24
0.72
2.40
33
50
74
109
0.06
0.24
0.72
2.40
43
66
98
144
0.06
0.24
0.72
2.40
72
121
159
200
0.10
0.18
0.27
0.40
167
279
368
463
0.14
0.26
0.37
0.55
295
491
648
815
0.18
0.32
0.46
0.69
455
758
1000
1258
0.22
0.39
0.56
0.83
647
1079
1424
1791
0.25
0.45
0.65
0.97
873
1455
1920
2415
0.29
0.51
0.74
Ul
256
393
581
854
0.06
0.21
0.63
2.10
265
406
600
882
0.06
0.21
0.63
2.10
369
566
836
1230
0.06
0.21
0.63
2.10
562
862
1275
1875 .
0.06
0.21
0.63
2.10
857
1314
1943
2857
0.03
0.12
0.36
1.20
P-Y DATA
(CYCLIC LOADING)
API RP 2A (2000) Method
48-in.-Diameter Driven Pipe Piles
6
7
108
0
7.20
36.00
157
36
7.20
36.00
207
95
7.20
36.00
229
239
0.61
0.89
529
552
0.85
1.23
933
972
1.07
1.55
1440
1500
1.29
1.86
2050
2136
1.50
2.16
2764
2880
1.71
2.47
1230
1196
6.30
31.50
1270
1270
6.30
48.00
1771
1771
6.30
48.00
2700
2700
6.30
48.00
4115
4115
3.60
48.00
Texas Offshore Port System, Offshore Terminal Location
Block A-36,
Galveston
Area
8
0
48.00
36
48.00
95--
48.00
242
48.00
557
48.00
982
48.00
1515
48.00
2158
48.00
2909
48.00
1196
48.00
1
Report No.
0201-6500
PLATE 13
-~------------------
I
""-
, I
I
,----
Ti
a:
.
g
•
~
<3
~
j
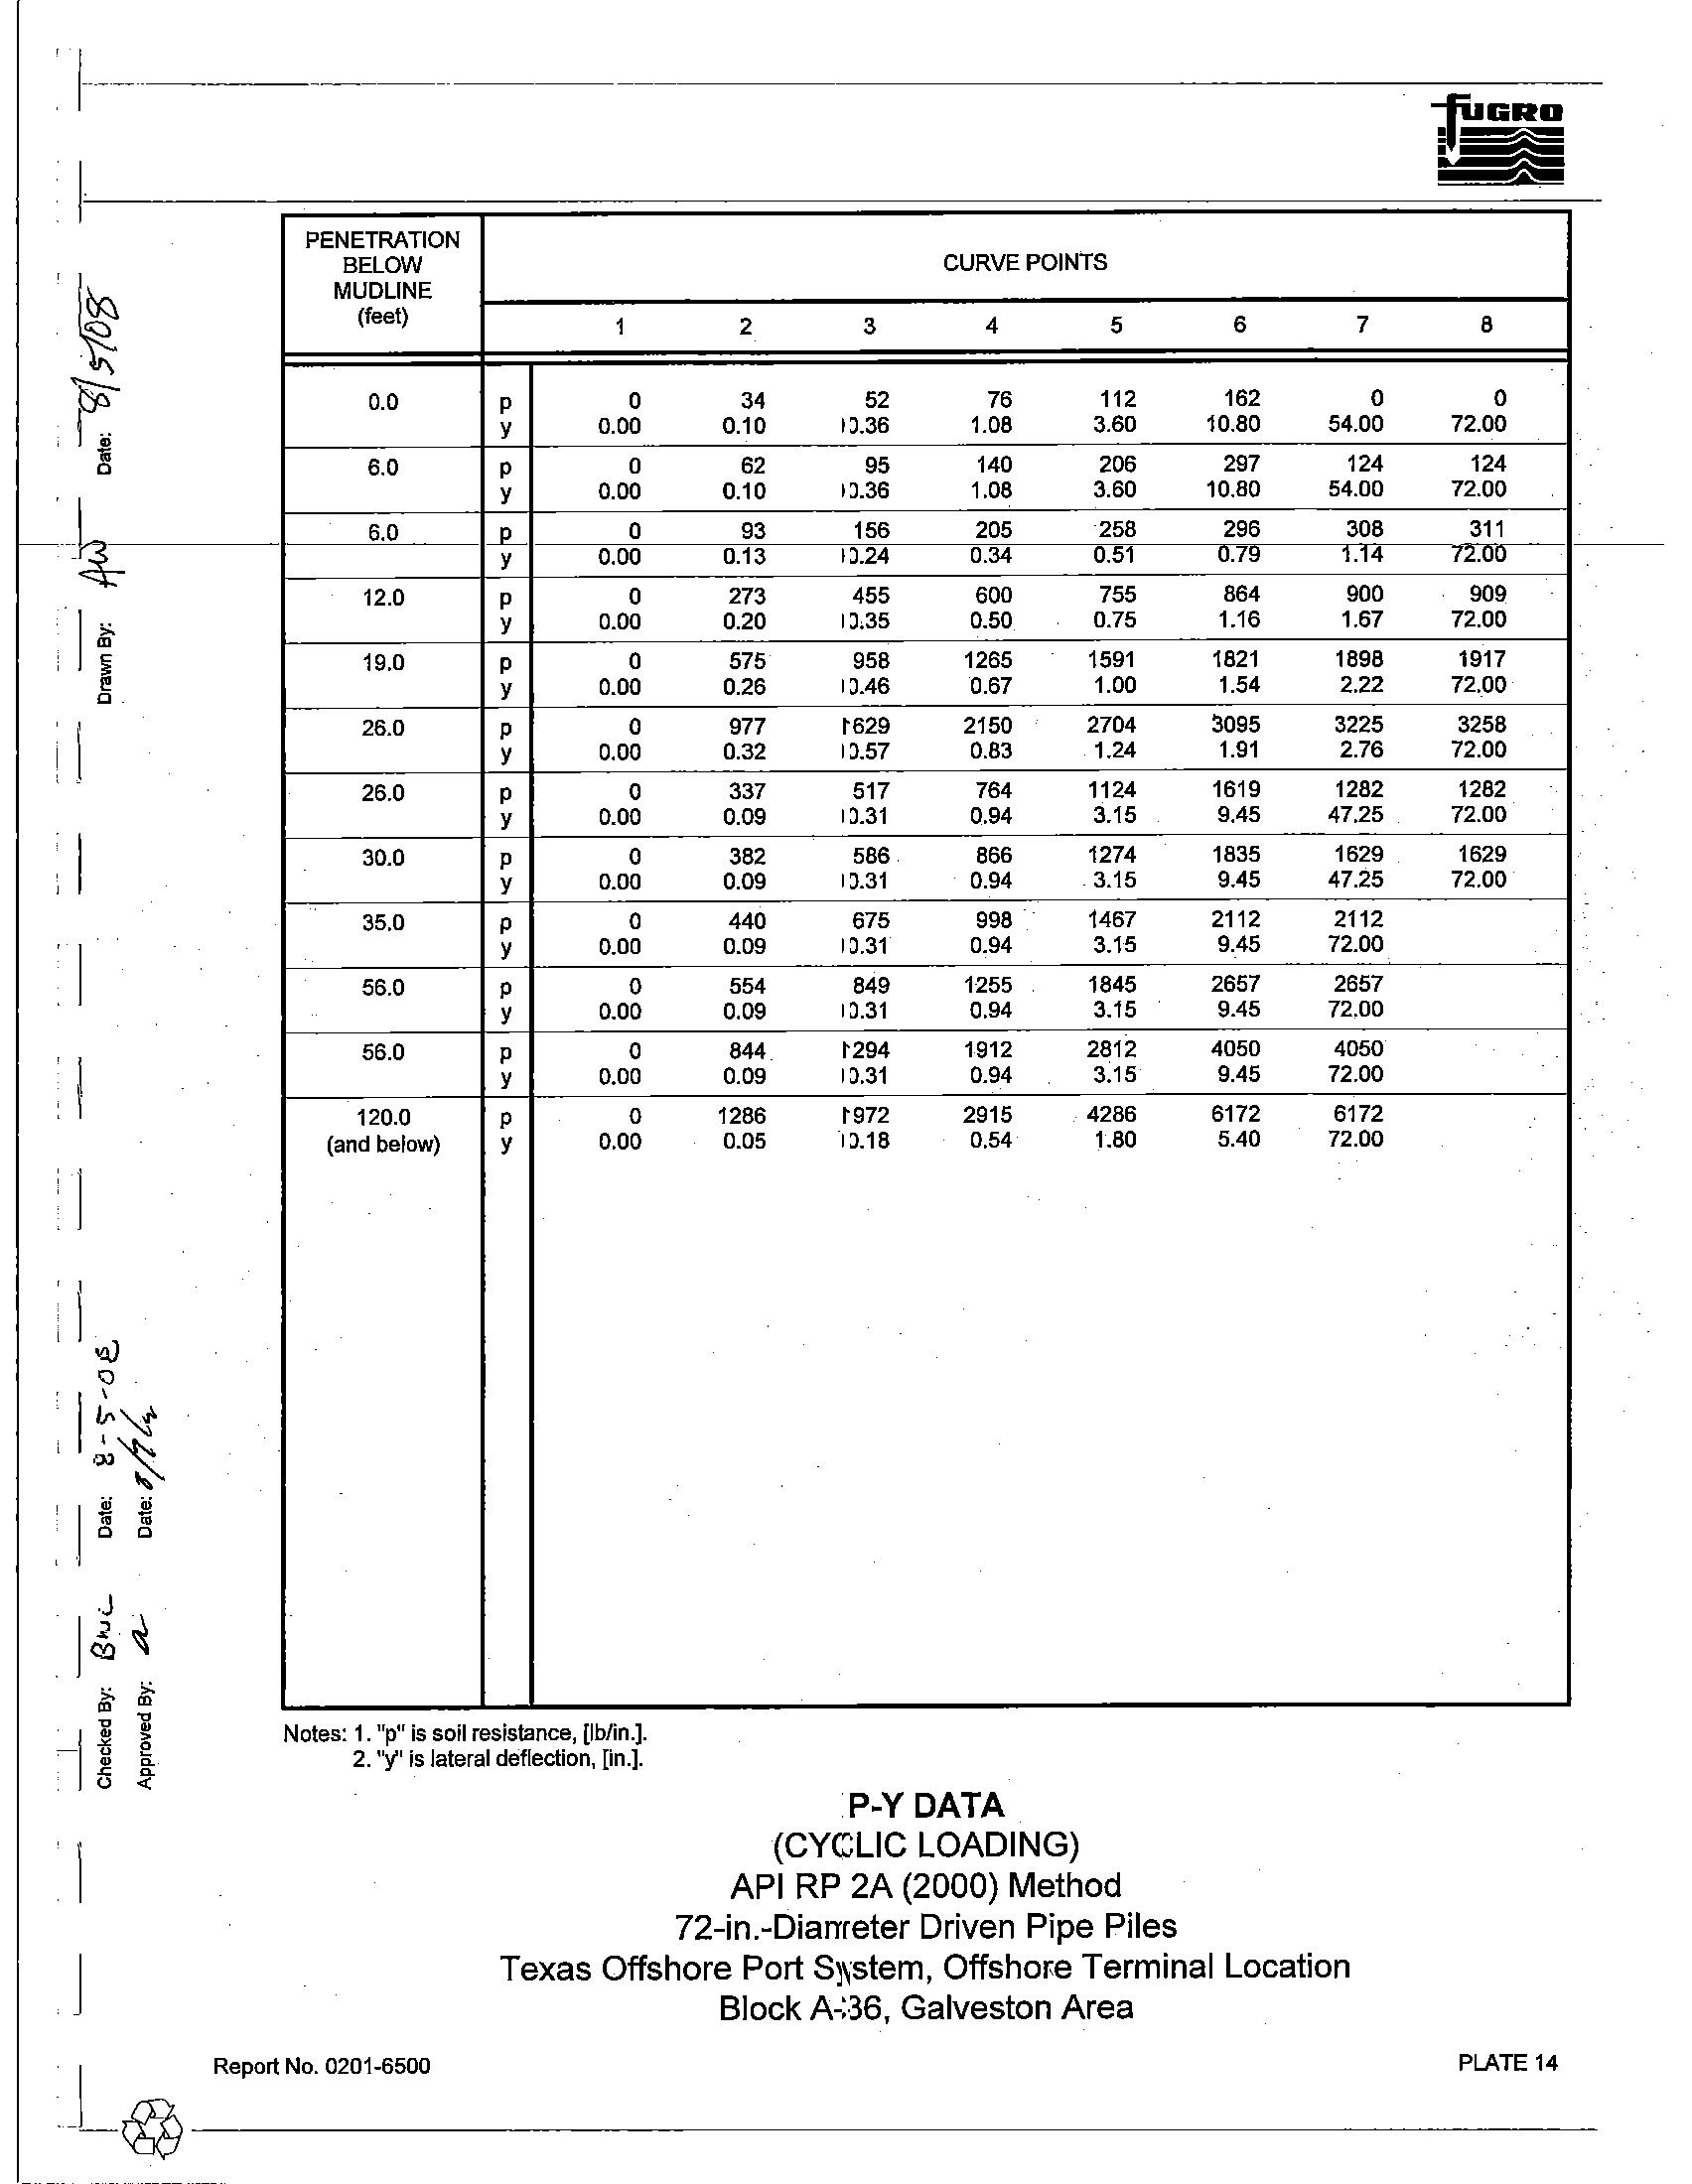
Notes: 1.
up"
is soil resistance, [lb/in.].
2. '''/' is lateral deflection, [in.].
P-Y
DATA
(CYCLIC LOADING)
API RP
2A (2000) Method
72-in.-Diameter Driven Pipe Piles
Texas Offshore Port System, Offshore Terminal Location
Block A-36, Galveston Area
PLATE 14
I
Report No.
0201-6500
._-@-----------------
I~-- --~-
----
-tUURD
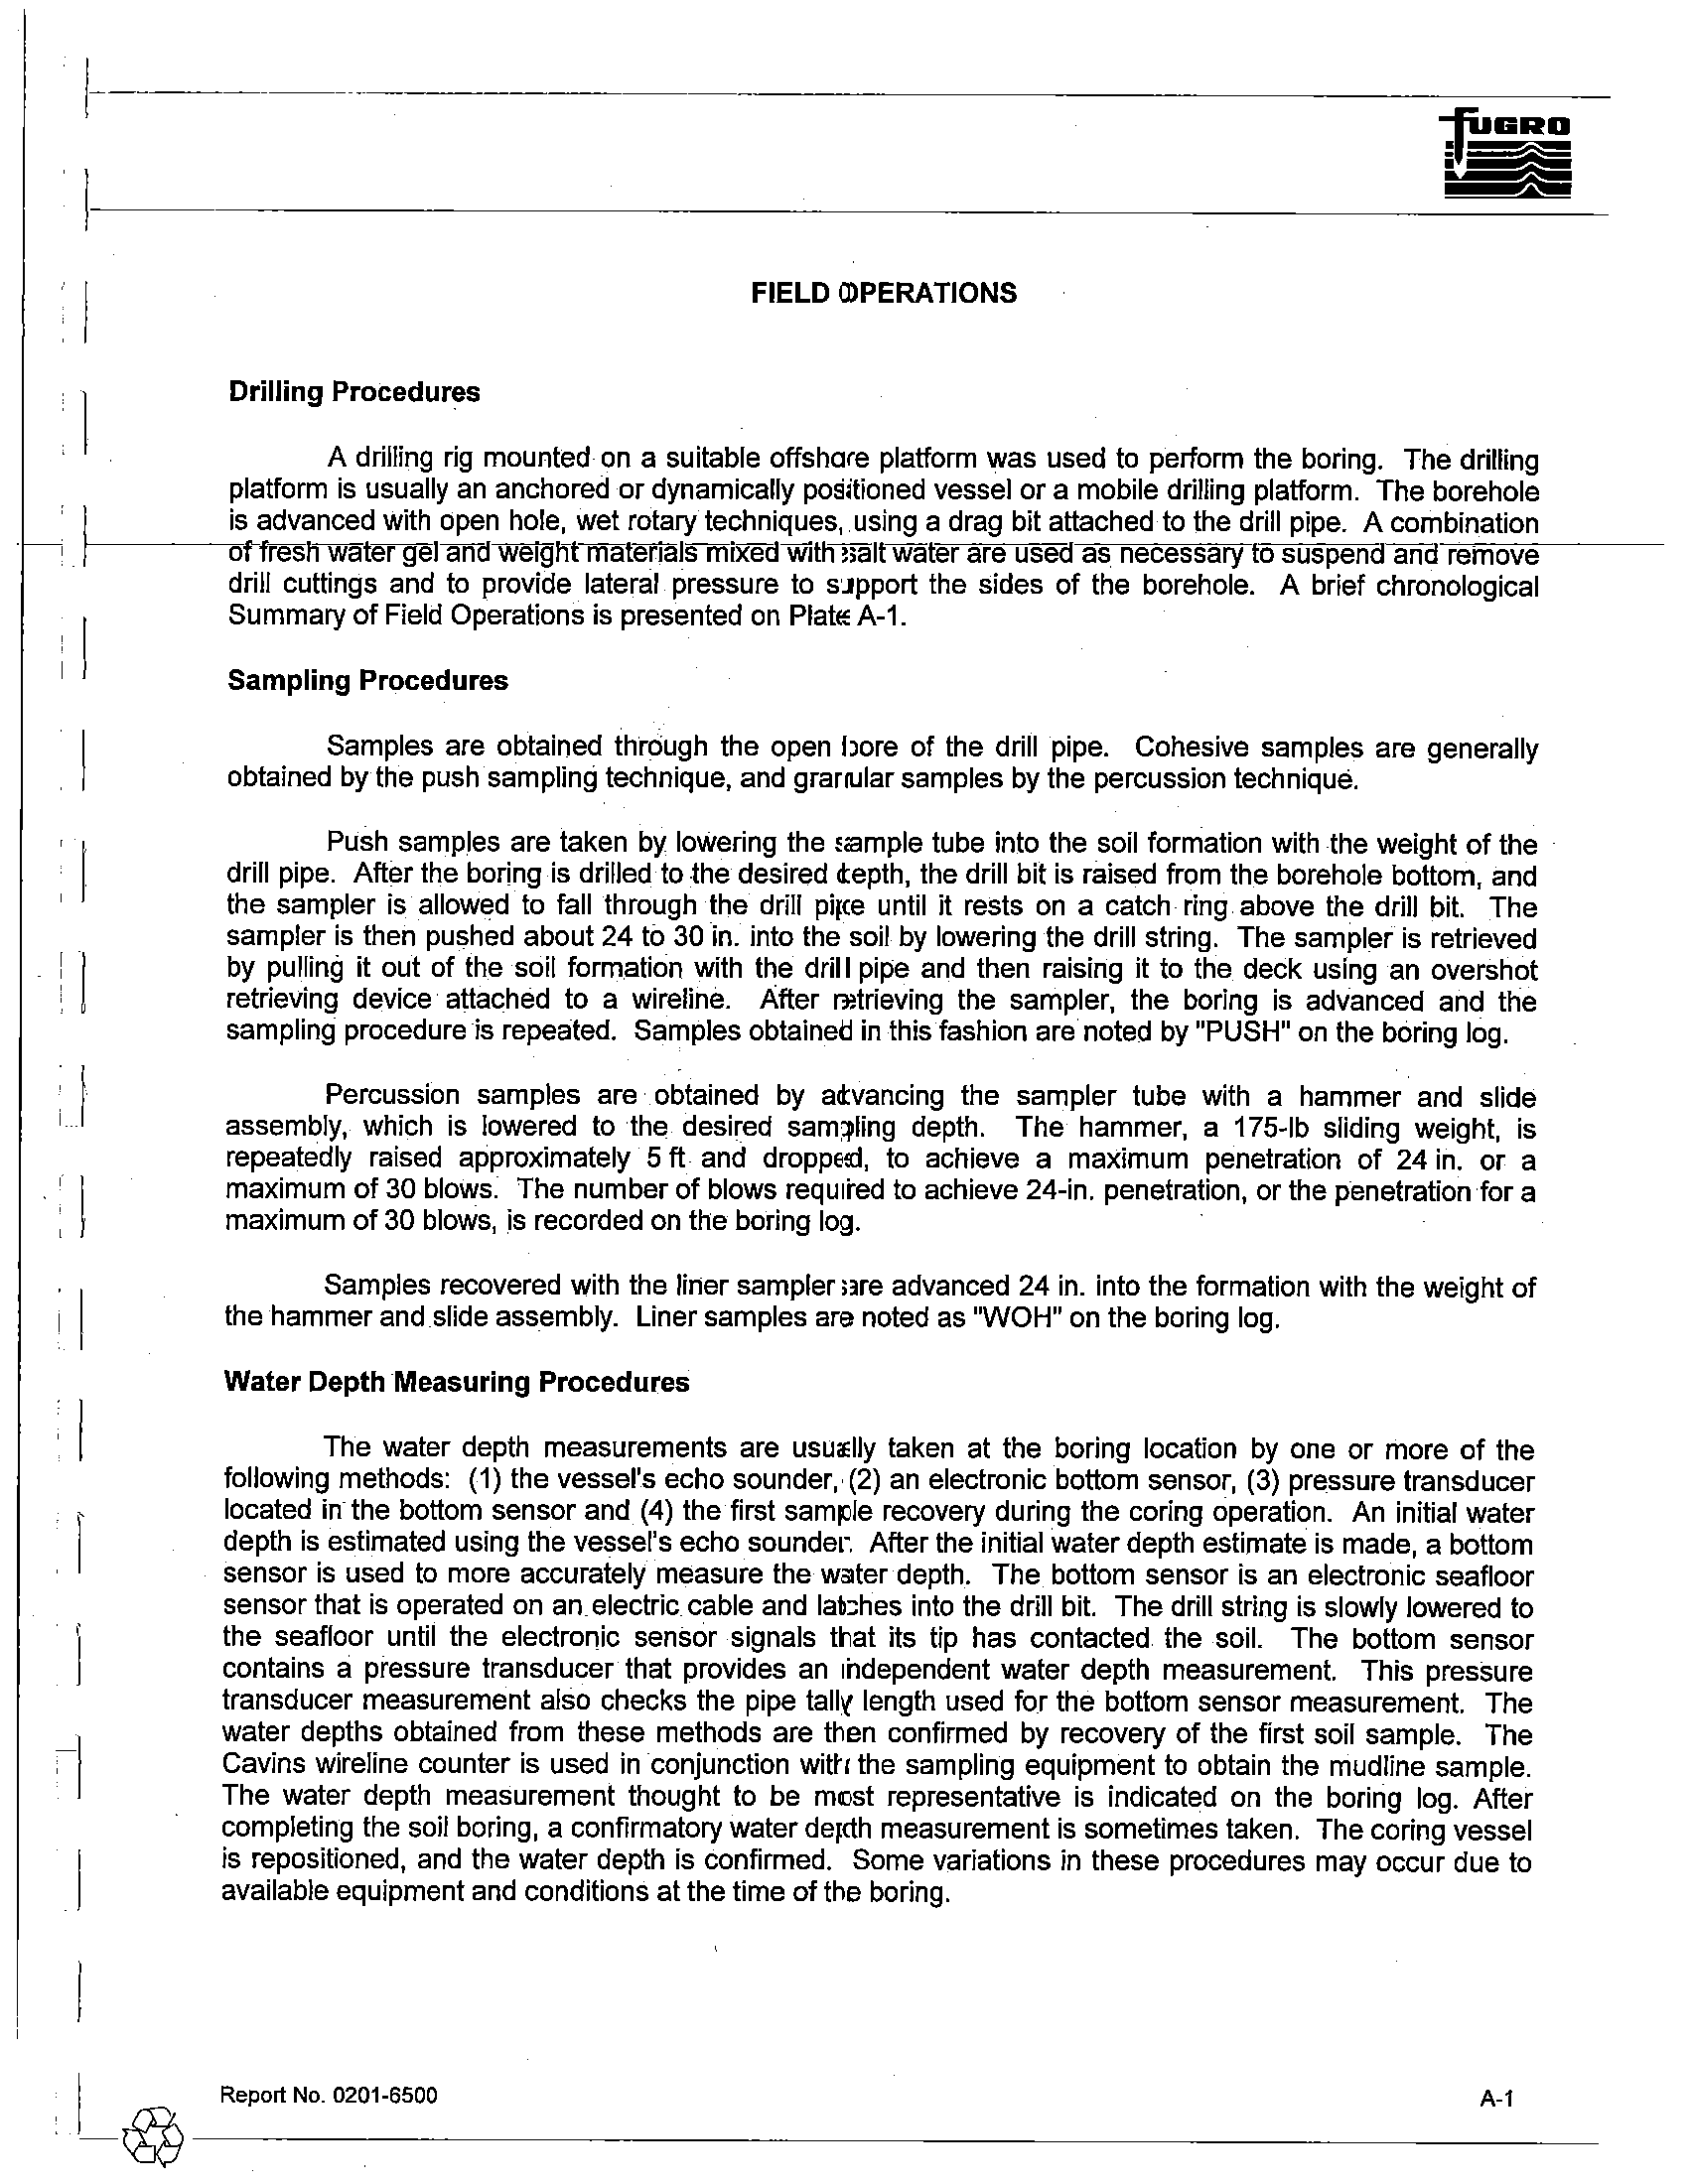
FIELD
OPERATIONS
Drilling Procedures
A drilling
rig mounted on a suitable offshore platform was used to perform the boring. The drilling
platform
is usually an anchored or dynamically positioned vessel or a mobile drilling platform. The borehole
is advanced with open hole, wet rotary techniques, using a drag bit attached to the drill pipe. A combination
i-------.
o
-.fffresil water gel ana welgl1t malenals mixeClWitll salt water are usea as necessary to suspena ana--re"'tn=o"'v"'e----
drill cuttings and to provide lateral pressure to support the sides
of the borehole. A brief chronological
I
,I
I
~I
Summary of Field Operations is presented on Plate A-1.
Sampling Procedures
Samples are obtained through the open bore of the drill pipe. Cohesive samples are generally
obtained
by the push sampling technique, and granular samples by the percussion technique.
Push samples are taken
by lowering the sample tube into the soil formation with the weight of the
drill pipe. After the boring is drilled to the desired depth, the drill bit is raised from the borehole bottom, and
the sampler is allowed to fall through the drill pipe until it rests
on a catch ring above the drill bit. The
sampler
is then pushed about 24 to 30 in. into the soil by lowering the drill string. The sampler is retrieved
by pulling it out of the soil formation with the drill pipe
and then raising it to the deck using an overshot
retrieving device attached to a wireline.
After retrieving the sampler, the boring is advanced and the
sampling procedure is repeated. Samples obtained
in this fashion are noted by "PUSH" on the boring log.
Percussion samples are obtained
by advancing the sampler tube with a hammer and slide
assembly, which is lowered to
the desired sampling depth.
The hammer, a 175-lb sliding weight, is
repeatedly raised approximately 5 ft and dropped, to achieve a maximum penetration
of 24 in. or a
maximum
of 30 blows. The number of blows required to achieve 24-in. penetration, or the penetration for a
maximum
of 30 blows, is recorded on the boring log.
Samples recovered with the liner sampler are advanced 24 in. into the formation with the weight of
the hammer and slide assembly. Liner samples are noted as "WOH" on the boring log.
Water Depth Measuring Procedures
The water depth measurements are usually taken at the boring location
by one or more of the
following methods: (1) the vessel's echo sounder, (2)
an electronic bottom sensor, (3) pressure transducer
located
in the bottom sensor and (4) the first sample recovery during the coring operation. An initial water
depth
is estimated using the vessel's echo sounder. After the initial water depth estimate is made, a bottom
sensor
is used to more accurately measure the water depth. The bottom sensor is an electronic seafloor
sensor that
is operated on an electric cable and latches into the drill bit. The drill string is slowly lowered to
the seafloor until the electronic sensor signals that its tip has contacted the soil. The bottom sensor
contains a pressure transducer that provides
an independent water depth measurement. This pressure
transducer measurement also checks the pipe tally length used for the bottom sensor measurement. The
water depths obtained from these methods are then confirmed
by recovery of the first soil sample. The
Cavins wireline counter is used
in conjunction with the sampling equipment to obtain the mudline sample.
The water depth measurement thought to be most representative is indicated
on the boring log. After
completing
the soil boring, a confirmatory water depth measurement is sometimes taken. The coring vessel
is repositioned,
and the water depth is confirmed. Some variations in these procedures may occur due to
available equipment
and conditions at the time of the boring.
I
Report No. 0201.6500
~~---------------------------------
A-1
'~---------------"'~
,\
I
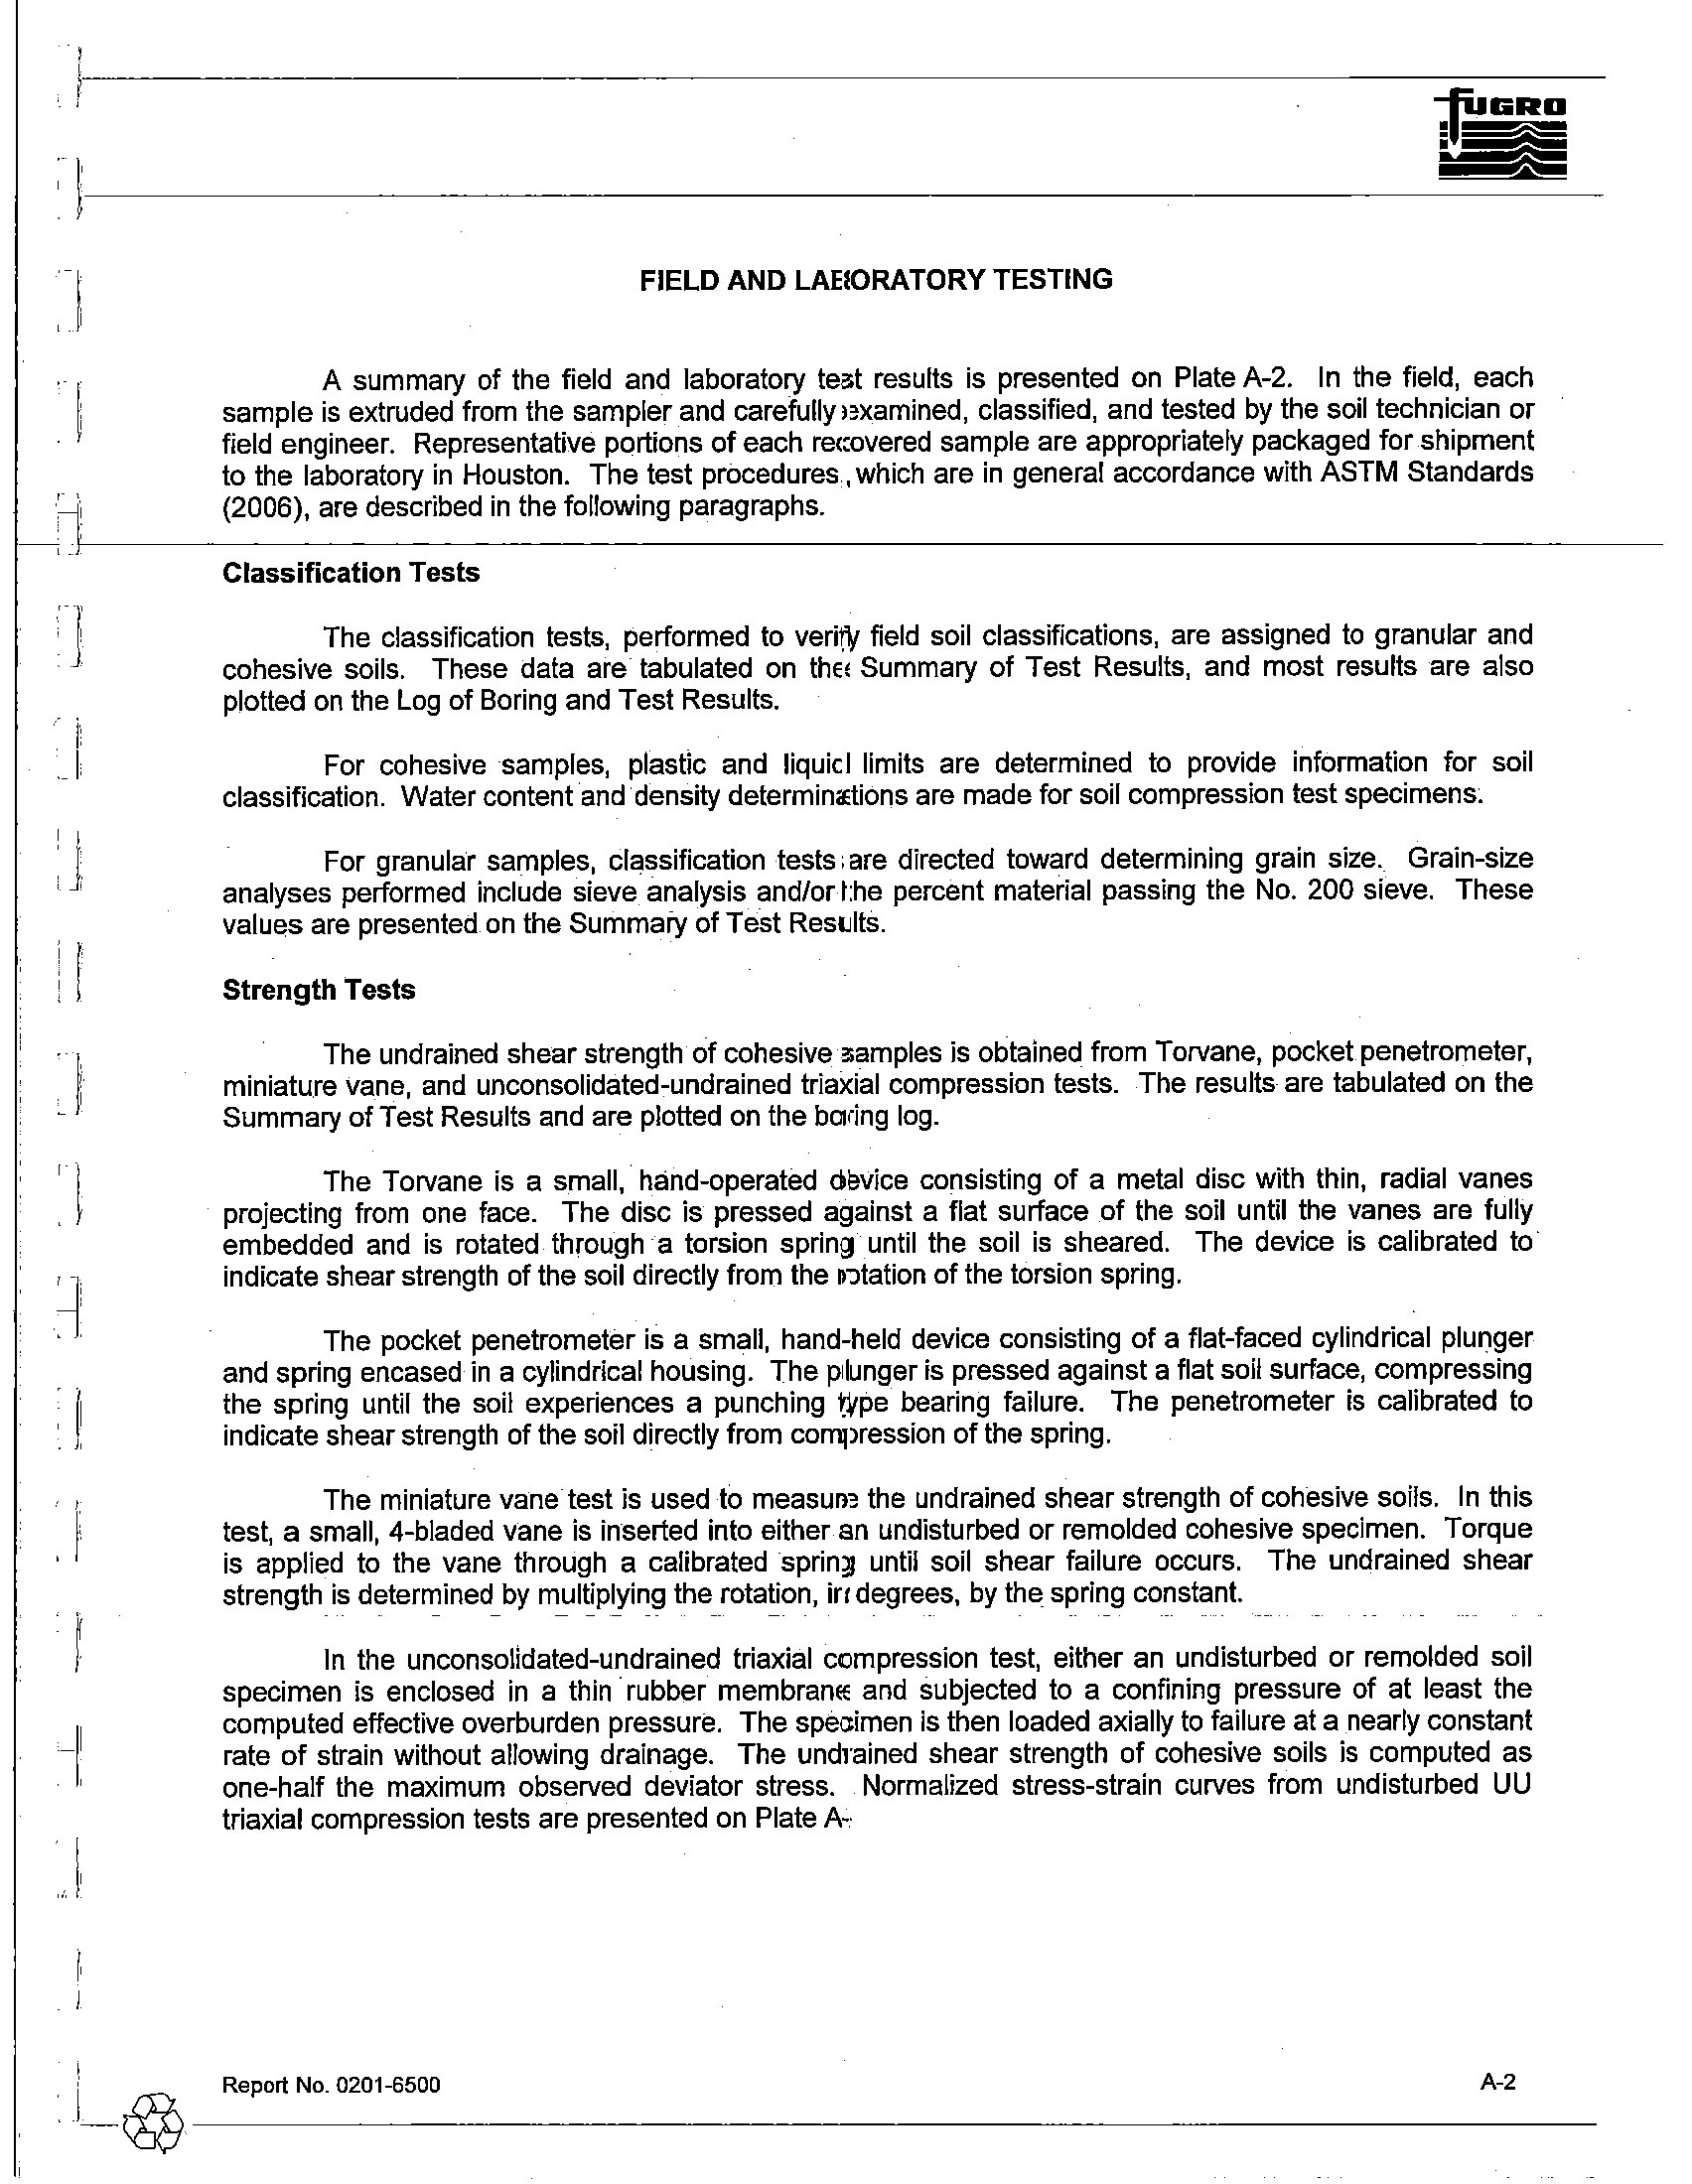
FIELD AND LABORATORY TESTING
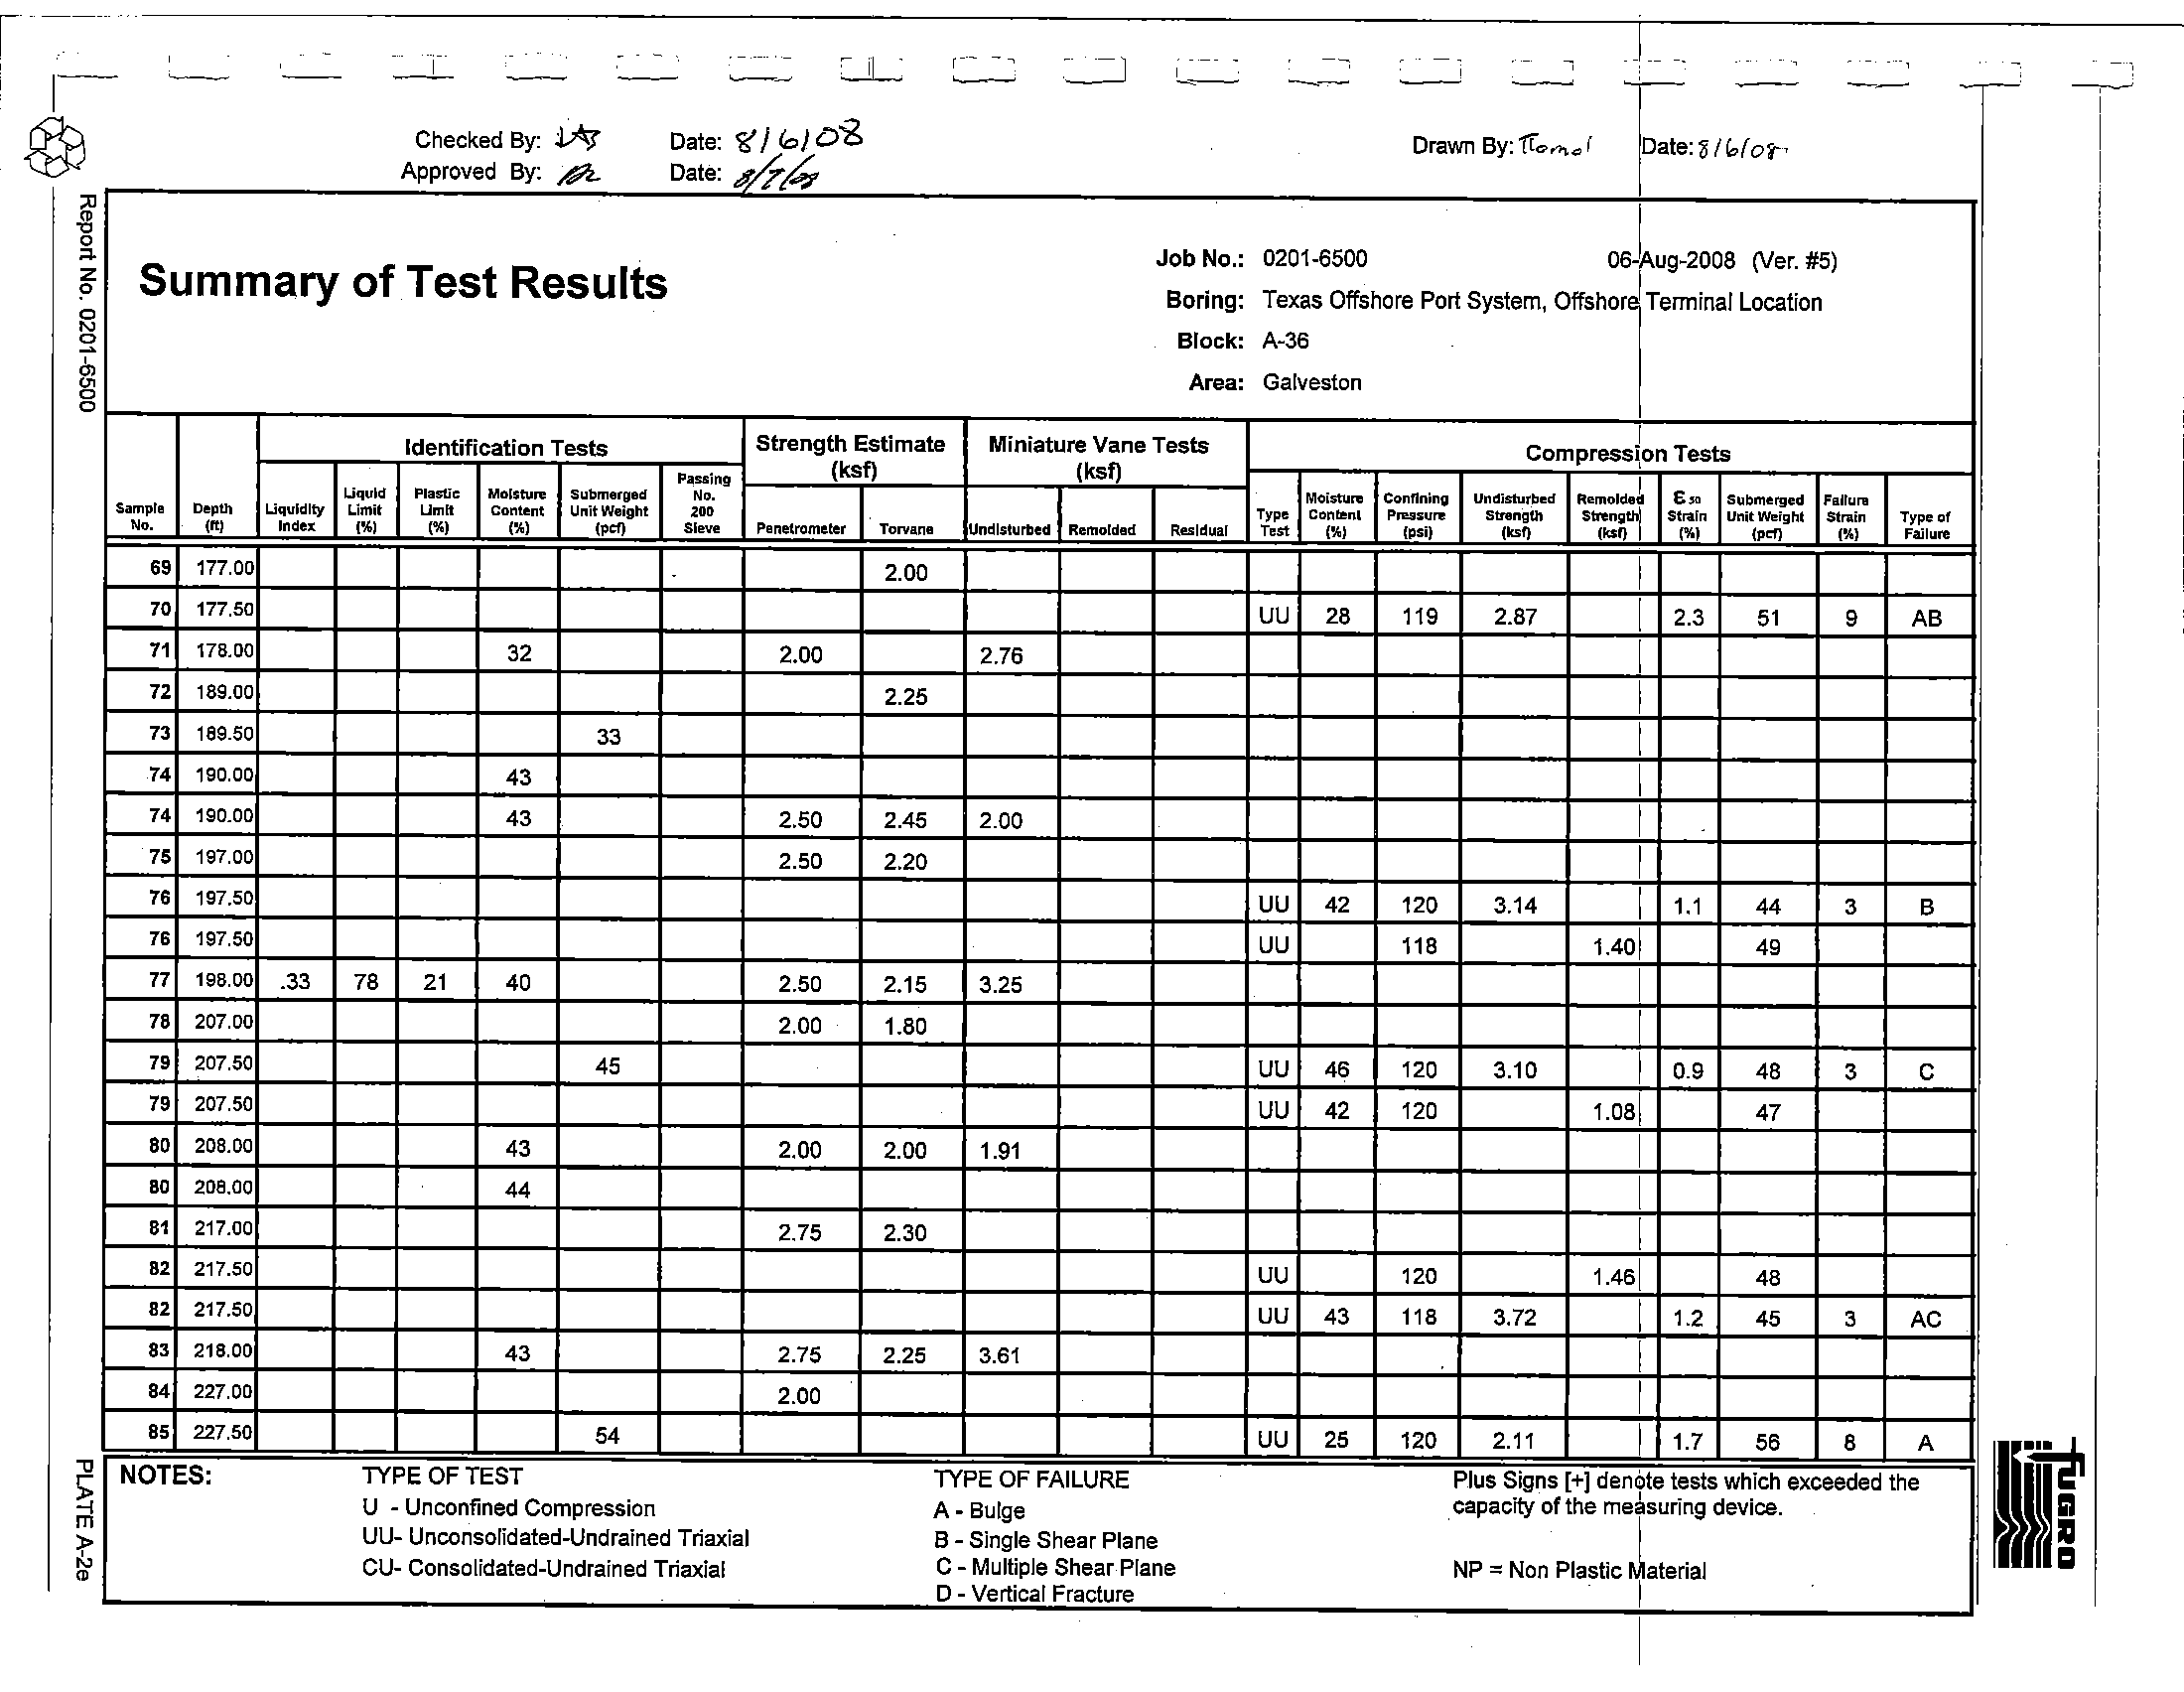
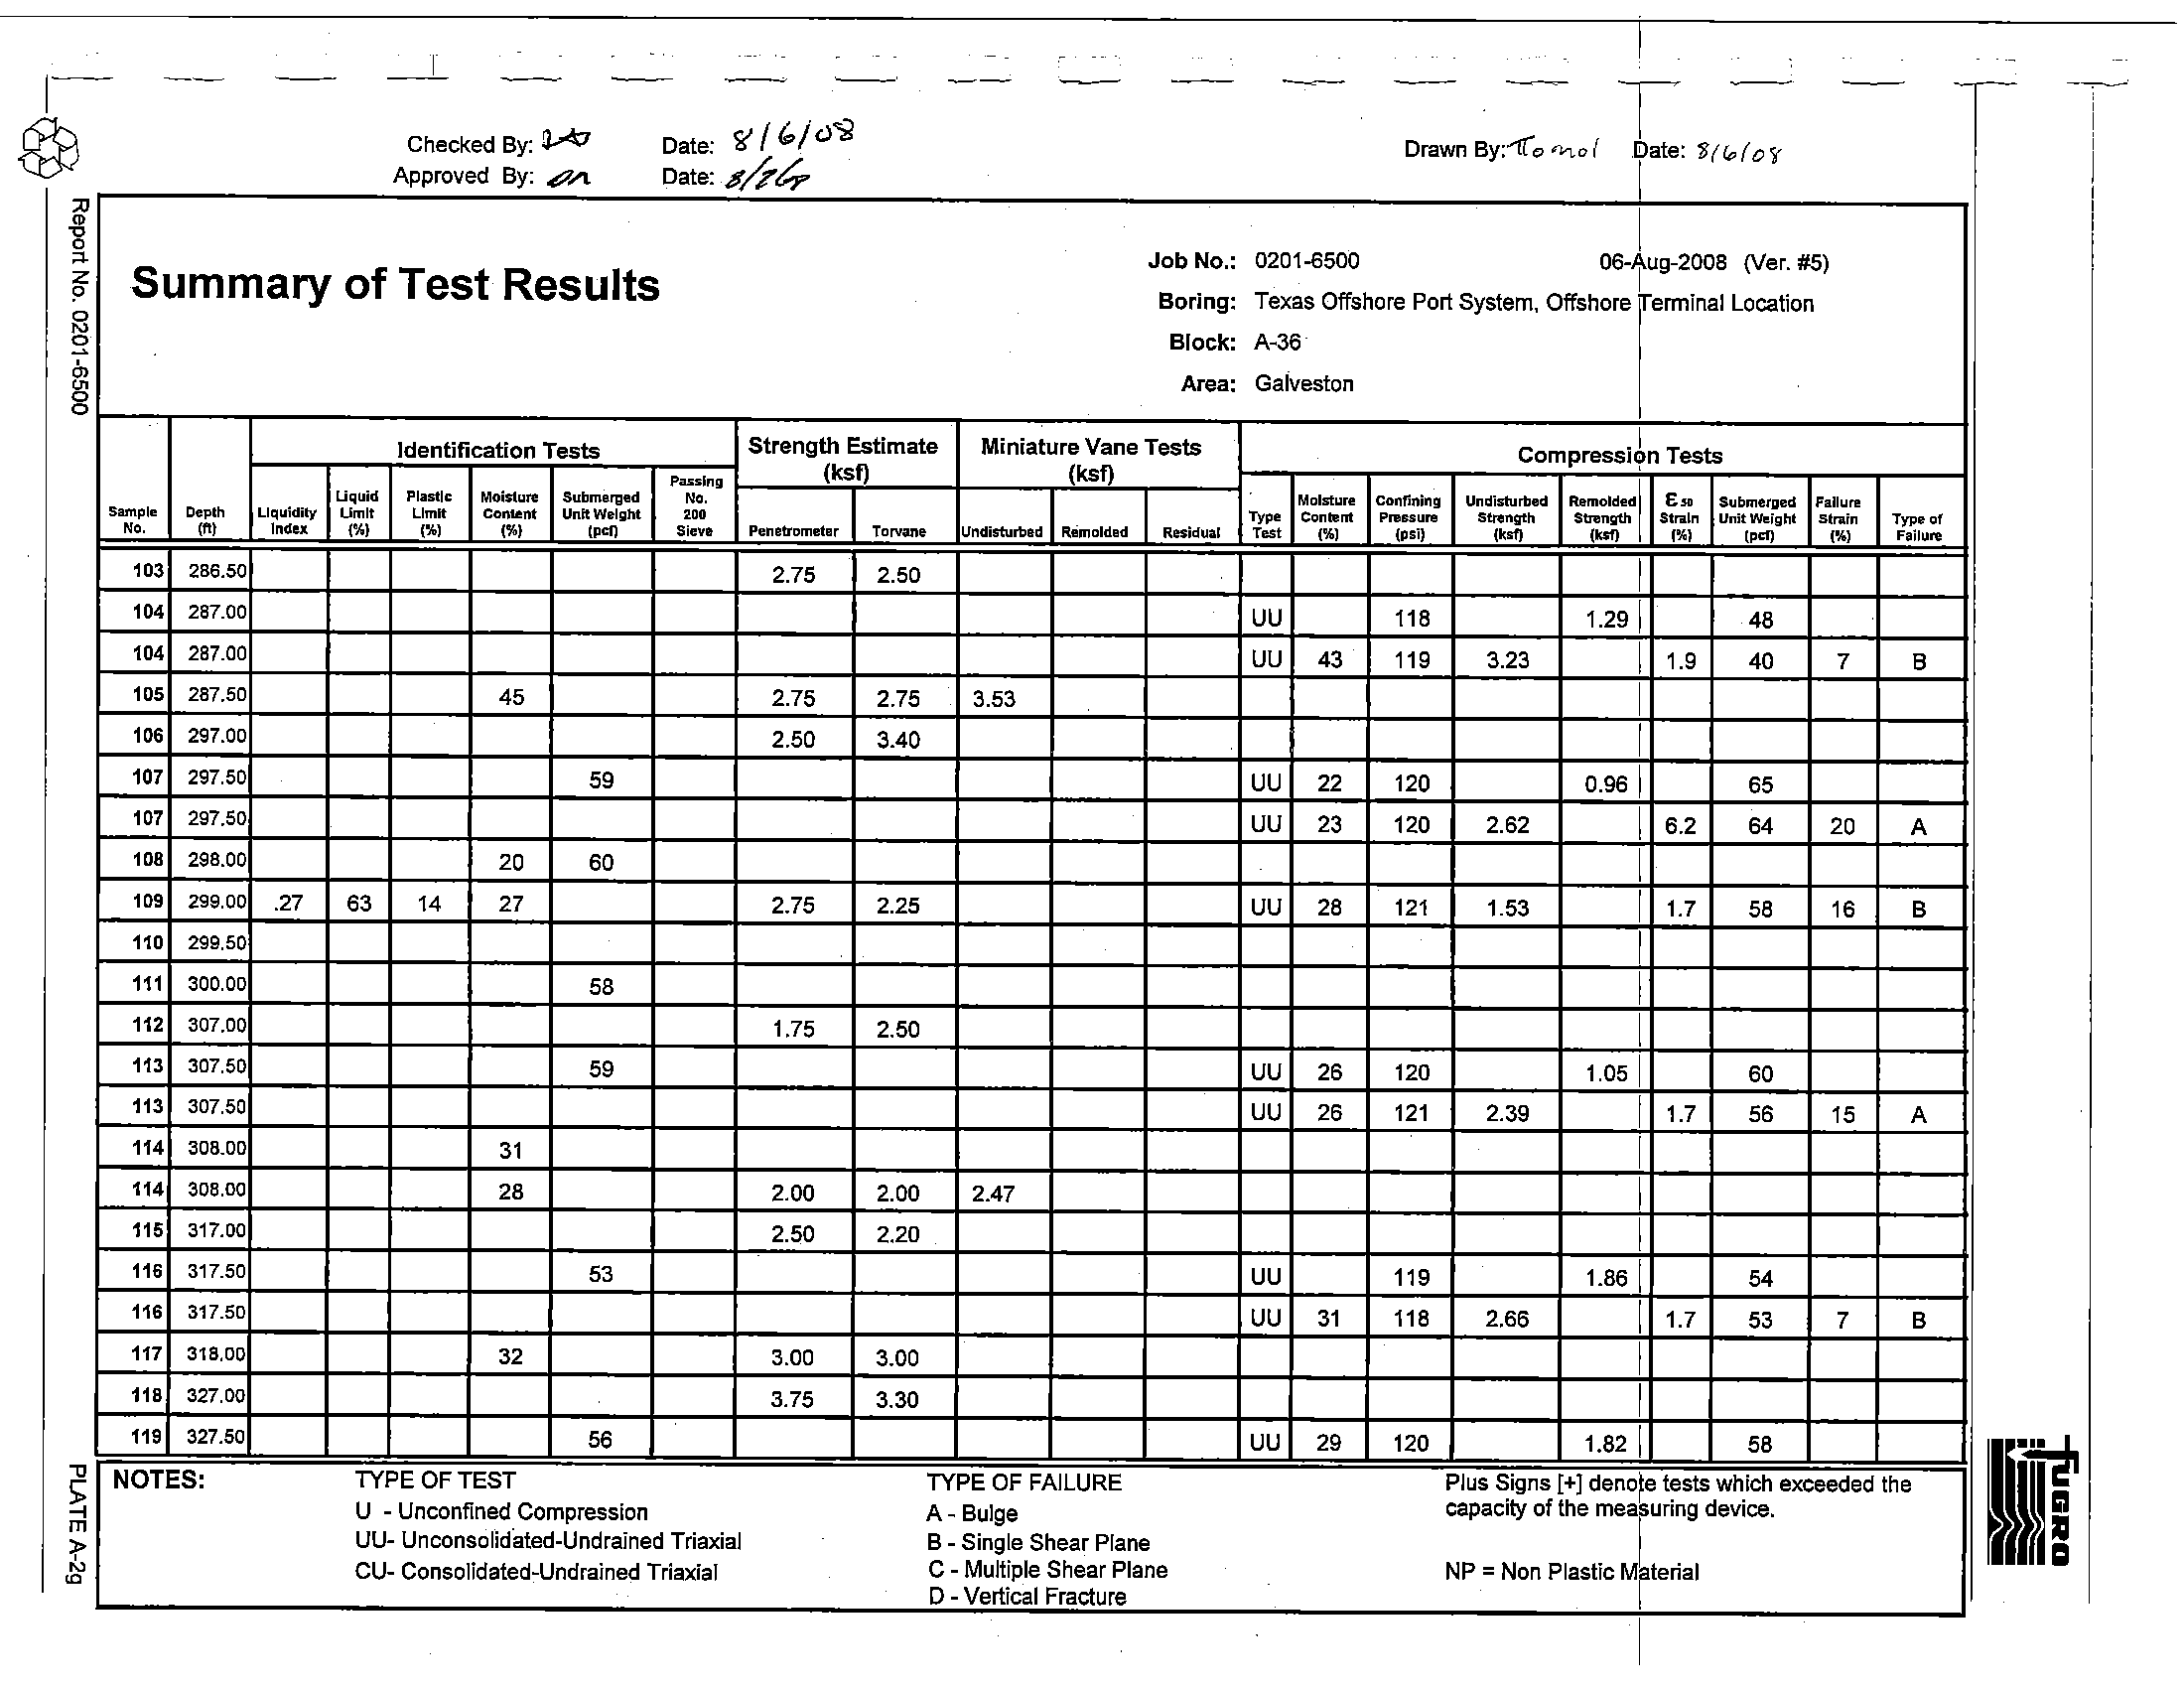
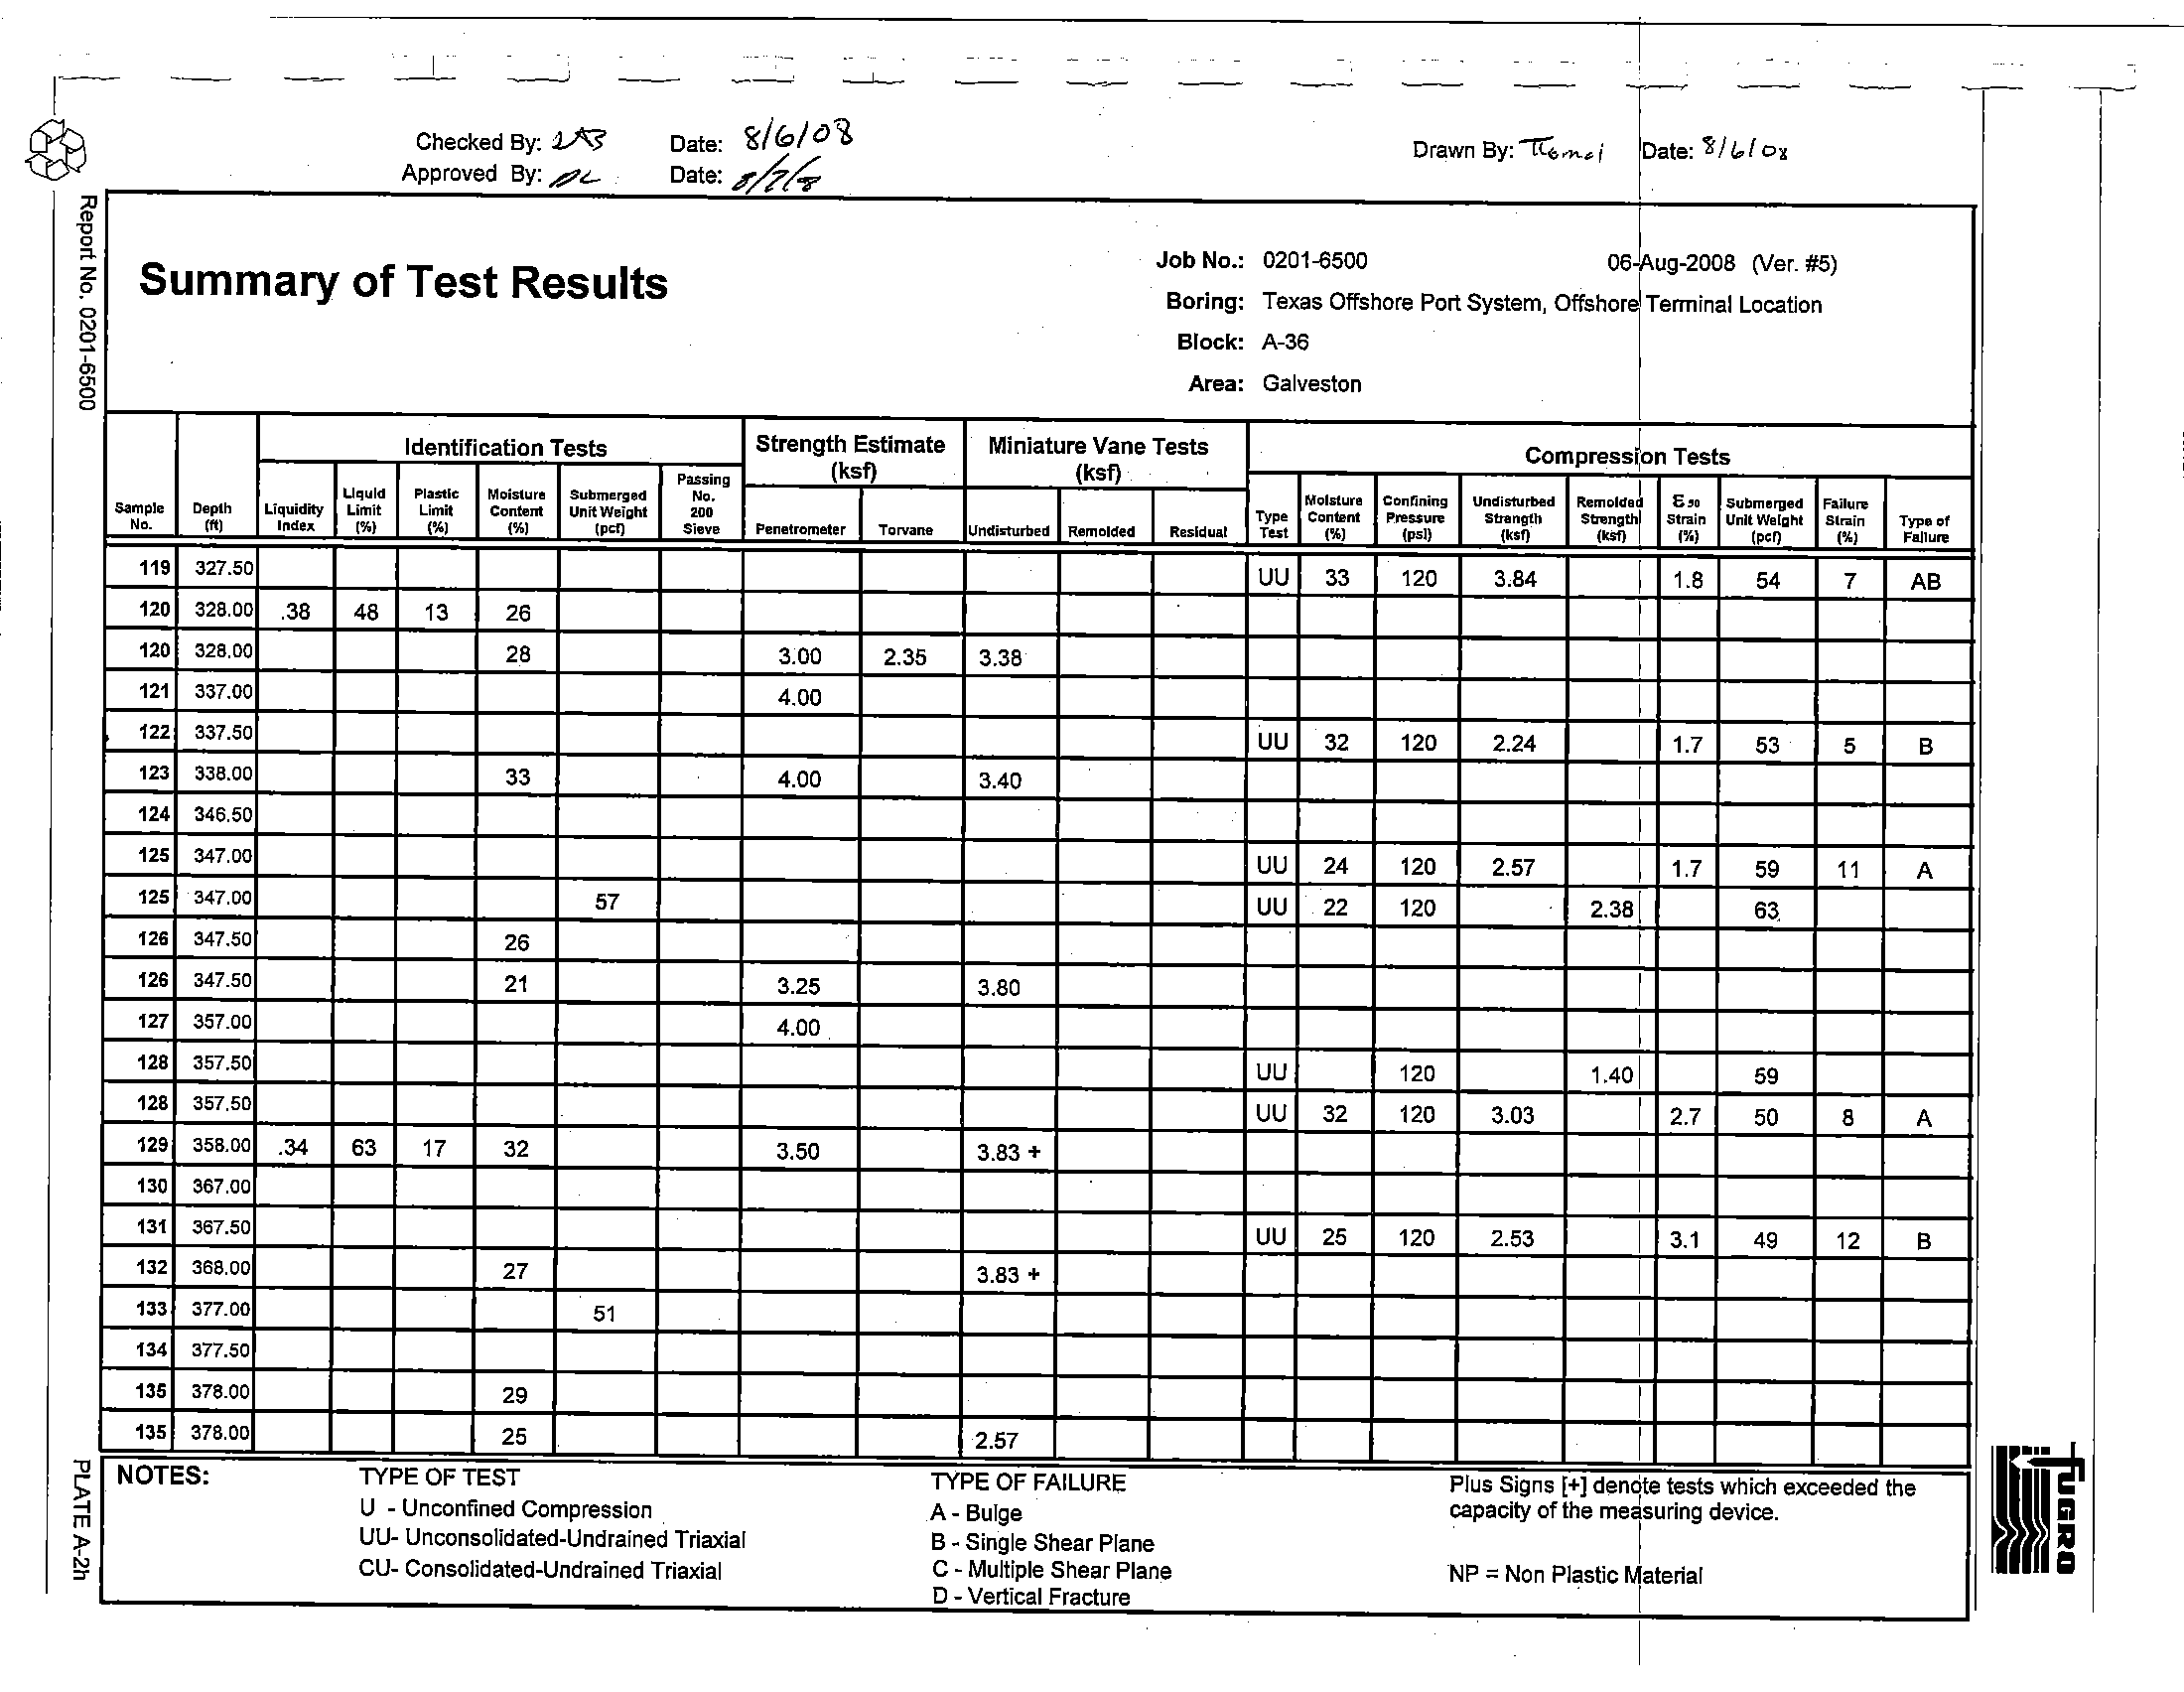
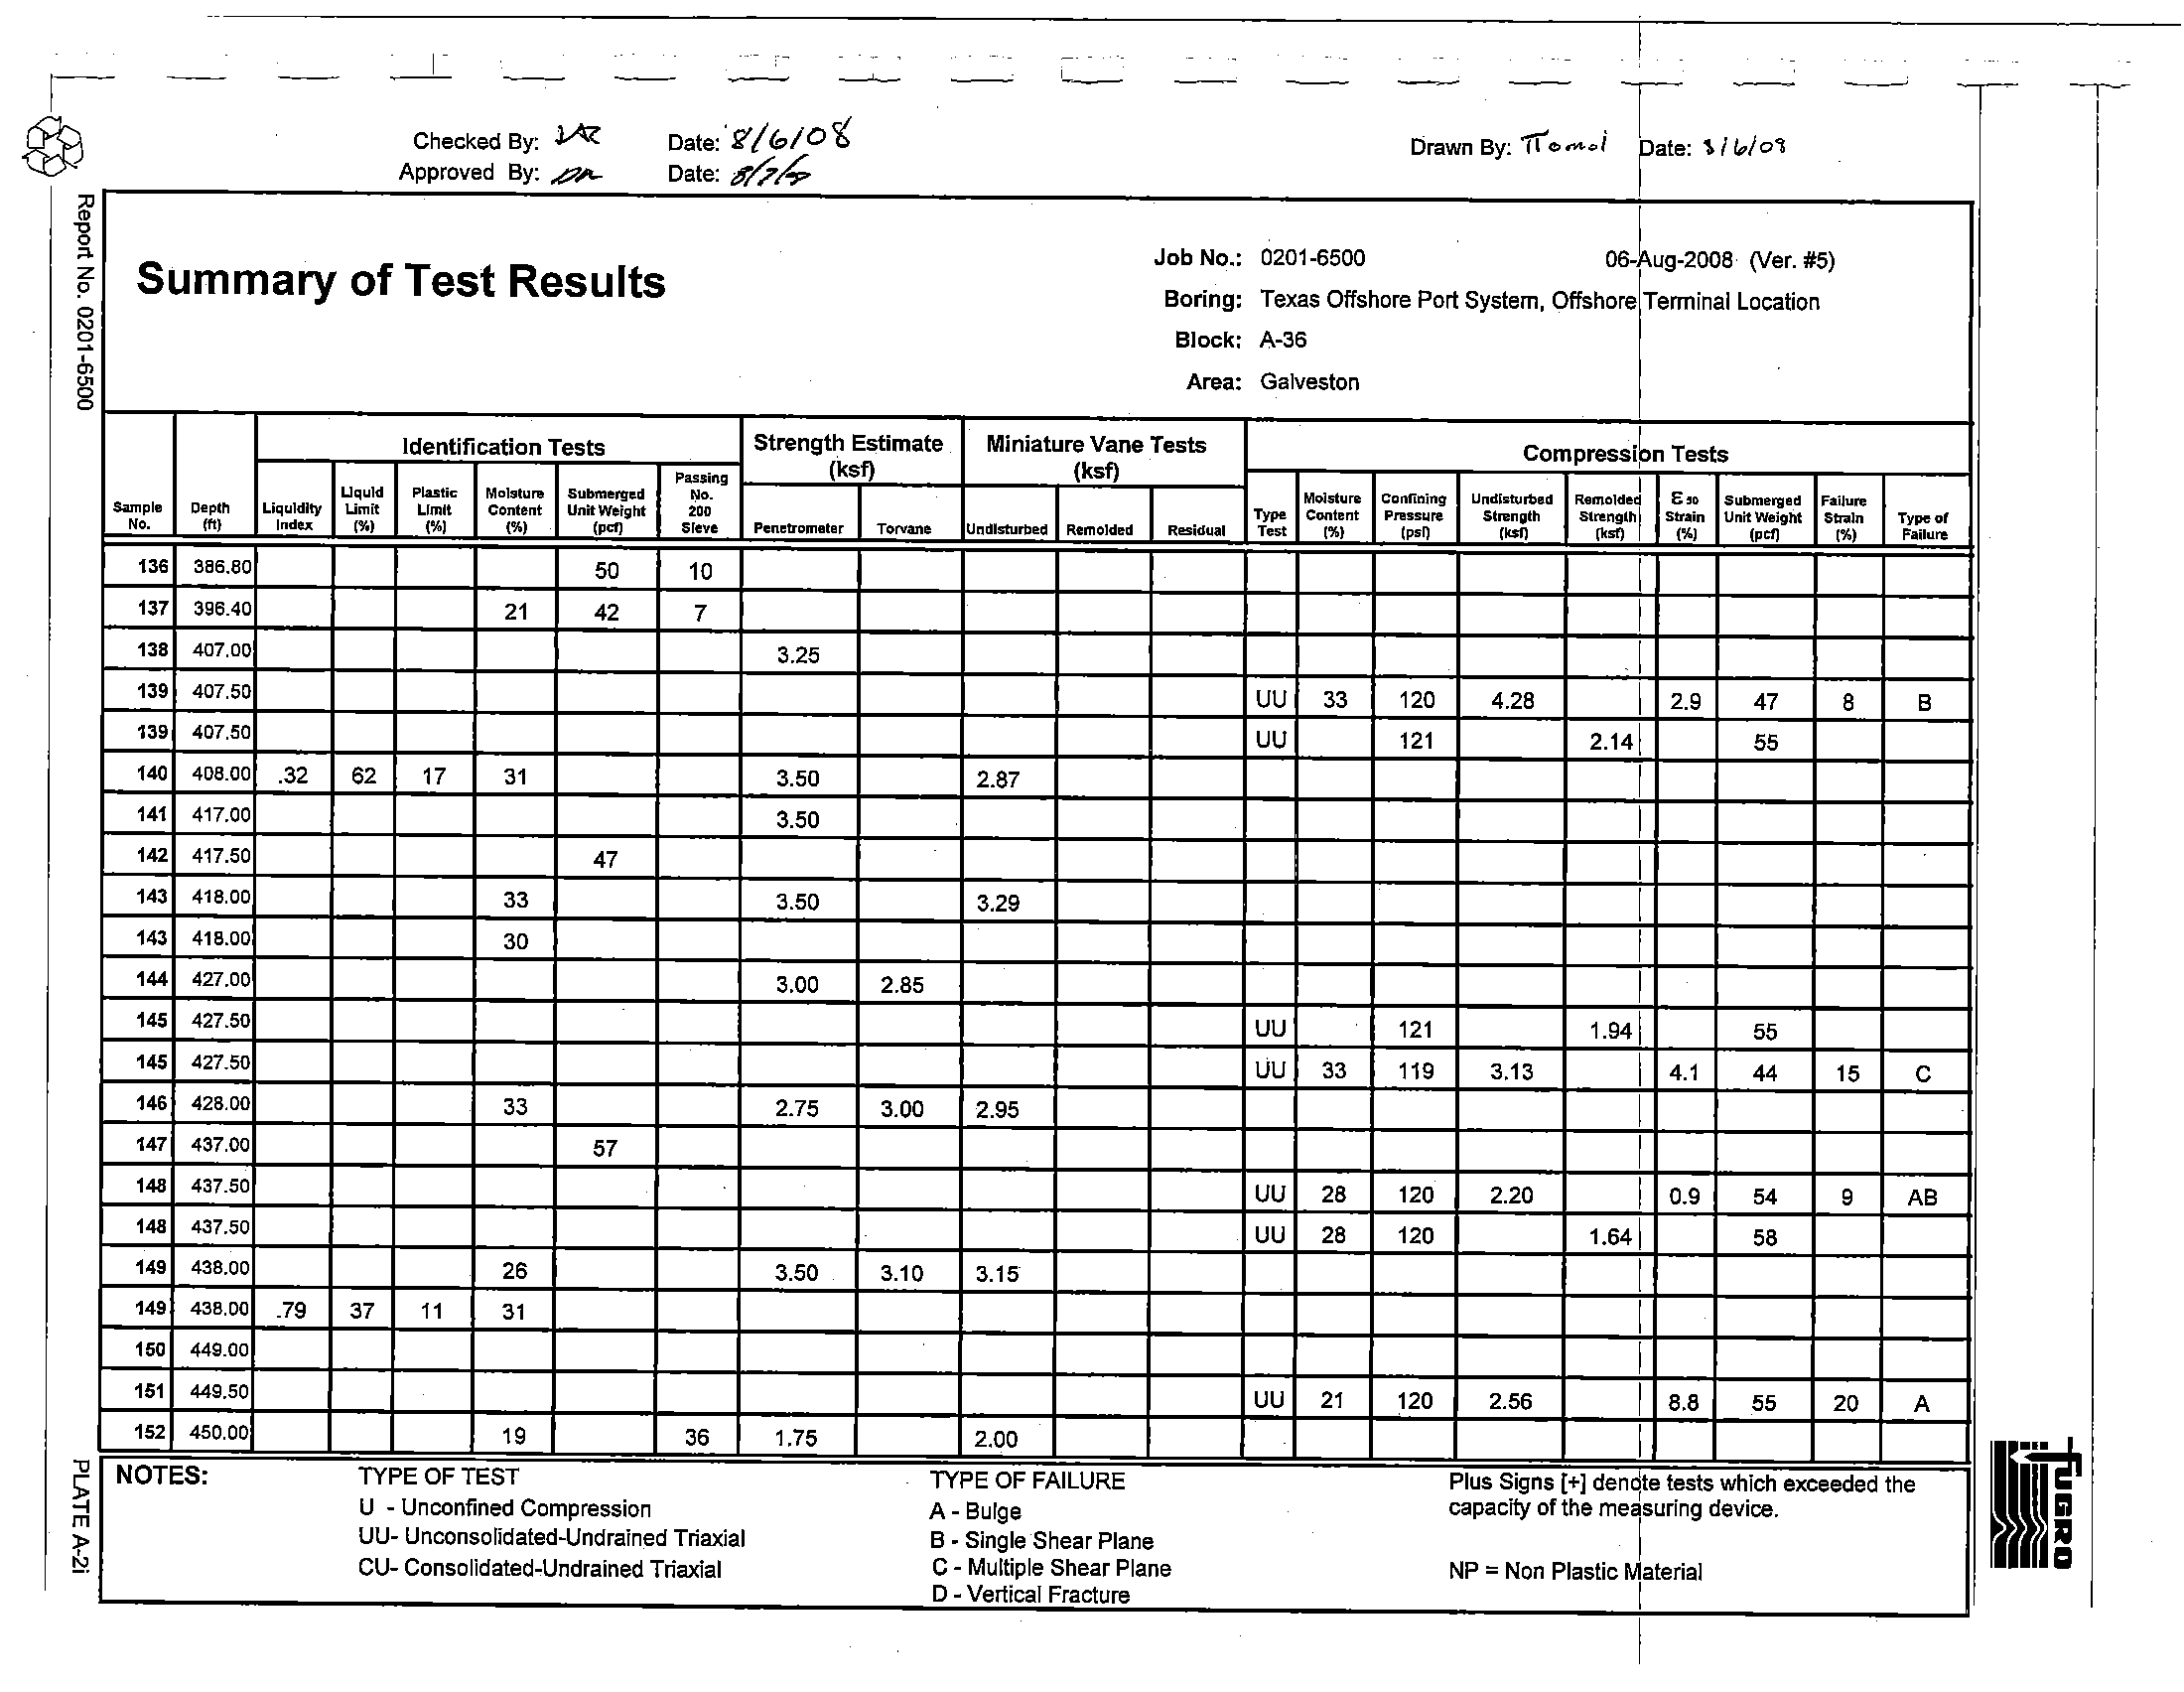
A summary of the field and laboratory test results is presented on Plate A-2. In the field, each
sample
is extruded from the sampler and carefully examined, classified, and tested by the soil technician or
field engineer. Representative portions
of each recovered sample are appropriately packaged for shipment
to the laboratory
in Houston. The test procedures, which are in general accordance with ASTM Standards
---,"1:
(2006), are described in the following paragraphs.
}
i
_I,
I I
•J'.
,
,
[
-I
I (
~:
II
.
J,
-II
J
Classification Tests
The classification tests, performed to verify field soil classifications, are assigned
to granular and
cohesive soils. These data are tabulated
on the Summary of Test Results, and most results are also
plotted
on the Log of Boring and Test Results.
For cohesive samples, plastic and liquid limits are determined to provide information for soil
classification. Water content and. density determinations are made for soil compression test
specimens~
For granular samples, classification tests are directed toward determining grain size. Grain-size
analyses performed include sieve analysis and/or the percent material passing the
No. 200 sieve. These
values are presented
on the Summary of Test Results.
Strength Tests
The undrained shear strength
of cohesive samples is obtained from Torvane, pocket penetrometer,
miniature vane,
and unconsolidated-undrained triaxial compression tests. The results are tabulated on the
Summary
ofTest Results and are plotted on the boring log.
The Torvane is a small, hand-operated device consisting of a metal disc with thin, radial vanes
projecting from
one face. The disc is pressed against a flat surface of the soil until the vanes are fully
embedded
and is rotated through a torsion spring until the soil is sheared. The device is calibrated to
indicate shear strength of the soil directly from the rotation
of the torsion spring.
The pocket penetrometer is a small, hand-held device consisting
of a flat-faced cylindrical plunger
and spring encased
in a cylindrical housing. The plunger is pressed against a flat soil surface, compressing
the spring until the soil experiences a punching type bearing failure. The penetrometer
is calibrated to
indicate shear strength of the soil directly from compression
of the spring.
The miniature vane test is used to measure the undrained shear strength
of cohesive soils. In this
test, a small, 4-bladed vane is inserted into either an undisturbed or remolded cohesive specimen. Torque
is applied to the vane through a calibrated spring until soil shear failure occurs. The undrained shear
strength
is determined by multiplying the rotation, in degrees, by the spring constant.
-
-
-
-
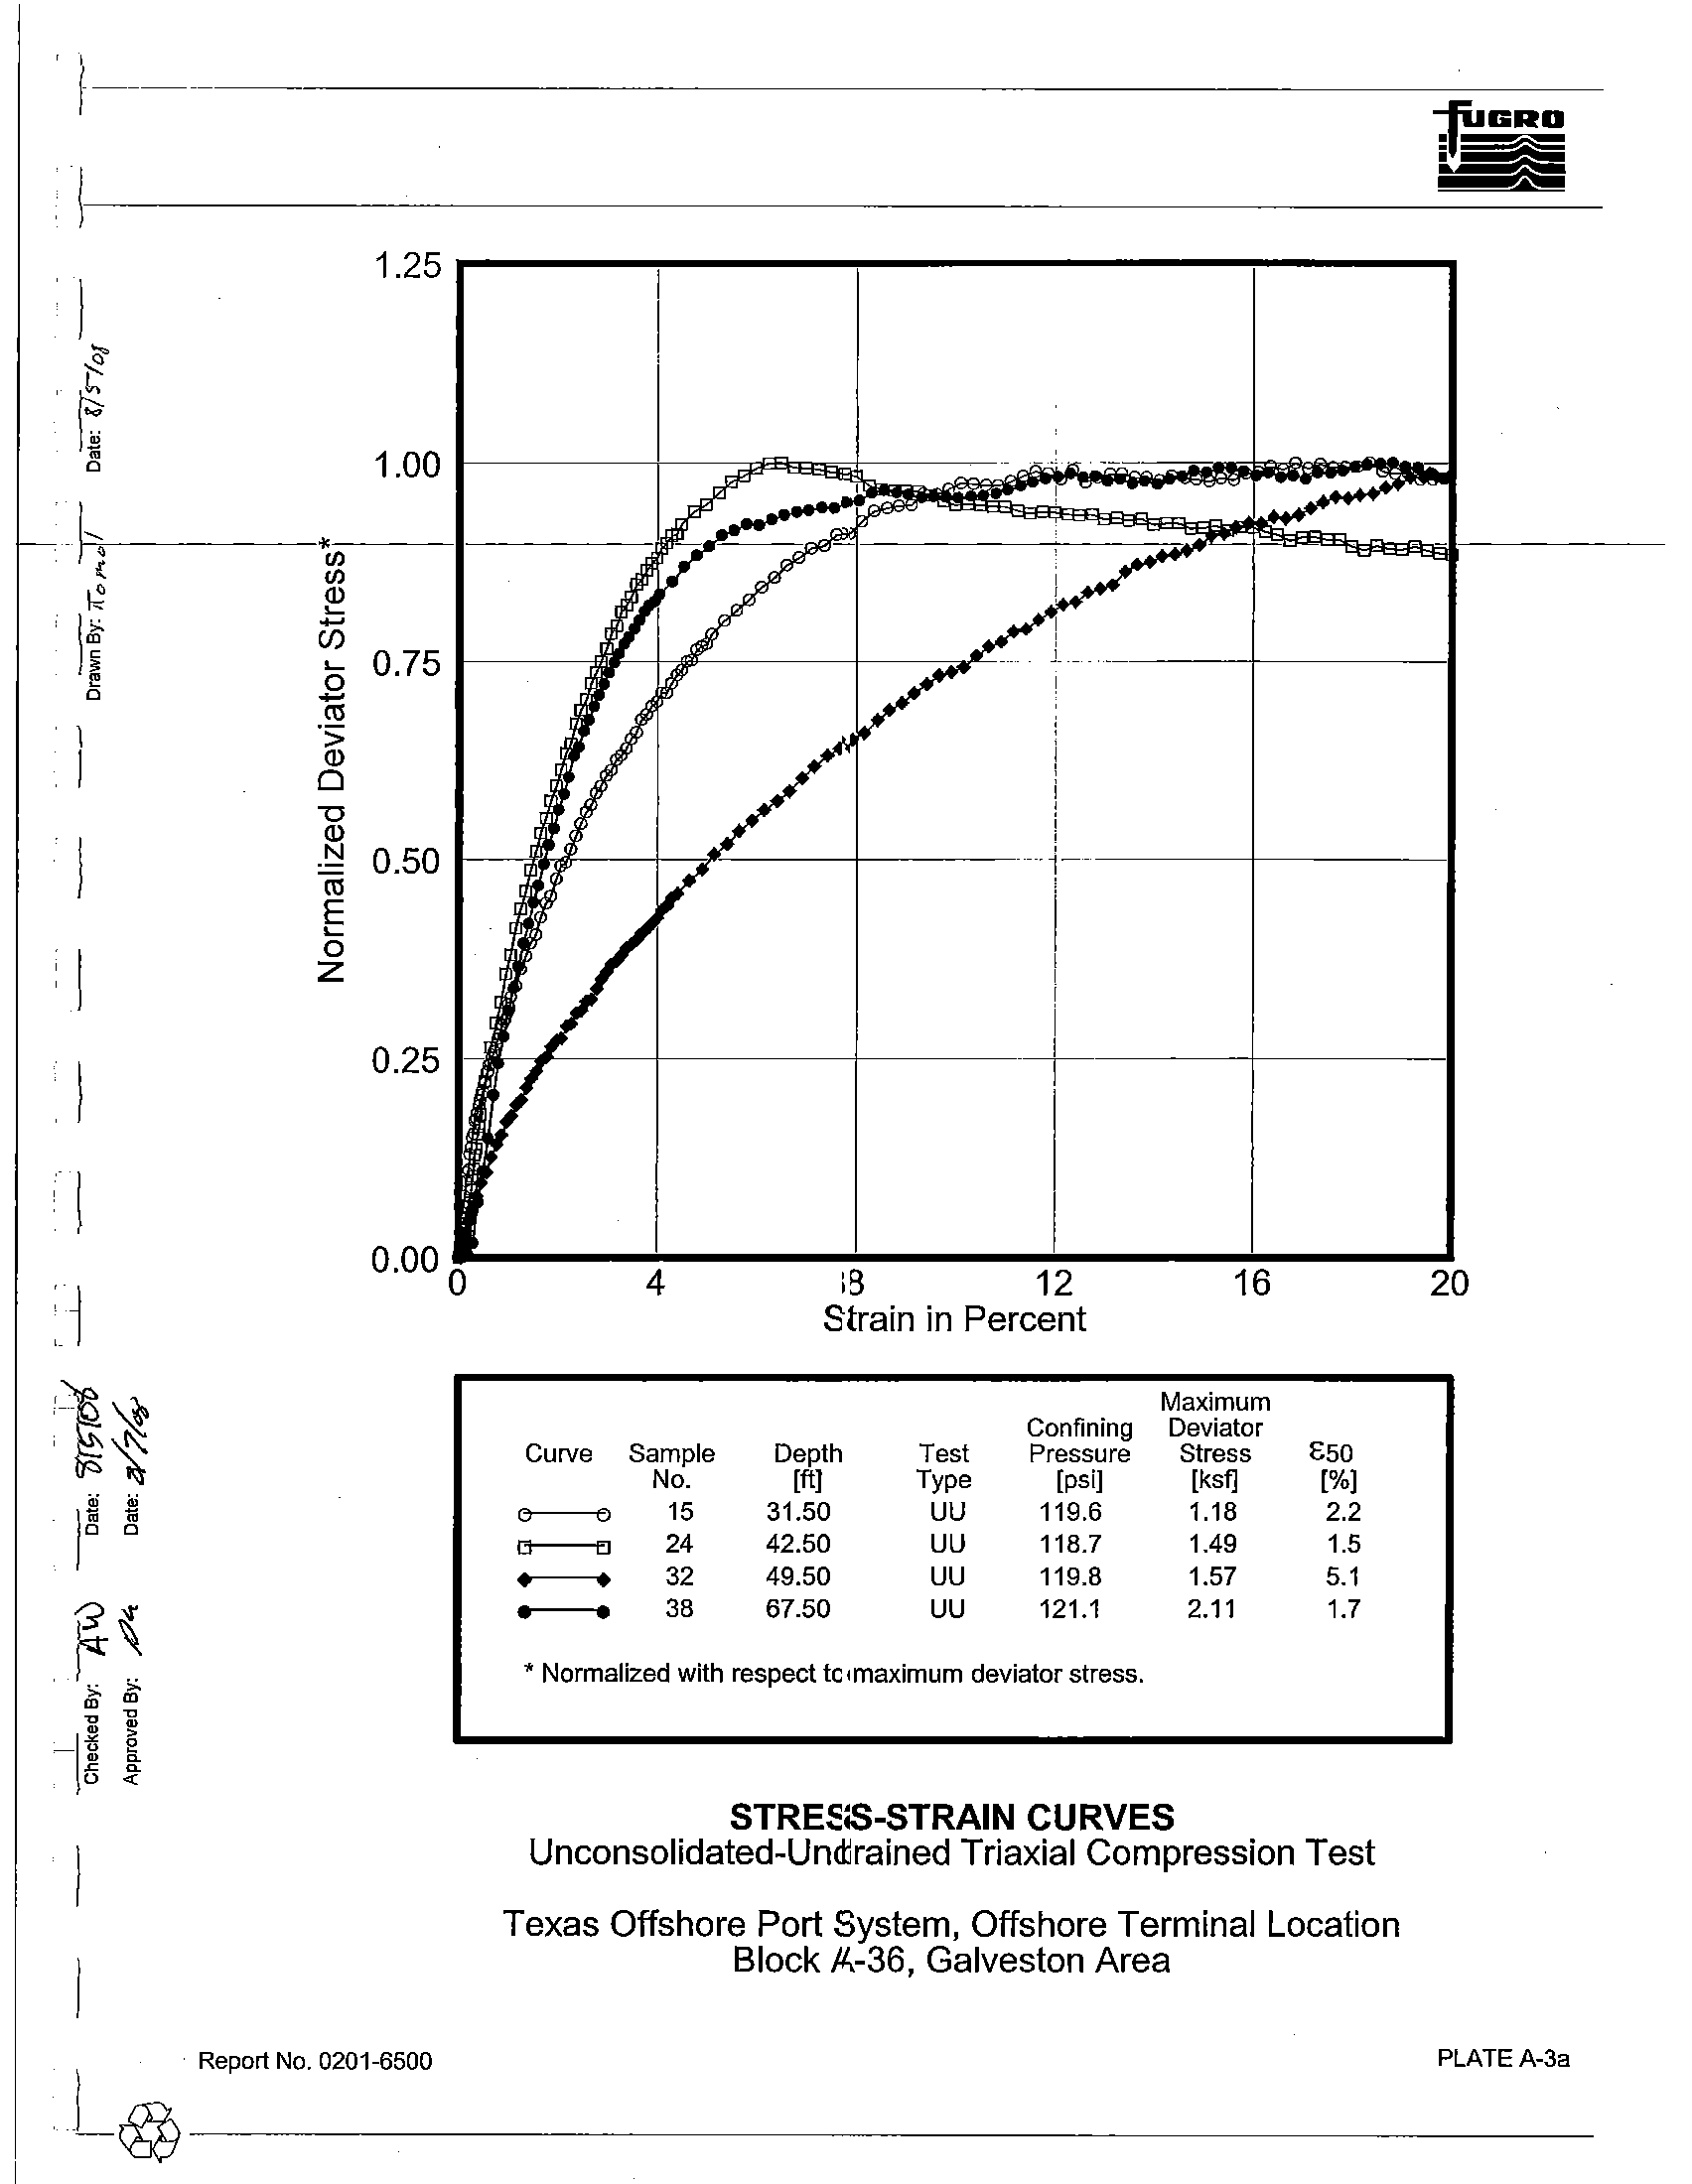
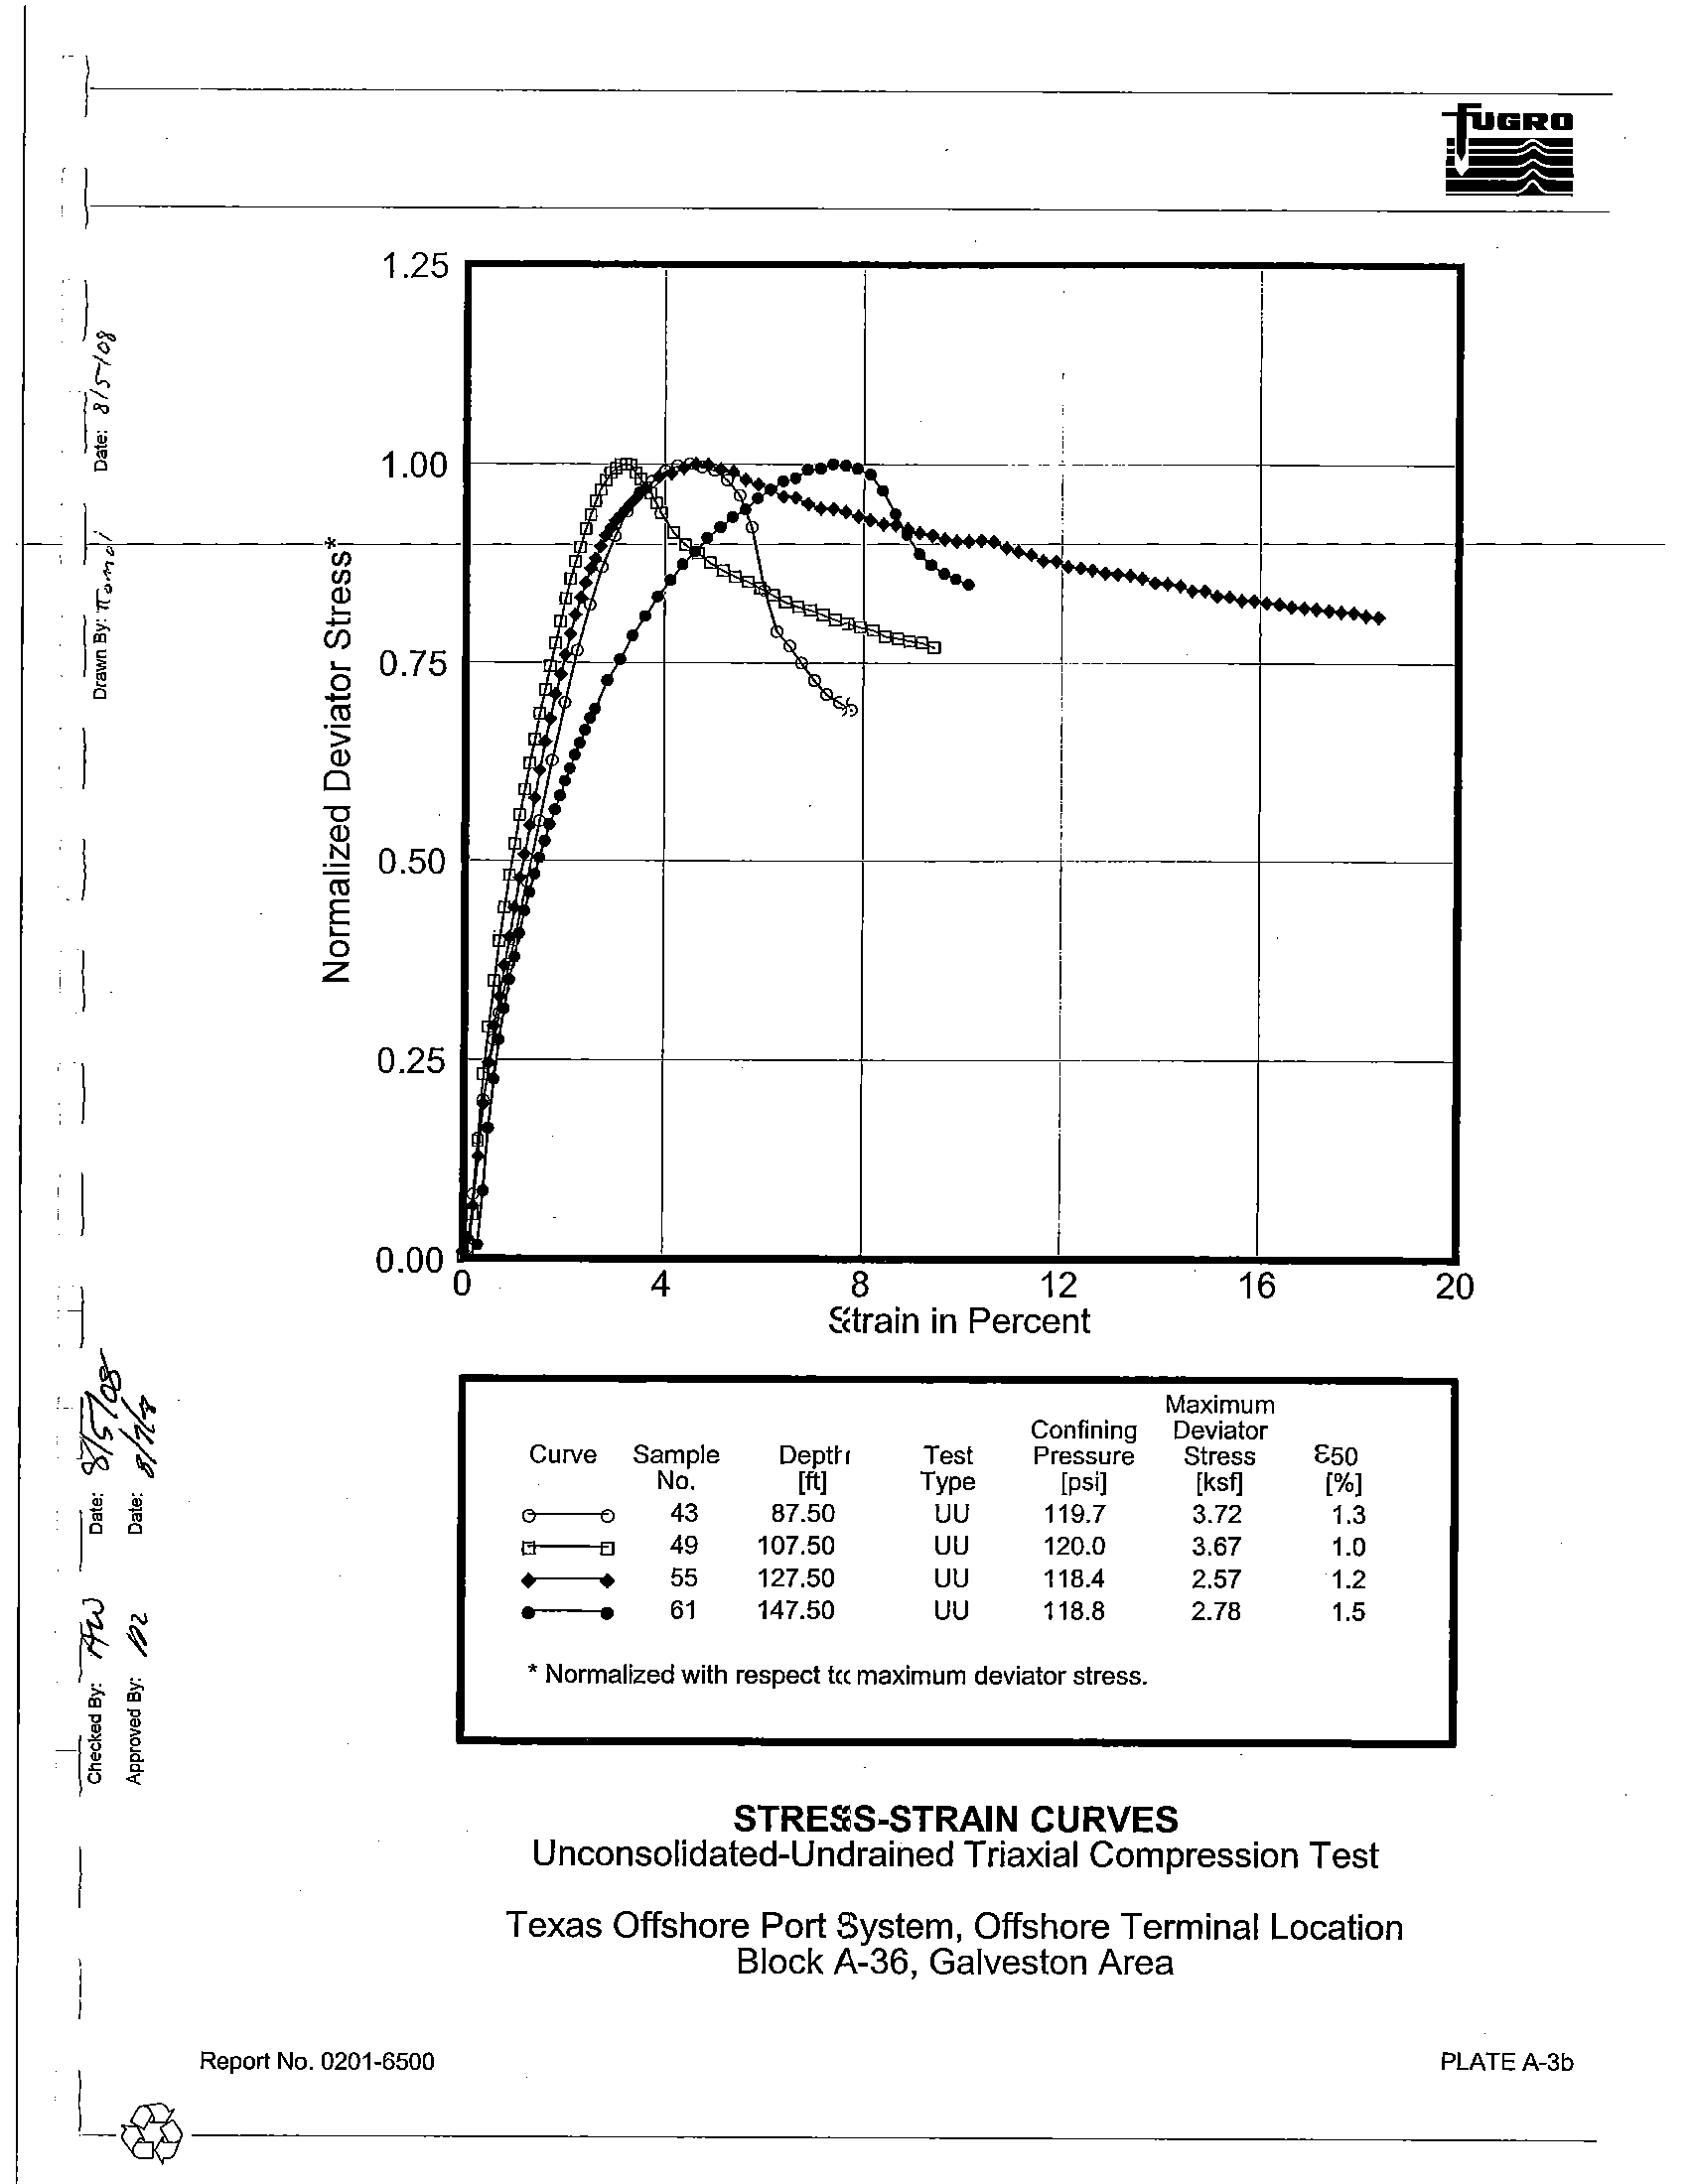
In the unconsolidated-undrained triaxial compression test, either an undisturbed or remolded soil
specimen is enclosed
in a thin. rubber membrane and subjected to a confining pressure of at least the
computed effective overburden pressure. The specimen is then loaded axially
to failure at a nearly constant
rate
of strain without allowing drainage. The undrained shear strength of cohesive soils is computed as
one-half the maximum observed deviator stress. Normalized stress-strain curves from undisturbed
UU
triaxial compression tests are presented on Plate A-
I_@
~*=1~
M
l~~
!l-----------------'=~
~!
~
~
I
~
~l
1
-I
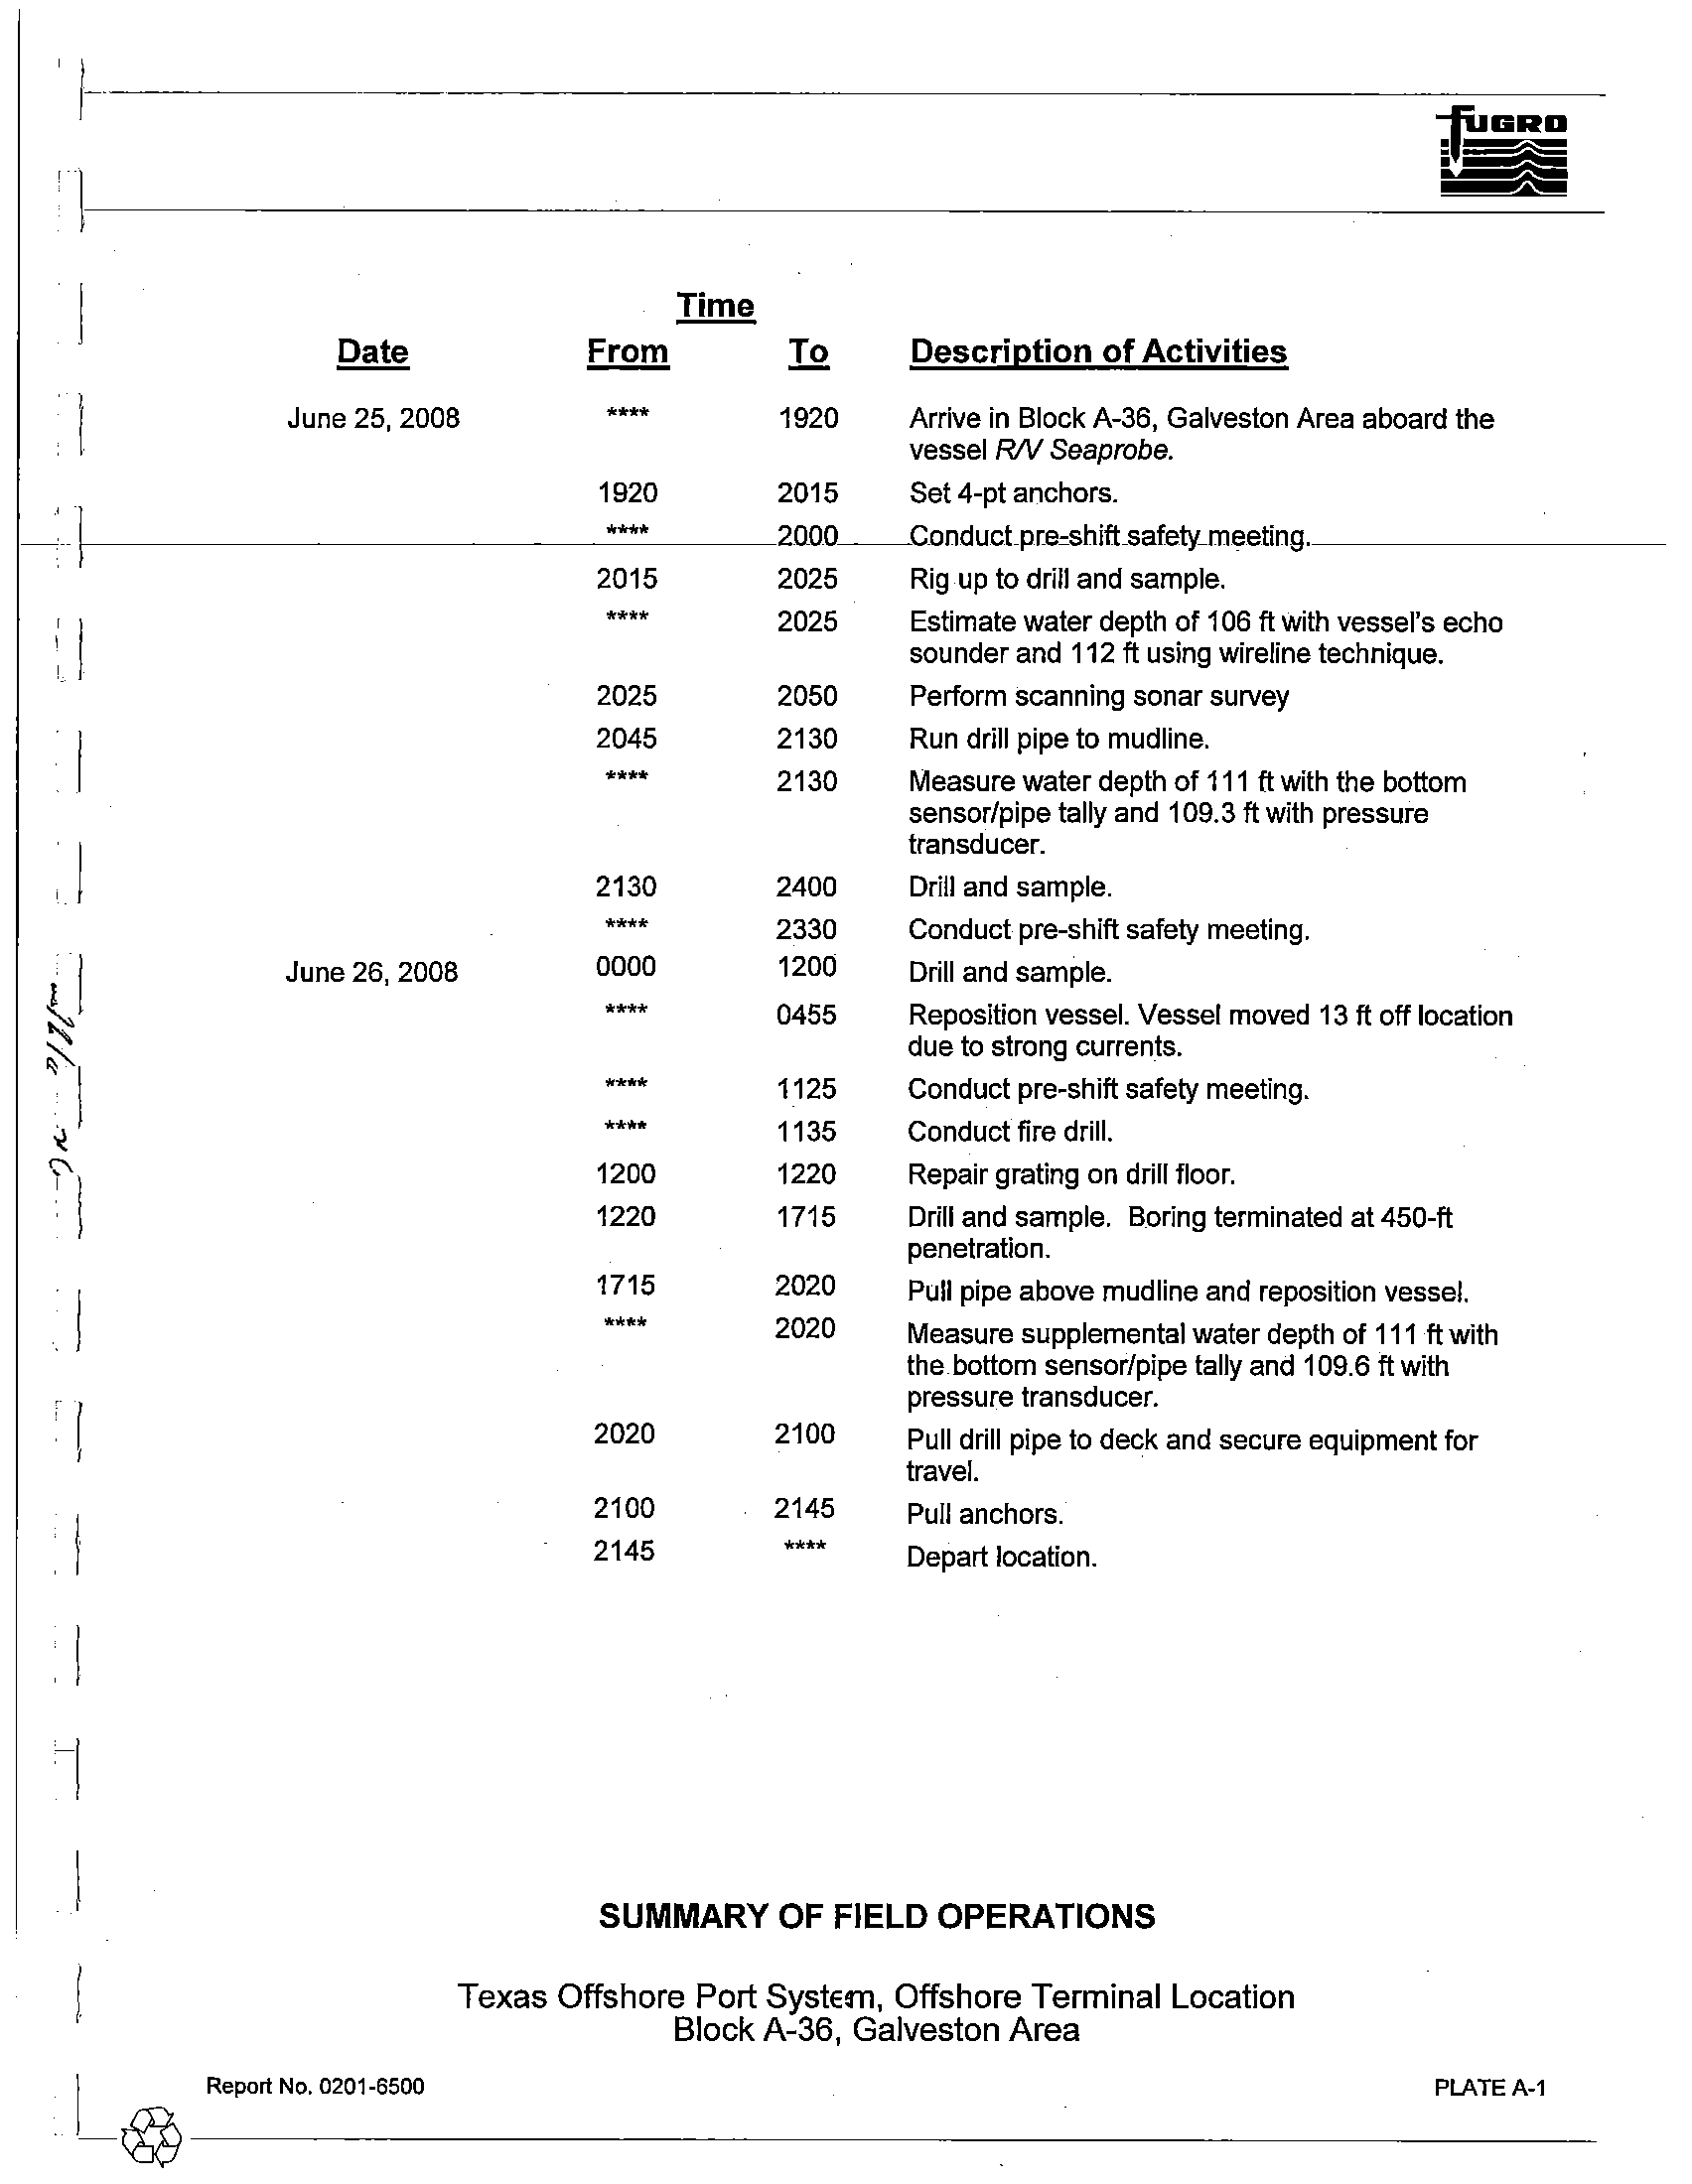
Time
Date
From
To
Description of Activities
June 25, 2008
****
1920
Arrive in Block A-36, Galveston Area aboard the
vessel
RN Seaprobe.
1920
....
2015
Set 4-pt anchors.
2000~~Gonductp[e,shiftsafety-meeting
.
2015
2025
Rig up to drill and sample.
****
2025
Estimate water depth of 106 ft with vessel's echo
sounder and 112 ft using wireline technique.
2025
2050
Perform scanning sonar survey
2045
2130
Run drill pipe to mudline.
****
2130
Measure water depth of 111 ft with the bottom
sensor/pipe tally and 109.3 ft with pressure
transducer.
2130
2400
Drill and sample.
****
2330
Conduct pre-shift safety meeting.
June 26, 2008
0000
1200
Drill and sample.
****
0455
Reposition vessel. Vessel moved 13 ft
off
location
due to strong currents.
'/t*.*
1125
Conduct pre-shift safety meeting.
**""*
1135
Conduct fire drill.
1200
1220
Repair grating on drill floor.
1220
1715
Drill and sample. Boring terminated
at 450-ft
penetration.
1715
2020
Pull pipe above mud line and reposition vessel.
""**""
2020
Measure supplemental water depth
of 111 ft with
the bottom sensor/pipe tally and 109.6 ft with
pressure transducer.
2020
2100
Pull drill pipe to deck and secure equipment
for
travel.
2100
2145
Pull anchors.
2145
****
Depart location.
SUMMARY OF FIELD OPERATIONS
Texas Offshore Port System, Offshore Terminal Location
Block A-36, Galveston Area
1
~N~=l~
~M
~@--------------------------------
I~
@
~
'8
"
z
?
~
C,
'"
o
--L
-- --
-~
--
-
--
eked By:
1A3
Date:
rl
r.,/
~3
roved By:
t?/L
Date: /
/?t,
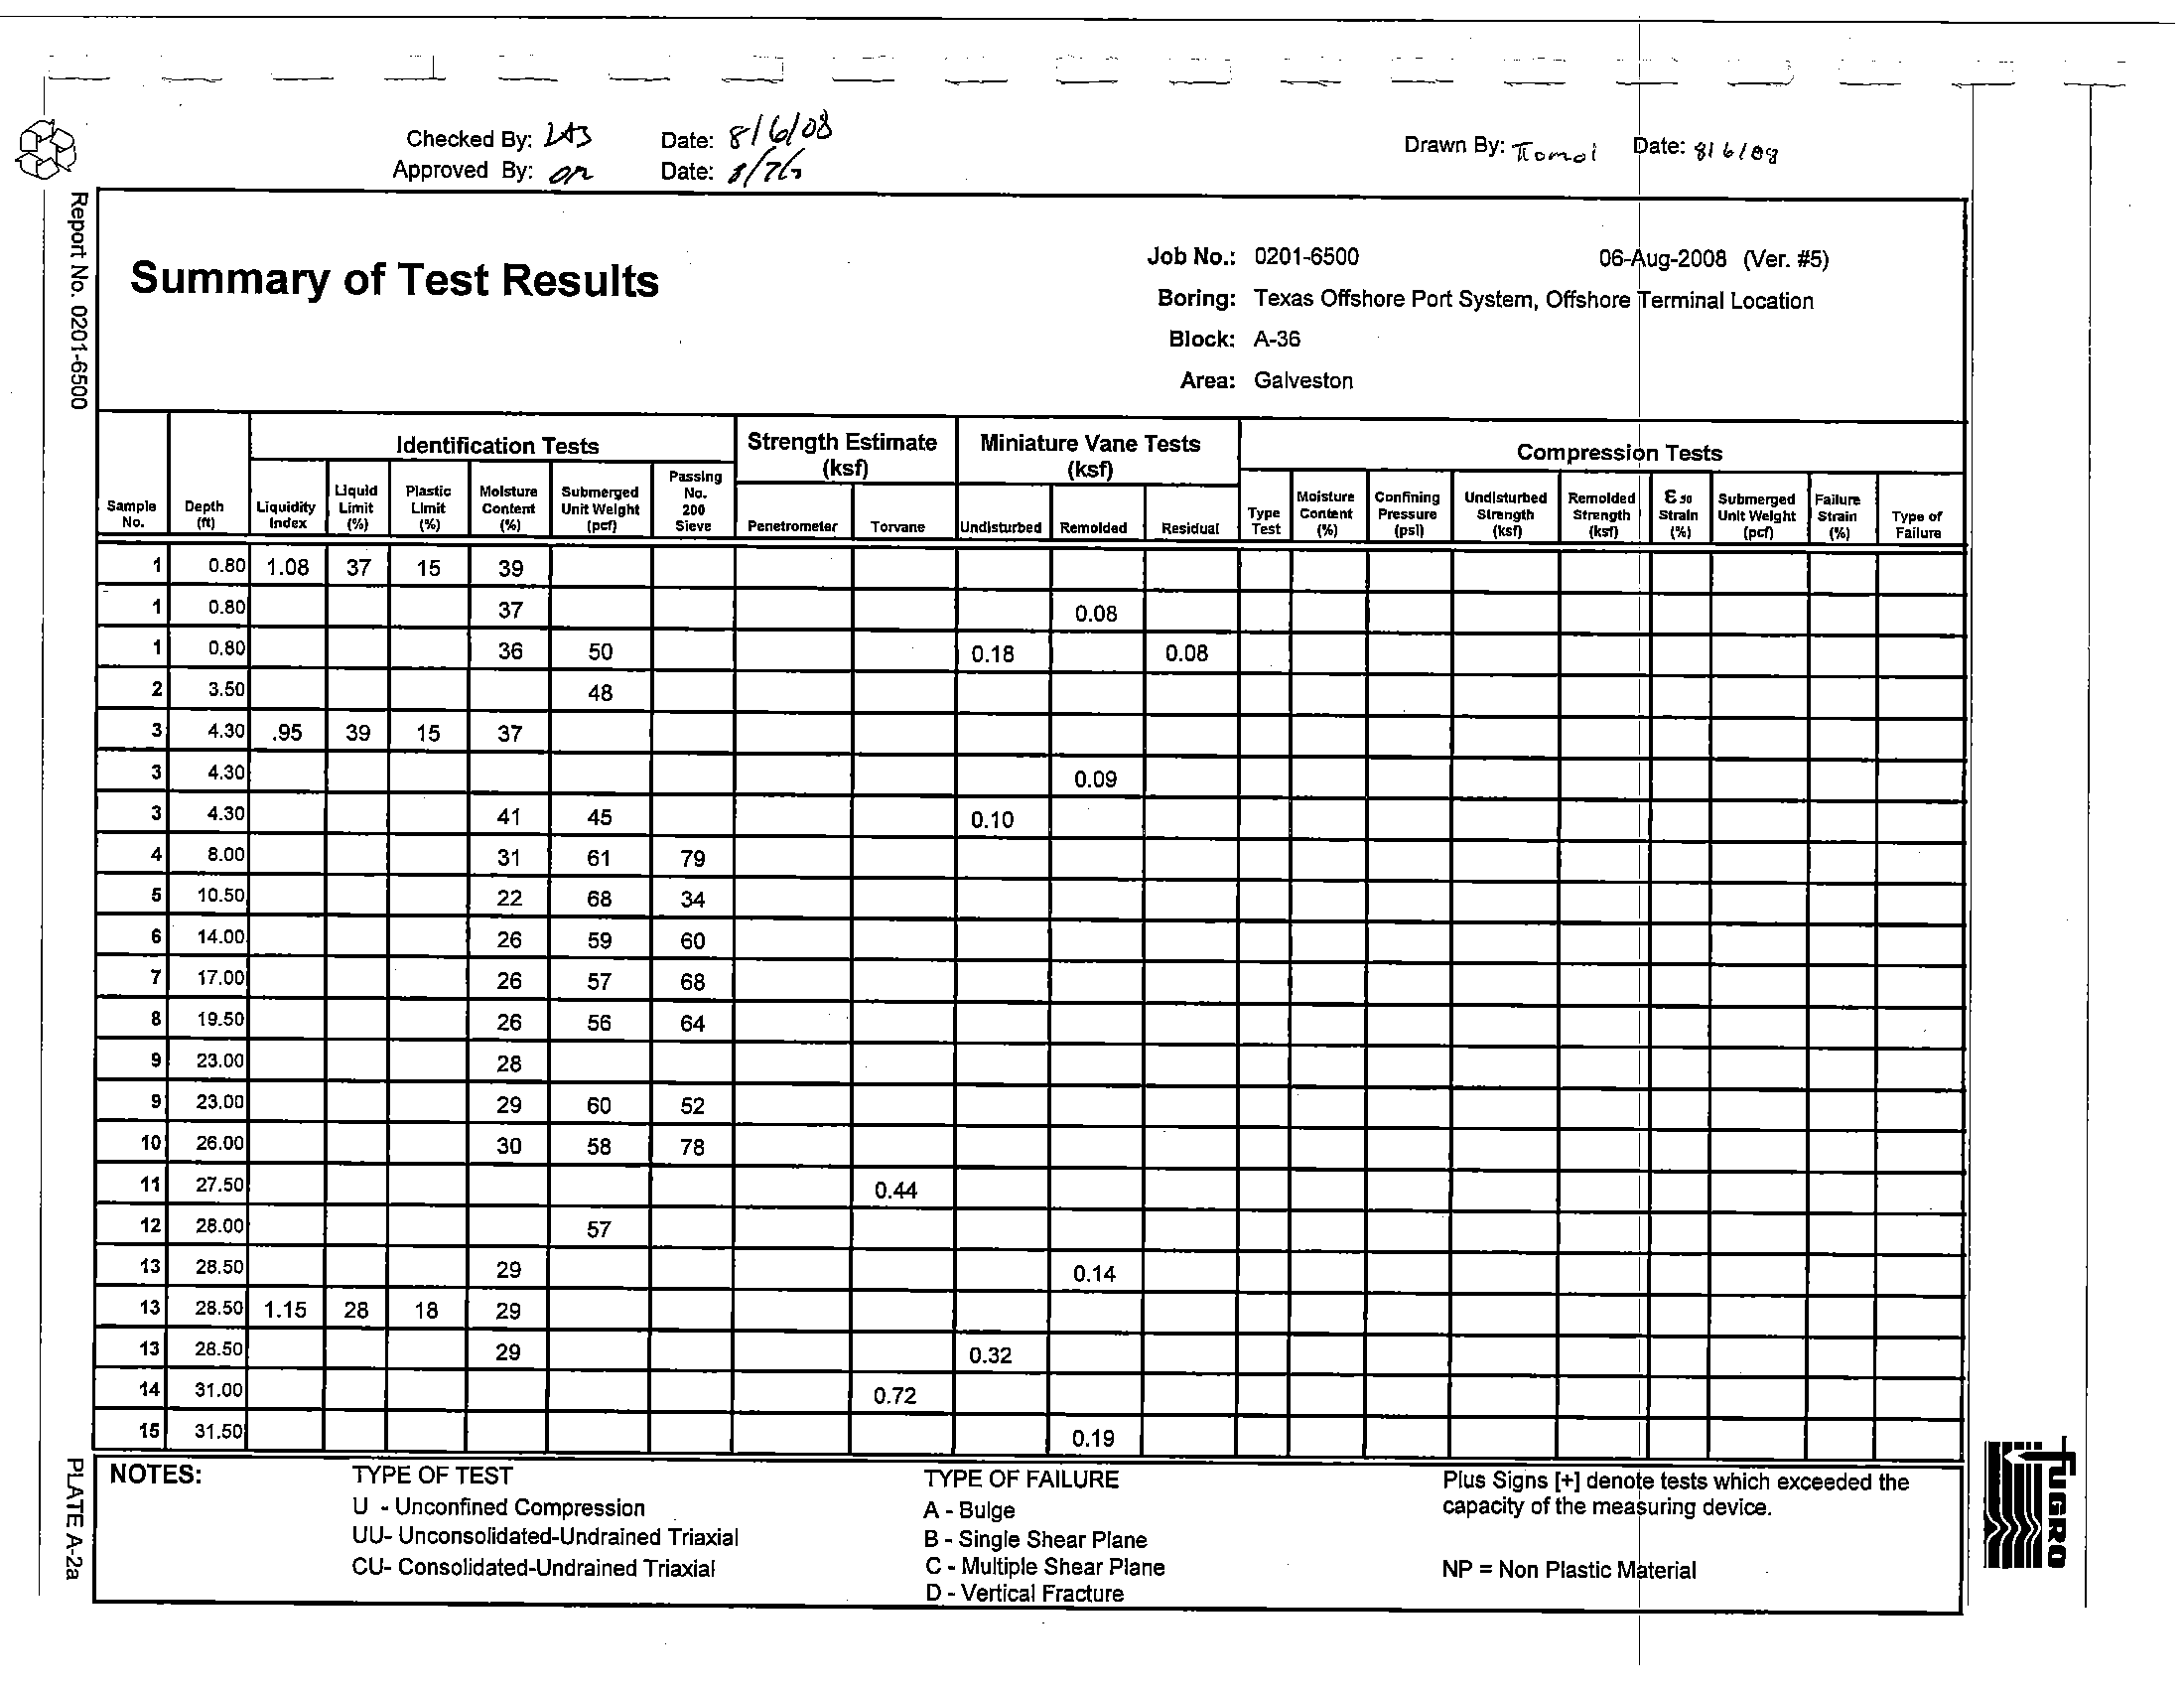
Summary of Test Results
--
--
---
--
T
--
--
Drawn
By: 1fOV"\.c;l!
rate:
~I
-/
e~
I
Job No.:
0201-6500
06-tug-2008 (Ver. #5)
Boring: Texas Offshore Port System, Offshore Terminal Location
Block: A-36
Area: Galveston
Identification Tests
Strength Estimate
Miniature Vane Tests
compreSSj~n
Tests
Passing
(ksf)
(ksf)
LJquld
Plastic:
Moisture
Submerved
N,.
Moisture
Confining
UndlstLU'bed
RemOldedi
E~o
Submerged
FajllU'~
Sample
D.""
Liquid"1ty
Limit
Limit
Content
Unit Weight
'DO
Type
Conll!nt
Pressure
Strength
Strength
stl1illn
Unit Weight
Strain
Type of
N,.
Cft,
Index
('!oj
C%,
C%,
""I
Sieve
Penetromets(
TOl'Vllne
Undlsturlled
Remolded
Residual
T6'
{%'
(psll
("'n
(ksf)
(%1
(pcf)
(%)
Failure
1
0.80
1.08
37
15
39
1
0.80
37
0.08
1
0.80
36
50
0.18
0.08
2
3.50
48
3
4.30
.95
39
15
37
3
4.30
0.09
3
4.30
41
45
0.10
4
8.00
31
61
79
5
10.50
22
68
34
6
14.00
26
59
60
7
17.00
26
57
68
8
19.50
26
56
64
9
23.00
28
9
23.00
29
60
52
10
26.00
30
58
78
11
27.50
0.44
12
28.00
57
13
26.50
29
0.14
13
28.50
1.15
28
18
29
13
28.50
29
0.32
14
31.00
0.72
15
31.50
0.19
""Cl
~
~
~
NOTES:
TYPE OF TEST
TYPE OF FAILURE
Plus Signs
[+[
denote tests which exceeded the
U
M
Unconfined Compression
A - Bulge
capacity of the measuring device.
UU- Unconsolidated-Undrained Triaxial
B
- Single Shear Plane
CU- Consolidated-Undrained Triaxial
C - Multiple Shear Plane
NP = Non Plastic MLerial
D
-
Vertical Fracture
I
--- --
--
---- --
-
-
T
~1
I~-
@
'C
il'
o
'"
z
!'
~
§
----L
---
-- --
~-
:kedBy:
W
Date:
'ifl (.,;Ot,
..
ved
By:
de:.,
Date:
~N
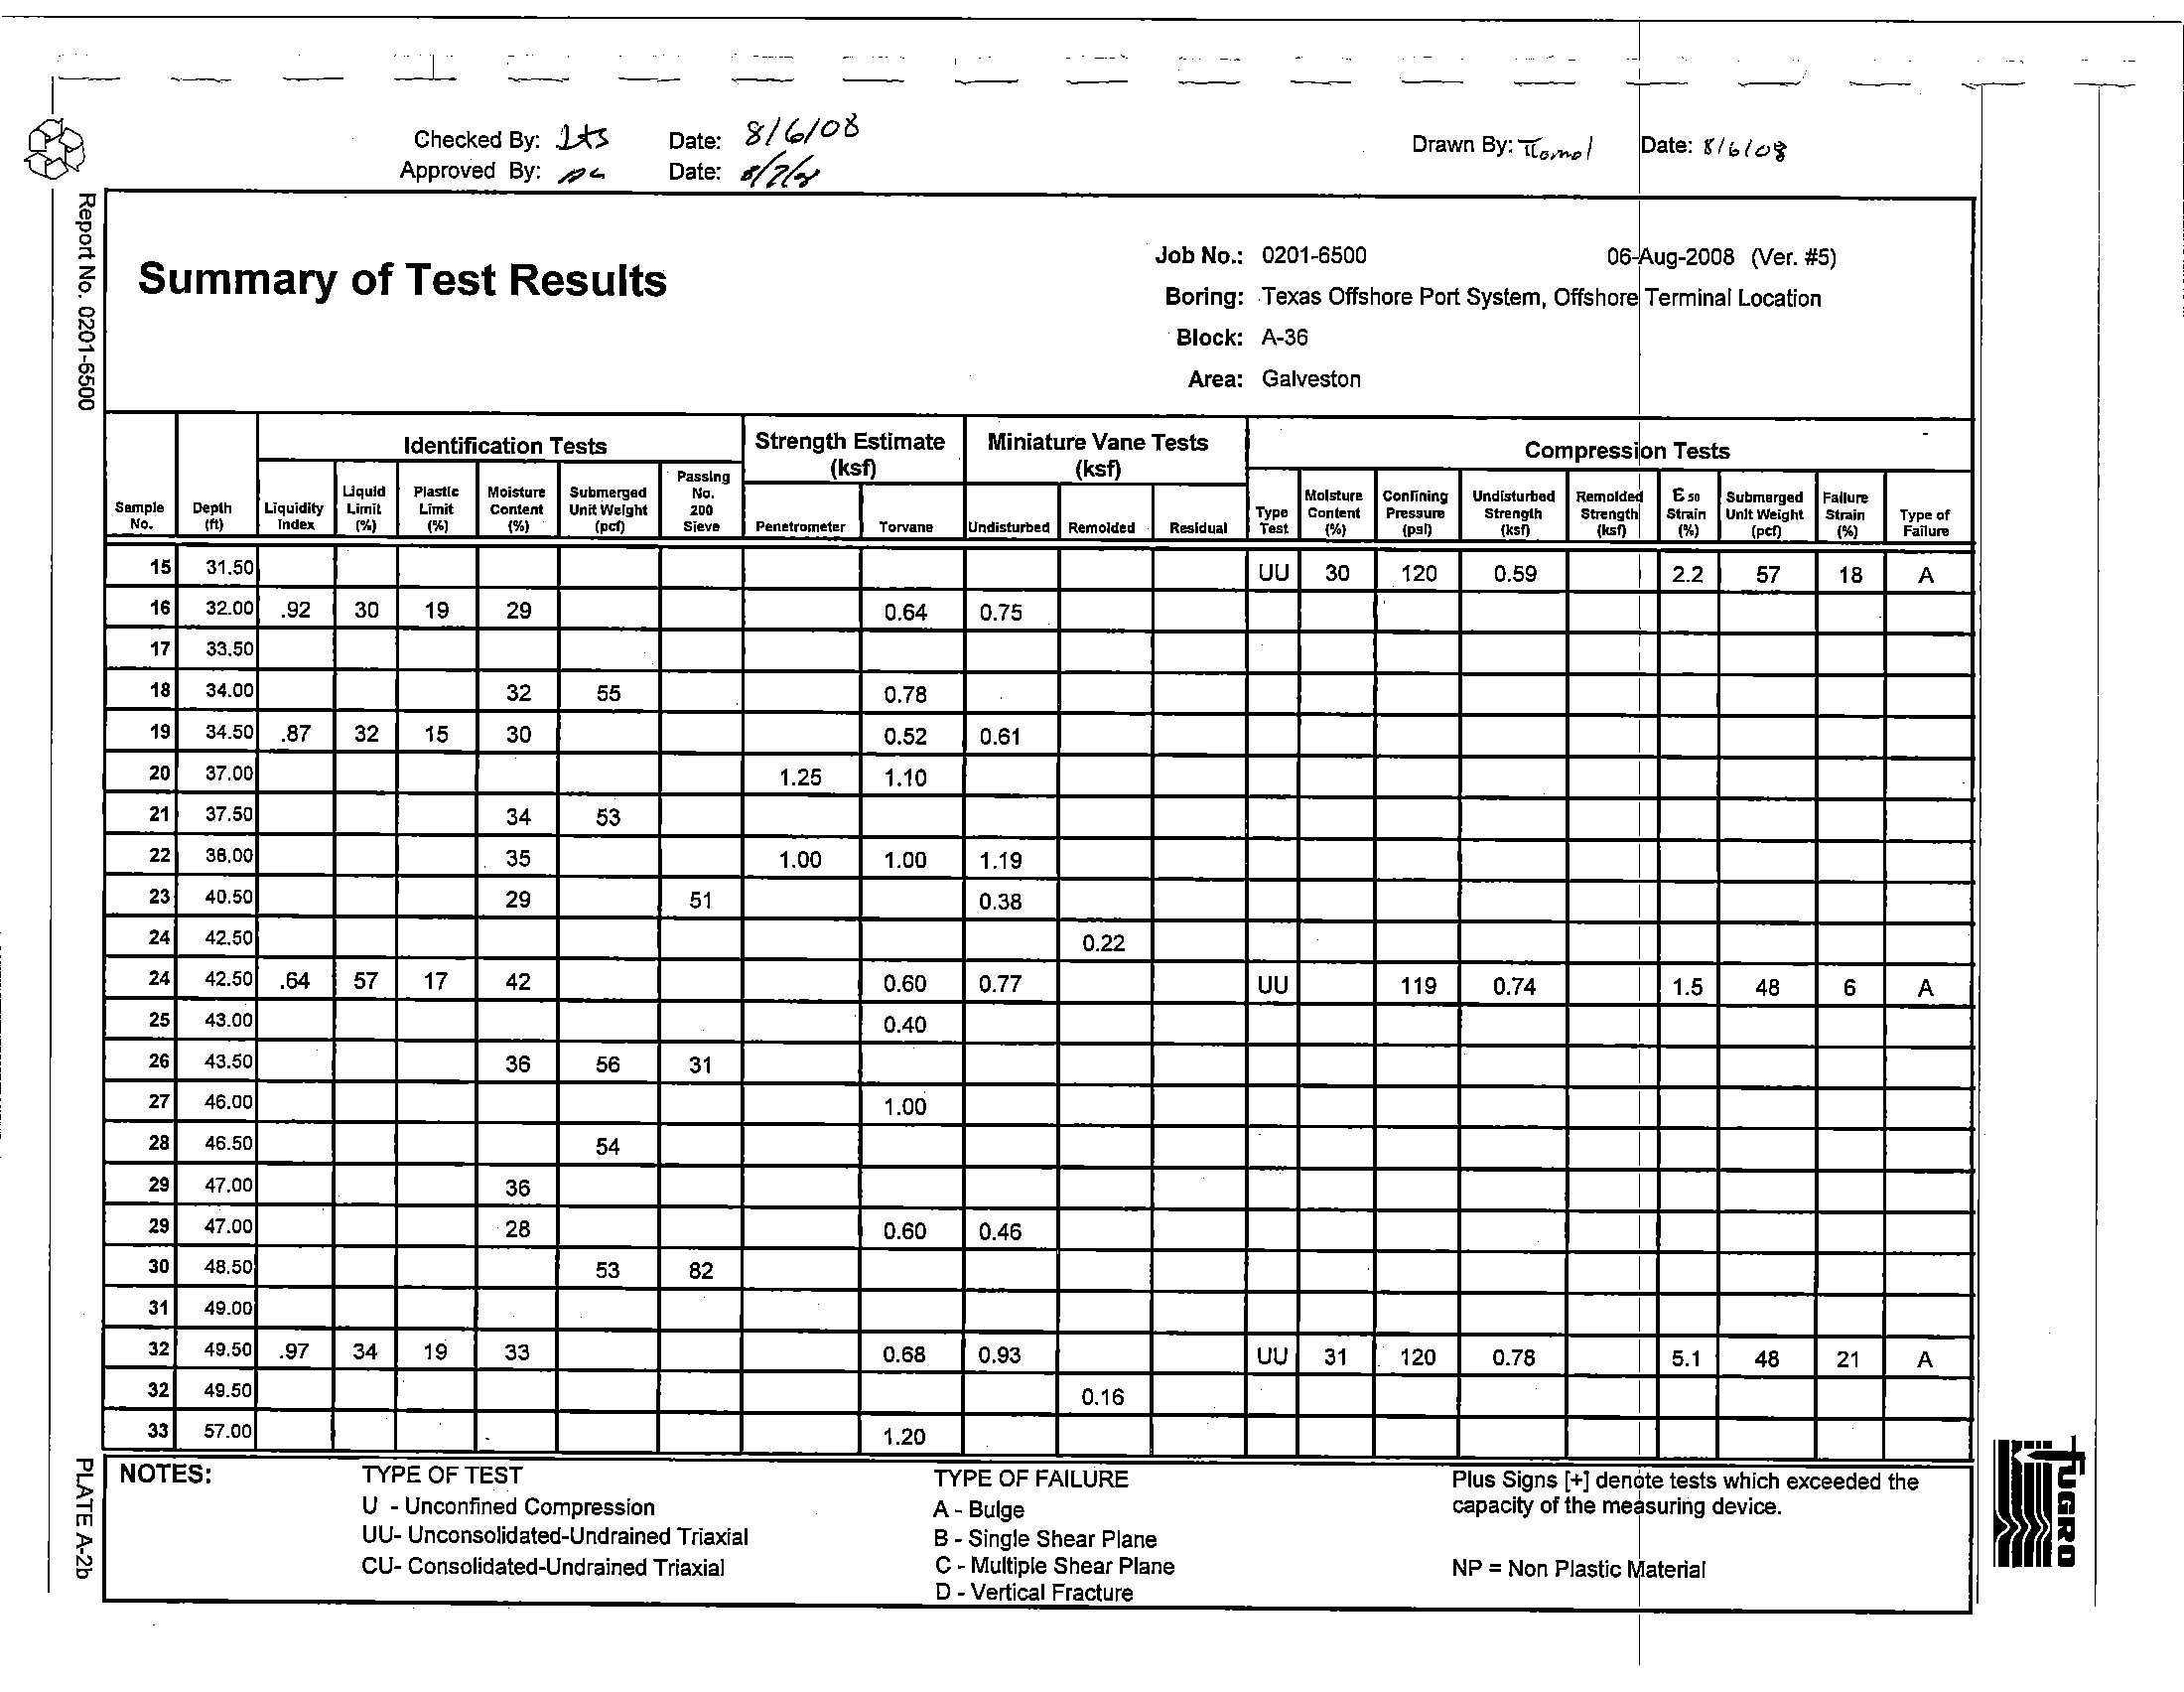
Summary of Test Results
I
-
~-
--
--
--
--
loate:
fl.:
-.~-
Drawn By: UO>'h-.l>I
Job No.:
0201-6500
06JAU9-2008 0Ier. #5)
Boring: Texas Offshore Port System, Offshore
Terminal Location
Block: A-36
Area:
Galveston
Identification Tests
Strength Estimate
Miniature Vane Tests
compressilon Tests
"
m
~
..
"
0'
Sample
"plh
N,.
1ft)
15
31.50
16
32.00
17
33.50
18
34.00
19
34.50
20
37.00
21
37.50
22
38,00
23
40.50
24
42.50
24
42.50
25
43.00
26
43.50
27
46.00
28
46.50
29
47.00
29
47.00
30
48.50
31
49.00
32
49.50
32
49.50
33
57.00
NOTES:
Liquidity
Tnd",
.92
.87
.64
.97
Passing
(ksf)
UquLd
PlastIc
Moisture
Submerged
N,.
Limit
Limit
Content
Unit WeIght
'"'
(1)
(%)
(%)
(pd)
Sieve
penetrometl!r
Torvane
30
19
29
0.64
32
55
0.78
32
15
30
0.52
1.25
1.10
34
53
35
1.00
1.00
29
51
57
17
42
0.60
0.40
36
56
31
1.00
54
36
28
0.60
53
82
34
19
33
0.68
1.20
TYPE OF TEST
U
- Unconfined Compression
UU- Unconsolidated-Undrained Triaxial
CU- Consolidated-Undrained Triaxial
-
-
(ksf)
I
Moisture
Confining
Undisturbed
Remolded
E..
Submerged
Fa.llure
Typ.
Content
Pressure
Strength
strengthl
Stl1l.in
Unl\~~ht
StrOlln
Type of
Undisturbed
Remolded
Residual
THt
(%)
("'"
(ksf)
('"
(%)
(%)
Failul1I
UU
30
120
0.59
I
2.2
57
18
A
0.75
I
.
0.61
1.19
0.38
0.22
0.77
UU
119
0.74
1.5
48
6
A
0.46
0.93
UU
31
120
0.78
5.1
48
21
A
0.16
I
TYPE OF FAILURE
Plus Signs [+J den6te tests which exceeded the
A- Bulge
capacity of the measuring device.
B - Single Shear Plane
I
C - Multiple Shear Plane
NP = Non Plastic
~aterial
o
-
Vertical Fracture
-
1-
@
~
"
,.
o
z
9
f(l
01
§
-L
1
-I
• •
r~
....,
"."
,
I
I
:?/h/o%
Job No.: 0201.6500
06-tU9-2008 IYer. #5)
Sum
mary of Test ResuIts
Boring: Texas Offshore Port System, Offshore Terminal Location
Block: A-36
Area:
Galveston
Identification Tests
Strength Estimate
Miniature Vane Tests
compressiJn Tests
Uquld
Plerrtic
Mol.stun!l
Submerged
No.
Moistun=
Confining
UndIsturbed
Remolded
E3lI
Submerged
Failure
Pn,j"
(ksf)
(ksf)
'I
Sample
Depth
Uquidity
Urni!
limit
Content
Unit Weight
200
Type
Content
pressure
Strength
Strength
Stlll;n
Unit WeIght
Strain
TYPe of
NO.
(ttl
Index
(%)
(%)
(%1
(pl:f)
Sieve
Penetrometer
Torvene
Undisturbed
Remolded
Residual
Tast
(%)
(psi)
(ksf)
(ksf)
(%)
(pcf)
(%1
F.ilure
~
~~
Q
I
35
5B.OO
48
1.00
1.00
1.64
I
35
58.00
35
I
~
a.
I
D
~oo
M
I
3B
67.50
1.08
36
14
38
1.02
1.70
UU
120
0.61 I
52
3B
67.50
UU
45
121
1.05
I 1.7
50
19
AC
39
n.oo
1.50
1.54
I
40
n.50
52
I
41
7B.OO
45
1.10
1.20
1.36
I
41
7B.OO
51
I
42
B7.00
1.00
1.20
I
43
B7.50
UU
41
120
1.86
I 1.3
47
5
AC
44
BB.OO
.59
59
18
42
1.00
1.12
1.42
I
45
97.00
1.00
I
45
~.
~
I
47
9B.00
44
1.00
1.12
1.08
I
47
9B.00
39
I
48
107.00
1.42
I
49
107.50
UU
118
0.73 I
49
49
107.50
UU
41
120
1.84
I 1.0
45
3
AS
m
~
it;
o
50
10B.00
.69
52
16
41
1.25
1.32
1.64
I
".K.I.
NOTES:
TYPE OF TEST
TYPE OF FAILURE
Plus Signs
[+]
deno\<,
t~sts
which exceeded the
1~~r:!1
U
- Unconfined Compression
A _Bulge
capacIty of the measunng deVIce.
m
UU- Unconsolidated-Undrained Triaxial
B - Single Shear Plane
.
I
.
=
CU- Consolidated-Undrained Triaxial
C - Multiple Shear Plane
NP = Non PlastiC Material
D - Vertical Fracture
.
I
1-
@
il'
?l
'"
z
?
r;J
::1
§
.."
m
~
...
~
---1
1
-
--- --
-- --
--
--
~--
---
--
--
I Date:]
I
=
--
~
eeked By:
.).><\)
Date:
"61
(;,)
0
?,
Drawn By:
rrt;>p\.~.1
.. roved By: 4'<-
Date: ....
/Th
-,-
I
Summary of Test Results
Job No.: 0201-6500
06jAu9-2008 (Ver. #5)
Boring: Texas Offshore Port System, Offshore Terminal Location
,
i
Block: A-36
Area:
Galveston
Strength Estimate
Miniature Vane Tests
I
Identification Tests
Compress,on Tests
Passing
(ksf)
(ksf)
RemOld~
Uquld
Plastic
Moisture
Submerged
N,.
Moisture
Confining
Undisturbed
S"
Submerged
Failure
Sample
Depth
LIquidity
Limit
Umlt
Content
Unit Weight
'"
Type
Conlern
PlI!55ure
Stnongth
stnn
g,
S!ra.in
Unit Weight
Stnlln
Type
ot
No.
1ft,
Index
1%,
I%J
1%'
"of)
SillVfl
Penetrometer
Torvane
Un(flSturbed
Remolded
Residual
'"'
1%'
Ipsl)
'''''
''''.
)%,
"of)
I%J
Failure
51
117.00
1.50
1.36
1
52
117.50
45
1
53
118.00
47
1.50
1.48
2.10
1
54
127.00
1.00
1.10
1
55
127.50
UU
49
118
1.28
1
1.2
50
5
A
56
128.00
42
1.50
1.58
1.04
1
57
137.00
1.40
1
58
137.50
52
1
59
138.00
29
1.32
1.93
1
59
13B.OO
.63
40
13
30
1
60
147.00
1.25
1.75
1
61
147.50
UU
42
119
1.39
1
1.5
48
7
B
61
147.50
UU
119
,
0.8~
51
62
148.00
37
1.20
1.70
1.74
1
63
157.00
1.60
1
64
157.50
48
1
65
158.00
44
1.45
2.02
1
65
158.00
43
1
66
167.00
2.00
1
67
167.50
UU
40
119
2.67
1
1.5
45
5
B
67
167.50
UU
117
1.211
51
68
168.00
.40
71
18
39
2.00
2.10
2.55
1
NOTES:
TYPE OF TEST
TYPE OF FAILURE
Plus Signs [+]
de~ote
tests which exceeded the
U -
Unconfined Compression
A - Bulge
capacity of the m,asuring device.
UU- Unconsolidated-Undrained Triaxial
B - Single Shear Plane
CU- Consolidated-Undrained Triaxial
C - Multiple Shear Plane
NP
= Non Plastic ratenal
D
- Vertical Fracture
I
1-
@
.g
o
'"
z
?
~
~
o
~
"CJ
~
m
~
=-.L
r----
~
L.
~
I'
~--
~-
-- --
loate:
0
I
~(or'
-
-
Drawn By: "[fO>'l1. ...
r
..
.-
...
~ ,~"
Summary of Test Results
Job
No.: 0201-6500
06JAU9.2008 rver. #5)
""""
,~-.
-,-","'"1
,~
..
""'~
Block: A.36
Area: Galveston
Strength Estimate
Miniature
Vane Tests
I
Identification Tests
Compressipn Tests
Passing
(ksf)
(ksf)
Rl!mOlde~
Liquid
Plastic
Mo'stu",
Submerged
N,.
MOistur1l
Confining
Undisturbed
E~
Submerged
Filllul1I
Sample
Depth
liquidity
L.imit
Um'
Content
UnUWeight
,,,
Type
Conlenl
PII09SUn=
Strength
stren!il1
Strain
UnltWeight
strain
Type of
N,.
(ftJ
Index
(%J
(%J
(%J
(pol)
"mm
Penetrometer
Torva,nB
Undisturbed
Remolded
Residual
T,"
(%J
(psi)
("'.
(ko.
(%J
(pol)
(%J
Failure
69
177.00
2.00
I
70
177.50
UU
28
119
2.87
I
2.3
51
9
AB
71
178.00
32
2.00
2.76
I
72
189.00
2.25
I
73
189.50
33
I
74
190.00
43
I
74
190.00
43
2.50
2.45
2.00
I
75
197.00
2.50
2.20
I
76
197.50
UU
42
120
3.14
I
1.1
44
3
B
76
197.50
UU
118
1.401
49
77
198.00
.33
78
21
40
2.50
2.15
3.25
I
78
207.00
2.00
1.80
I
79
207.50
45
UU
46
120
3.10
I
0.9
48
3
C
79
207.50
UU
42
120
1.081
47
80
208.00
43
2.00
2.00
1.91
I
80
208.00
44
I
81
217.00
2.75
2.30
I
82
217.50
UU
120
1.461
48
82
217.50
UU
43
118
3.72
I
1.2
45
3
AC
83
218.00
43
2.75
2.25
3.61
I
84
227.00
2.00
I
85
227.50
54
UU
25
120
2.11
I
1.7
56
8
A
NOTES:
TYPE OF TEST
TYPE OF FAILURE
Plus Signs [+] denote tests which exceeded the
U
- Unconfined Compression
A. Bulge
capacity of the
me~suring
device.
UU- Unconsolidated-Undrained Triaxial
8
-
Single Shear Plane
CU- Consolidated-Undrained Triaxial
C • Multiple Shear Plane
NP :::: Non Plastic Jaterial
---
---
-_.
0- Vertical fracture
-
I
1-
@
;0
~
"-
z
?
~
§
--
--
--
-- --
--
--
Checked By: l).Av
",. "il
Date:
<6 (
/
c)
Approved By: ""'''''
Date:
.ffd',t;.
Summary of Test Results
--
--
--
-~
-~T~
--
Drawn By:'lfo,,",{
lDate:
~(",(Oy
1
I
Job No.:
0201-6500
06-tug-2008 rver.
#5)
Boring:
Texas Offshore Port System. Offshore iT"erminal Location
Block: A-36
Area:
Galveston
Identification Tests
strength Estimate
Miniature Vane Tests
compreSSi~n
Tests
Pa.s;slng
(ksf)
(ksf)
Liquid
Plastic
Moisture
Submerged
No.
Moisture
Confining
Undisturbed
RemOldedl
£9
Submerlled
Failure
Sample
Depth
Liquidity
Umlt
Limit
Conll!nt
Unit Weight
'"'
Ty,.
Content
Pressure
Strength
Strength
Slriiln
Unit Weight
strain
Type of
No.
(ft)
Indu.
('I.)
(%)
(%)
(Pd)
Sieve
Penetrometer
Tarvane
Undisturbed
Remolded
Residual
T~t
(%)
(psi)
I'd)
("'"
(%)
(Pd)
(%)
Failure
103
286.50
2.75
2.50
I
100
287.00
UU
118
1.291
48
100
287.00
UU
43
119
3.23
I
1.9
40
7
B
105
287.50
45
2.75
2.75
3.53
I
106
297.00
2.50
3.40
I
107
297.50
59
UU
22
120
0.961
65
107
297.50
UU
23
120
2.62
I
6.2
64
20
A
108
298.00
20
60
I
100
299.00
.27
63
14
27
2.75
2.25
UU
28
121
1.53
I
1.7
58
16
B
110
299,50
I
111
300.00
58
I
112
307.00
1.75
2.50
I
113
307.50
59
UU
26
120
1.05
I
60
113
307.50
UU
26
121
2.39
I
1.7
56
15
A
II.
30B.00
31
I
11.
30B.OO
28
2.00
2.00
2.47
I
115
317.00
2.50
2.20
I
116
317.50
53
UU
119
1.861
54
116
317.50
UU
31
118
2.66
I
1.7
53
7
B
117
318,00
32
3.00
3.00
I
118
327.00
3.75
3.30
I
110
327.50
56
UU
29
120
1.82
I
58
NOTES:
TYPE OF TEST
TYPE OF FAILURE
Plus Signs r+}
deno~e
tests which exceeded the
U
- Unconfined Compression
A- Bulge
capacity of the measuring device.
UU- Unconsolidated-Undrained Triaxial
B
- Single Shear Plane
NP = Non Plastic
M~terial
CU- Consolidated-Undrained Triaxial
C - Multiple Shear Plane
0- Vertical Fracture
."
m
~
~
'"
~
I~
@
'C
7rl
o
"
Z
P
o
51
a,
g;
o
_1-
--
...
,.,.-
Summary of Test Results
I
--_.
---"--
F
: 'II/i.lo,
V/
~, ~
,
Job No.: 0201-<1500
061u9-2008 (\Ier. #5)
""~ '~·-·-'-~"1'~"~"·
Block: A-36
Area: Galveston
Identification Tests
Strength Estimate
Miniature Vane Tests
compress~on
Tests
'U
m
~
:t>
'"
or
sample
Depth
N,.
fft,
119
327.50
120
328.00
120
328,00
121
337.00
122
337.50
123
338.00
124
346.50
12.
347.00
12.
347.00
126
347.50
126
347.50
127
357.00
128
357.50
128
357.50
129
358.00
130
367.00
131
367.50
132
368.00
133
377.00
134
377.50
13.
378.00
13'
378.00
NOTES:
Liquidity
Indelt
.38
.34
Passing
Uquld
Plastic
Moisture
Subml!rged
N,.
Limit
Limit
content
Unit Weight
'"
f%)
('''I
f%f
(Pd)
Sieve
48
13
26
28
33
57
26
21
63
17
32
27
51
29
25
TYPE OF TEST
U
- Unconfined Compression
UU- Unconsolidated-Undrained Triaxial
CU- Consolidated-Undrained Triaxial
(ksf)
(ksf)
Penetrometer
Torvane
Undisturbed
Remolded
Residual
3.00
2.35
3.38
4.00
4.00
3.40
3.25
3.80
4.00
3.50
3.83
+
3.83 +
2.57
TYPE OF FAILURE
A- Bulge
B - Single Shear Plane
C - Multiple Shear Plane
D
- Vertical Fracture
RemOlda~
Moisture
Confining
Undisturbed
S"
Submerged
Failu~
Ty,.
Content
Pl'!!ssun=
Stnmgth
StI1!l
ngth
l
Strain
Unit Weight
Strain
TYPe of
TUt
f%)
(ps])
(ksf)
f""
(%)
(pcl)
f%)
Failure
UU
33
120
3.84
1
1.8
54
7
AB
1
1
1
UU
32
120
2.24
1
1.7
53
5
B
1
1
UU
24
120
2.57
1
1.7
59
11
A
UU
22
120
2.381
63.
1
1
1
UU
120
1.401
59
UU
32
120
3.03
1
2.7
50
8
A
1
1
I
UU
25
120
2.53
1
3.1
49
12
B
1
1
1
1
1
Plus Signs [+] denote tests which exceeded the
capacity of the
me~suring
device.
I
NP =Non Plastic Material
[
--
-,-~
1-
@
~
"8
"-
z
?
Rl
:l
b>
8
I
I
-- --
-- -- --
-
-
Checked By:
lA<:
Date:
'2'((,,/0<6
Approved By: P.A-
Date:
#'/?~
Summary of Test Results
--
--- --
--
-.
-:-
,[
~
--
Drawn By: II eo""",",'
rate: \
I 1,/0"(,
Job No.: 0201.6500
061u9.2008
ryer,
#5)
Boring: Texas Offshore Port System, Offshore
Terminal Location
Block: A-36
Area: Galveston
Identification Tests
Strength Estimate
Miniature Vane Tests
compreSSi~n
Tests
Passing
(ksf)
(ksf)
I
Uquld
Plastic
Moisture
Submerged
No.
Molsture
Confining
Undl!iturbed
Remolded
E..
Submerged
Failure
Sample
Depth
Liquidity
Limit
LImit
content
Unit Weight
,,,
Typo
Content
Pressl.lre
Strength
strengthi
Strollin
Unit
Weight
Strolln
Type of
No,
fft)
Inde.>;
(%)
f%f
(%)
f,d)
SIeve
Penetrometer
Torvane
Undisturbed
Remolded
Residual
Test
f%)
(psI)
f""l
"'"
f%)
f,d)
f%)
Failure
136
386.80
50
10
1
137
396.40
21
42
7
1
138
407.00
3,25
1
139
407.50
UU
33
120
4,28
1
2,9
47
8
B
139
407.50
UU
121
2,141
55
140
408.00
,32
62
17
31
3,50
2.87
1
141
417,00
3,50
1
142
417,50
47
1
143
418.00
33
3,50
3,29
1
143
418.00
30
1
144
427.00
3,00
2,85
1
145
427.50
UU
.
121
1,941
55
145
427.50
UU
33
119
3,13
1
4,1
44
15
C
146
428.00
33
2.75
3,00
2,95
1
147
437.00
57
1
148
437.50
UU
28
120
2.20
1
0.9
54
9
AB
148
437.50
UU
28
120
1.641
58
149
438.00
26
3,50
3,10
3,15
1
149
438.00
.79
37
11
31
1
150
449.00
1
151
449.50
UU
21
120
2.56
1
8,8
55
20
A
152
450.00
19
36
1.75
2.00
1
NOTES:
TYPE OF TEST
TYPE OF FAILURE
Plus Signs [+] dendte tests which exceeded the
U
- Unconfined Compression
A - Bulge
capacity
of the
me~lsurin9
device.
UU- Unconsolidated-Undrained Triaxial
B • Single Shear Plane
CU- Consolidated-Undrained Triaxial
C - Multiple Shear Plane
NP = Non Plastic Material
-
--
D
- Vertical Fracture
I
m
~
"
~
-
T
I
I
I
\--------------
)
~
t;=
~
m
"
~
If
"
..i
,.
'l~
iii
iii
)~
~
2,
r ..
>.
in
m
~
~
m
-I~
K
o
~
«
~
1.25
i
i
1.00 I
;:g:W
al
-~"Sip'"e"
URi
f stili?
.~
-
o
0.75
.:;
CIS
Q)
0
"0
Q)
.~
0.50
CIS
L-
a
E
Z
0.25
0.00 _
4
8
12
16
Strain in Percent
Maximum
Confining
Deviator
Curve
Sample
Depth
Test
Pressure
Stress
G50
No.
[ft)
Type
[psi)
[ksf]
[%)
<r---e
15
31.50
UU
119.6
1.18
2.2
t'i
El
24
42.50
UU
118.7
1.49
1.5
•
•
32
49.50
UU
119.8
1.57
5.1
•
•
38
67.50
UU
121.1
2.11
1.7
• Normalized with respect
to maximum deviator stress.
STRESS-STRAIN CURVES
Unconsolidated-Undrained Triaxial Compression Test
Texas Offshore Port System, Offshore Terminal Location
Block A-36, Galveston Area
20
Report
No. 0201-6500
PLATEA-3a
._I@ ___________
I
I
)
~
1:;
I~
...
'"
•
h
f
!,;'
I~
'"
)
,I
\.
.-~~
Il '"
1
2
-ii
~~
.,
>.
~
~
.
-I~
[
o
~
«
~
1
.LO
1.00
•
C/)
C/)
OJ
~
.....
CI)
.....
e
0.75
.:;
~
ro
OJ
0
"0
OJ
.~
0.50
ro
E
....
e
Z
0.25
n nn
o
!
i
i
~;i--
-- --
-'-
------
:\
i
i
f
'J~
~' ~
"
!
i
,
[-
!
I
i
I
I
i
4
8
12
16
Strain in Percent
Maximum
Confining
Deviator
Curve
Sample
Depth
Test
Pressure
Stress
G50
No.