105
AB
C
D
Line 14
Beach
0
50
100
% Sand
Depth (cm)
0
100
150
200
300
250
50
Depth (cm)
0
100
150
200
300
250
50
Depth (cm)
0
100
150
200
300
250
50
0
100
150
200
300
250
50
0
50
100
% Sand
0
50
100
% Sand
0
50
100
% Sand
Beach
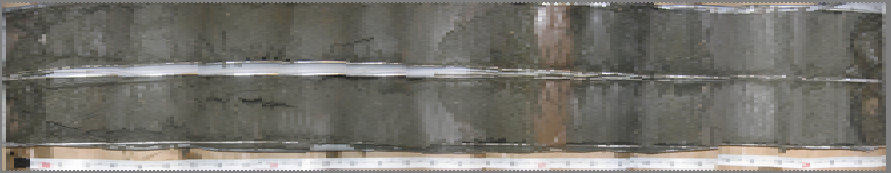
Figure 80: Fence Profile of Line 14
106
14 B
C
D
E
0cm
50cm
0cm
50cm
100cm
150cm
0cm
50cm
100cm
150cm
200cm
0cm
50cm
100cm
150cm
200cm
250 cm
300cm
Figure 81: Core Photographs of line 14
12
CORE 14B:
Core 14B was and taken at a water depth of 6.7m (22.1ft) (Table 1) and had a
total length of 317cm (124.8in) (Figures 82-85). A total of 15 grain size samples were
taken at depths of 1-10cm (0.4-3.9in), 51-60cm (20-23.6in), 101-110cm (39.3-43.3in),
151-160cm (59.4-63in), 191-200cm (75.2-78.7in), 201-210cm (63.3-67in), 211-220cm
(83.1-86.7in), 231-240cm (90.9-94.5in), 241-250cm 94.8-98.4in), 251-260cm (98.8-
102.4in), 261-270cm (102.8-106.3in), 281-289cm (110.6-113.8in), 289-295cm (113.8-
116.4in), 296-300cm (116.5-118.1in), 311-316cm (122.4-124.4in). Data from core 14B
showed a large sand layer at a depth from 0-200cm (0-78.7in), which had over 84% sand
content with a mean grain size of no less than 0.09mm (3.4phi) . From 200cm (78.7in)
through the bottom of the core there is varying amounts of sand ranging from 20 to 89%
(Tables 55&56). Sand and shell weights are shown in Table 54. Percent sand, silt and
clay are shown in Table 55. Median grain size, mean grain size, skewness and sorting
index are shown in Table 56 Graphs of the results are located in Figures 86-89.
It was determined that core 14B had approximately 265cm (104.4in) of sediment
contained at least 50% sand, of which 100cm (39.4in) was located shallower than 1m
(39.4in) depth. The average grain size in the upper 1m (3.28ft) was determined to be
0.0978mm.
107
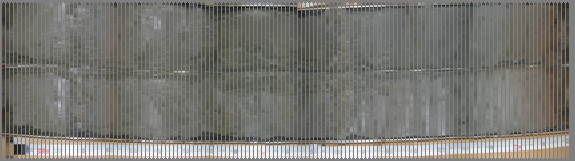
Figure 82 : Core Log of 14B for depths 0-150cm
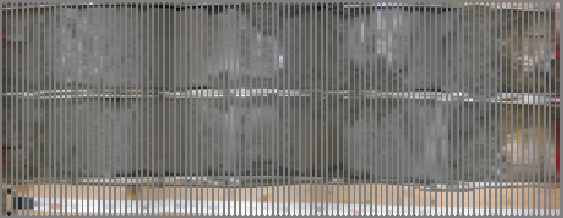
Figure 83: Core photograph of 14B for depths 150-300cm
108
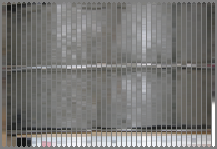
Figure 84: Core log of 14B for depths 300-317cm
Figure 85: Computerized core log of 14B
109
Core
ID
Sample
Depth
(cm)
#10/
2.0mm
Screen
Sample
Weight
(g)
#14/
1.40mm
Screen
Sample
Weight
(g)
#18/
1.00mm
Screen
Sample
Weight
(g)
#25/
710μm
Screen
Sample
Weight
(g)
#35/
500μm
Screen
Sample
Weight
(g)
#45/
355μm
Screen
Sample
Weight
(g)
#60/
250μm
Screen
Sample
Weight
(g)
#80/
180μm
Screen
Sample
Weight
(g)
#125/
125μm
Screen
Sample
Weight
(g)
#170/
90μm
Screen
Sample
Weight
(g)
#200/
75μm
Screen
Sample
Weight
(g)
#230/
63μm
Screen
Sample
Weight
(g)
14B 1-10
2.69 0.51 0.42
0.29
0.15
0.17
0.44 1.48
6.41
37.02
16.55
4.46
14B 51-60
0.49 0.43 0.34
0.27
0.11 0.17
0.48 1.82
6.40
45.47
18.13
6.24
14B 101-110 0.05 0.34 0.24
0.23
0.12
0.11
0.33 1.22
6.75
40.85
22.85
5.54
14B 151-160 0.05 0.11 0.09
0.10
0.05
0.04
0.23 1.75
7.16
45.11
22.91
9.30
14B 191-200 0.24 0.27 0.18
0.16
0.15
0.29
0.44 1.43
15.12
94.18
26.25
8.87
14B
201-210
14.91
3.05
14B 211-220 0.03 0.03 0.03
0.03
0.03
0.04
0.18 0.57
2.19
15.46
31.16
28.84
14B 231-240 1.32 0.28 0.14
0.10
0.08
0.08
0.18 0.18
0.57
11.04
30.13
23.12
14B 241-250 0.08 0.10 0.09
0.07
0.02
0.06
0.14 0.33
1.82
27.57
24.98
25.30
14B 251-260 0.14 0.06 0.04
0.05
0.04
0.06
0.19 0.25
2.26
39.93
23.72
13.46
14B
261-270
10.56
5.01
14B
281-290
10.37
3.13
14B
289-295
44.64
0.86
14B 296-300 0.00 0.00 0.00
0.04
0.03
0.05
0.09 0.30
5.96
68.55
11.30
4.73
14B 310-316 0.11 0.18 0.26
0.34
0.24
0.24
0.82
3.40
83.80
12.13
7.94
Table 52: RO-TAP data for core 14B
110
ASTM
Classification
coarse
sand
medium
sand
medium
sand
medium
sand
medium
sand
fine
sand
fine
sand
fine
sand
fine
sand
fine
sand
fine
sand silt
Wentworth
Classification
granule
very
coarse
sand
very
coarse
sand
coarse
sand
coarse
sand
medium
sand
fine
sand
fine
sand
fine
sand
very
fine
sand
very
fine
sand
very fine
silt
Core ID
Sample
Depth
(cm)
%
finer
than
N10/
2.0mm/
-1.0Φ
Screen
% finer
than
N14/
1.40mm
/ -0.5Φ
Screen
% finer
than
N18/
1.00mm/
0.0Φ
Screen
% finer
than
N25/
710μm
/ 0.5Φ
Screen
% finer
than
N35/
500μm/
1.0Φ
Screen
% finer
than
N45/
355μm
/ 1.5Φ
Screen
% finer
than
N60/
250μm
2.0Φ
Screen
% finer
than
N80/
180μm/
2.5 Φ
Screen
% finer
than
N125/
125μm/
3.0Φ
Screen
% finer
than
N170/
90μm /
3.5Φ
Screen
% finer
than
N200/
75μm /
4.0Φ
Screen
% finer
than
4μm/ 8Φ
Observed
Contents of
the sample
shell
only
shell
only
shell
only
shell
only
shell
only
shell
only
shell
only sand sand sand sand
silt
14B
1-10
96.3
95.6
95.1 94.7 94.5 94.2 93.6 91.6
82.9 32.5 10.0
2.6
14B
51-60
99.4
98.9
98.5 98.2 98.1 97.8 97.3 95.1
87.5 33.5 11.9
3.0
14B
101-110
99.9
99.5
99.2 99.0 98.8 98.7 98.3 96.8
88.7 39.3 11.7
3.4
14B
151-160
99.9
99.8
99.7 99.6 99.6 99.5 99.3 97.3
89.5 39.8 14.6
2.6
14B
191-200
99.8
99.7
99.5 99.4 99.3 99.2 98.9 97.9
88.1 26.6
9.5
2.1
14B
201-210
59.6
39.2
14B
211-220
100.0
99.9
99.9 99.9 99.9 99.8 99.6 99.1
96.9 81.6 50.7
7.6
14B
231-240
98.4
98.1
97.9 97.8 97.7 97.6 97.4 97.2
96.5 83.5 48.0
5.6
14B
241-250
99.9
99.8
99.8 99.7 99.7 99.6 99.5 99.2
97.7 74.0 52.6
15.0
14B
251-260
99.9
99.8
99.8 99.7 99.7 99.6 99.4 99.1
96.8 55.5 30.9
4.6
14B
261-270
79.8
39.4
14B
281-290
79.1
45.1
14B
289-295
29.8
17.0
14B
296-300
100.0 100.0 100.0 100.0 99.9 99.9 99.8 99.5
94.1 32.0 21.7
8.9
14B
310-316
99.9
99.8
99.6 99.3 99.1 98.9 98.9 98.2
95.5 27.7 17.8
6.3
Table 53: Percent Finer table for core 14B
111
Core ID
Sample Depth (cm)
shell weight
200+ weight
200-230 weight
sand + shell
14B 1-10
4.23
61.90
4.46
66.13
14B 51-60
1.81
72.30
6.24
74.11
14B 101-110
1.09
72.00
5.54
73.09
14B 151-160
0.44
77.16
9.30
77.60
14B 191-200
1.29
137.42
8.87
138.71
14B 201-210
14.91
3.05
14.91
14B 211-220
0.19
49.56
28.84
49.75
14B 231-240
2.00
42.10
23.12
44.10
14B 241-250
0.42
54.84
25.30
55.26
14B 251-260
0.39
66.35
13.46
66.74
14B 261-270
10.56
5.01
10.56
14B 281-290
10.37
3.13