35
BC
D
Back to top
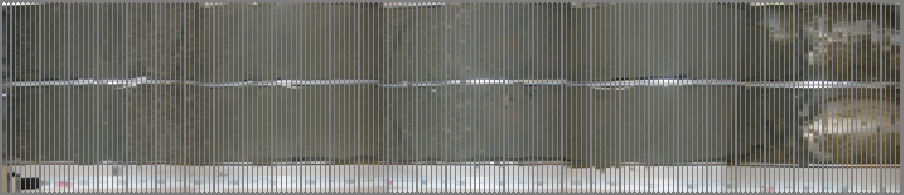
Line 12
Beach
A
0
50
100
0
100
150
200
300
250
50
0
50
100
0
100
150
200
300
250
50
0
50
100
0
100
150
200
300
250
50
0
50
100
0
100
150
200
300
250
50
Back to top
Beach
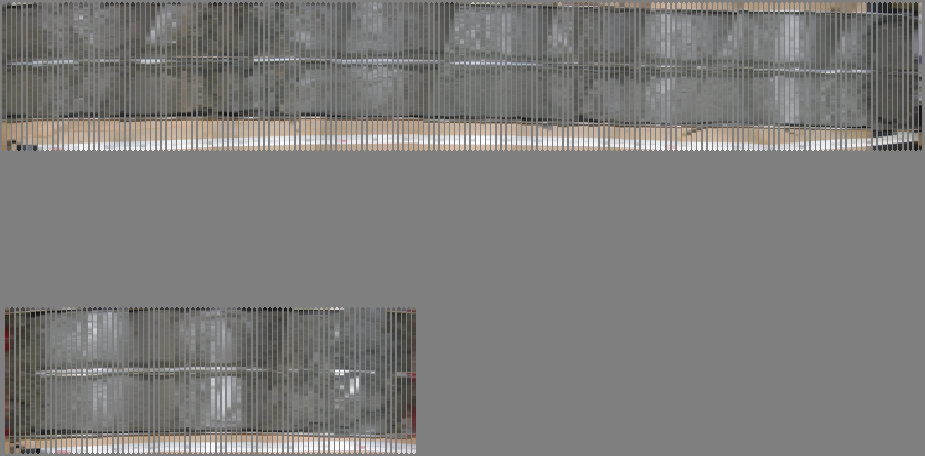
Figure 18: Fence Profile for Line 12
36
12A
B
100cm
250cm
100c m
0cm
0cm
50cm
50cm
150cm
200cm
0cm
0cm
50cm
50cm
100cm
100cm
150cm
150cm
200cm
200cm
C
D
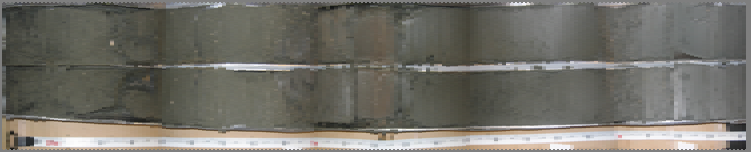
Figure 19: Core photographs of Line 12
CORE 12D:
Core 12D was taken at a water depth of 9m (29.7ft) (Table 1) and had a total
length of 273cm (107.5in) (Figures 40-42). A total of 14 grain size samples were taken at
depths of 1-10cm (0.4-3.9in), 51-54cm (20-22.3in), 54-60cm (22.3-23.6in), 71-80cm (28-
31.5in), 81-90cm (31.9- 35.4in) , 121-124cm (47.6-48.8in), 124-130cm (48.4-51.2in),
151-160cm (59.4-63in), 161-170cm (63.3-67in), 171-180cm (67.3-70.9in), 181-190cm
(71.3-74.8in), 191-200cm (75.2-78.7in) , 251-260cm (98.8-102.4in) and 271-273cm
(106.7-107.5in). Core 12D contained many fine layers of muddy sands, sandy muds and
clays. Its overall percent sand remained below 67% and was mostly below 40% sand; and
had a mean grain size of less than 0.0221mm (5.5phi) (Tables 30&31). Sand and shell
weights are shown in Table 29. Percent sand, silt and clay are shown in Table 30.
Median grain size, mean grain size, skewness and sorting index are shown in Table 31.
Graphs of the results are located in Figures 43-56.
It was determined that core 12D had approximately 15cm (5.9in) of sediment
contained at least 50% sand, none of which was located shallower than 1m (39.4in)
depth. The average grain size in the upper 1m (3.28ft) was determined to be 0.0557mm.
60
Figure 40: Core Log of 12D for depths 0-150cm
Figure 41: Core Log of 12D for depths 150-273
61
Figure 42: Computerized core log of 12D
62
Core
ID
Sample
Depth
(cm)
#10/
2.0mm
Screen
Sample
Weight
(g)
#14/
1.40mm
Screen
Sample
Weight
(g)
#18/
1.00mm
Screen
Sample
Weight
(g)
#25/
710μm
Screen
Sample
Weight
(g)
#35/
500μm
Screen
Sample
Weight
(g)
#45/
355μm
Screen
Sample
Weight
(g)
#60/
250μm
Screen
Sample
Weight
(g)
#80/
180μm
Screen
Sample
Weight
(g)
#125/
125μm
Screen
Sample
Weight
(g)
#170/
90μm
Screen
Sample
Weight
(g)
#200/
75μm
Screen
Sample
Weight
(g)
#230/
63μm
Screen
Sample
Weight
(g)
12D
1-10
21.90
3.31
12D
51-54
19.21
6.77
12D 54-60
4.06
1.58
0.60 0.38 0.20 0.13 0.07 0.17 1.01 19.11 18.72 12.37
12D 71-80
0.52
0.28
0.23 0.15 0.05 0.07 0.18 0.24 1.16 17.61 23.51 34.82
12D 81-90
9.07
3.31
2.50 1.49 0.61 0.36 0.29 0.72 4.77 13.86 9.55 7.96
12D
121-124
13.74
9.11
12D
124-130
10.09
3.34
12D
151-160
8.76
2.97
12D
161-170
27.26
5.75
12D 171-180
0.54
0.65
0.45 0.43 0.26 0.30 0.47 2.75 34.49 58.98 12.13 10.99
12D
181-190
33.14
5.37
12D
191-200
8.41
1.22
12D
251-260
4.85
1.88
12D
271-273
10.42
3.17
Table 27: RO-TAP data for core 12D
63
ASTM
Classification
coarse
sand
medium
sand
medium
sand
medium
sand
medium
sand
fine
sand
fine
sand
fine
sand
fine
sand
fine
sand
fine
sand silt
Wentworth
Classification
granule
very
coarse
sand
very
coarse
sand
coarse
sand
coarse
sand
medium
sand
fine
sand
fine
sand
fine
sand
very
fine
sand
very
fine
sand
very fine
silt
Core ID
Sample
Depth
(cm)
%
finer
than
N10/
2.0mm/
-1.0Φ
Screen
% finer
than
N14/
1.40mm
/ -0.5Φ
Screen
% finer
than
N18/
1.00mm/
0.0Φ
Screen
% finer
than
N25/
710μm
/ 0.5Φ
Screen
% finer
than
N35/
500μm/
1.0Φ
Screen
% finer
than
N45/
355μm
/ 1.5Φ
Screen
% finer
than
N60/
250μm
2.0Φ
Screen
% finer
than
N80/
180μm/
2.5 Φ
Screen
% finer
than
N125/
125μm/
3.0Φ
Screen
% finer
than
N170/
90μm /
3.5Φ
Screen
% finer
than
N200/
75μm /
4.0Φ
Screen
% finer
than
4μm/ 8Φ
Observed
Contents of
the sample
shell
only
shell
only
shell
only
shell
only
shell
only
shell
only
shell
only sand sand sand sand
silt
12D
51-54
62.2
24.8
12D
54-60
95.0
93.1
92.4 91.9 91.6 91.5 91.4 91.2
90.0 66.6 43.6
9.1
12D
71-80
99.6
99.3
99.1 99.0 99.0 98.9 98.7 98.5
97.6 82.7 62.8
7.9
12D
81-90
91.6
88.5
86.2 84.8 84.2 83.9 83.6 83.0
78.5 65.7 56.8
23.1
12D
121-124
81.5
20.1
12D
124-130
84.2
29.3
12D
151-160
80.6
28.6
12D
161-170
73.9
24.6
12D
171-180
99.7
99.3
99.0 98.7 98.6 98.4 98.1 96.4
75.3 39.1 31.7
9.5
12D
181-190
55.2
25.2
12D
191-200
82.3
53.3
12D
251-260
88.9
29.8
12D
271-273
62.3
17.1
Table 28: Percent Finer table for core 12D
64
Core ID
Sample Depth (cm)
shell weight
200+ weight
200-230 weight
sand + shell
12D 1-10
21.90
3.31
21.90
12D 51-54
19.21
6.77
19.21
12D 54-60
6.95
39.08
12.37
46.03
12D 71-80
1.30
42.70
34.82
44.00
12D 81-90
17.34
29.19
7.96
46.53
12D 121-124
13.74
9.11
13.74
12D 124-130
10.09
3.34
10.09
12D 151-160
8.76
2.97
8.76
12D 161-170
27.26
5.75
27.26
12D 171-180
2.63
108.82
10.99
111.45
12D 181-190
33.14
5.37
33.14
12D 191-200
8.41
1.22
8.41
12D 251-260
4.85
1.88
4.85
12D 271-273
10.42
3.17
10.42
Table 29: Shell and Sand weights for core 12D
65
Core ID
sample id
mid sample
depth
% shell
% sand
%silt