35
BC
D
Back to top
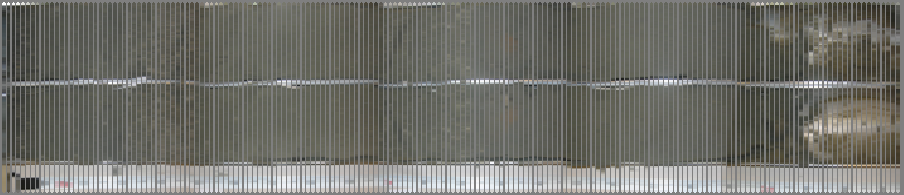
Line 12
Beach
A
0
50
100
0
100
150
200
300
250
50
0
50
100
0
100
150
200
300
250
50
0
50
100
0
100
150
200
300
250
50
0
50
100
0
100
150
200
300
250
50
Back to top
Beach
Figure 18: Fence Profile for Line 12
36
12A
B
100cm
250cm
100c m
0cm
0cm
50cm
50cm
150cm
200cm
0cm
0cm
50cm
50cm
100cm
100cm
150cm
150cm
200cm
200cm
C
D
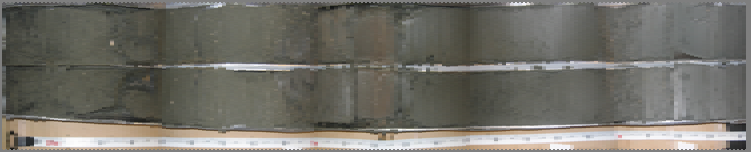
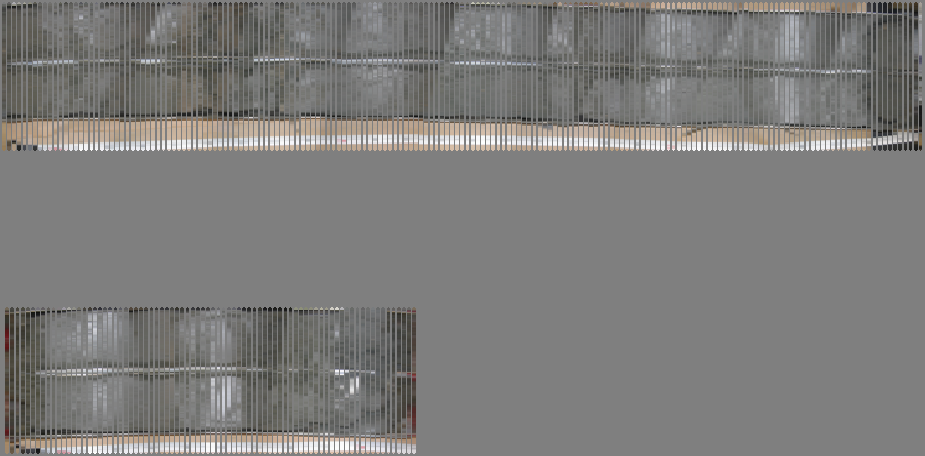
Figure 19: Core photographs of Line 12
6
CORE 12A:
Core 12A was taken at a water depth of 4.9m (16ft) (Table 1) and was a total
length of 208cm (81.9in) (Figures 20-22). A total of 8 grain size samples were taken at
depths of 1-5cm (0.4-2in), 5-10cm (2-3.9in), 31-40cm (12.2 15.7in), 51-60cm (20-
23.6in), 101-110cm (39.3-49.8in), 131-134cm (51.6-52.8in), 151-160cm (59.4-63in) and
201-210cm(78.7-82.7in). The core contained mostly sand with some shell hash and grain
size analyses revealed that the entire core had at least 83% sand and a mean grain size of
at least 0.094mm (3.4phi) (Tables 15&16). Sand and shell weights are shown in Table 14.
Percent sand, silt and clay are shown in Table 15. Median grain size, mean grain size,
skewness and sorting index are shown in Table 16. Graphs of the results are located in
Figures 23-26.
It was determined that core 12A had approximately 208cm (81.9in) of sediment
contained at least 50% sand, of which 100cm (39.4in) was located shallower than 1m
(39.4in) depth. The average grain size in the upper 1m (3.28ft) was determined to be
0.1021mm.
37
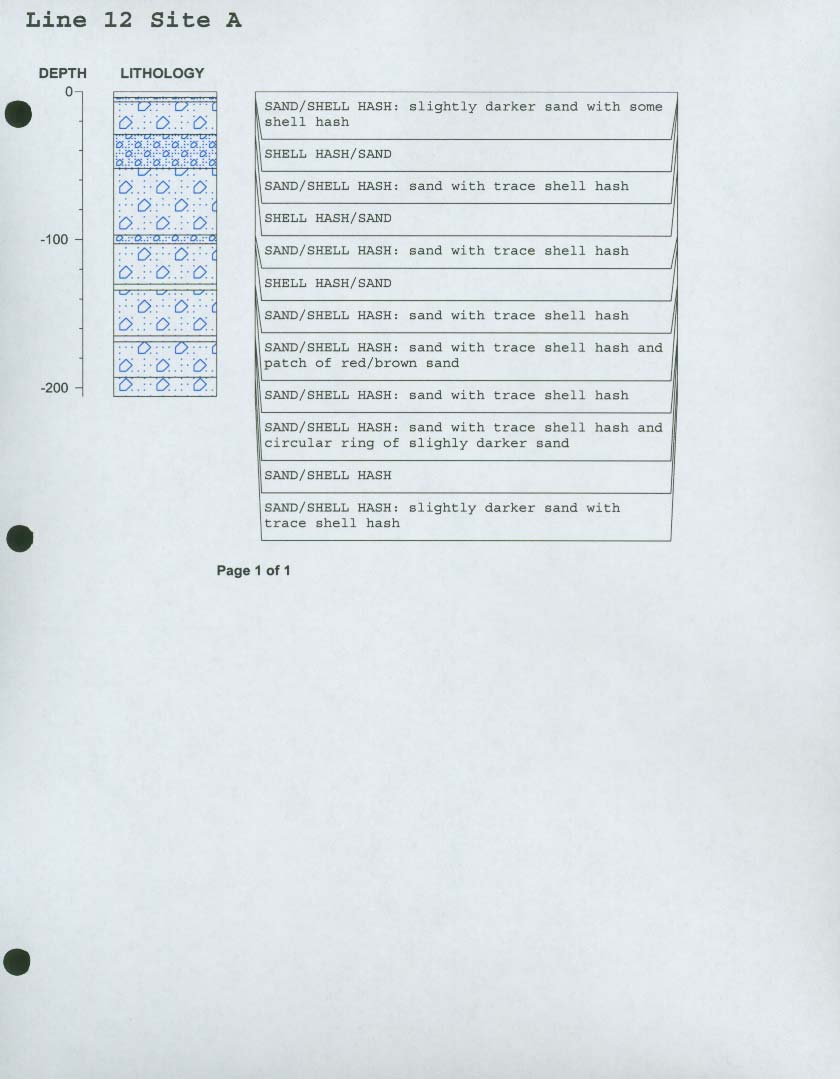
Figure 20: Core Log of 12A for depths 0-150cm
Figure 21: Core Log of 12A for depths 150-300cm
38
Figure 22: Computerized core log for core 12A
39
Core
ID
Sample
Depth
(cm)
#10/
2.0mm
Screen
Sample
Weight
(g)
#14/
1.40mm
Screen
Sample
Weight
(g)
#18/
1.00mm
Screen
Sample
Weight
(g)
#25/
710μm
Screen
Sample
Weight
(g)
#35/
500μm
Screen
Sample
Weight
(g)
#45/
355μm
Screen
Sample
Weight
(g)
#60/
250μm
Screen
Sample
Weight
(g)
#80/
180μm
Screen
Sample
Weight
(g)
#125/
125μm
Screen
Sample
Weight
(g)
#170/
90μm
Screen
Sample
Weight
(g)
#200/
75μm
Screen
Sample
Weight
(g)
#230/
63μm
Screen
Sample
Weight
(g)
12A 1-5
1.19
0.87
0.58 0.35 0.20 0.24 0.39 0.68 3.68 54.36 24.46 7.94
12A 5-10
0.89
0.22
0.22 0.14 0.10 0.14 0.26 0.58 5.32 60.73 9.30 3.86
12A 31-40
4.42
1.44
3.06 2.15 1.39 0.79 1.04 2.03 10.78 73.63 9.96 2.90
12A 51-60
0.24
0.20
0.39 0.32 0.20 0.18 0.39 0.80 4.53 70.02 8.20 2.47
12A 101-110
0.62
0.23
0.28 0.15 0.13 0.11 0.18 0.56 8.78 64.99 7.95 2.68
12A 131-134
0.31
0.05
0.04 0.01 0.01 0.07 0.23 0.50 5.77 54.65 7.10 2.95
12A 151-160
0.00
0.00
0.03 0.04 0.03 0.09 0.16 0.47 13.07 58.82 8.42 1.99
12A 201-210
0.00
0.00
0.02 0.04 0.02 0.04 0.07 0.34 6.23 51.08 15.99 7.83
Table 12: RO-TAP data for core 12A
40
ASTM
Classification
coarse
sand
medium
sand
medium
sand
medium
sand
medium
sand
fine
sand
fine
sand
fine
sand
fine
sand
fine
sand
fine
sand silt
Wentworth
Classification
granule
very
coarse
sand
very
coarse
sand
coarse
sand
coarse
sand
medium
sand
fine
sand
fine
sand
fine
sand
very
fine
sand
very
fine
sand
very fine
silt
Core ID
Sample
Depth
(cm)
%
finer
than
N10/
2.0mm/
-1.0Φ
Screen
% finer
than
N14/
1.40mm
/ -0.5Φ
Screen
% finer
than
N18/
1.00mm/
0.0Φ
Screen
% finer
than
N25/
710μm
/ 0.5Φ
Screen
% finer
than
N35/
500μm/
1.0Φ
Screen
% finer
than
N45/
355μm
/ 1.5Φ
Screen
% finer
than
N60/
250μm
2.0Φ
Screen
% finer
than
N80/
180μm/
2.5 Φ
Screen
% finer
than
N125/
125μm/
3.0Φ
Screen
% finer
than
N170/
90μm /
3.5Φ
Screen
% finer
than
N200/
75μm /
4.0Φ
Screen
% finer
than
4μm/ 8Φ
Observed
Contents of
the sample
shell
only
shell
only
shell
only
shell
only
shell
only
shell
only
shell
only sand sand sand sand
silt
12A
1-5
98.8
97.9
97.3 97.0 96.7 96.5 96.1 95.4
91.7 36.3 11.3
1.5
12A
5-10
98.9
98.7
98.4 98.3 98.1 98.0 97.7 97.0
90.7 18.8
7.7
2.1
12A
31-40
96.2
95.0
92.4 90.5 89.3 88.7 87.8 86.0
76.8 13.8
5.3
2.0
12A
51-60
99.7
99.5
99.1 98.7 98.5 98.3 97.9 97.0
92.0 14.7
5.6
2.0
12A
101-110
99.3
99.1
98.7 98.6 98.4 98.3 98.1 97.5
87.7 15.3
6.5
2.0
12A
131-134
99.6
99.5
99.5 99.5 99.4 99.4 99.1 98.4
90.8 18.8
9.5
3.3
12A
151-160
100.0 100.0 100.0 99.9 99.9 99.8 99.6 99.1
84.0 16.4
6.7
2.5
12A
201-210
100.0 100.0 100.0 99.9 99.9 99.9 99.8 99.4
92.4 34.6 16.5
2.5
Table 13: Percent finer table for core 12A
41
Core ID
Sample Depth (cm)
shell weight
200+ weight
200-230 weight
sand + shell
12A 1-5
3.43
83.57
7.94
87.00
12A 5-10
1.71
76.19
3.86
77.90
12A 31-40
13.25
97.44
2.90
110.69
12A 51-60
1.53
83.94
2.47
85.47
12A 101-110
1.52
82.46
2.68
83.98
12A 131-134
0.49
68.25
2.95
68.74
12A 151-160
0.19
80.94
1.99
81.13
12A 201-210
0.12
73.71
7.83
73.83
Table 14: Shell and Sand weights for core 12A
Core ID
sample id
mid sample
depth
% shell
% sand
%silt
%clay
total %
CC12A
1-5
3
3.5 85.2 9.8
1.5
100
CC12A
5-10
7