35
BC
D
Back to top
Line 12
Beach
A
0
50
100
0
100
150
200
300
250
50
0
50
100
0
100
150
200
300
250
50
0
50
100
0
100
150
200
300
250
50
0
50
100
0
100
150
200
300
250
50
Back to top
Beach
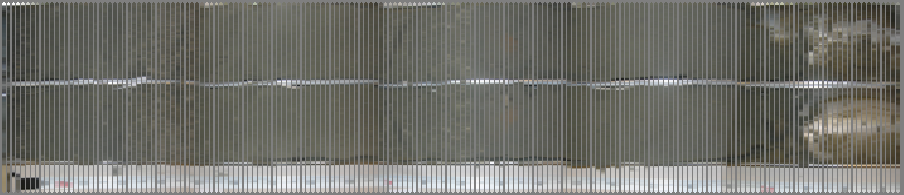
Figure 18: Fence Profile for Line 12
36
12A
B
100cm
250cm
100c m
0cm
0cm
50cm
50cm
150cm
200cm
0cm
0cm
50cm
50cm
100cm
100cm
150cm
150cm
200cm
200cm
C
D
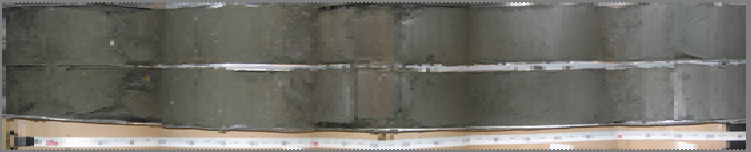
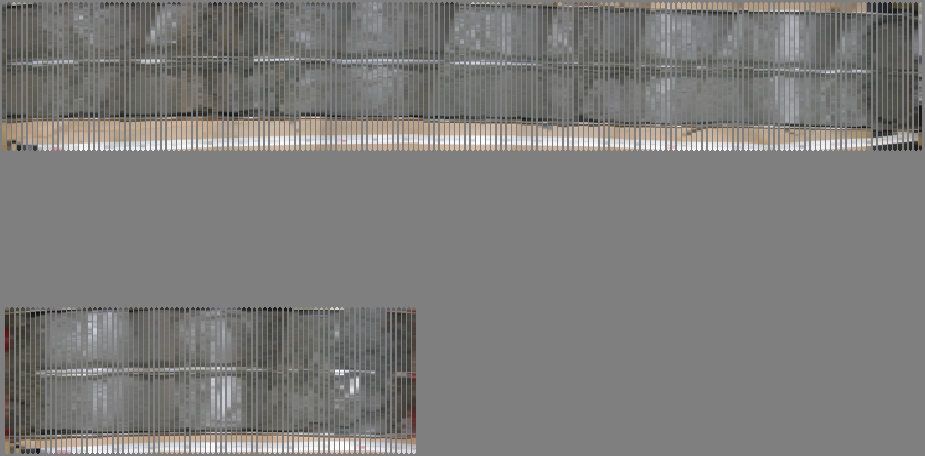
Figure 19: Core photographs of Line 12
7
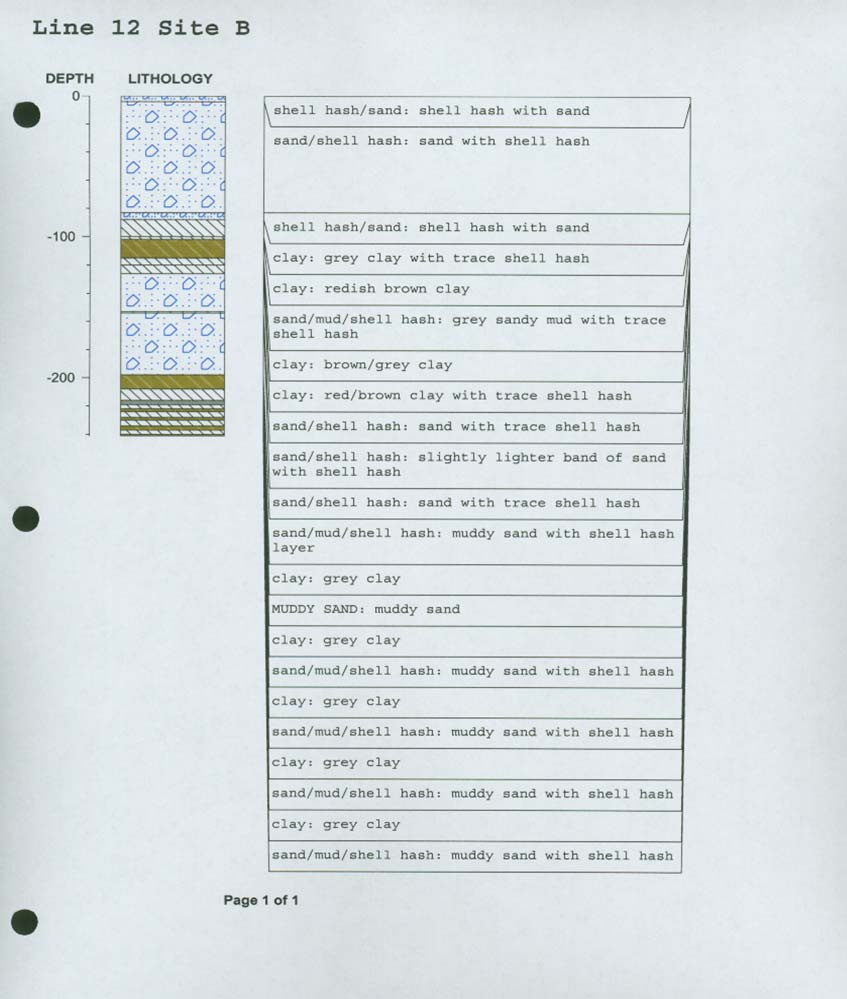
CORE 12B:
Core 12B was taken at a water depth of 5.9m(19.2ft) (Table 1) and had a total
length of 241cm (94.9in) (Figures 27-29). A total of 11 grain size samples were taken at
depths of 1-10cm (0.4-3.9in), 81-90cm (31.9- 35.4in), 91-100cm (35.8-39.4in), 101-
110cm (39.3-49.8in), 115-120cm (45.3-47.2), 121-127cm (47.6- 50in), 127-130cm (50-
51.2in), 131-140cm (51.6-55.1in), 191-200cm (75.2-78.7in), 201-210cm (78.7-82.7in)
and 231-240cm (90.9-94.5in). The top 90cm (35.4in) of the core contained sandy
sediment which had a percent sand of over 83% and mean grain size of at least 0.093mm
(3.4phi). Below this depth sand percent dropped to almost 0% at a depth of 120cm
(47.2in) when clayey sediment was encountered. At a depth of approximately 125cm to
200cm (49.2 to 78.7in) another sandy layer was observed, percent sand in this region
increased to a maximum of 82% and had a mean grain size of at least 0.096mm (3.4phi).
At the bottom of the core another clayey region was encountered and sand percents
dropped to below 20% (Tables 20&21). Sand and shell weights are shown in Table 19.
Percent sand, silt and clay are shown in Table 20. Median grain size, mean grain size,
skewness and sorting index are shown in Table 21. Graphs of the results are located in
figures 30-33.
It was determined that core 12B had approximately 185cm (72.8in) of sediment
contained at least 50% sand, of which 100cm (39.4) was located shallower than 1m
(39.4in) depth. The average grain size in the upper 1m (3.28ft) was determined to be
0.0694mm.
45
Figure 27: Core Log of 12B for depths 0-150cm
Figure 28: Core Log of 12B for depths 150-300cm
46
Figure 29: Computerized core log of 12B
47
Core
ID
Sample
Depth
(cm)
#10/
2.0mm
Screen
Sample
Weight
(g)
#14/
1.40mm
Screen
Sample
Weight
(g)
#18/
1.00mm
Screen
Sample
Weight
(g)
#25/
710μm
Screen
Sample
Weight
(g)
#35/
500μm
Screen
Sample
Weight
(g)
#45/
355μm
Screen
Sample
Weight
(g)
#60/
250μm
Screen
Sample
Weight
(g)
#80/
180μm
Screen
Sample
Weight
(g)
#125/
125μm
Screen
Sample
Weight
(g)
#170/
90μm
Screen
Sample
Weight
(g)
#200/
75μm
Screen
Sample
Weight
(g)
#230/
63μm
Screen
Sample
Weight
(g)
12B 1-10
1.02
0.95
0.74 0.52 0.25 0.28 0.40 0.68 3.04 48.12 24.56 7.24
12B 81-90
0.53
0.45
0.38 0.34 0.16 0.20 0.39 1.34 7.11 54.76 19.68 6.31
12B 91-100
1.47
0.30
0.22 0.21 0.14 0.10 0.27 1.34 7.13 47.72 18.27 7.76
12B
101-110
13.80
3.45
12B
115-120
0.11
0.23
12B
121-127
1.95
0.56
12B 127-130
0.00
0.01
0.03 0.04 0.02 0.04 0.13 0.36 2.58 29.64 15.39 12.91
12B 131-140
0.00
0.02
0.00 0.02 0.02 0.03 0.05 0.19 3.31 40.47 16.70 12.03
12B 191-200
0.50
0.27
0.19 0.01 0.07 0.09 0.15 0.34 8.16 48.43 10.78 6.90
12B
201-210
4.10
0.50
12B
231-240
36.38
4.19
Table 17: RO-TAP data for core 12B
48
ASTM
Classification
coarse
sand
medium
sand
medium
sand
medium
sand
medium
sand
fine
sand
fine
sand
fine
sand
fine
sand
fine
sand
fine
sand silt
Wentworth
Classification
granule
very
coarse
sand
very
coarse
sand
coarse
sand
coarse
sand
medium
sand
fine
sand
fine
sand
fine
sand
very
fine
sand
very
fine
sand
very fine
silt
Core ID
Sample
Depth
(cm)
%
finer
than
N10/
2.0mm/
-1.0Φ
Screen
% finer
than
N14/
1.40mm
/ -0.5Φ
Screen
% finer
than
N18/
1.00mm/
0.0Φ
Screen
% finer
than
N25/
710μm
/ 0.5Φ
Screen
% finer
than
N35/
500μm/
1.0Φ
Screen
% finer
than
N45/
355μm
/ 1.5Φ
Screen
% finer
than
N60/
250μm
2.0Φ
Screen
% finer
than
N80/
180μm/
2.5 Φ
Screen
% finer
than
N125/
125μm/
3.0Φ
Screen
% finer
than
N170/
90μm /
3.5Φ
Screen
% finer
than
N200/
75μm /
4.0Φ
Screen
% finer
than
4μm/ 8Φ
Observed
Contents of
the sample
shell
only
shell
only
shell
only
shell
only
shell
only
shell
only
shell
only sand sand sand sand
silt
12B
1-10
98.9
97.9
97.1 96.5 96.3 96.0 95.5 94.8
91.5 39.8 13.5
3.7
12B
81-90
99.5
99.0
98.6 98.3 98.1 97.9 97.5 96.1
88.9 32.8 12.7
4.6
12B
91-100
98.9
98.7
98.5 98.3 98.2 98.2 98.0 97.0
91.6 55.7 41.9
20.4
12B
101-110
71.7
47.4
12B
115-120
99.6
79.8
12B
121-127
92.9
76.2
12B
127-130
100.0 100.0 100.0 99.9 99.9 99.8 99.7 99.3
96.3 61.7 43.8
13.2
12B
131-140
100.0 100.0 100.0 100.0 99.9 99.9 99.8 99.6
95.8 48.9 29.6
3.7
12B
191-200
99.4
99.1
98.8 98.8 98.7 98.6 98.4 98.0
88.1 29.3 16.3
3.9
12B
201-210
82.9
62.7
12B
231-240
36.3
20.2
Table 18: Percent Sediment passing through RO-TAP screens for 12B
49
Core ID
Sample Depth (cm)
shell weight
200+ weight
200-230 weight
sand + shell
12B 1-10
3.76
76.80
7.24
80.56
12B 81-90
2.06
83.28
6.31
85.34
12B 91-100
2.44
74.73
7.76
77.17
12B 101-110
13.80
3.45
13.80
12B 115-120
0.11
0.23
0.11
12B 121-127
1.95
0.56
1.95
12B 127-130
0.14
48.10
12.91
48.24
12B 131-140
0.09
60.72
12.03
60.81
12B 191-200
1.13
67.86
6.90
68.99
12B 201-210
4.10
0.50
4.10
12B 231-240
36.38
4.19
36.38
Table 19: Shell and Sand weights for core 12B
Core ID
sample id
mid sample
depth
% shell
% sand