I
I
Appendix B contains discussions of analytical procedures used in our engineering analyses. Appendix C
contains a positioning report by Fugro Chance, Inc.,
of Lafayette, Louisiana.
For the purposes
of discussion and presentation, "driven pipe pile" is used in this report to represent
foundation piles, caissons and conductors, unless otherwise specified.
2.2 FIELD AND LABORATORY INVESTIGATIONS
The field investigation was performed
on June 26 through 28, 2008, from the RN
Seaprobe.
The
soil conditions were determined by performing four exploratory borings, two at each SPM location with one
boring at a selected anchor leg location, and one boring at the proposed PLET location. Enterprise Field
Services selected the boring locations. These borings were drilled to a penetration of 131-ft below mudline.
The water depths
at the boring locations ranged from 110 to 113 It. A chronological summary of field
operations is presented
in Appendix A.
2.2.1
Exploratory Borings
FMMG personnel drilled the soil borings with a DMX drill rig positioned over the centerwell of the
RN
Seaprobe.
The vessel was anchored at the boring location by a 4-point mooring system.
Soil
conditions
at the site were explored by drilling a group of four soil borings to 131-ft penetration below the
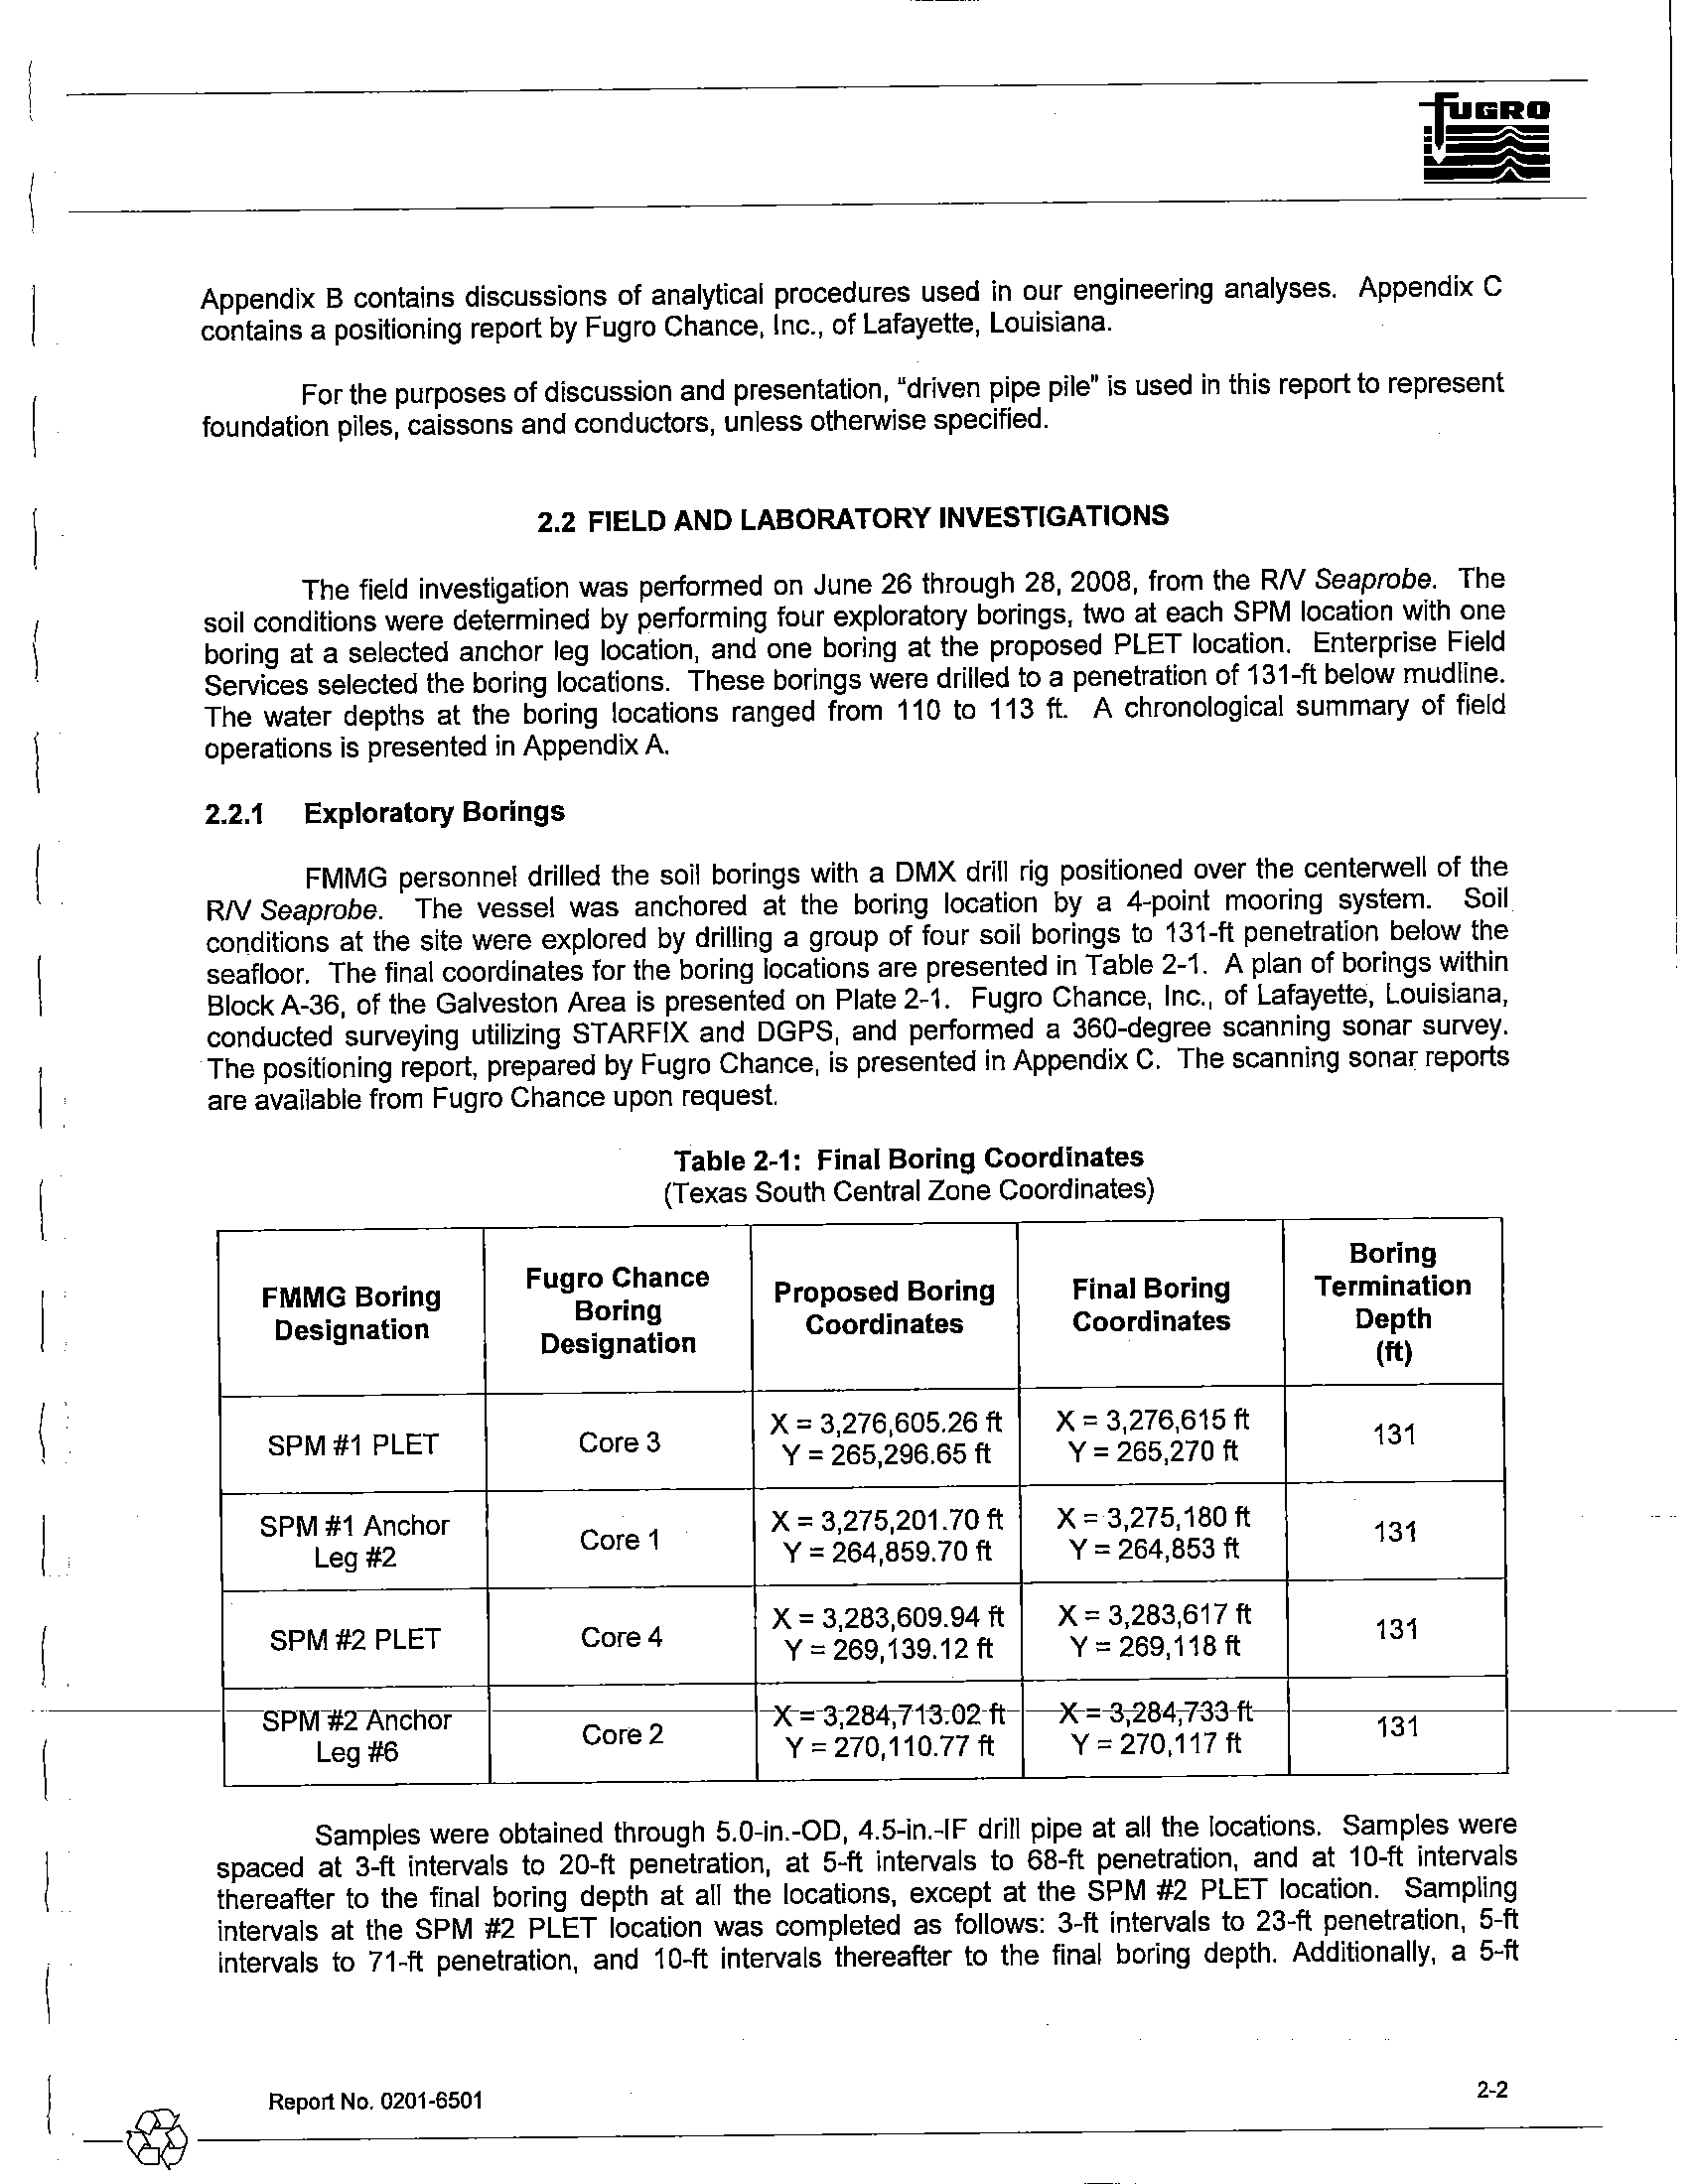
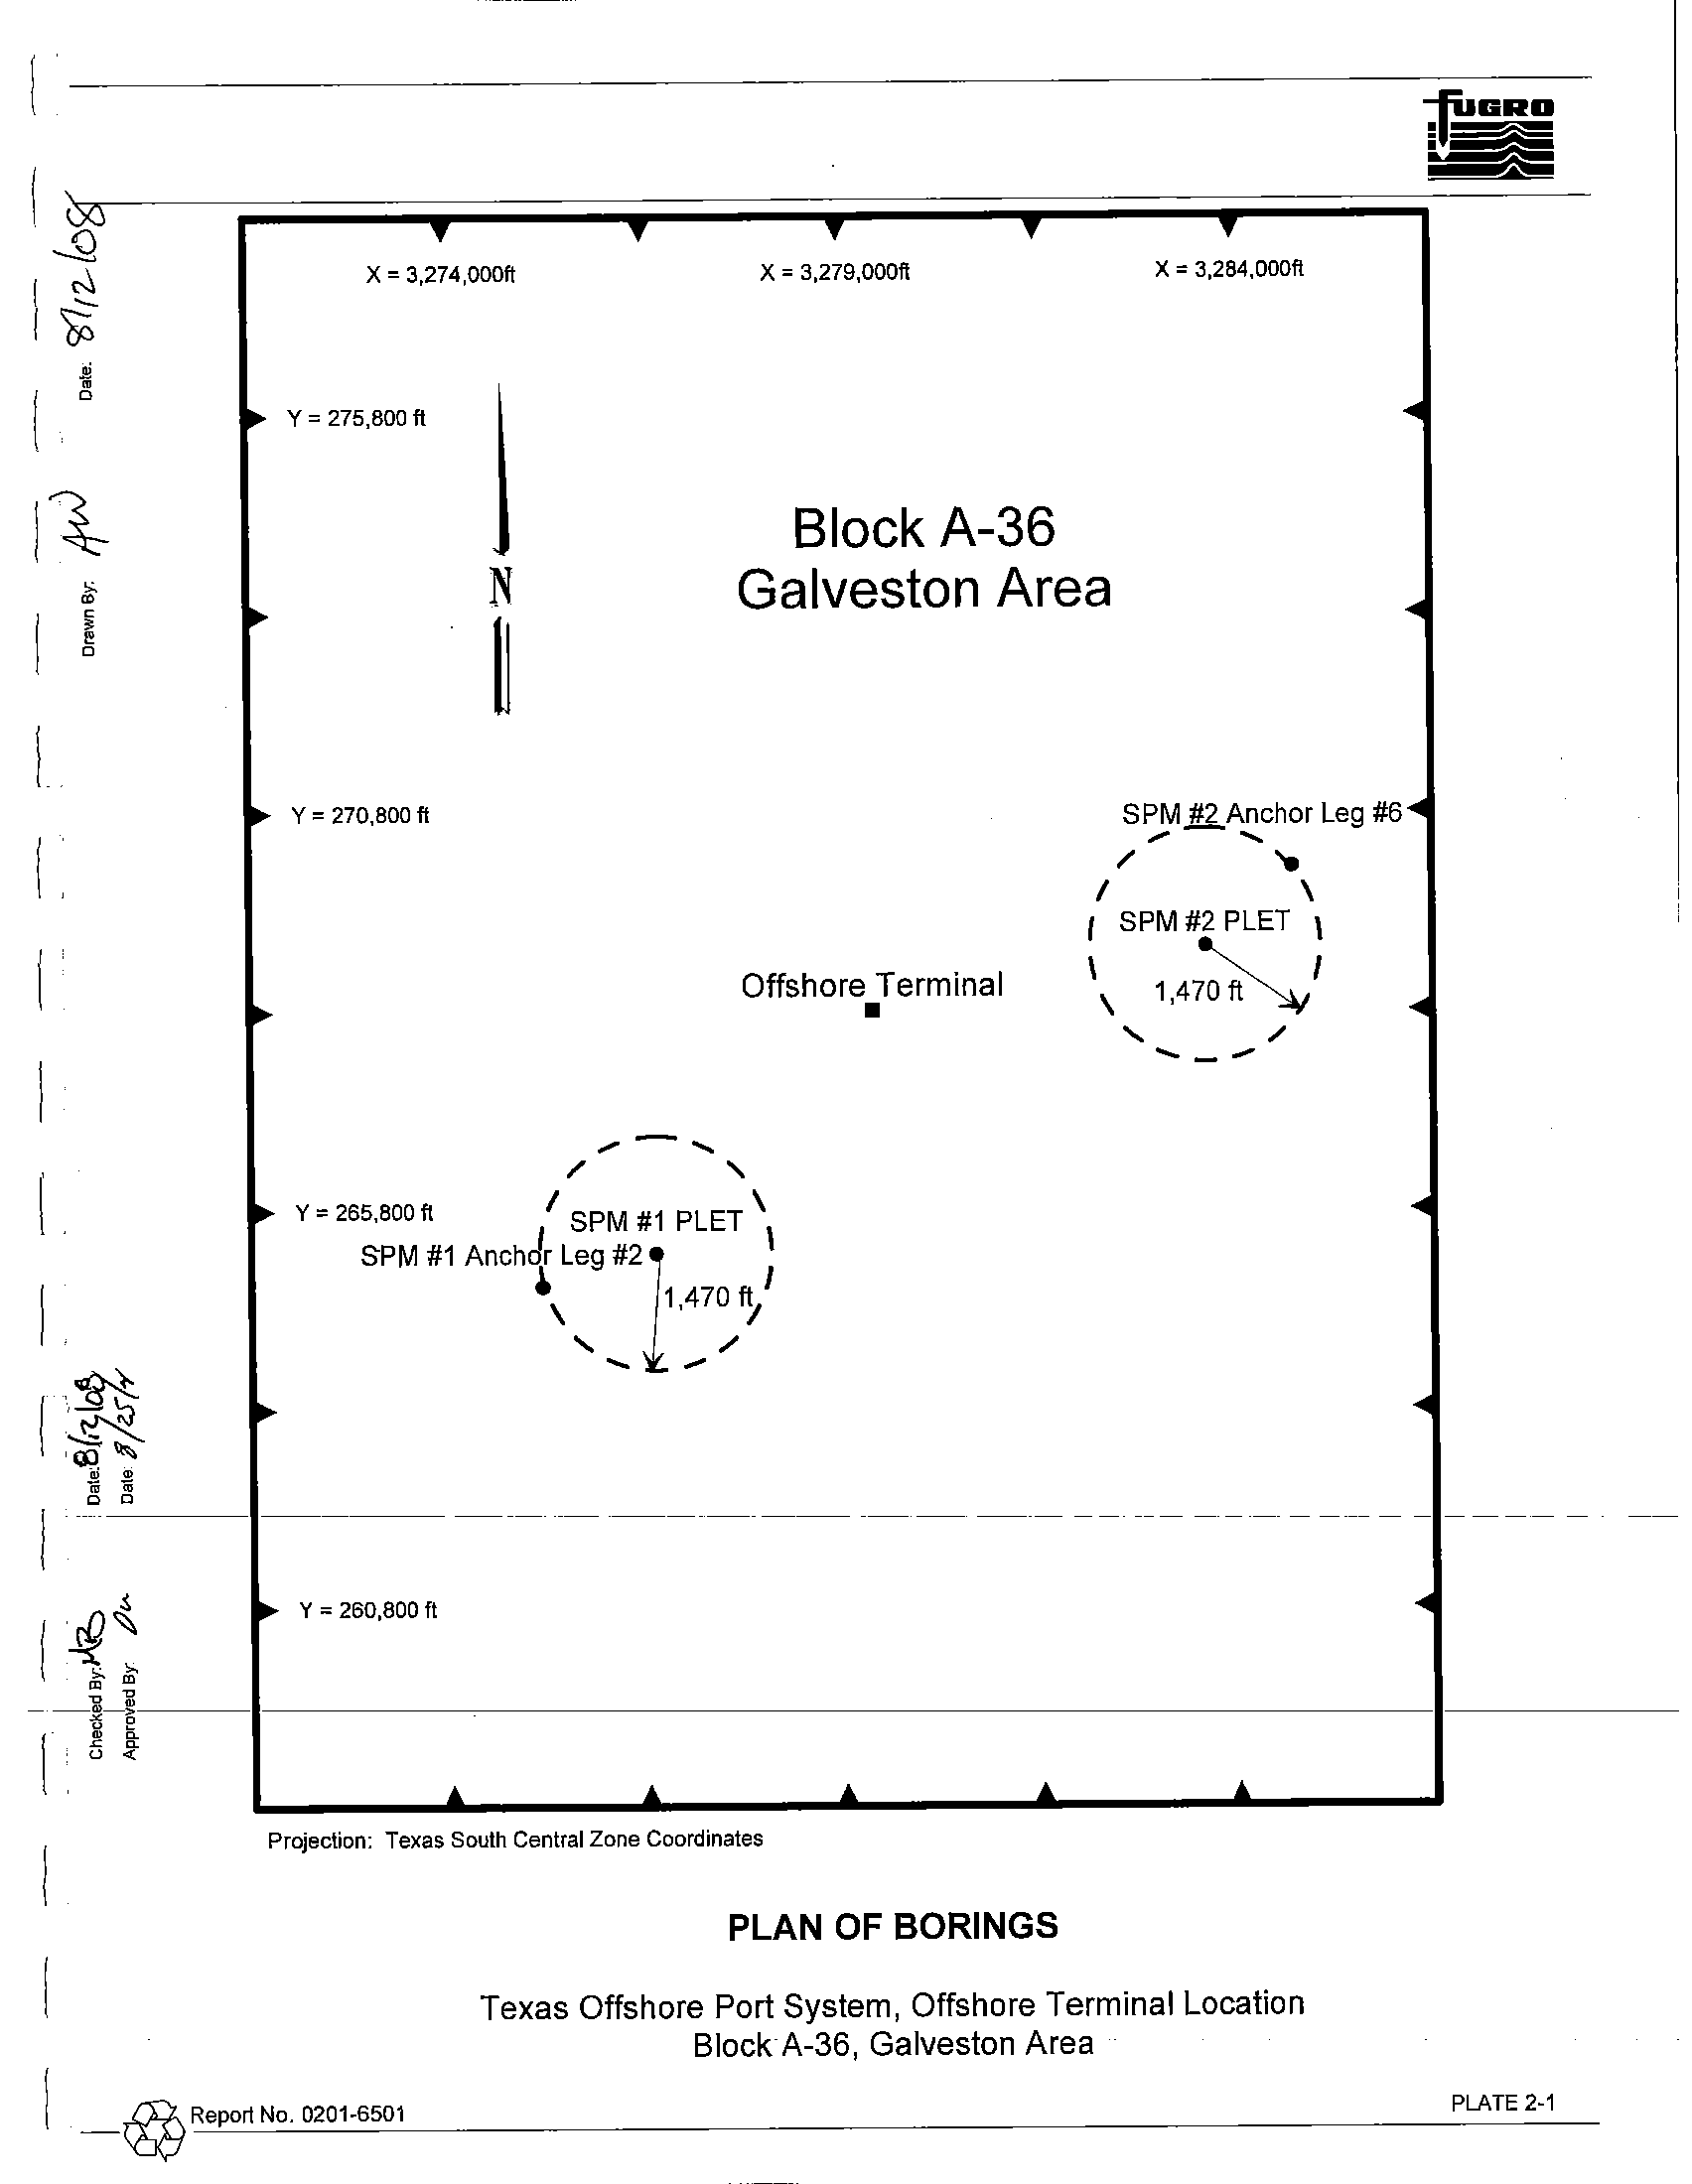
seafloor. The final coordinates
for the boring locations are presented in Table 2-1. A plan of borings within
BlockA-36, of the Galveston Area is presented on Plate 2-1. Fugro Chance, Inc., of Lafayette, Louisiana,
conducted surveying utilizing STARFIX and DGPS, and performed a 360-degree scanning sonar survey.
The positioning report, prepared by Fugro Chance, is presented in Appendix
C. The scanning sonar reports
are available from Fugro Chance upon request.
FMMG
Boring
Designation
SPM #1 PLET
SPM
#1 Anchor
Leg #2
SPM#2 PLET
SPM-#TAncnor
Leg
#6
Table 2-1: Final Boring Coordinates
(Texas South Central Zone Coordinates)
Fugro Chance
Boring
Proposed Boring
Final Boring
Designation
Coordinates
Coordinates
Core 3
X = 3,276,605.26 ft
X = 3,276,615 ft
Y = 265,296.65 ft
Y = 265,270 ft
Core 1
X = 3,275,201.70 ft
X = 3,275,180 ft
Y = 264,859.70 ft
Y
=
264,853 ft
Core 4
X = 3,283,609.94 ft
X = 3,283,617 ft
Y
=
269,139.12 ft
Y = 269,118 ft
Core 2
X-=-3;284~7t3:02-ft-
-X-=-3;-284;-7-33-ft
Y = 270,110.77 ft
Y = 270,117 ft
Boring
Termination
Depth
(ft)
131
131
131
131
Samples were obtained through 5.0-in.-OD, 4.5-in.-IF drill pipe at all the locations. Samples were
spaced
at 3-ft intervals to 20-ft penetration, at 5-ft intervals to 68-ft penetration, and at 10-ft intervals
thereafter to the final boring depth at all the locations, except at the SPM #2 PLET location. Sampling
intervals at the SPM #2 PLET location was completed as follows: 3-ft intervals to 23-ft penetration, 5-ft
intervals to 71-ft penetration, and 10-ft intervals thereafter to the final boring depth. Additionally, a 5-ft
I
_~
____
R_ep_o_rt_N_O._O_20_1_-6_50_1____________________________
2_~
____
I
shallow boring, designated as Core 4A by Fugro Chance, was drilled at the SPM #2 PLET location to allow
re-sampling. The drilling and sampling techniques used to complete these borings are explained
in detail in
Appendix A.
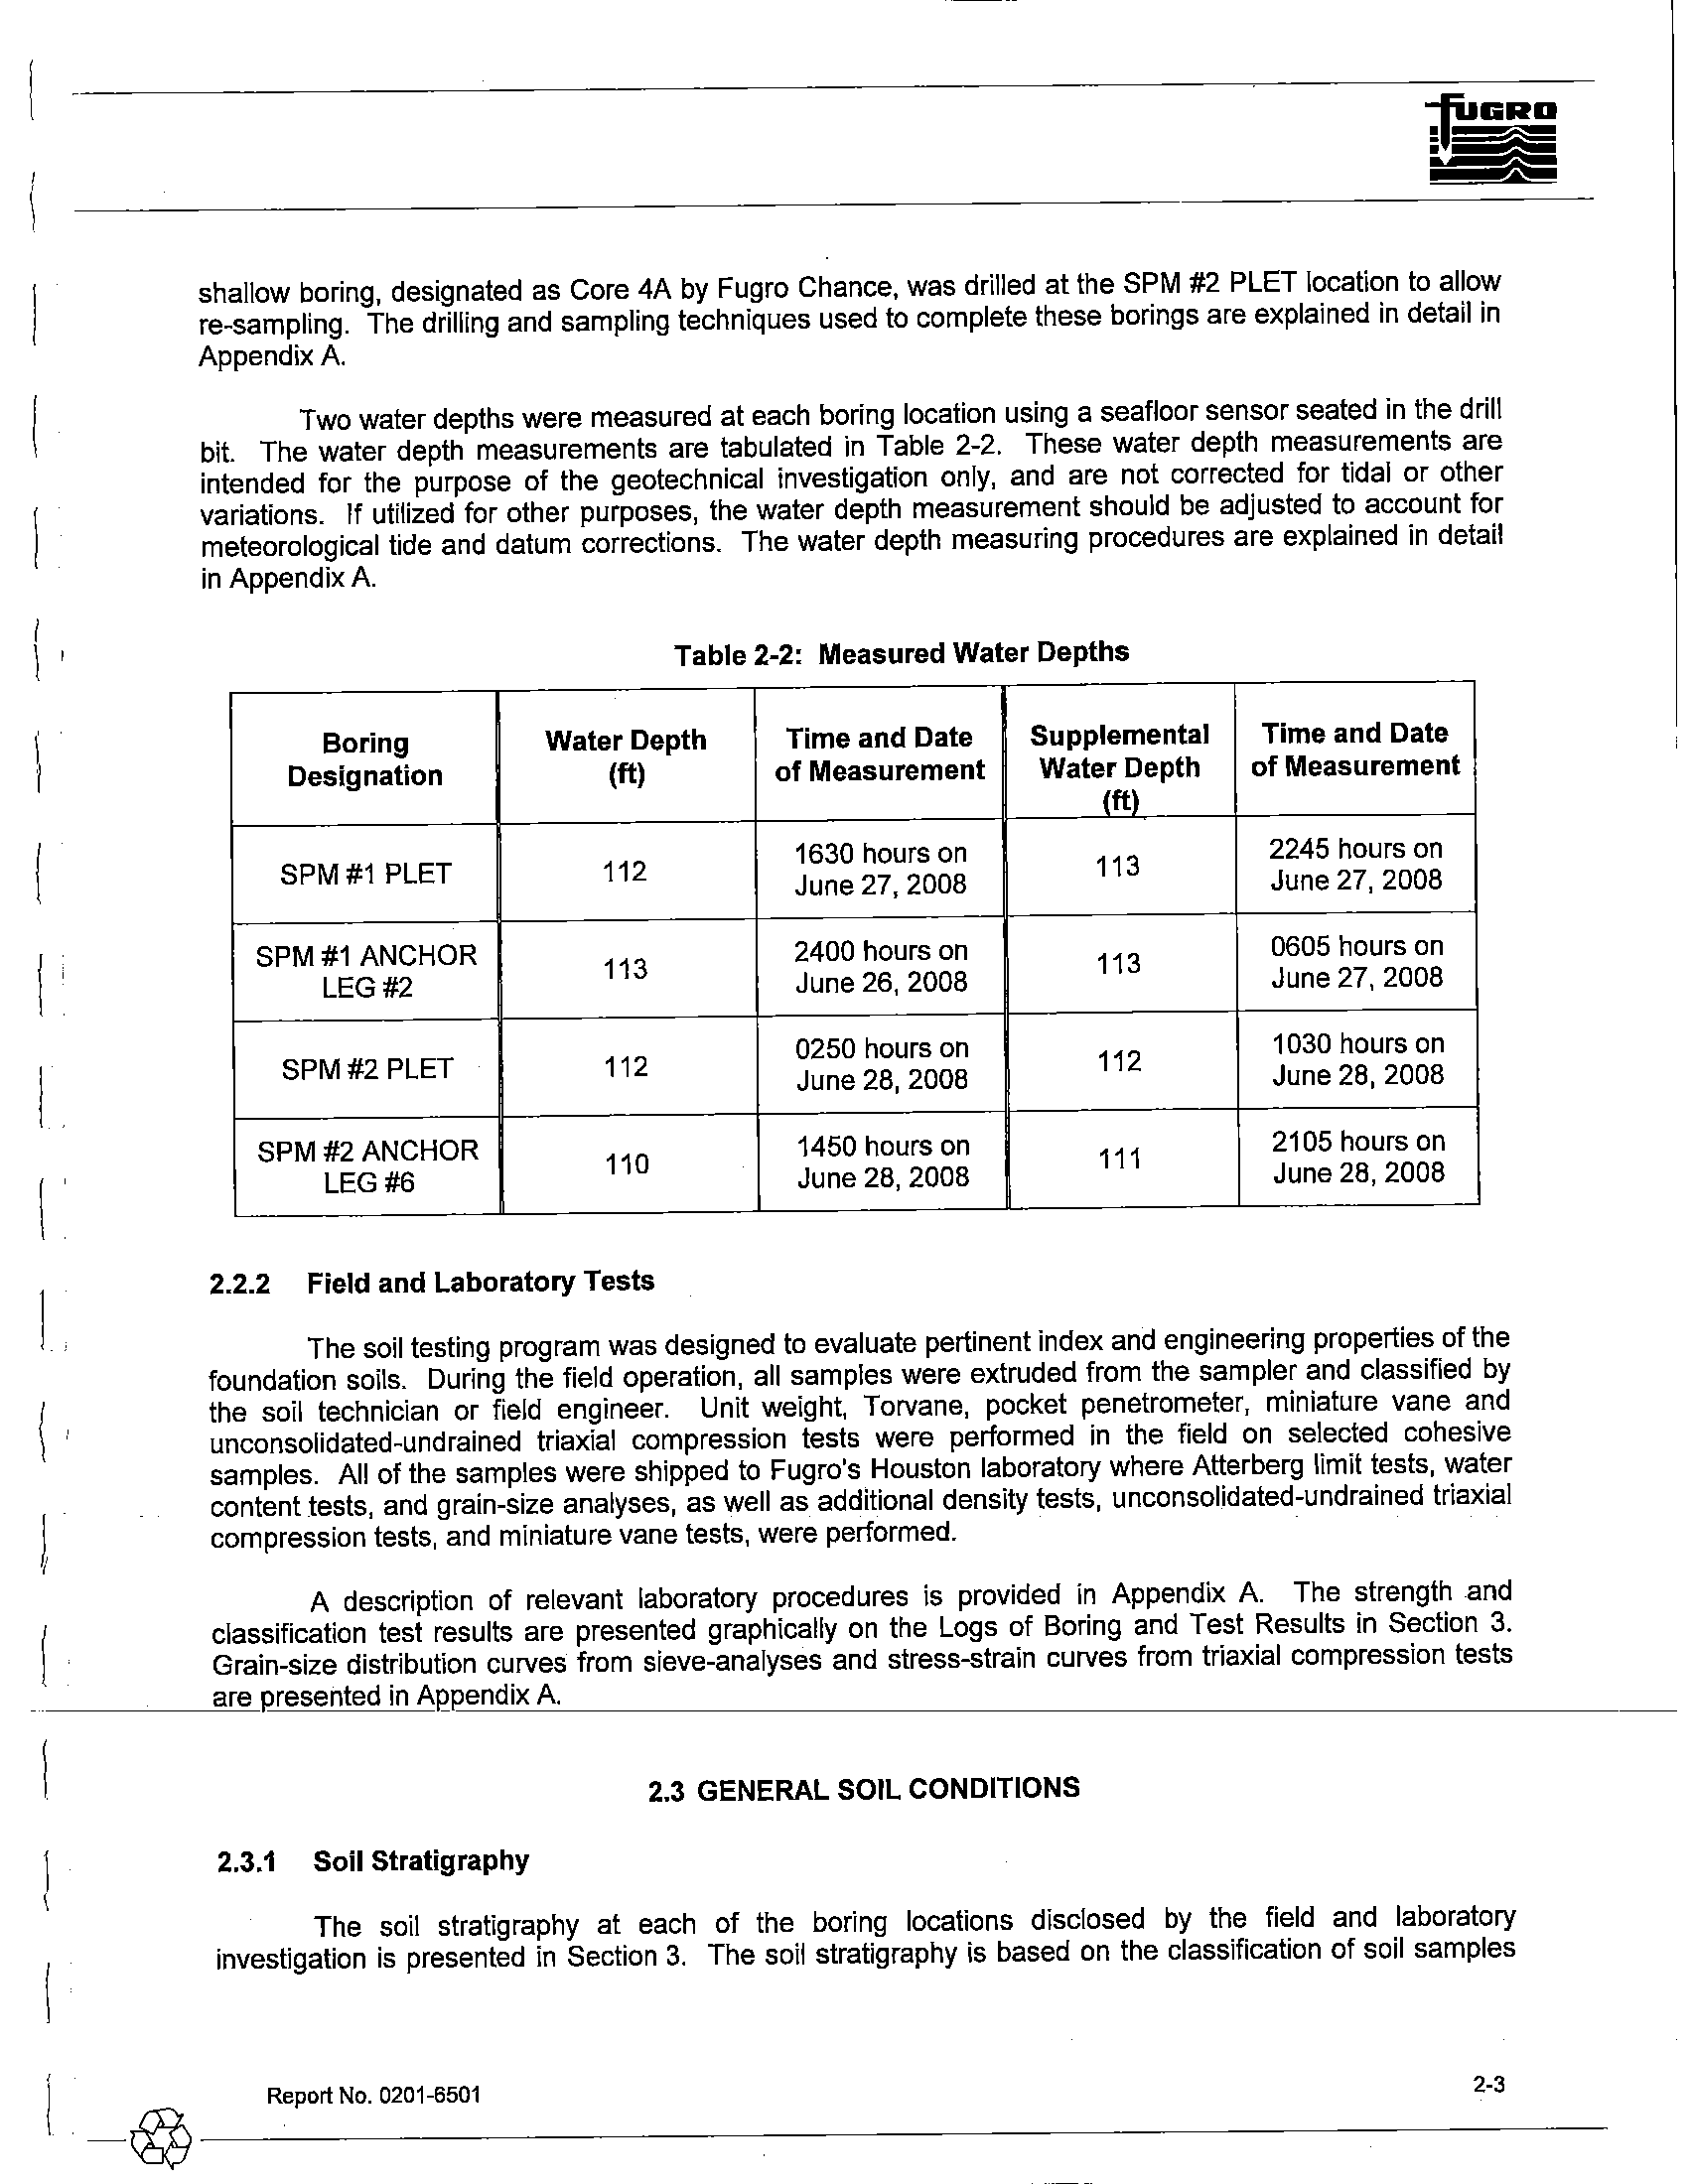
Two water depths were measured at each boring location using a seafloor sensor seated in the drill
bit. The water depth measurements are tabulated in Table 2-2. These water depth measurements are
intended for the purpose
of the geotechnical investigation only, and are not corrected for tidal or other
variations.
If utilized for other purposes, the water depth measurement should be adjusted to account for
meteorological tide and datum corrections. The water depth measuring procedures are explained in detail
in Appendix A.
\ '
Table 2-2: Measured Water Depths
Boring
Water Depth
Time and Date
Supplemental
Time and Date
Designation
(ft)
of Measurement
Water Depth
of Measurement
(ft)
SPM#1 PLET
112
1630 hours on
113
2245 hours on
June 27,2008
June 27, 2008
SPM
#1 ANCHOR
113
2400 hours on
113
0605 hours
on
LEG #2
June 26, 2008
June 27, 2008
SPM#2 PLET
112
0250 hours
on
112
1030 hours
on
June 28, 2008
June 28, 2008
SPM #2 ANCHOR
110
1450 hours on
111
2105 hours on
LEG #6
June 28, 2008
June 28, 2008
2.2.2 Field and
Laboratory Tests
The soil testing program was designed to evaluate pertinent index and engineering properties of the
foundation soils. During the field operation, all samples were extruded from the sampler and classified by
the soil technician or field engineer.
Unit weight, Torvane, pocket penetrometer, miniature vane and
unconsolidated-undrained triaxial compression tests were performed
in the field on selected cohesive
samples. All
of the samples were shipped to Fugro's Houston laboratory where Atterberg limit tests, water
content tests, and grain-size analyses, as well as additional density tests, unconsolidated-undrained triaxial
compression tests, and miniature vane tests, were performed.
A description
of relevant laboratory procedures is provided in Appendix A. The strength and
classification test results are presented graphically
on the Logs of Boring and Test Results in Section 3.
Grain-Size distribution curves from sieve-analyses and stress-strain curves from triaxial compression tests
____--'a"re
___llresented in
AflP~e~n~d~ix~A~.
______________________________
2.3 GENERAL SOIL CONDITIONS
2.3.1
Soil Stratigraphy
The soil stratigraphy at each of the boring locations disclosed by the field and laboratory
investigation
is presented in Section 3. The soil stratigraphy is based on the classification of soil samples
I __
~
___
R_ep_o_rt_N_O_.O_2_01_-_65_0_1______________________________2_.3_____
~
(
D
11-
I
l
1
~
(~:
...
x =
3,274,000«
~
Y =
275,800
It
N
~
...
X
=
3,279,000ft
Block A-36
Galveston Area
...
X
=
3,284,000ft
~
Y =
270,800
It
SPM.!2,.Anchor Leg #6'"
-
.....
Offshore
•
Terminal
/
,
~
Y =
265,800
It
I
SPM #1 PLET \
SPM
#1 Anchclr Leg
#21
\
•
I
\
1,470f!,
"
/
....
-
~
Y =
260,800
It
,.
.....
/
'e
I
\
...
I SPM #2 PLET \
\
1,47~1
"
.... _-
"
...
~
m
~
1l
---~-~------I---------~~----------------------------------------------I-----------
Ii!
15..
u
~
«
~
Projection: Texas South Central Zone Coordinates
__@
Report No.
0201-6501
PLAN OF BORINGS
Texas Offshore Port System, Offshore Terminal Location
BlockA-36, Galveston Area
PLATE
2-1
TERMS AND SYMBOLS USED ON BORING LOG
SOIL TYPES
SAMPLER TYPES
[]Sand
m
Sill
~Clay
~GraVel
~Debris
~Liner
~In
Silu
o:Iog
o
••
~Thin-
...
..•
Walled
Test
~coral
Tube
m
SillY
mSandY
~SandY
~peator
• Sand
. Sill
. Clay
Highly
Organic
I
~
[
J;
j
Sand
~Clayey
mClayey
Silt
mSillY
Clay
I
Rock
~PiSlon
v.,.v
Shell
~ROCk
~NO
"
Core
Recovery
"
"
I
SOIL GRAIN SIZE
u.s. STANDARD SIEVE
J"
314"
4
10
40
200
COBBLES
GRAVEL
SAND
SILT
COARSE
FINE
COARSE
MEDIUM
FINE
152
76.2
19.1
4.76
2.00
0.420
0.074
SOil GRAIN SIZE IN MILLIMETERS
STRENGTH OF COHESIVE SOILS(1)
Undrained
DENSITY OF GRANULAR SOILS
2•J
)
Consistency
Shear Strength,
Kips Per
89 Ft
Descriptive
*Relative
Term
Density,
%
Very Soft.................................................
less than 0.25
0.25100.50
Very Loose.................................................
less than 15
Soft............................................................
Loose................................ ,... .......................... 15 to 35
Firm................................................ ...........
0.5010 1.00
Medium Dense.................................................
351065
SliIL.........................................................
1.0010 2.00
Oense.............................................................
65 to 85
Very Sliff....................................................
2.00 to 4.00
Very Dense............................................
greater than
85
Hard..................................................",
greater than 4.00
*Estimated from sampler driving record
.Slickensided..........................
Fissured................................
Pocket. .................................
Parting.......................
Seam....................................
Layer....................................
Laminated.............................
SOIL STRUCTURE(1)
Having planes of weakness that appear slick and glossy. The degree of slickensidedness depends
upon the spacing
of slickensides and the ease of breaking along these planes.
Containing shrinkage
or relief cracks, often filled with fine sand or
sil~
usually more or less vertical.
Inclusion
of material of different texture that is smaller than the diameter of the sample.
InclusiOr1less
tfian'1/8 'iilch-ftlick extenCing-tIlrough-too-sample: -----
InclUsion
1/8
inch to 3 inches thick extending through the sample.
Inclusion greater than 3 inches
thick extending through the sample.
Soil
sample composed of alternating partings or seams of different soil types.
---~-~--------~~~~,-------------~~~~~~~~~~~~~~~~~~~~~Ch.~~-----------------------------
"C
"C
Interlayered...........................
Soil sample composed of alternating layers of different soil types.
x..
~
' 0
~
!
.:;:-
Intermixed.............................
Soil sample composed of pockets of different soil types and layered or laminated structure is not
evident.
Calcareous............................
REFERENCES:
(1) ASTM D 2488
(2) ASCE Manual
56 (1976)
(3)
ASTM D 2049
Having appreciable quantities of carbonate.
Information on each boring log is a compilation
of subsurface conditions and soil or rock
classifications obtained from the field as well as from laboratory testing
of samples. Strata have been
interpreted
by commonly accepted procedures. The stratum lines on the log may be transitional and
approximate in nature.
Water level measurements refer only to those observed at the times and
places indicated in the text, and
may vary with
tim~,
geologic condition or construction activity.
I
Report No.
0201-6501
-~---------------------------------
PLATE 2-2
'"
,.
."
Report No. 0201-6501
,
,
,
,
,
j
,
LINe
82212
»>
'.00
;;::
'00
,
,
N
.00
~
~
,.
-<'","~UNeS22H
,
,
,
~
<i.e.<UHE
S22trJ
il
li!
,
!il:
+,
,
,
+
+
-,
+
•
SPM#2 Anchor Leg #6
,
~
,
, ,I,
::-+--+---'-------"'4------ll.....----+--..::..------t"---...c-----'----+---..::.-----
+,L.--<;i(,dINESlP:M
l"A;Sr
.. SPM#2 PLET
l
'"
~~~~_~
____!_________
~~~--------JL--_t----l.....l.....---------~,,------------l--_t------!0---------4-2~~-
~
_u~s~~»~sr
+
.. SPM#1 PLET
,
,
,
•
J
+
+
SPM#1 Anchor Leg #2 ,
,
,
I
1
'"
+
,
,
,
,
,
.•
..
,
,
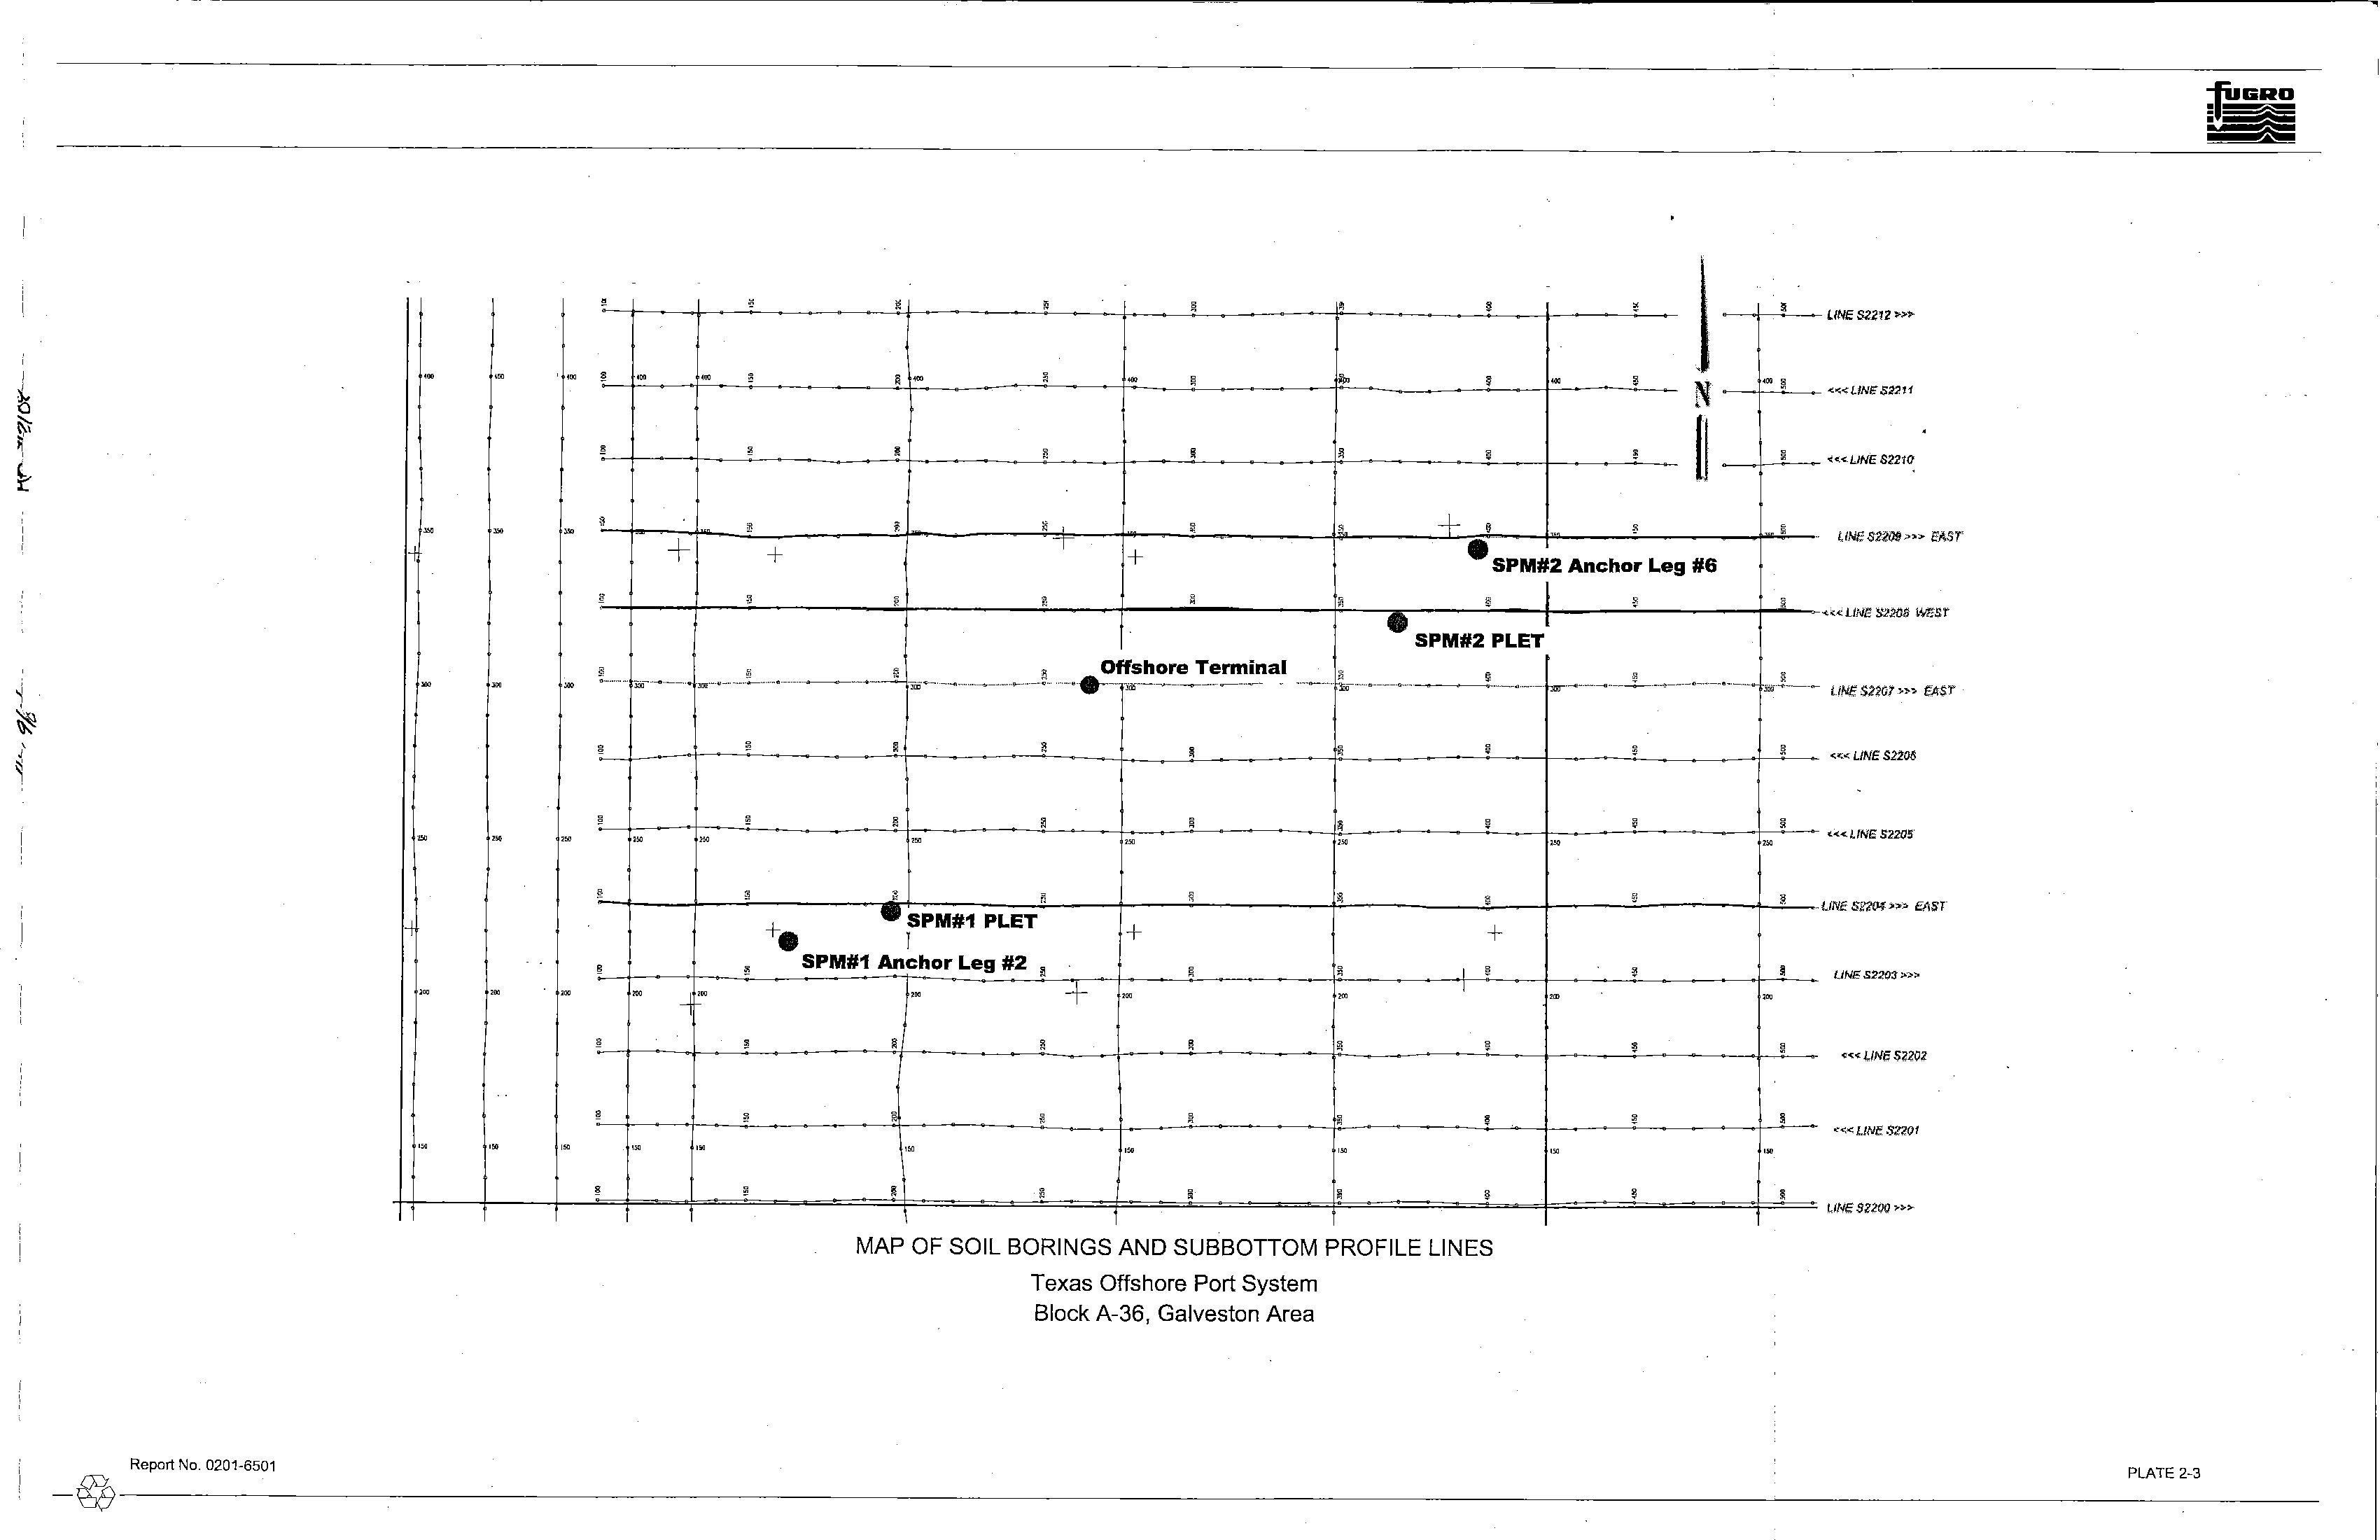
MAP OF SOIL BORINGS AND SUBBOTTOM PROFILE LINES
Texas Offshore Port System
Block A-36, Galveston Area
,
'"
,
,
....«
LINE .'5;,,'201
IJM~
$Z2Qt)
,..»
PLATE 2-3
-@-------------------------------------------------------------------------------
3
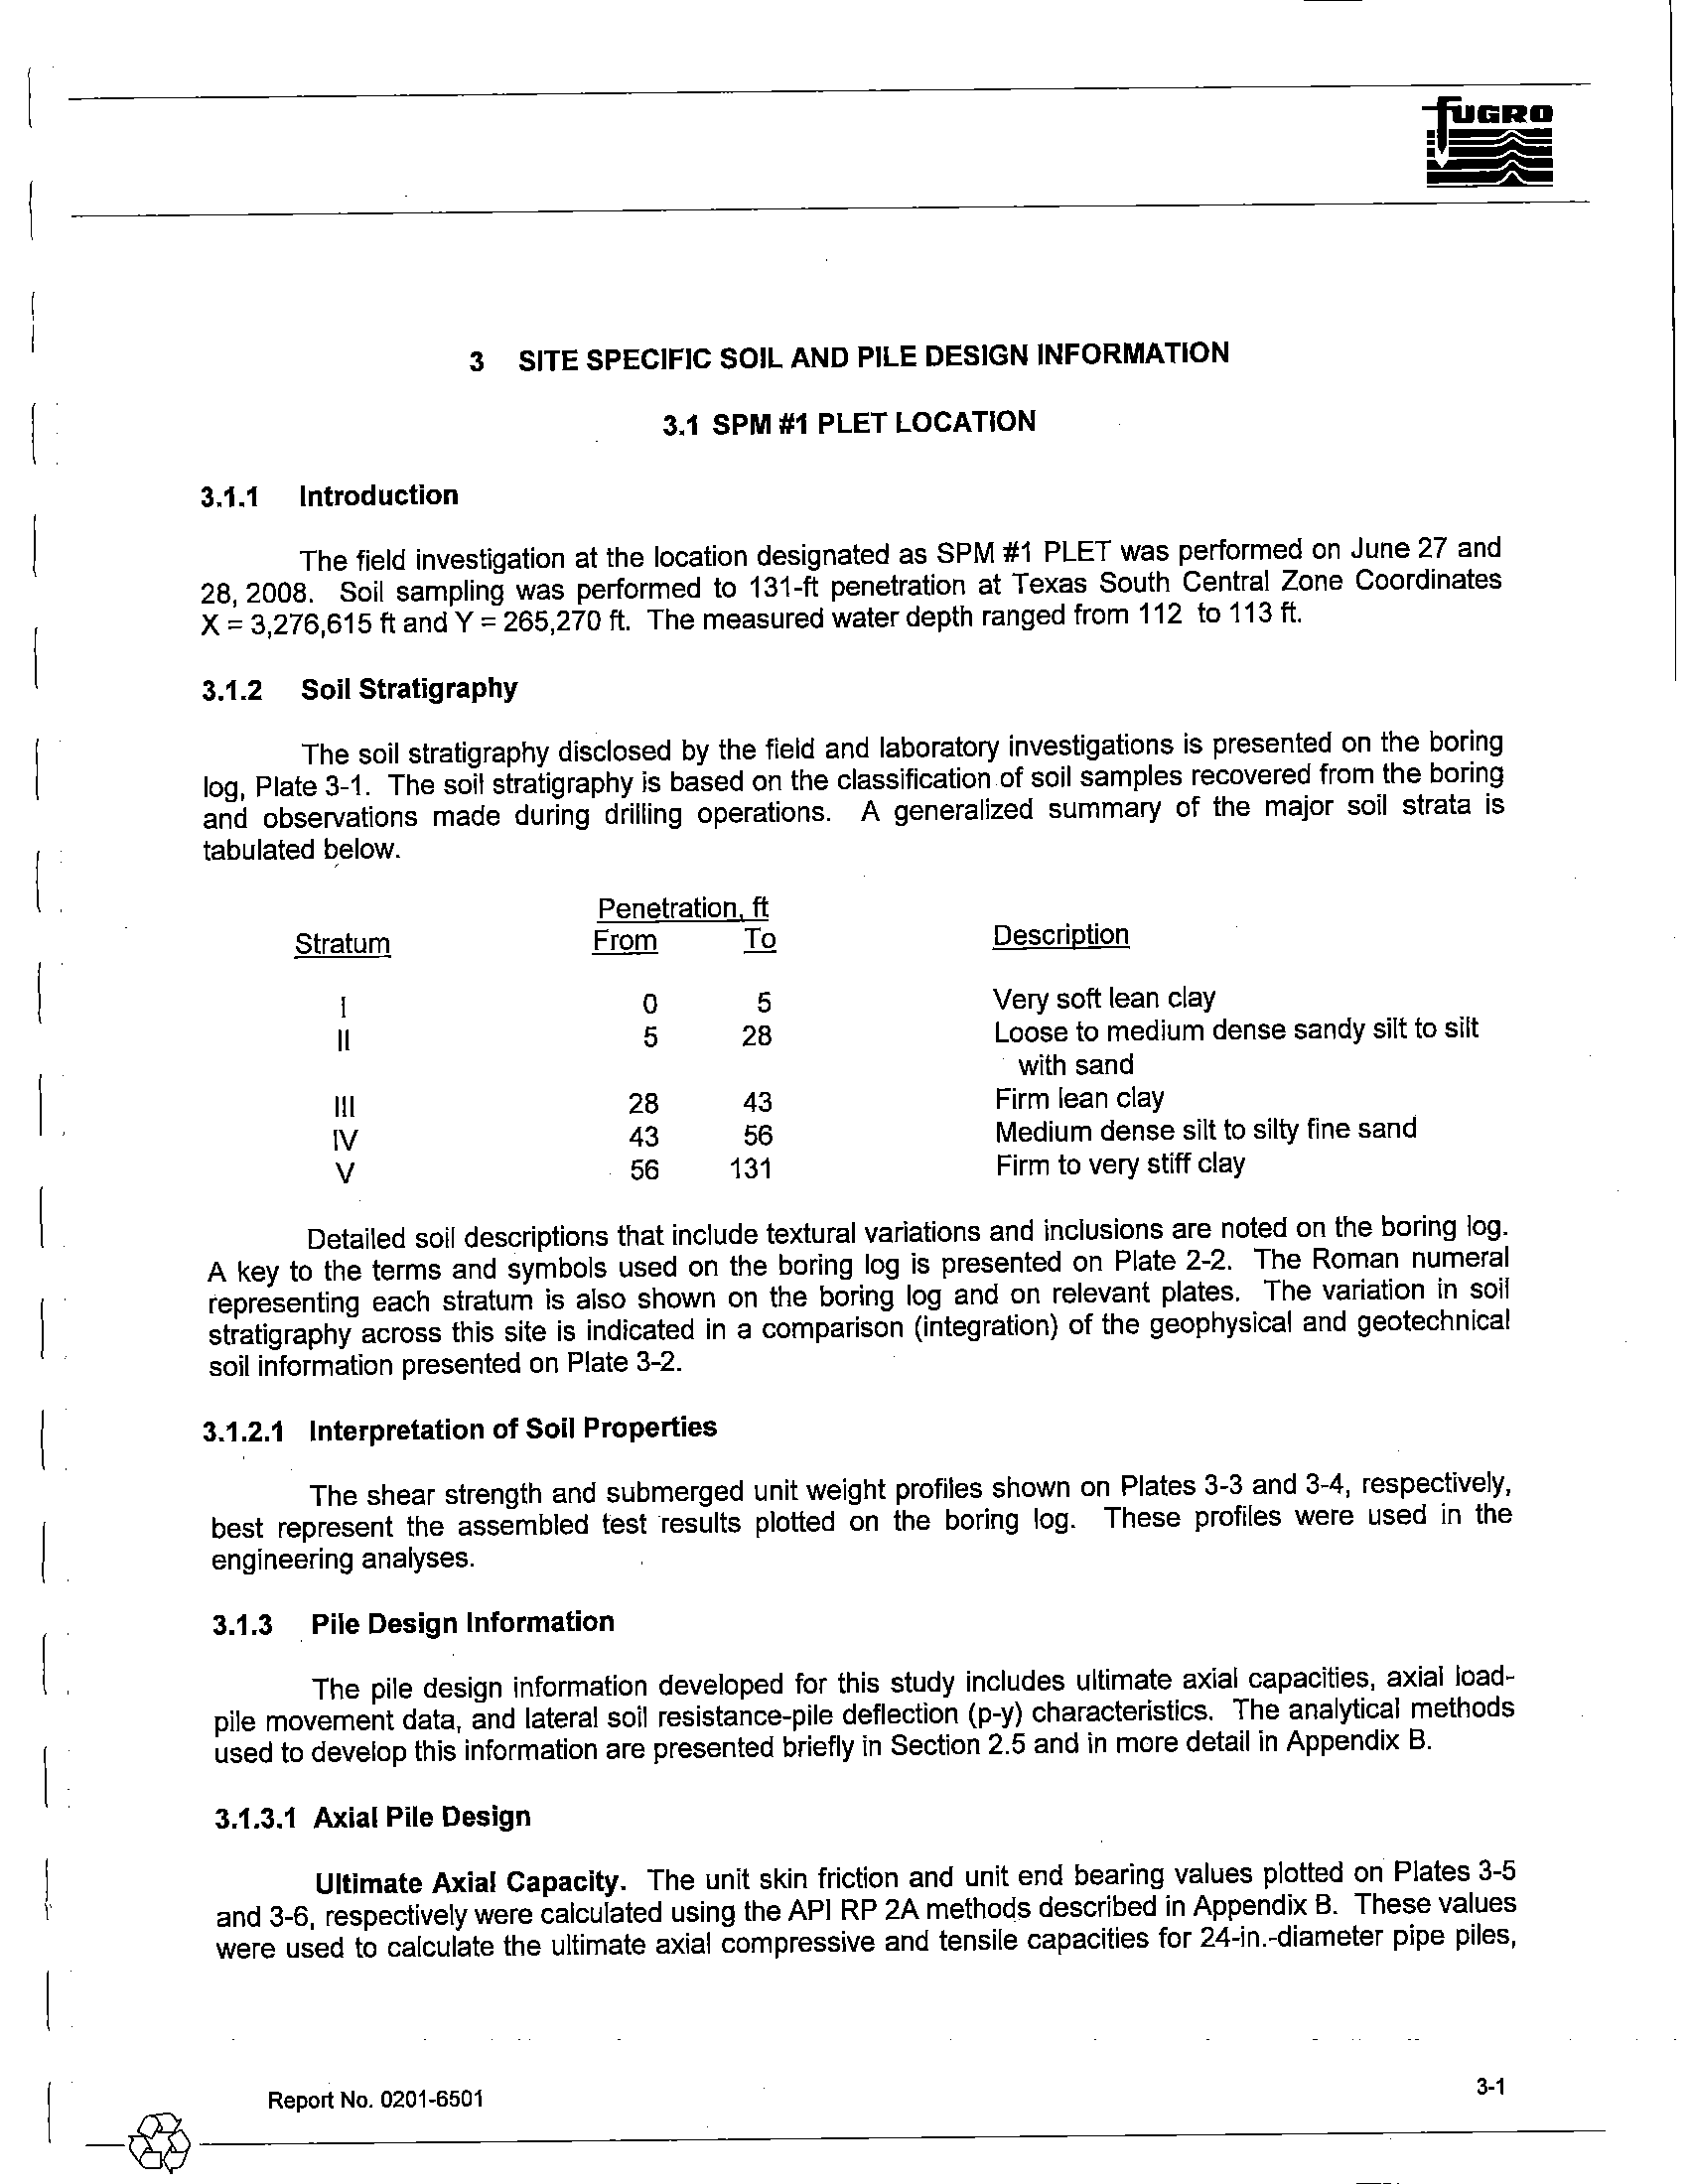
SITE SPECIFIC SOIL AND PILE DESIGN INFORMATION
3.1 SPM #1 PLET LOCATION
3.1.1
Introduction
The field investigation at the location designated as SPM #1 PLET was performed on June 27 and
28,2008. Soil sampling was performed to 131-ft penetration at Texas South Central Zone Coordinates
X
=
3,276,615 ft and Y
=
265,270 ft. The measured water depth ranged from 112 to 113 ft.
3.1.2
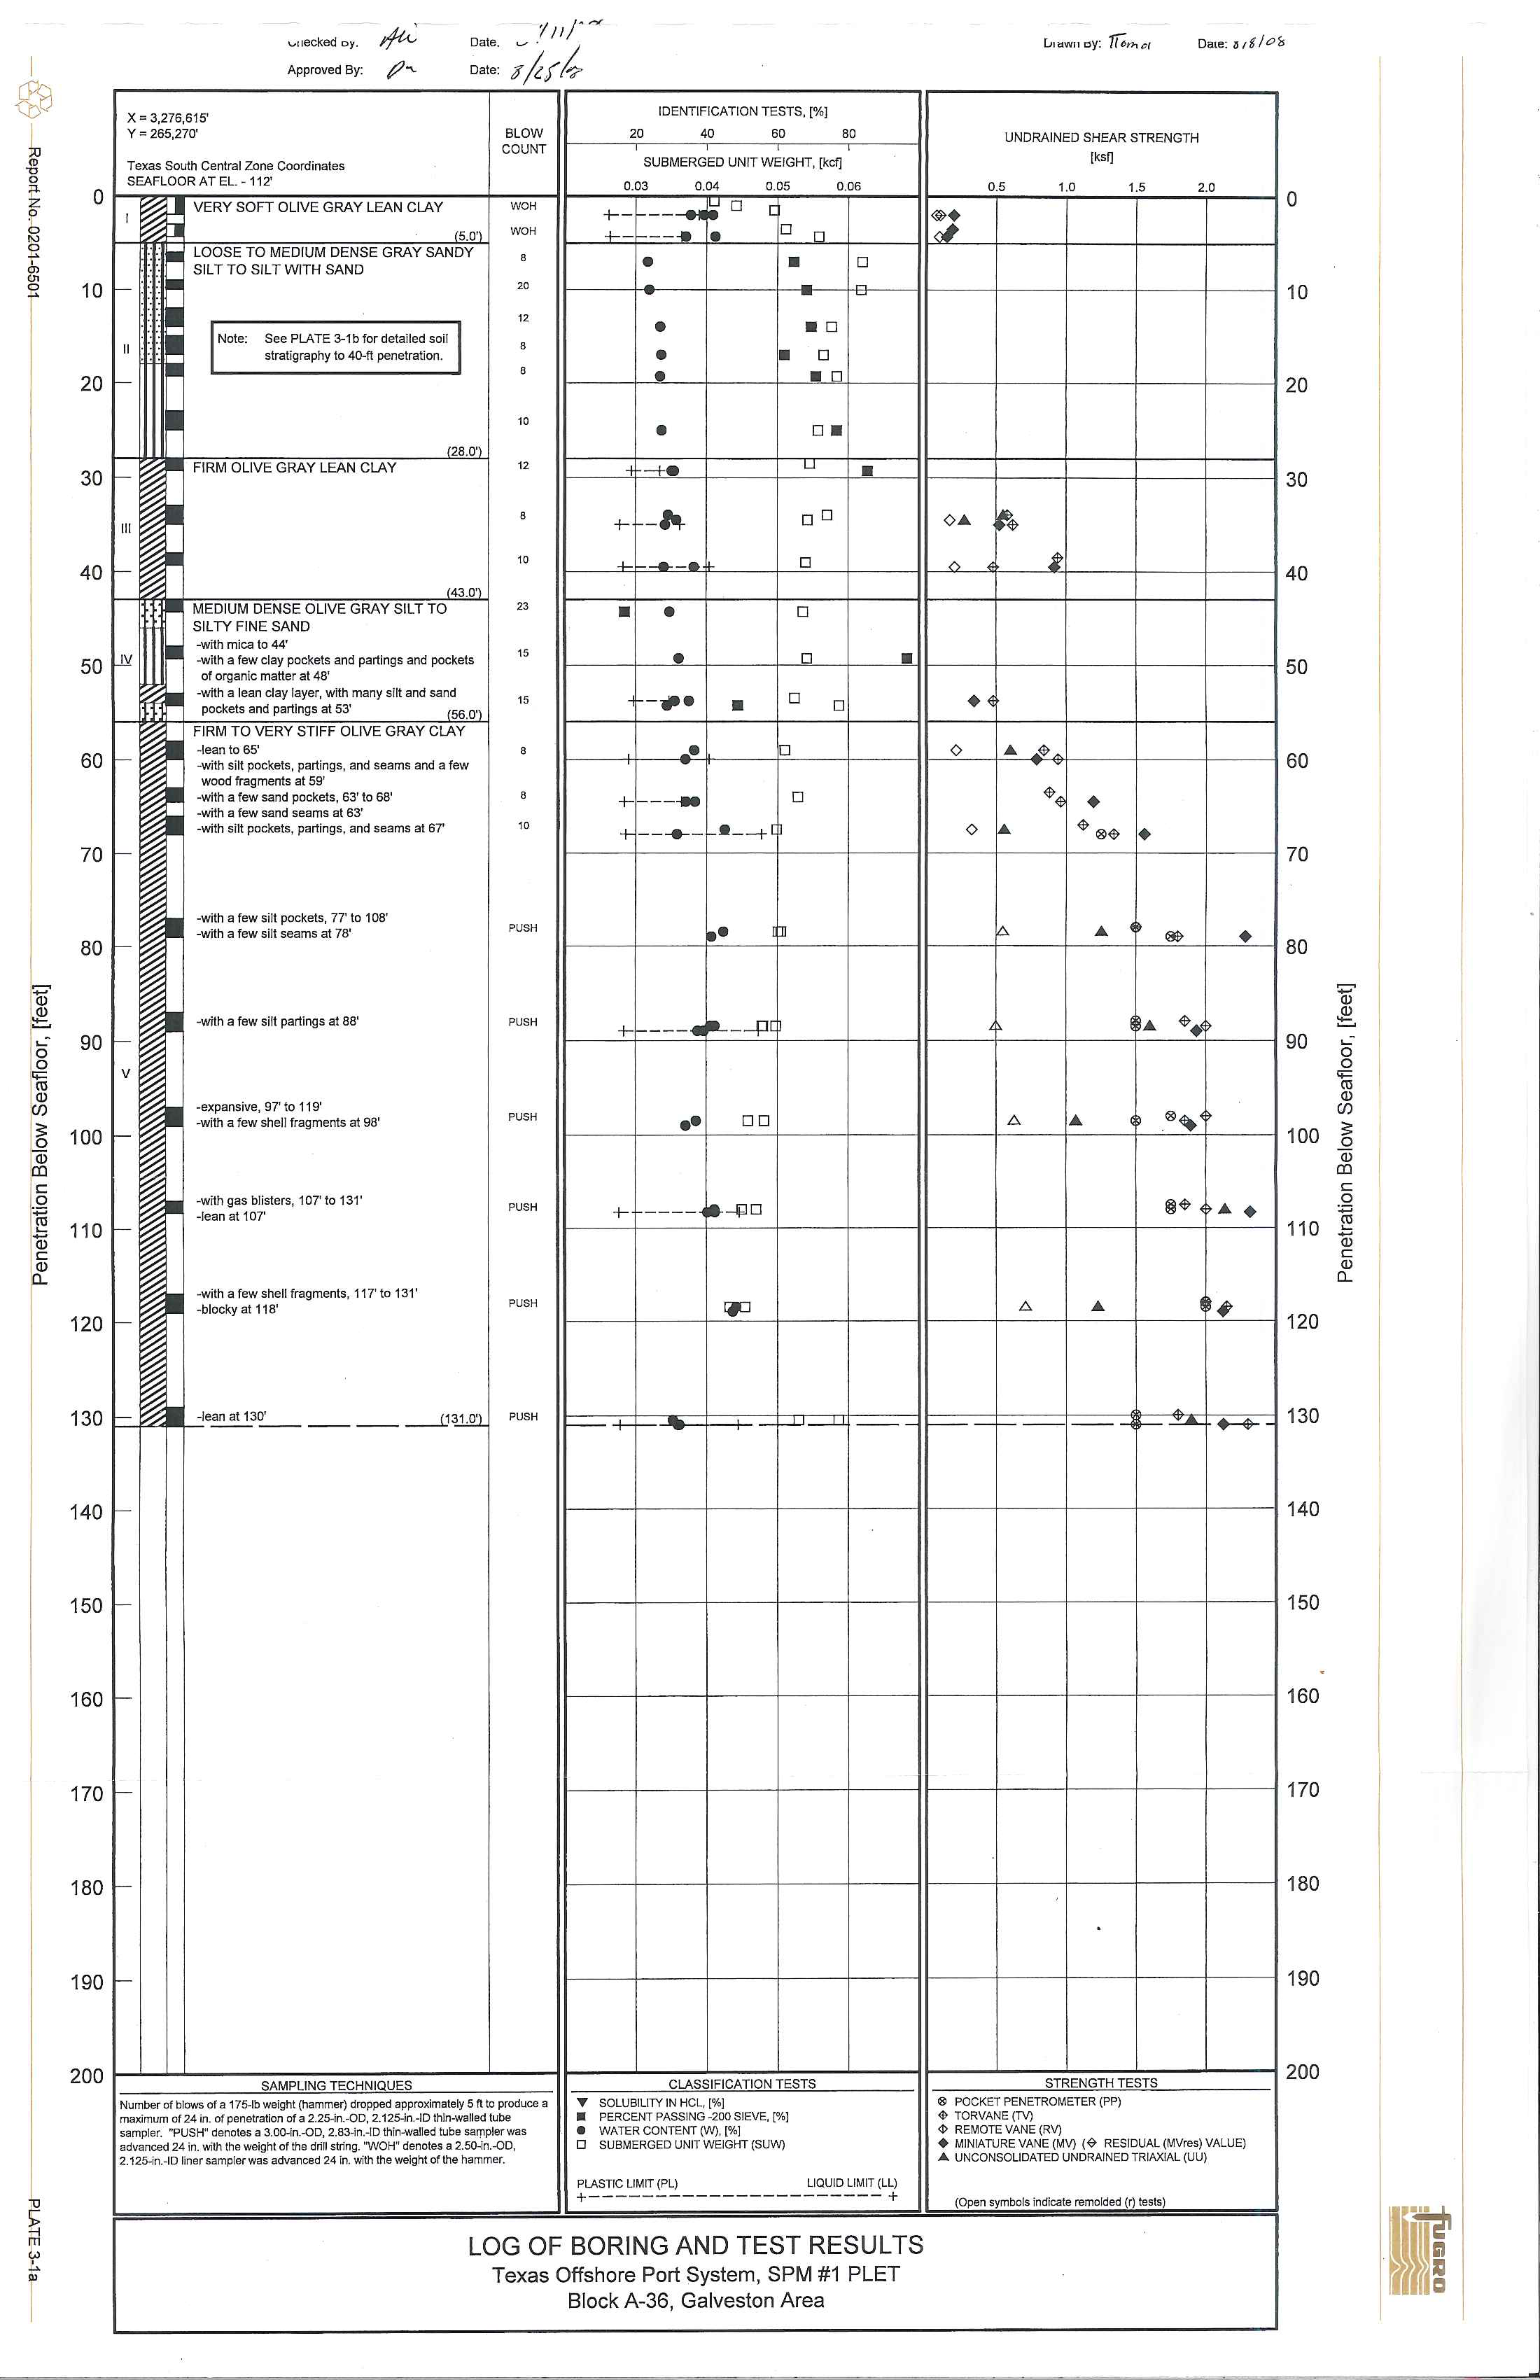
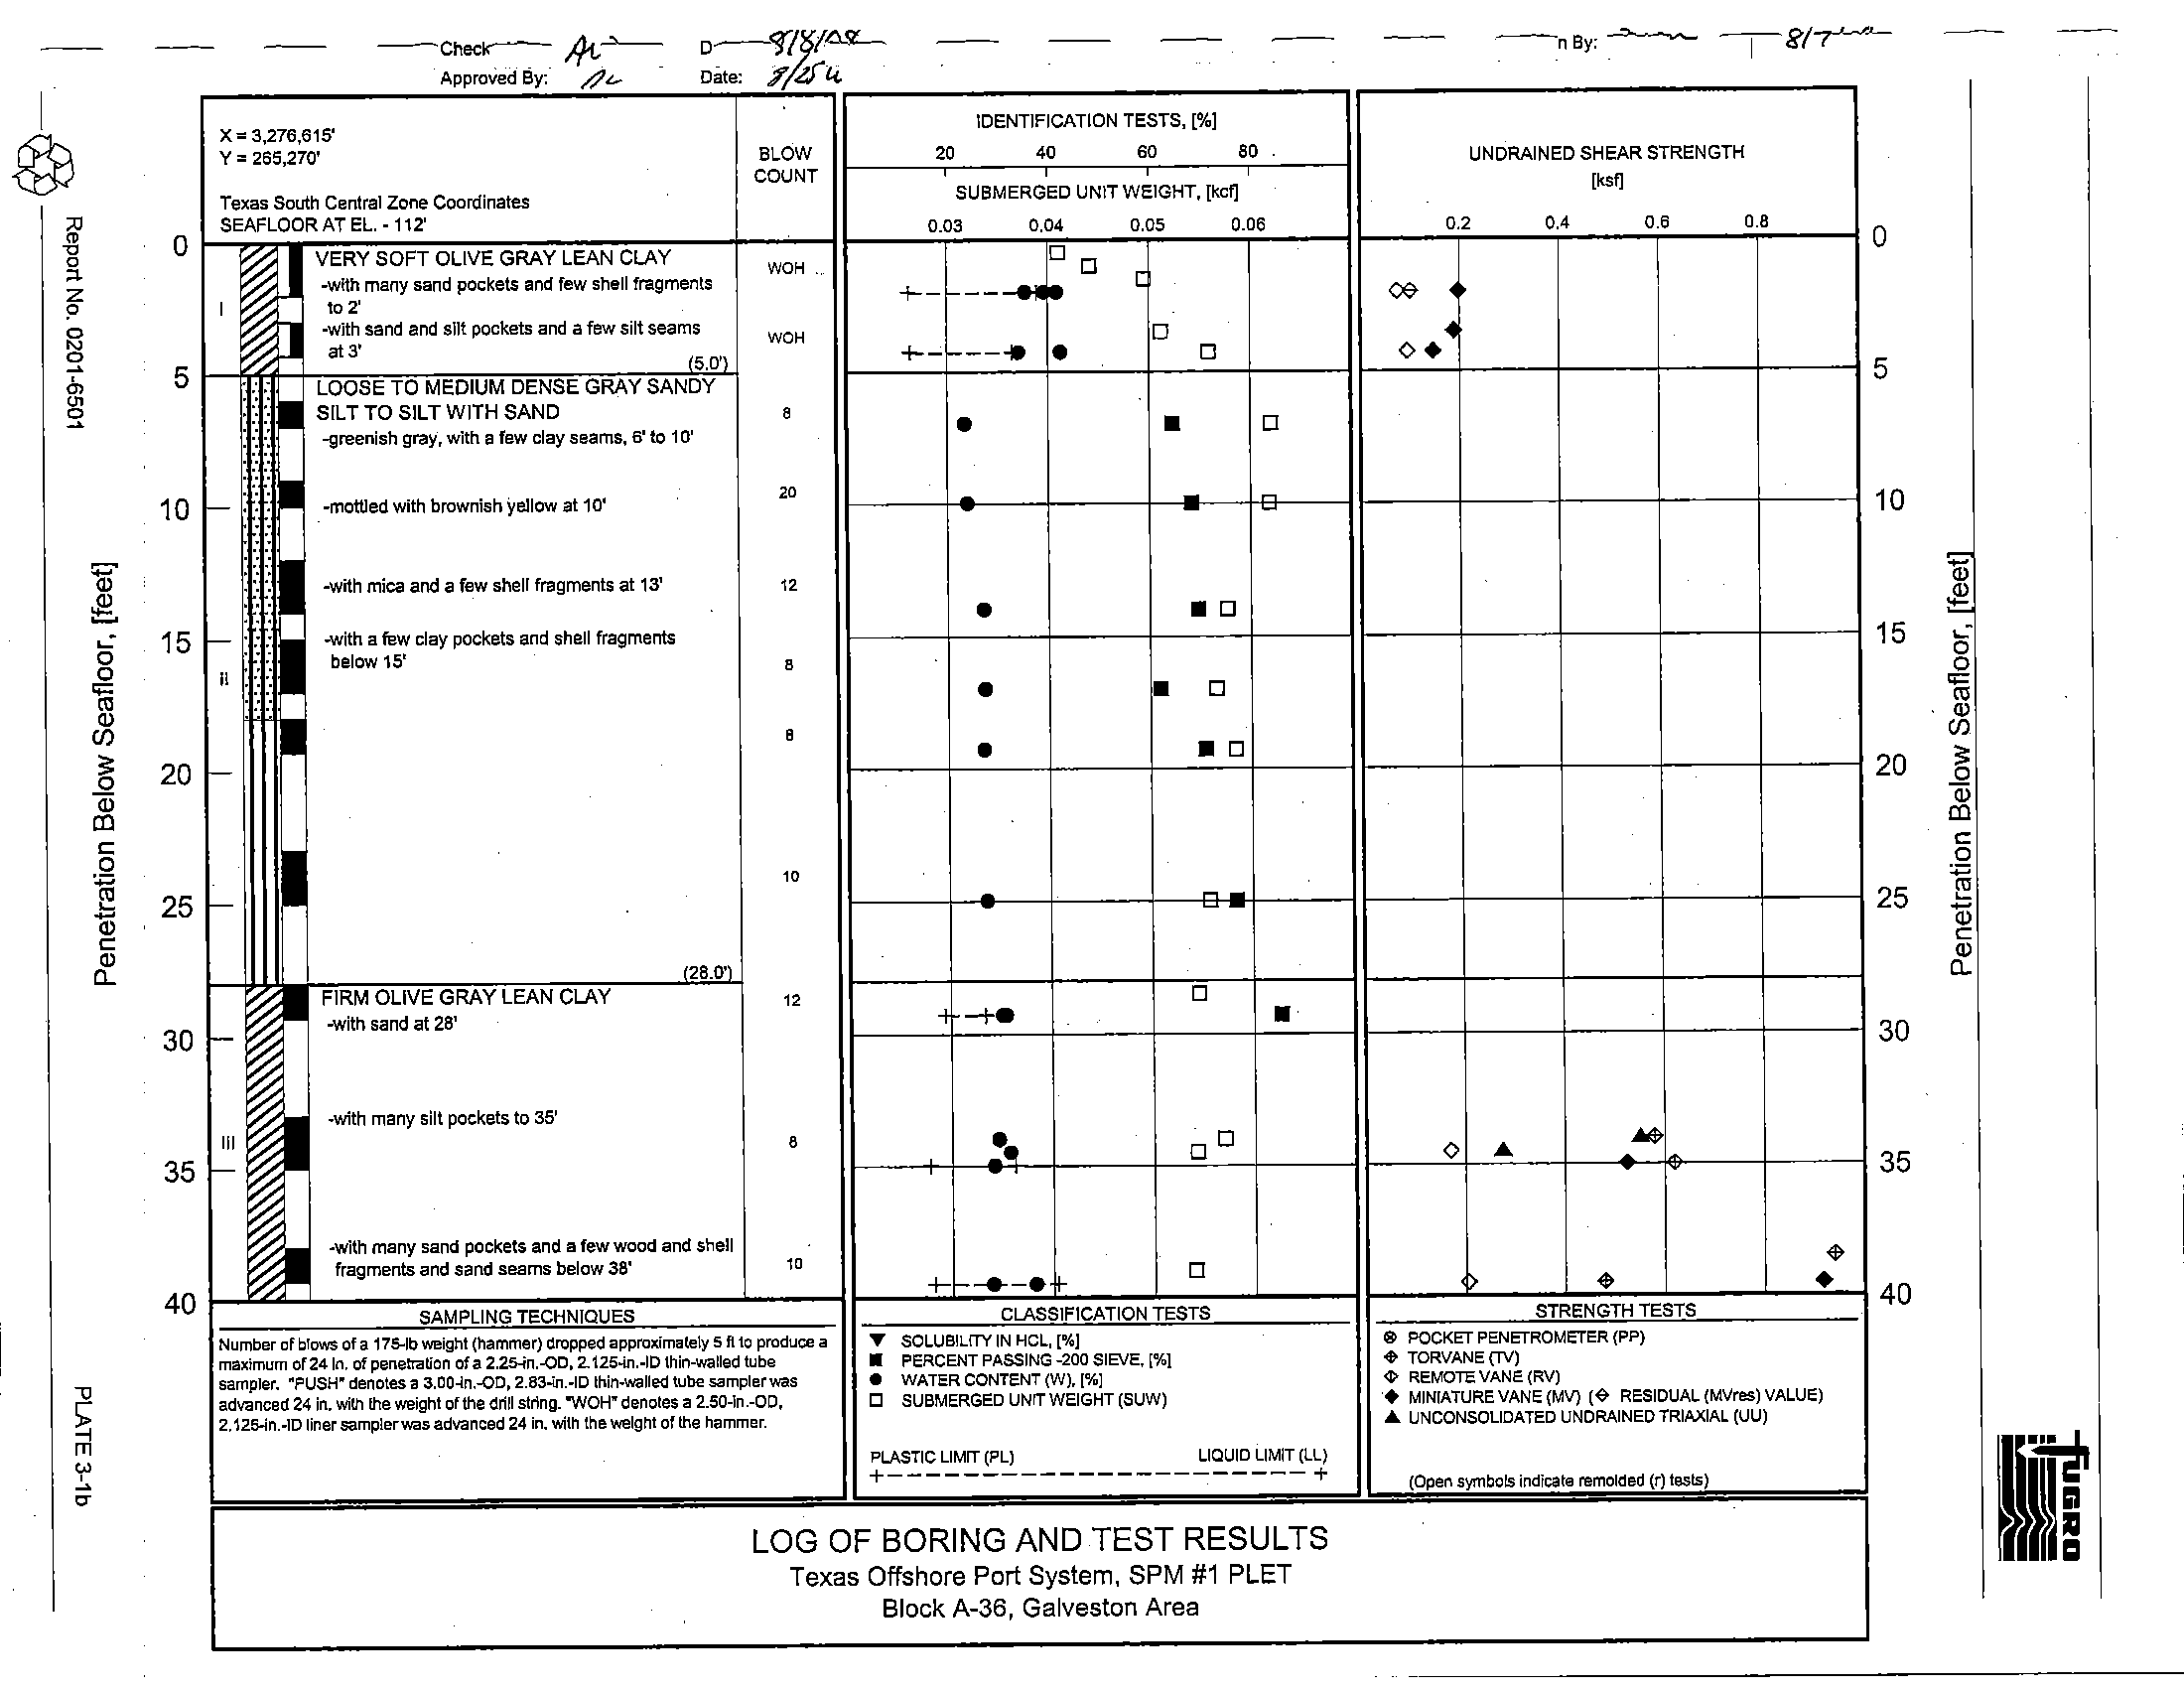
Soil Stratigraphy
The soil stratigraphy disclosed by the field and laboratory investigations is presented
on the boring
log, Plate 3-1. The soil stratigraphy is based on the classification of soil samples recovered from the boring
and observations made during drilling operations.
A generalized summary
of the major soil strata is
tabulated below.
Penetration, ft
Stratum
From
To
Description
I
0
5
Very soft lean clay
II
5
28
Loose to medium dense sandy silt to silt
with sand
III
28
43
Firm lean clay
IV
43
56
Medium dense silt to silty fine sand
V
56
131
Firm to very stiff clay
Detailed soil descriptions that include textural variations and inclusions are noted on the boring log.
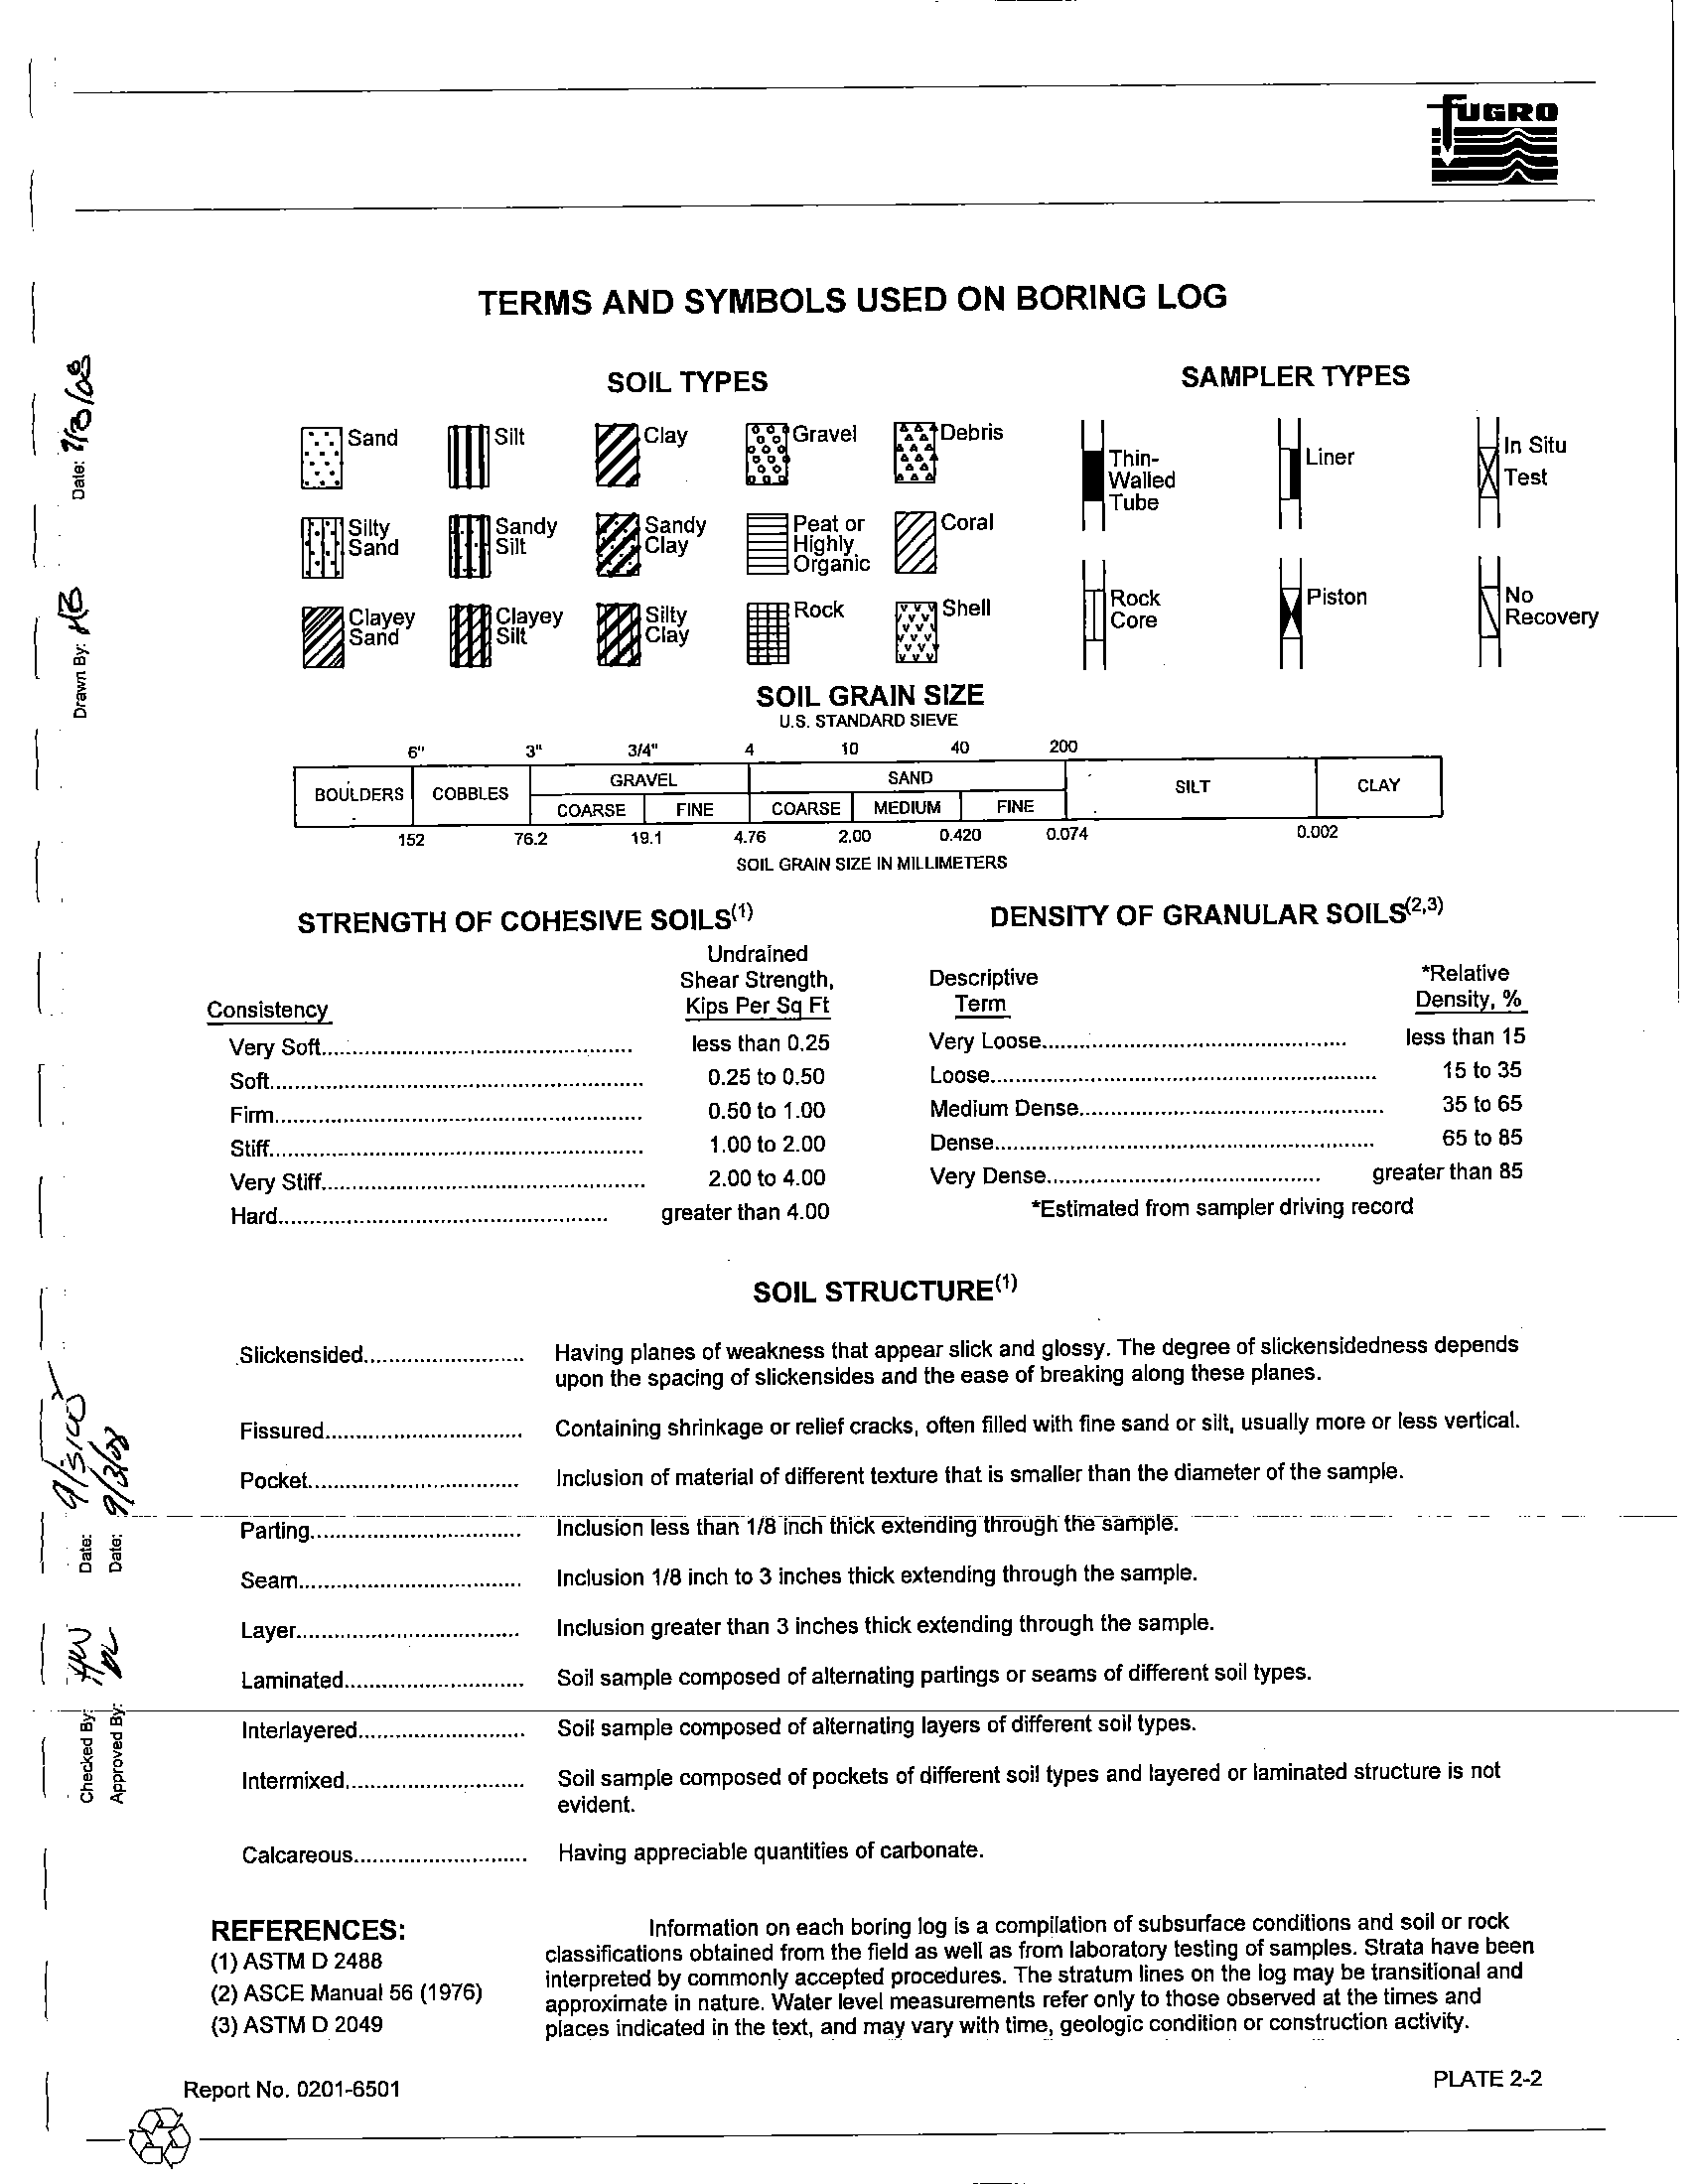
A key to the terms and symbols used on the boring
log is presented on Plate 2-2. The Roman numeral
representing each stratum is also shown
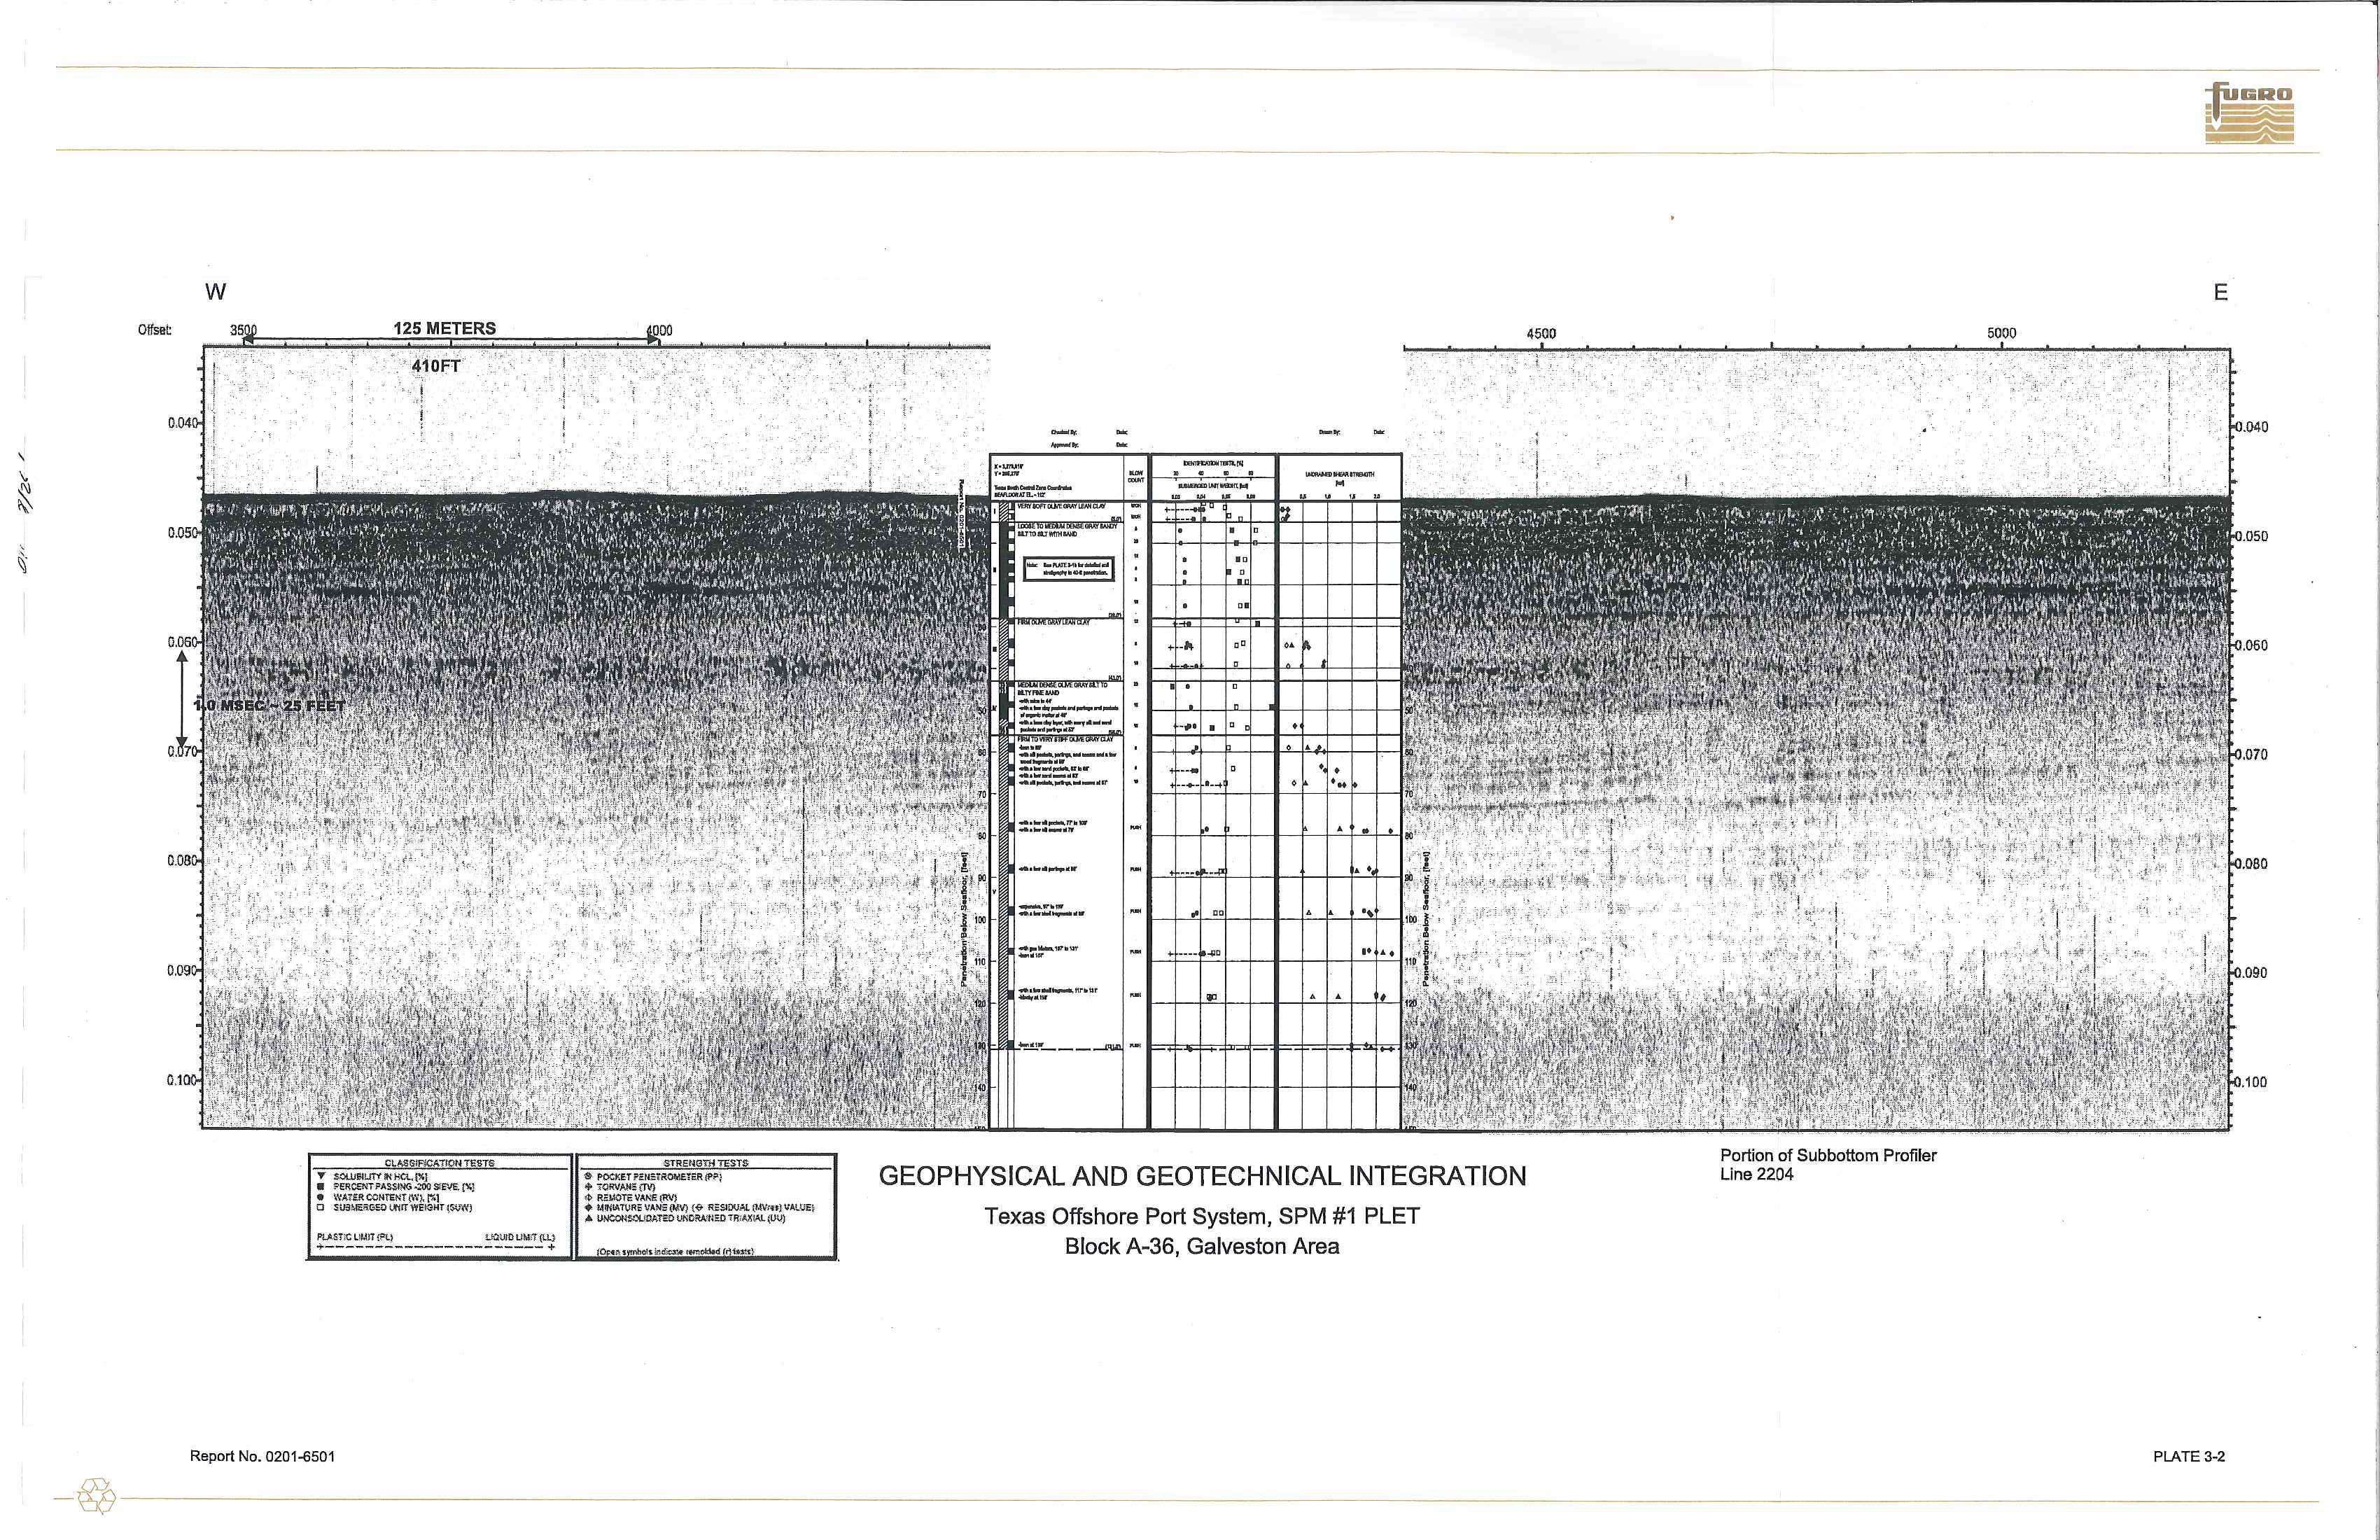
on the boring log and on relevant plates. The variation in soil
stratigraphy across this site
is indicated in a comparison (integration) of the geophysical and geotechnical
soil information presented
on Plate 3-2.
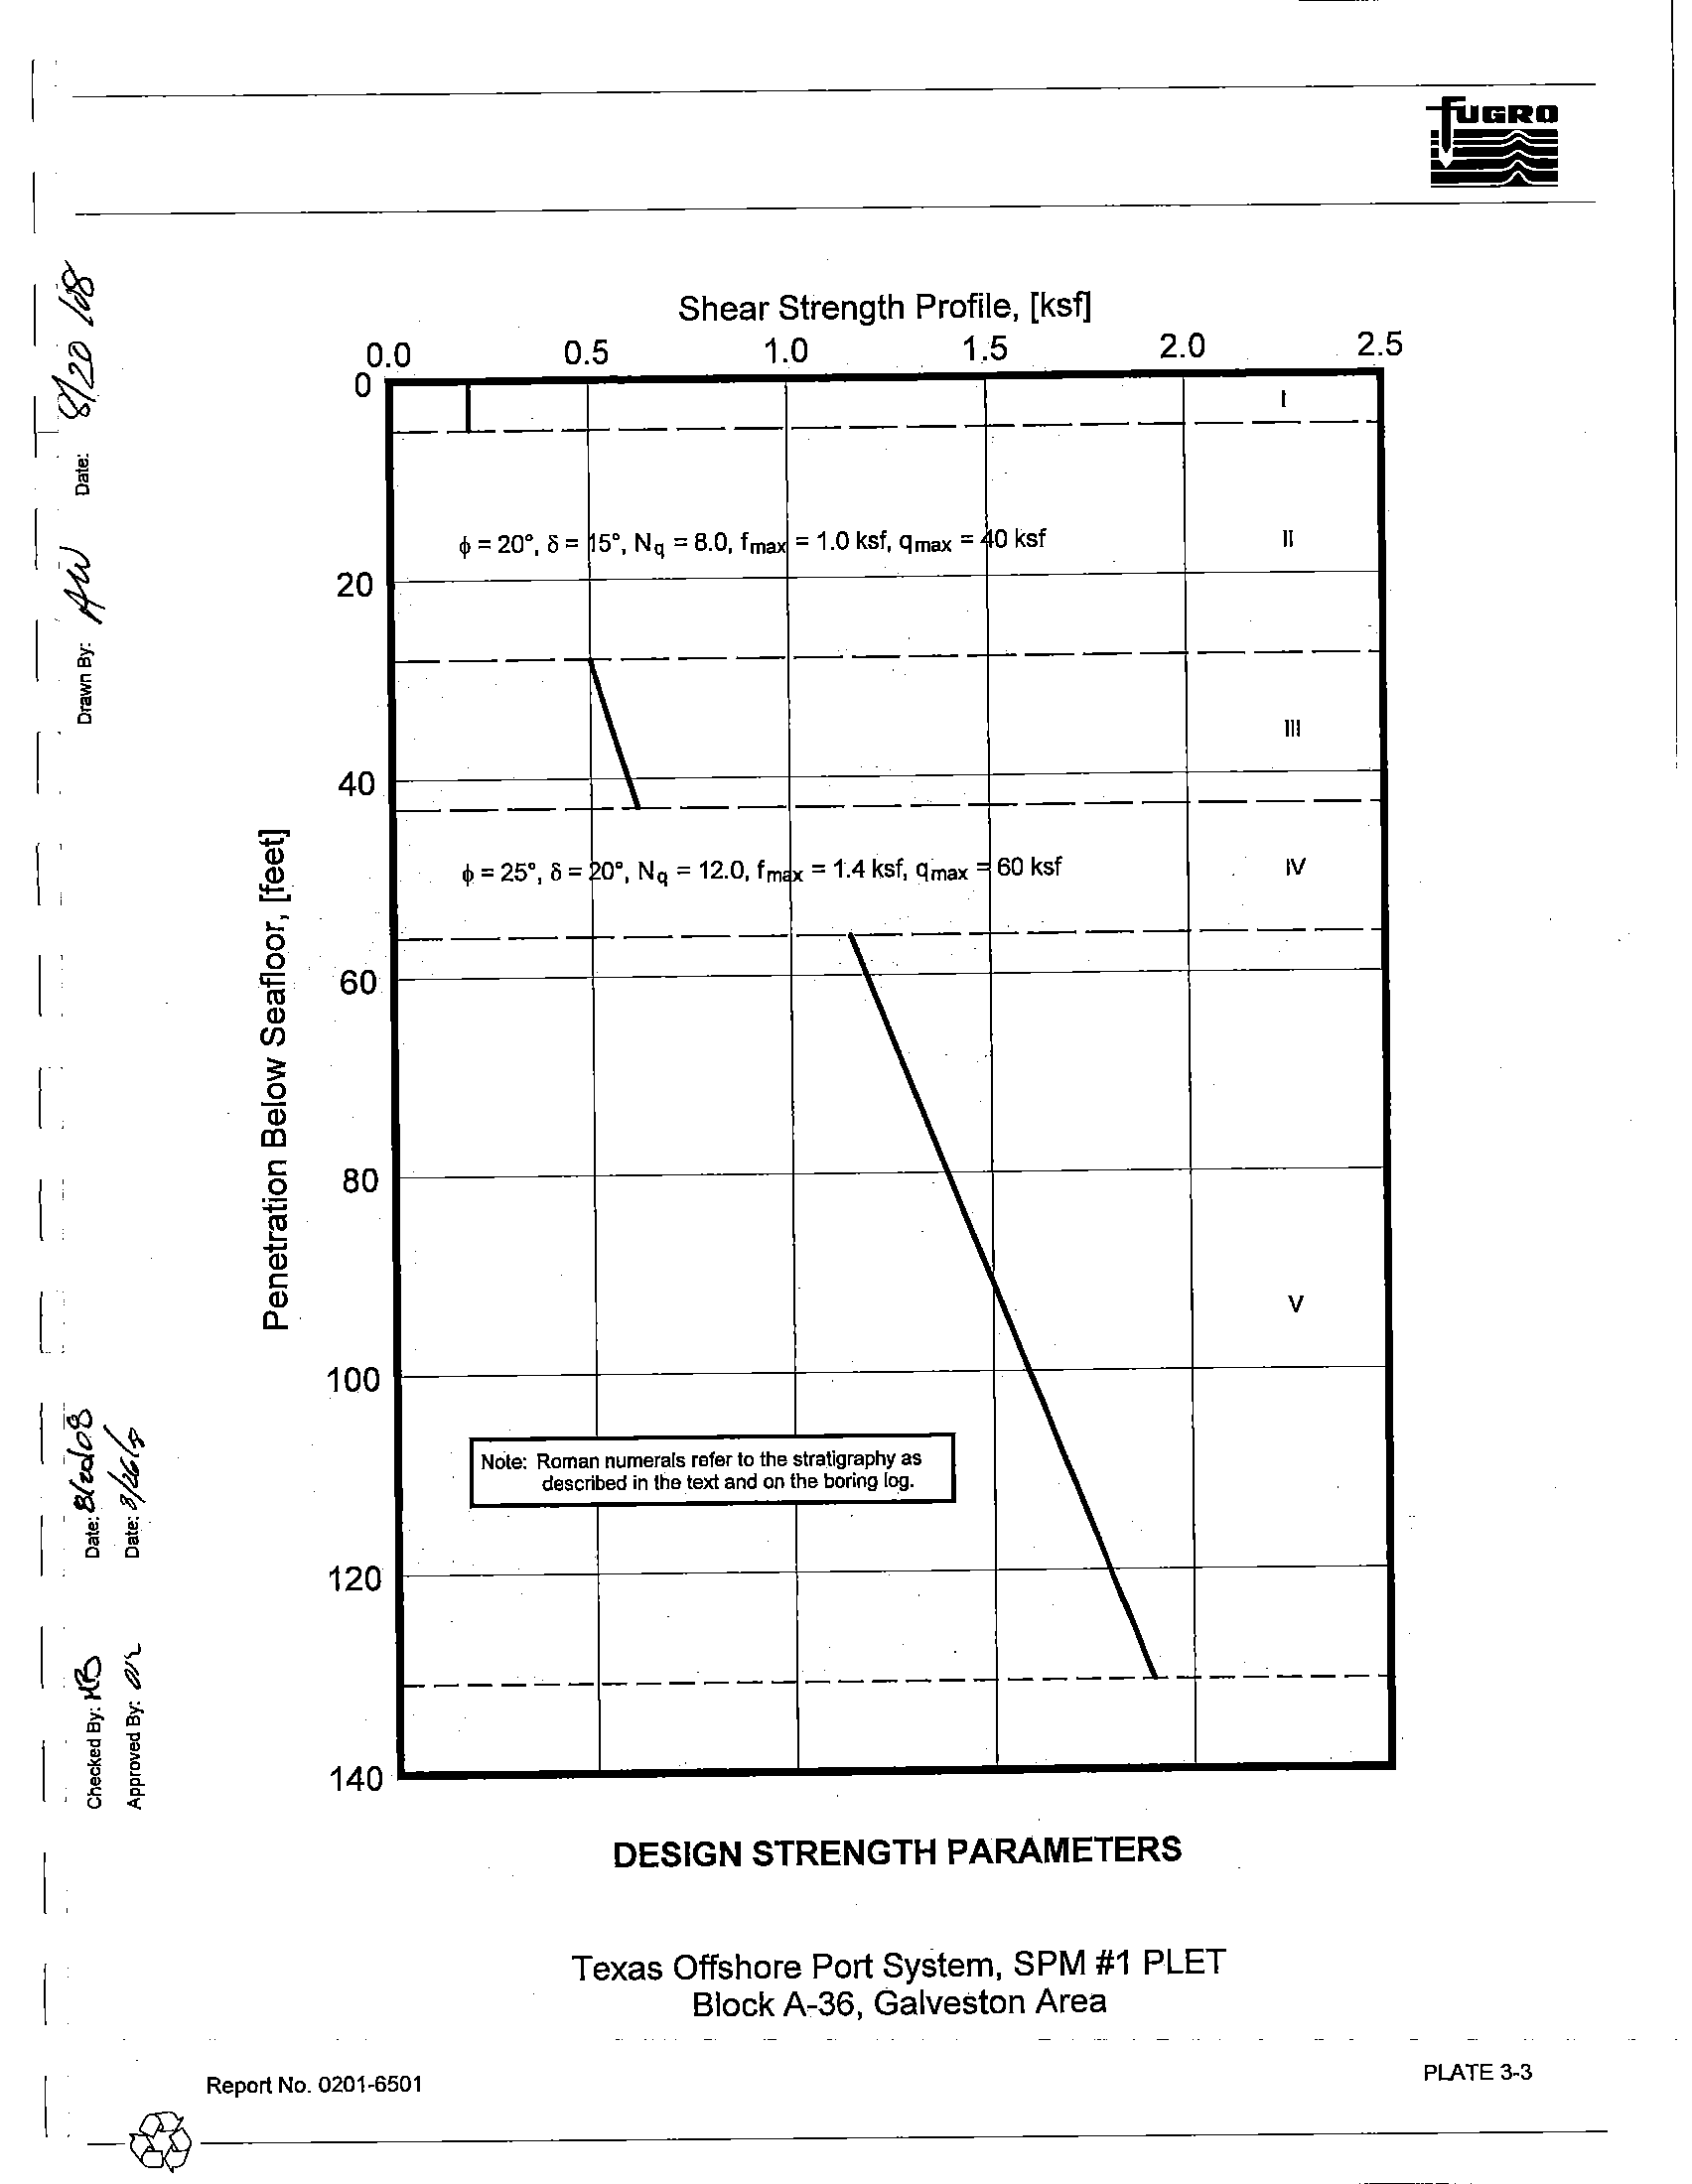
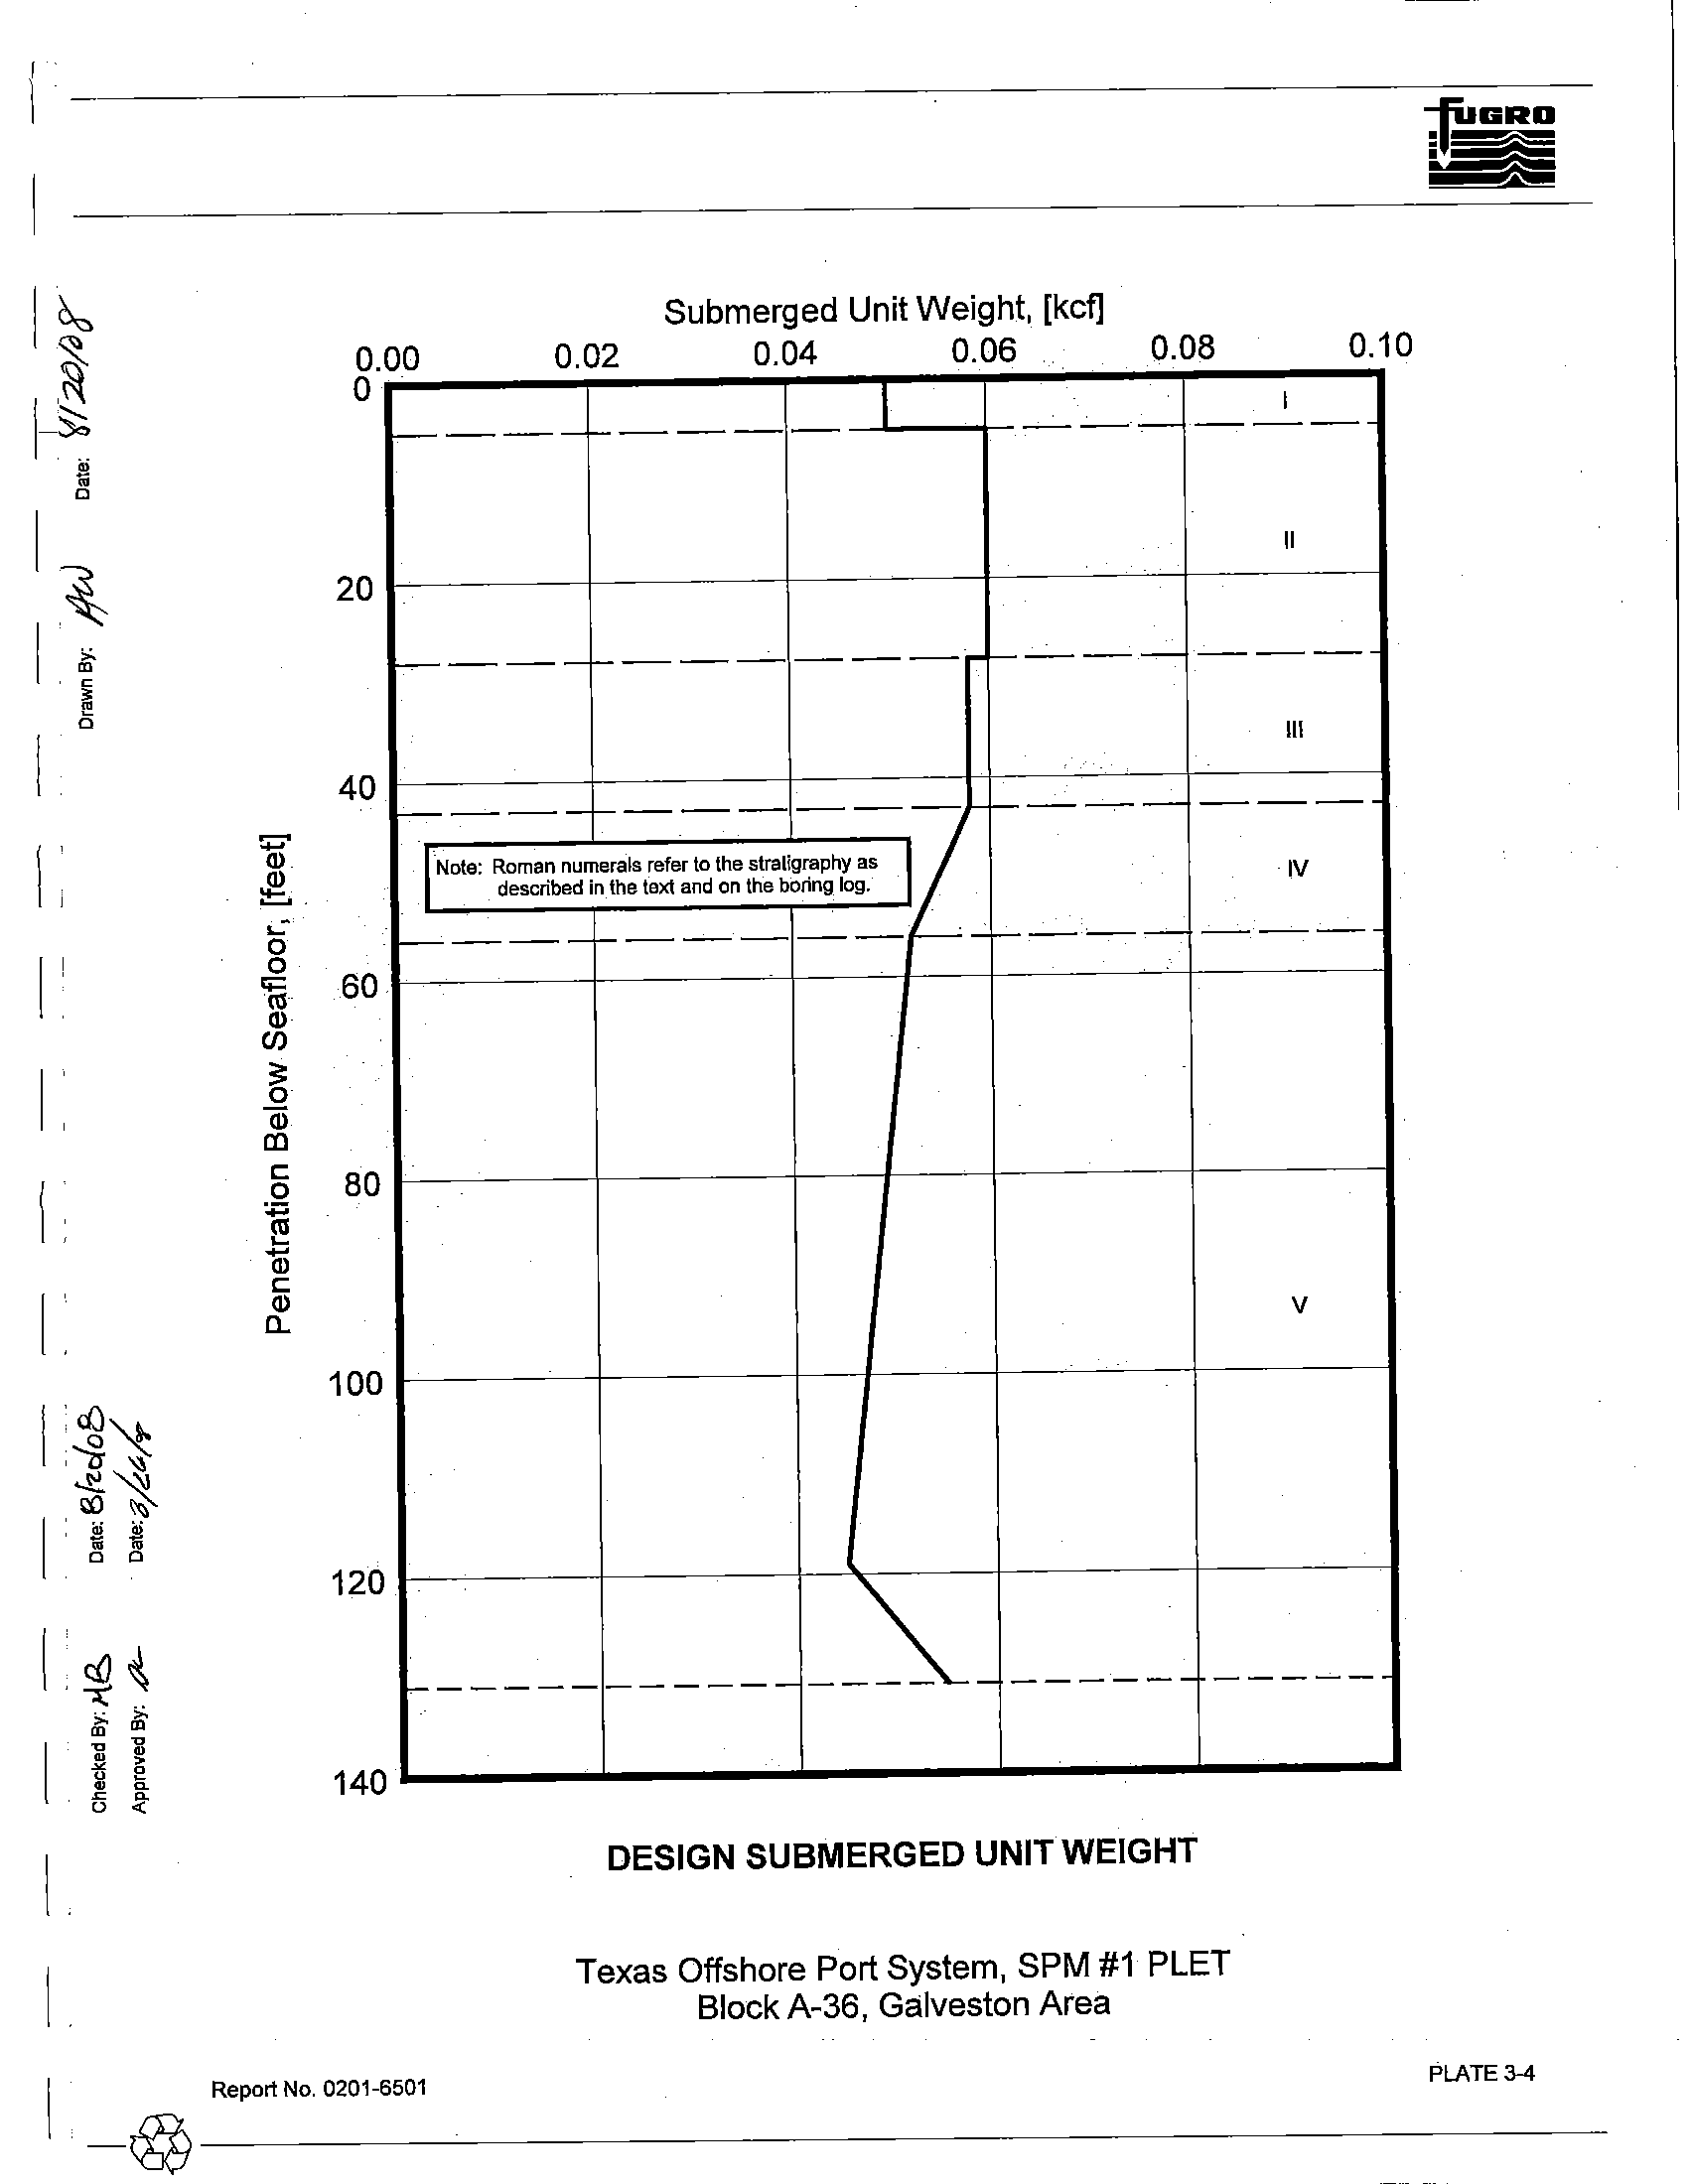
3.1.2.1 Interpretation
of Soil Properties
The shear strength and submerged unit weight profiles shown
on Plates 3-3 and 3-4, respectively,
best represent the assembled test results plotted
on the boring log.
These profiles were used in the
engineering analyses.
3.1.3
Pile Design Information
The pile design information developed for this study includes ultimate axial capacities, axial load-
pile movement data,
and lateral soil resistance-pile deflection (p-y) characteristics. The analytical methods
used to develop this information are presented briefly
in Section 2.5 and in more detail in Appendix B.
3.1.3.1 Axial Pile Design
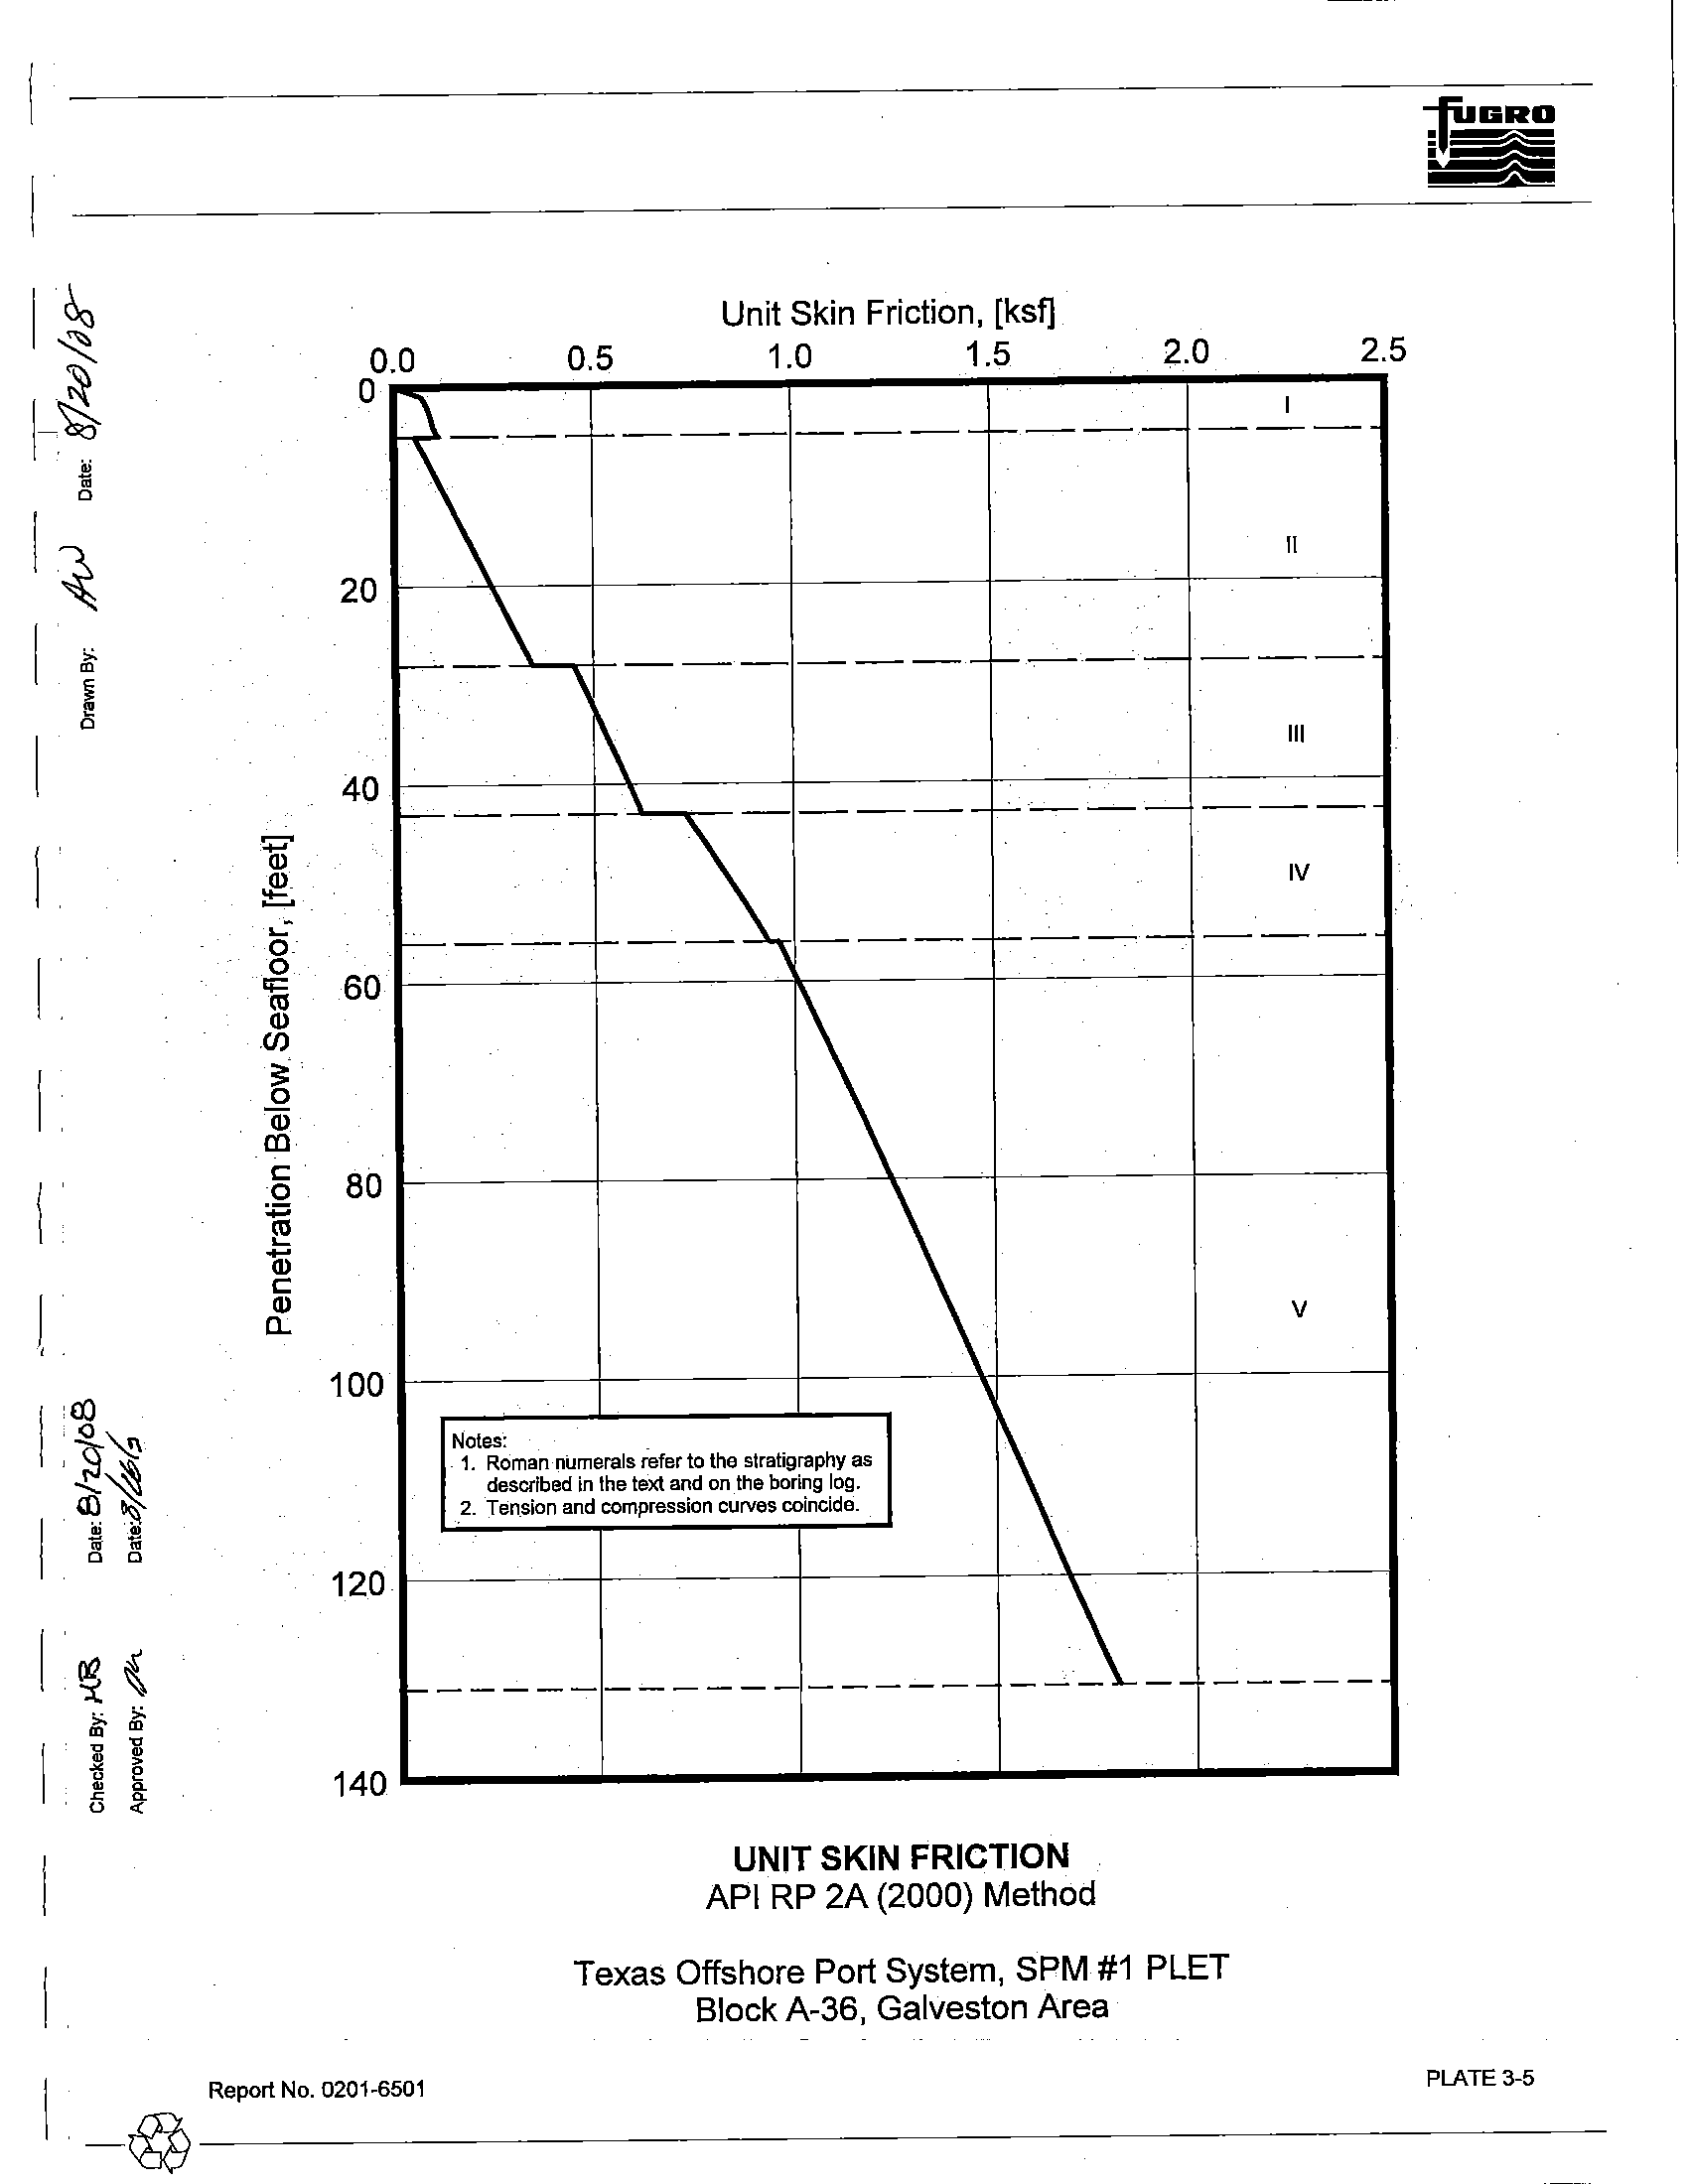
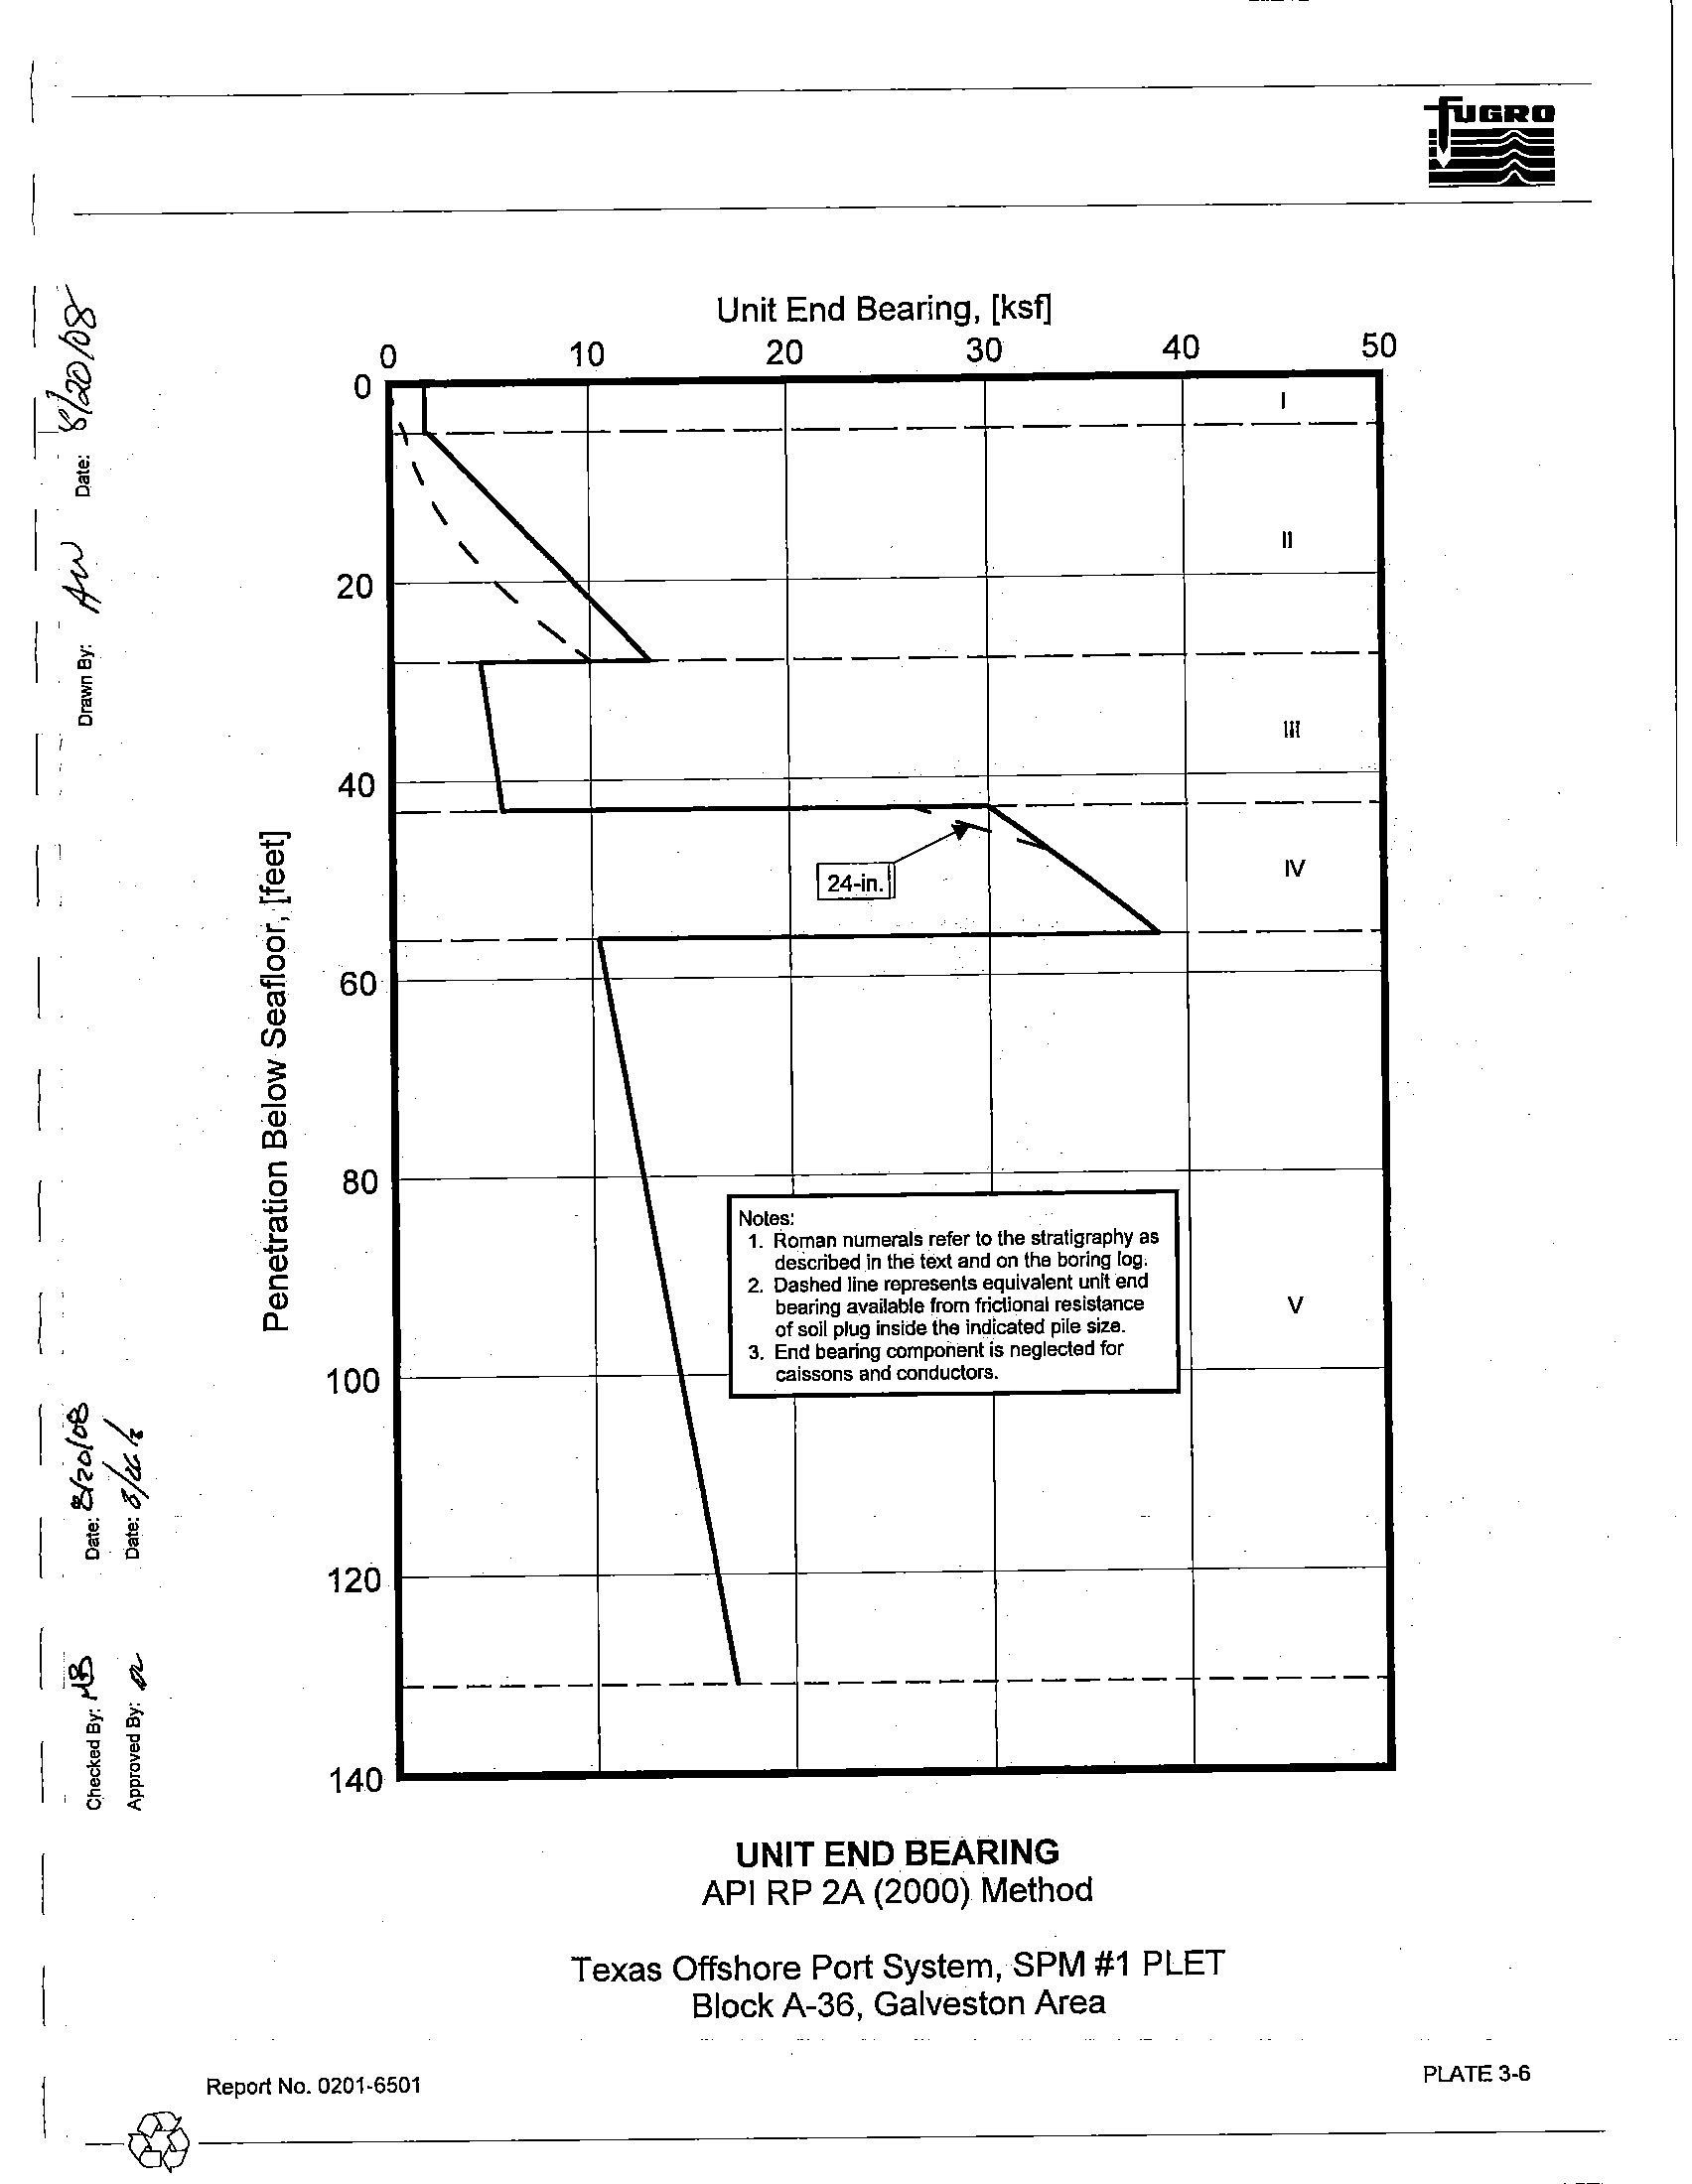
Ultimate Axial Capacity. The unit skin friction and unit end bearing values plotted
on Plates 3-5
and 3-6, respectively were calculated using the API RP 2A methods described in Appendix B. These values
were used
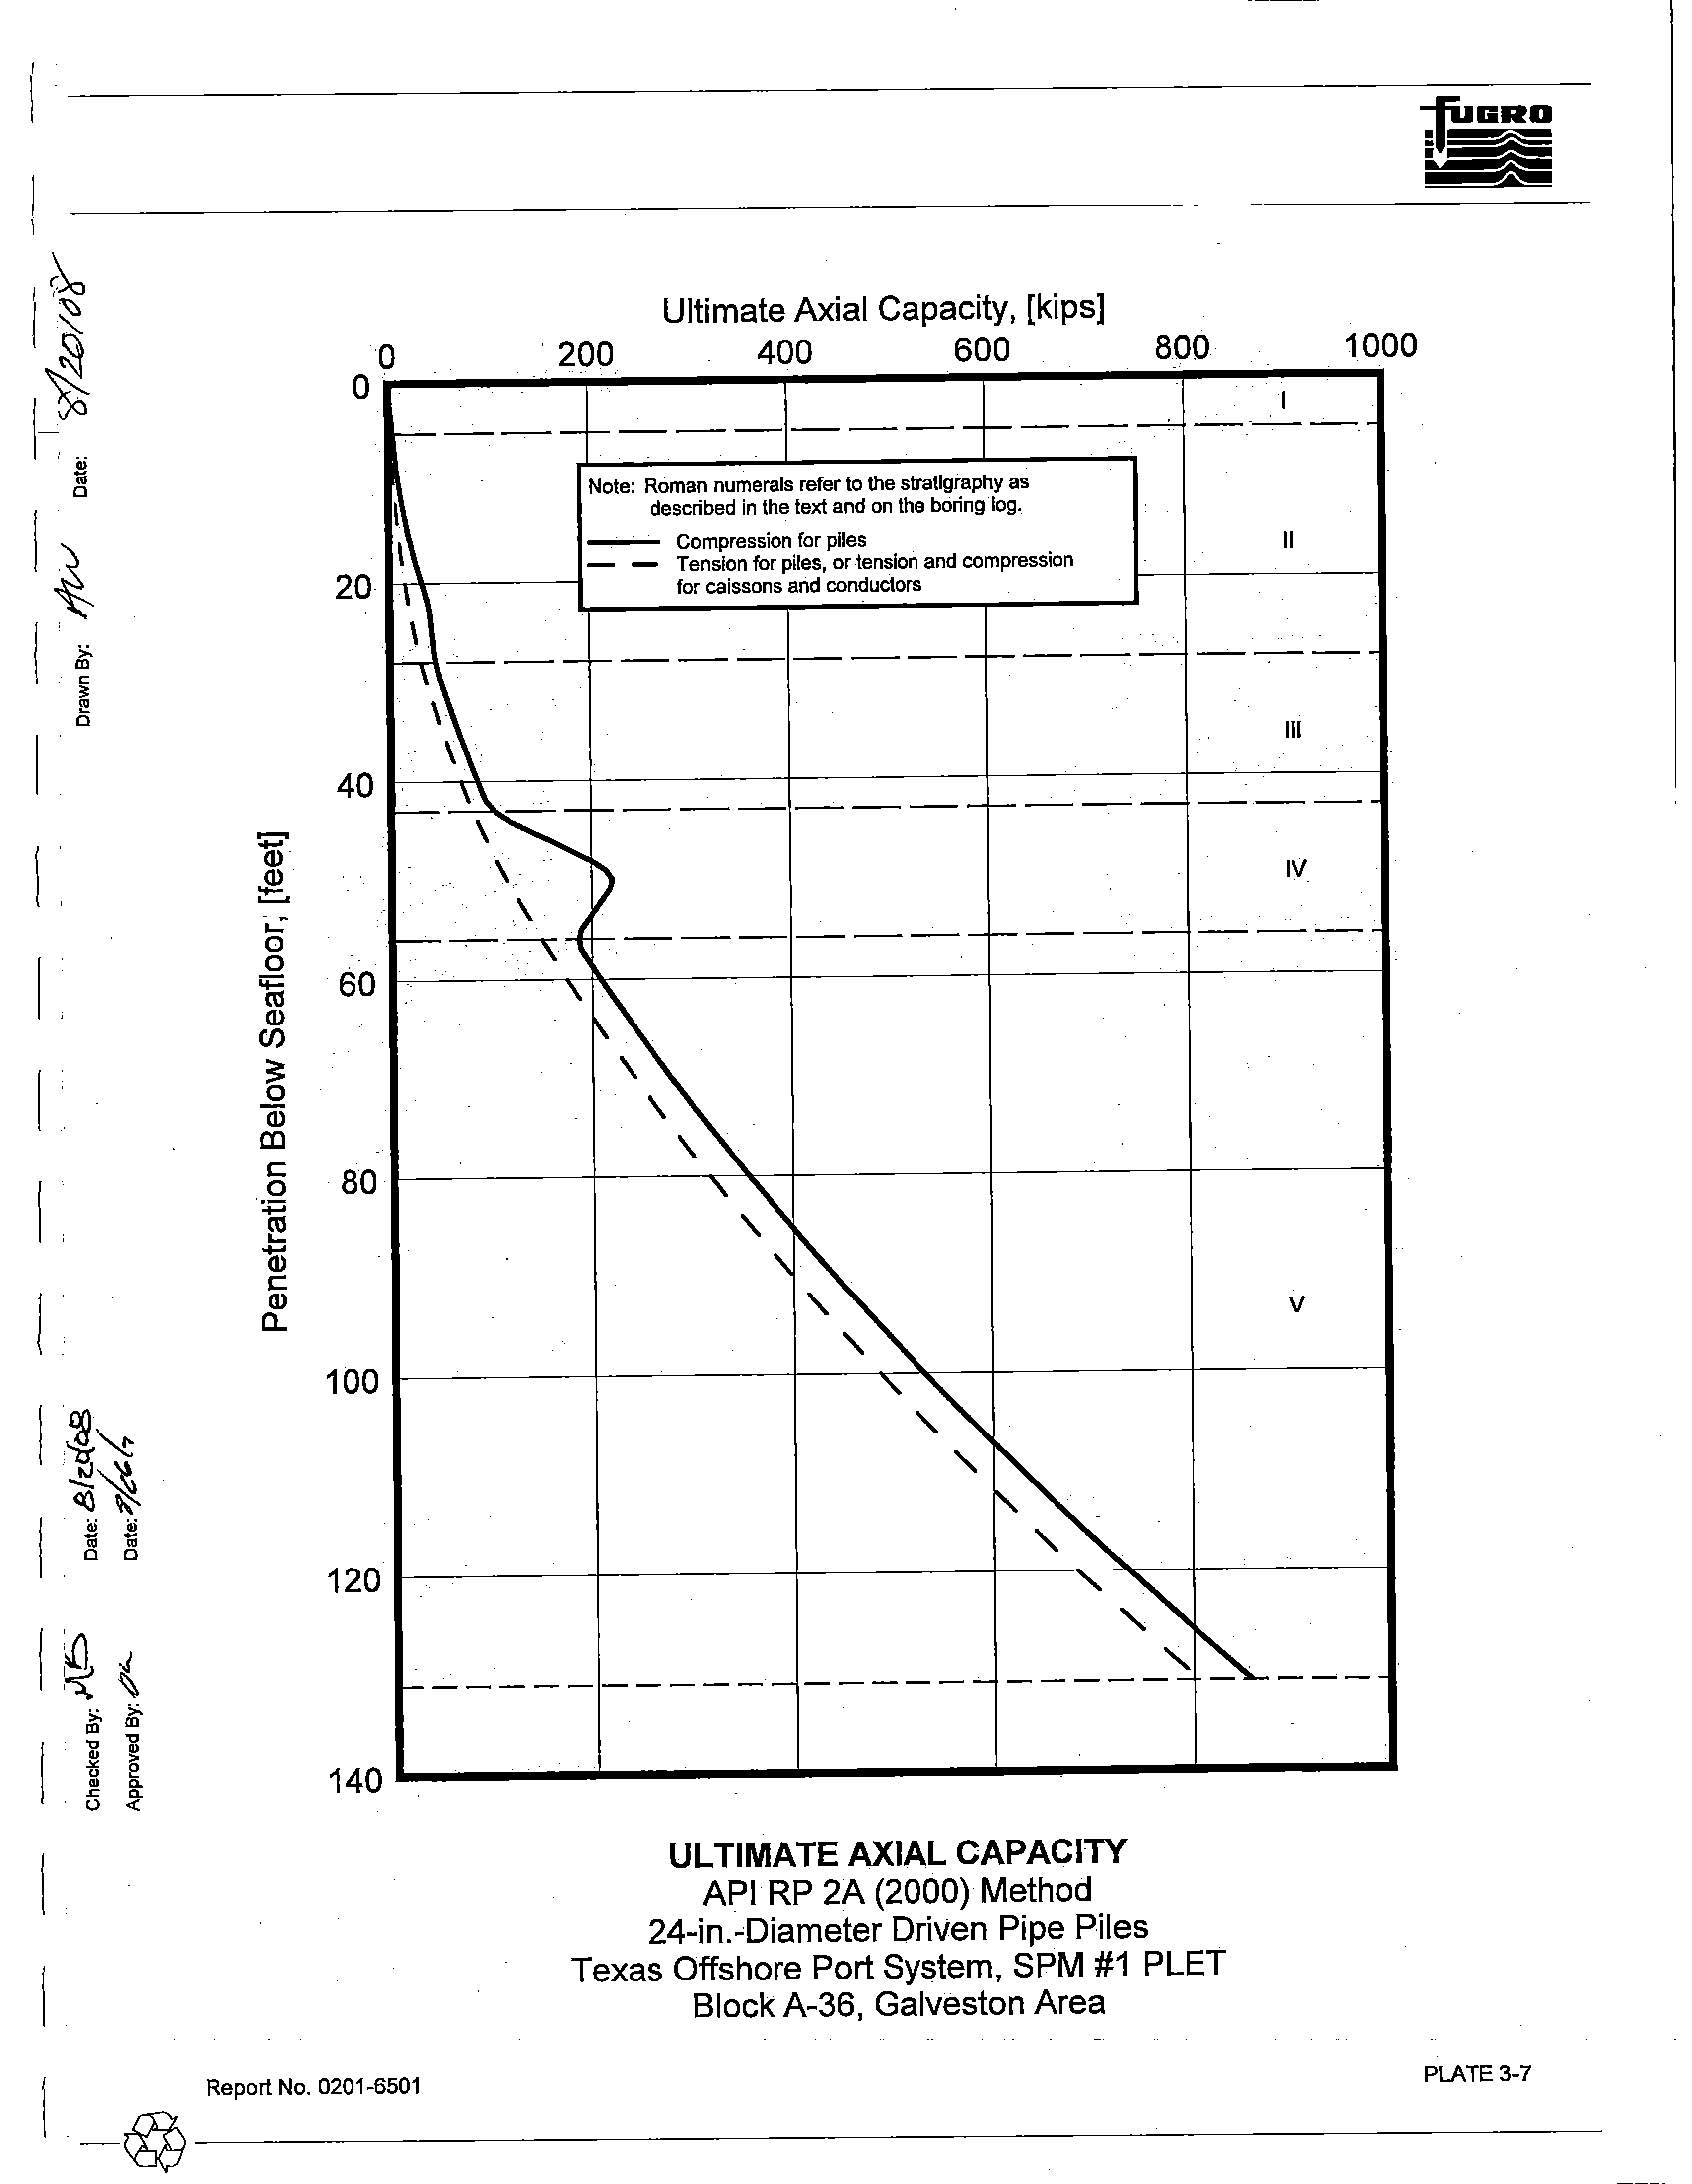
to calculate the ultimate axial compressive and tensile capacities for 24-in.-diameter pipe piles,
[ ___
~
_____
R_ep_o_rt_N_O_.O_2_0_1-_65_0_1___________________________________________________________3_.1_______
driven to final penetration at the boring location. Axial capacity curves for driven pipe piles (conductors,
caissons, anchor and foundation piles) are presented
on Plate 3-7.
API
RP 2A recommends that pile penetrations be selected using appropriate factors of safety or
pile resistance factors. These factors are discussed
in Section 2.5.1 of this report.
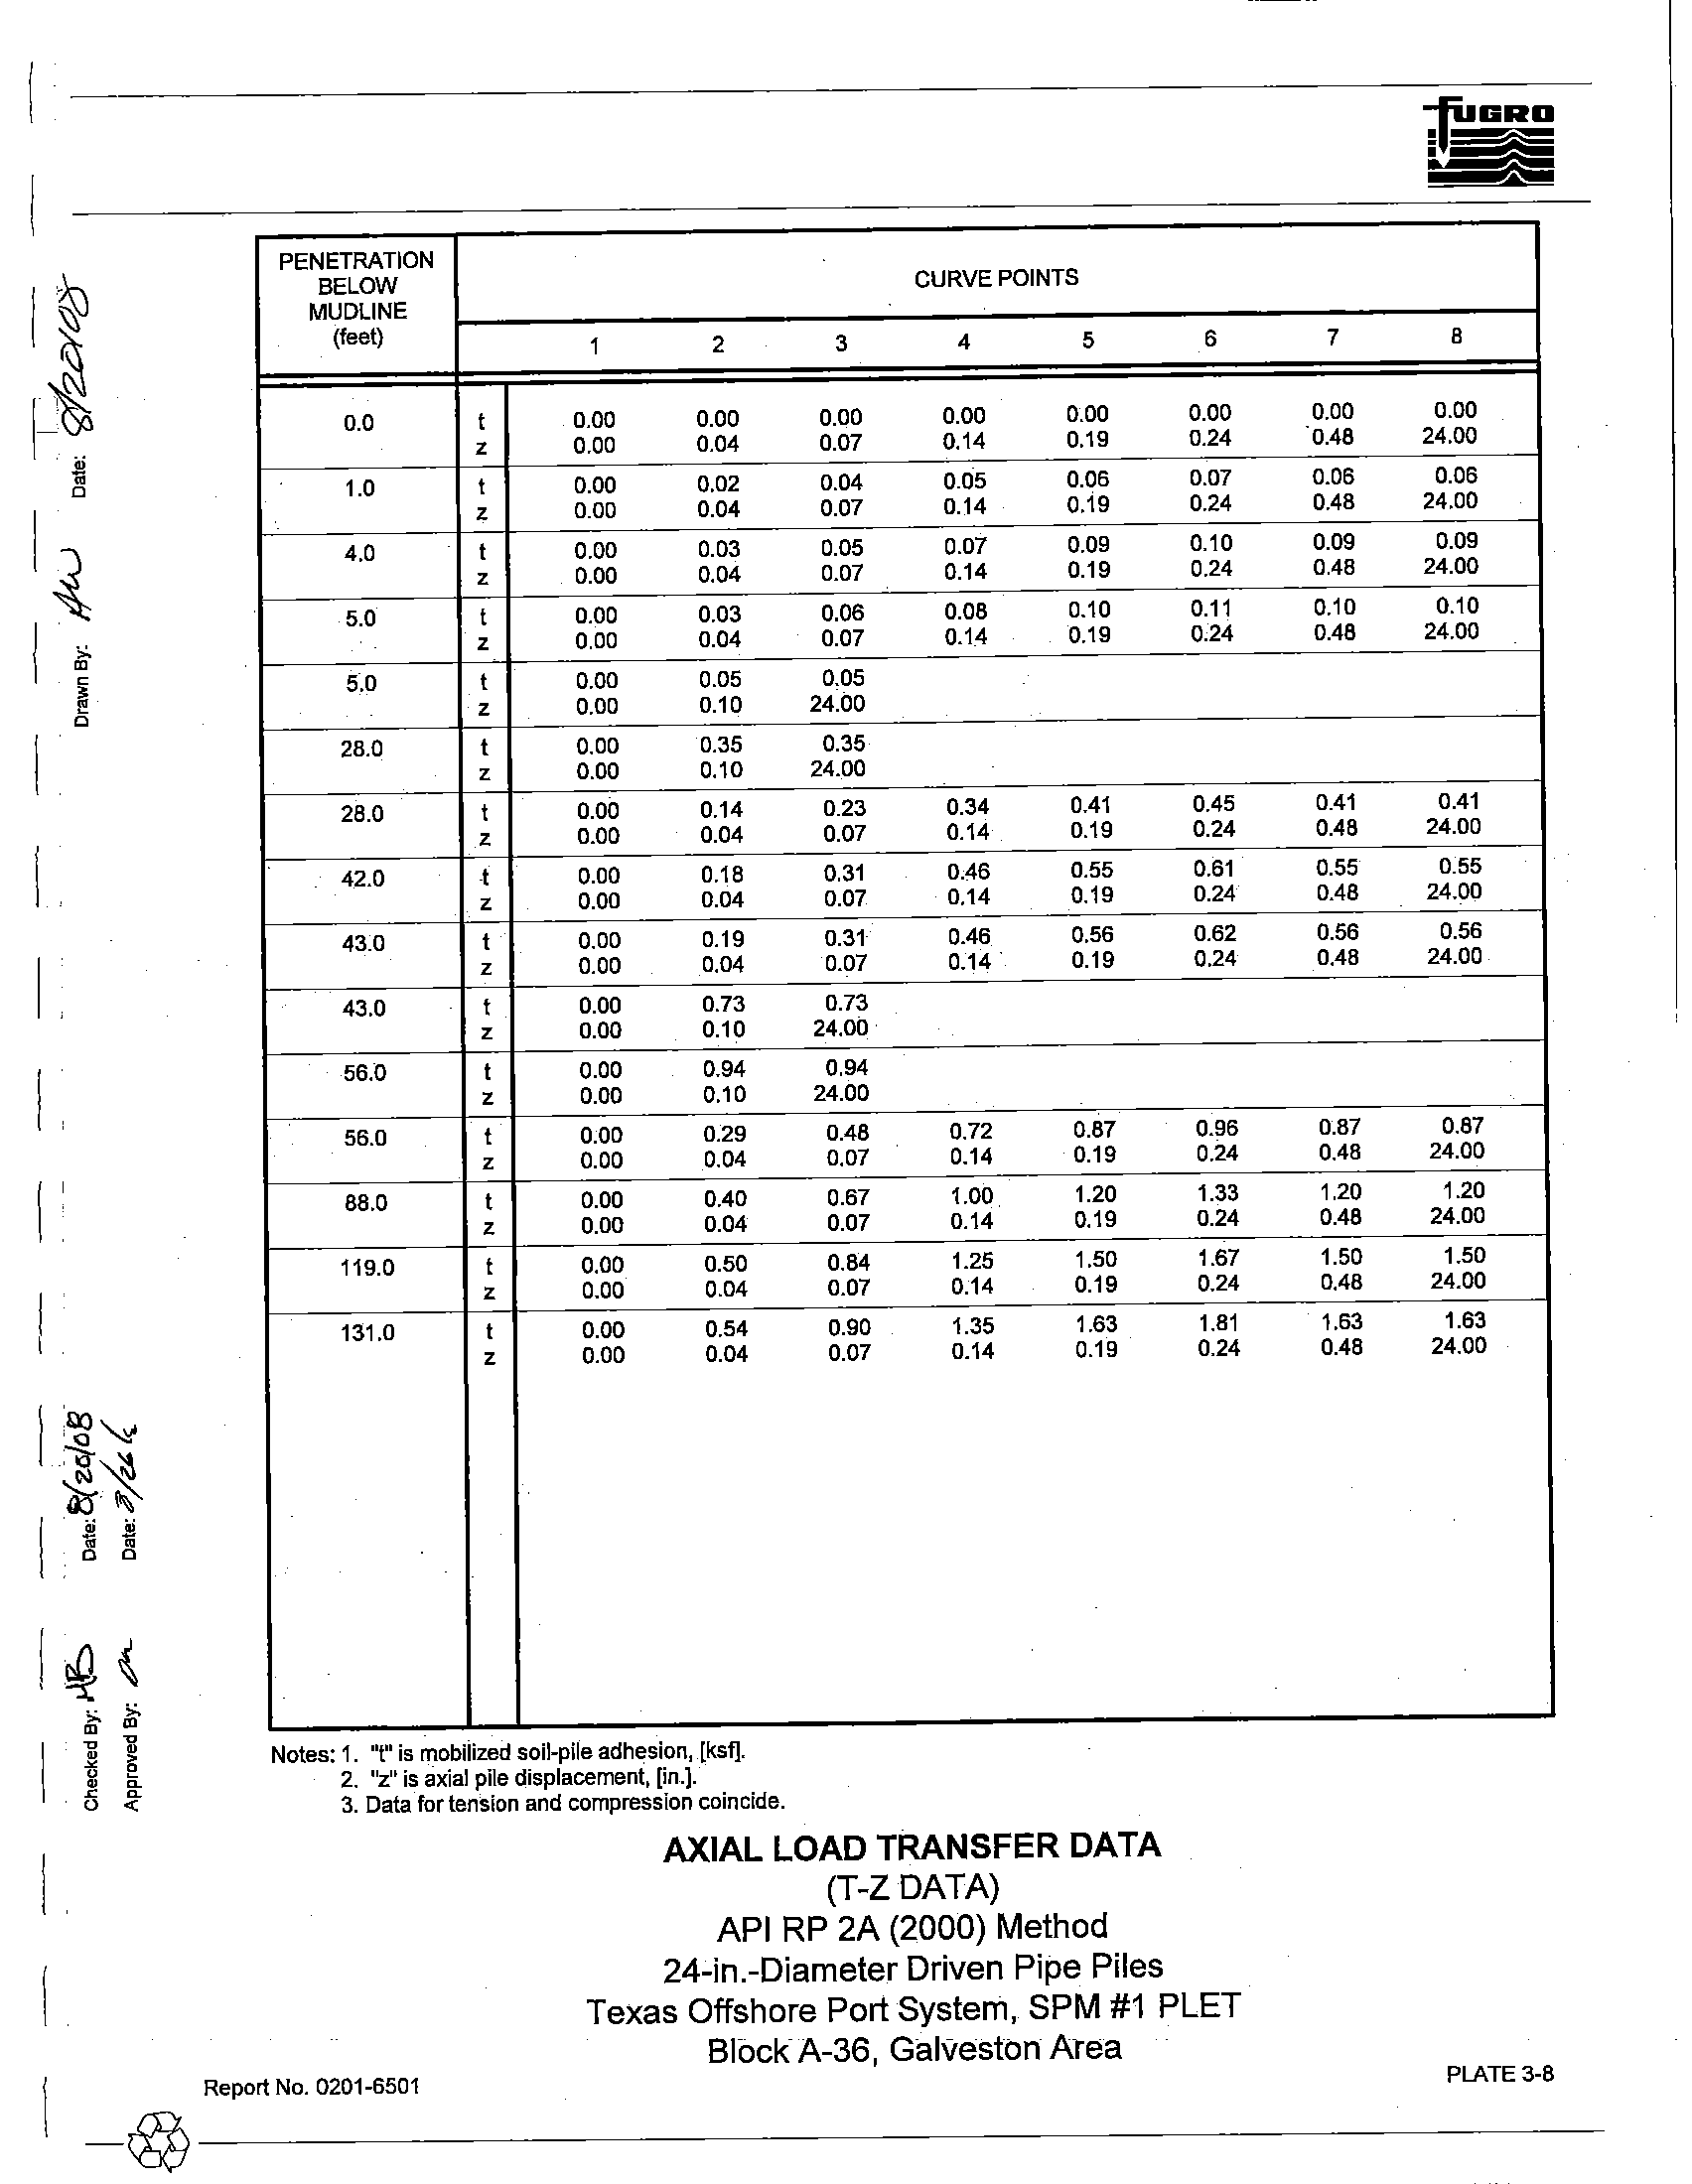
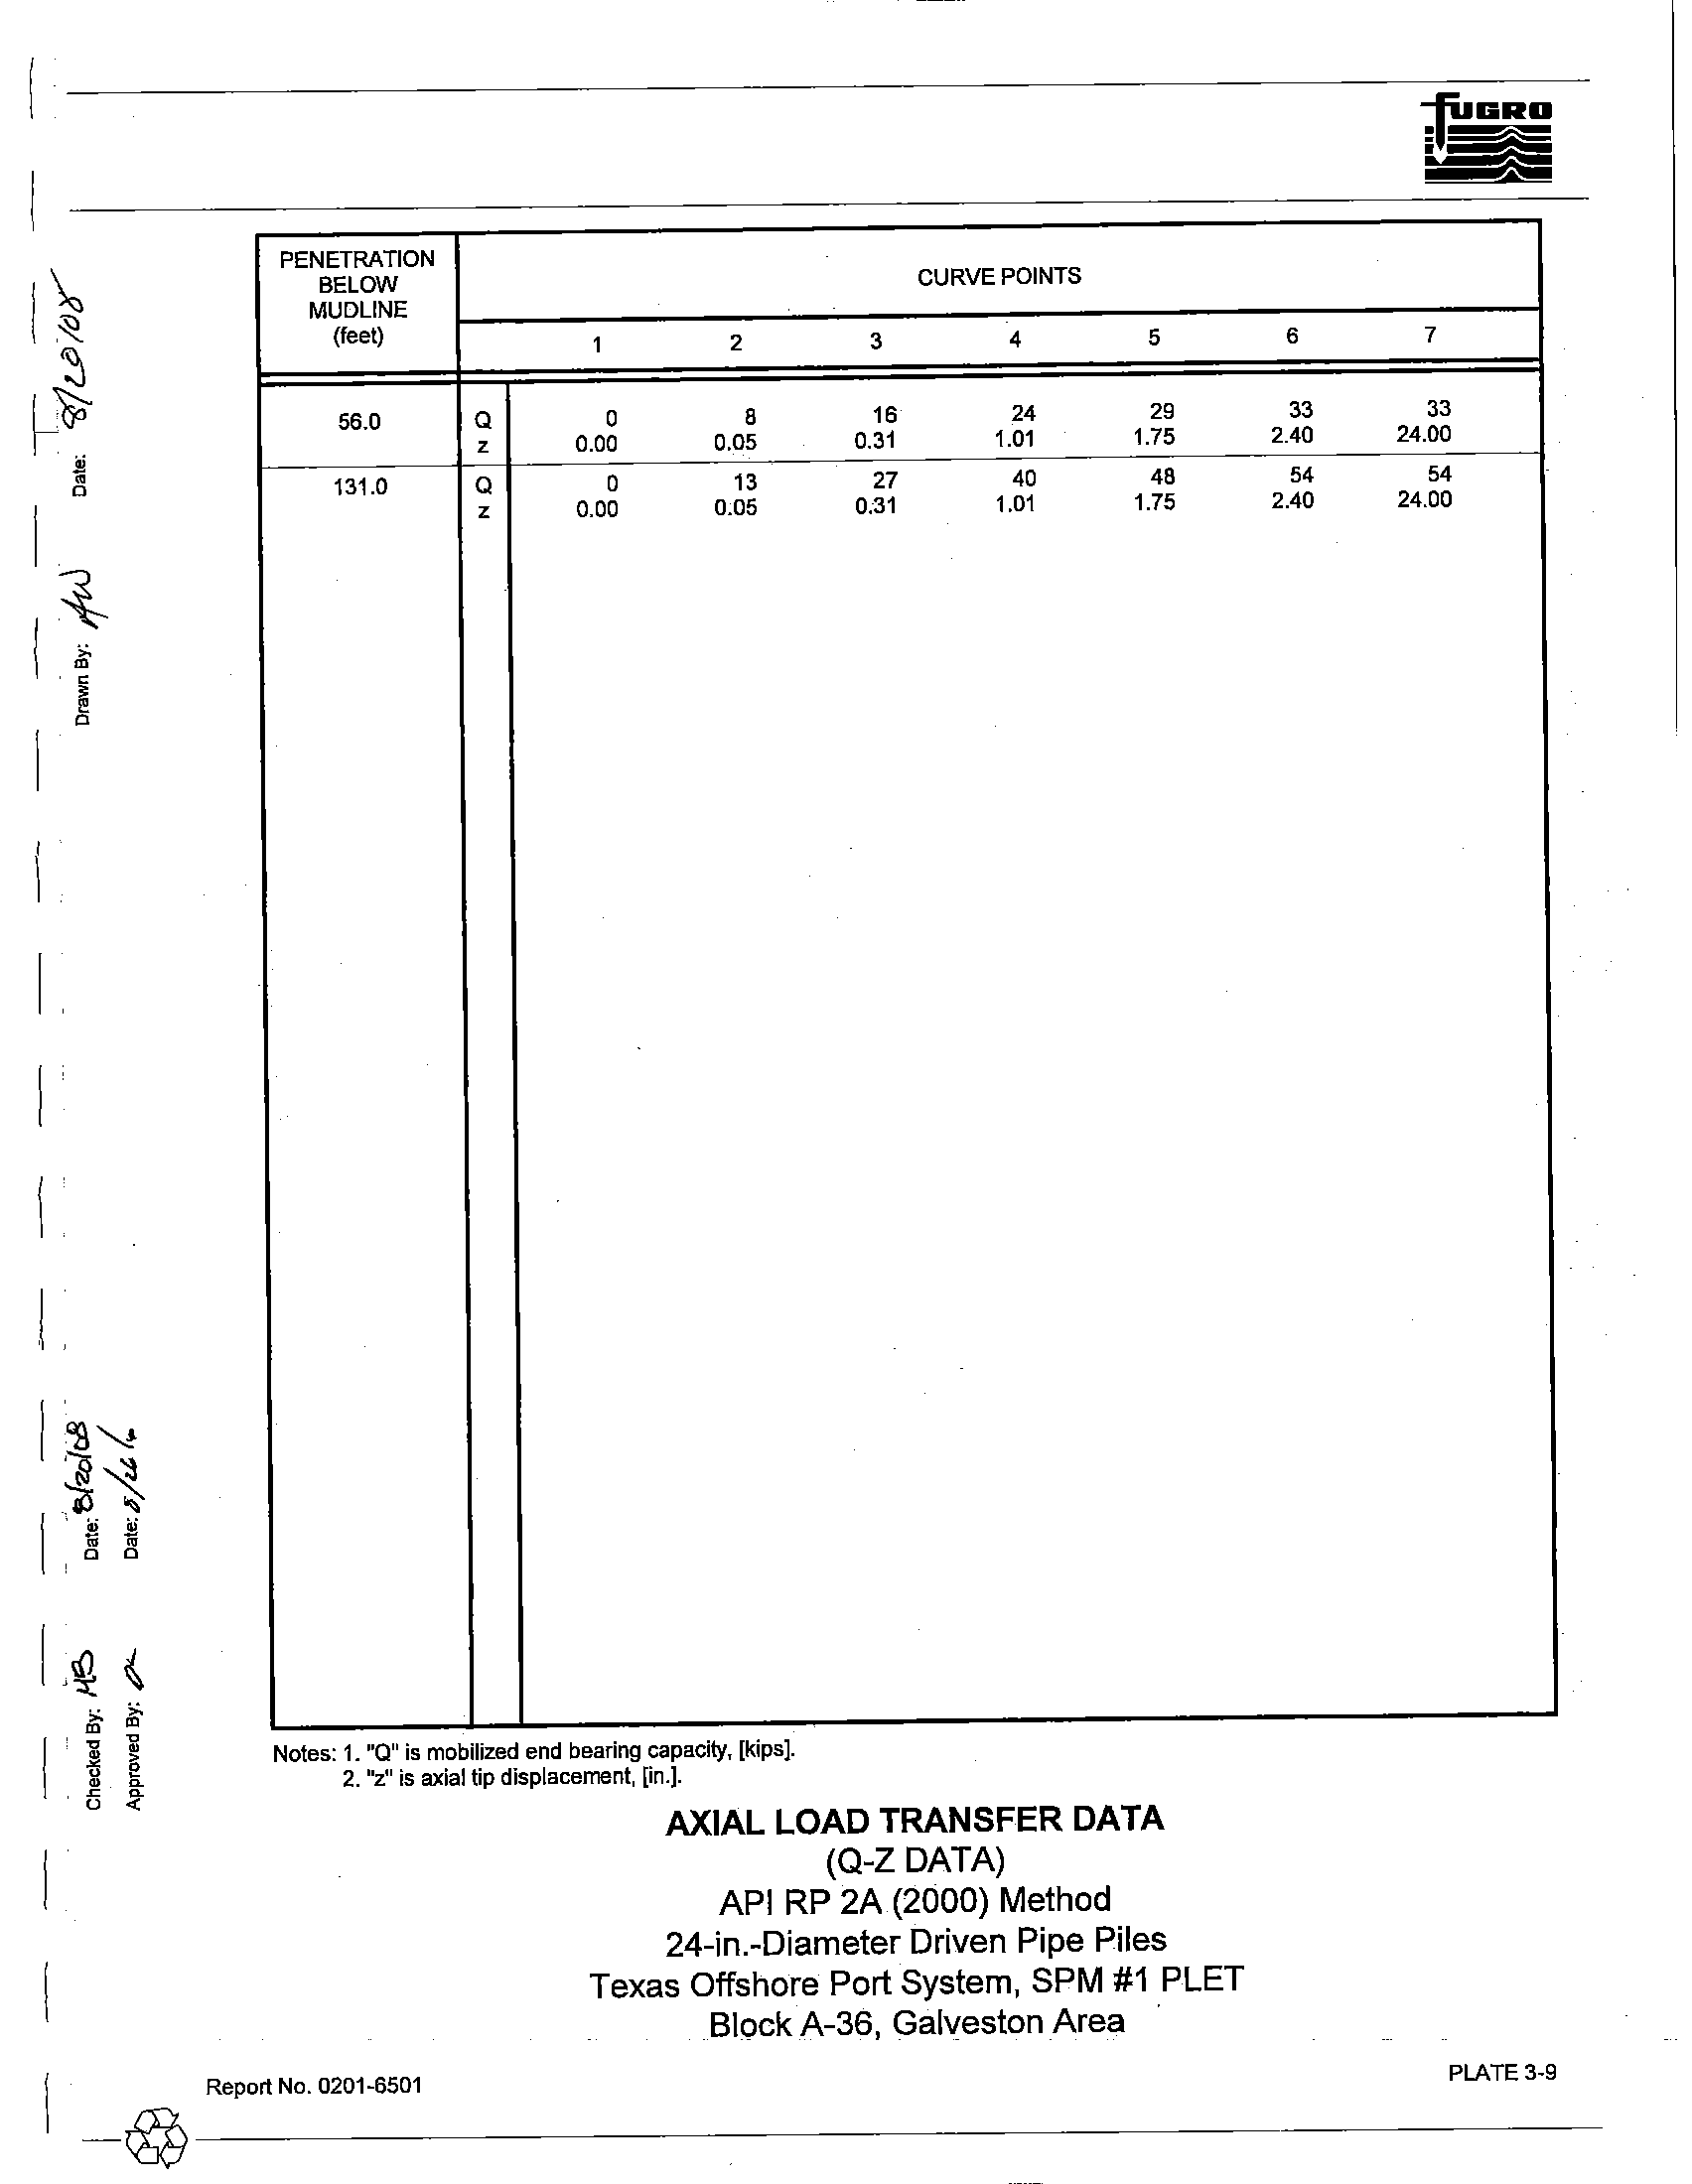
Axial
Load Transfer Data. Axial load-pile movement analyses are usually performed using a
computer solution based on methods developed by Reese (1964) or Matlock, et
al. (1976). Plates 3-8 and
3-9 presents the results
as side load-side movement (t-z) and tip load-tip movement (Q-z) data for 24-in.-
diameter driven pipe piles, respectively. The presented Q-z data should be used for foundation piles and
neglected for caissons and conductor design. In developing the axial load transfer data in the cohesive
soils, a post-peak adhesion ratio of 0.90 was utilized.
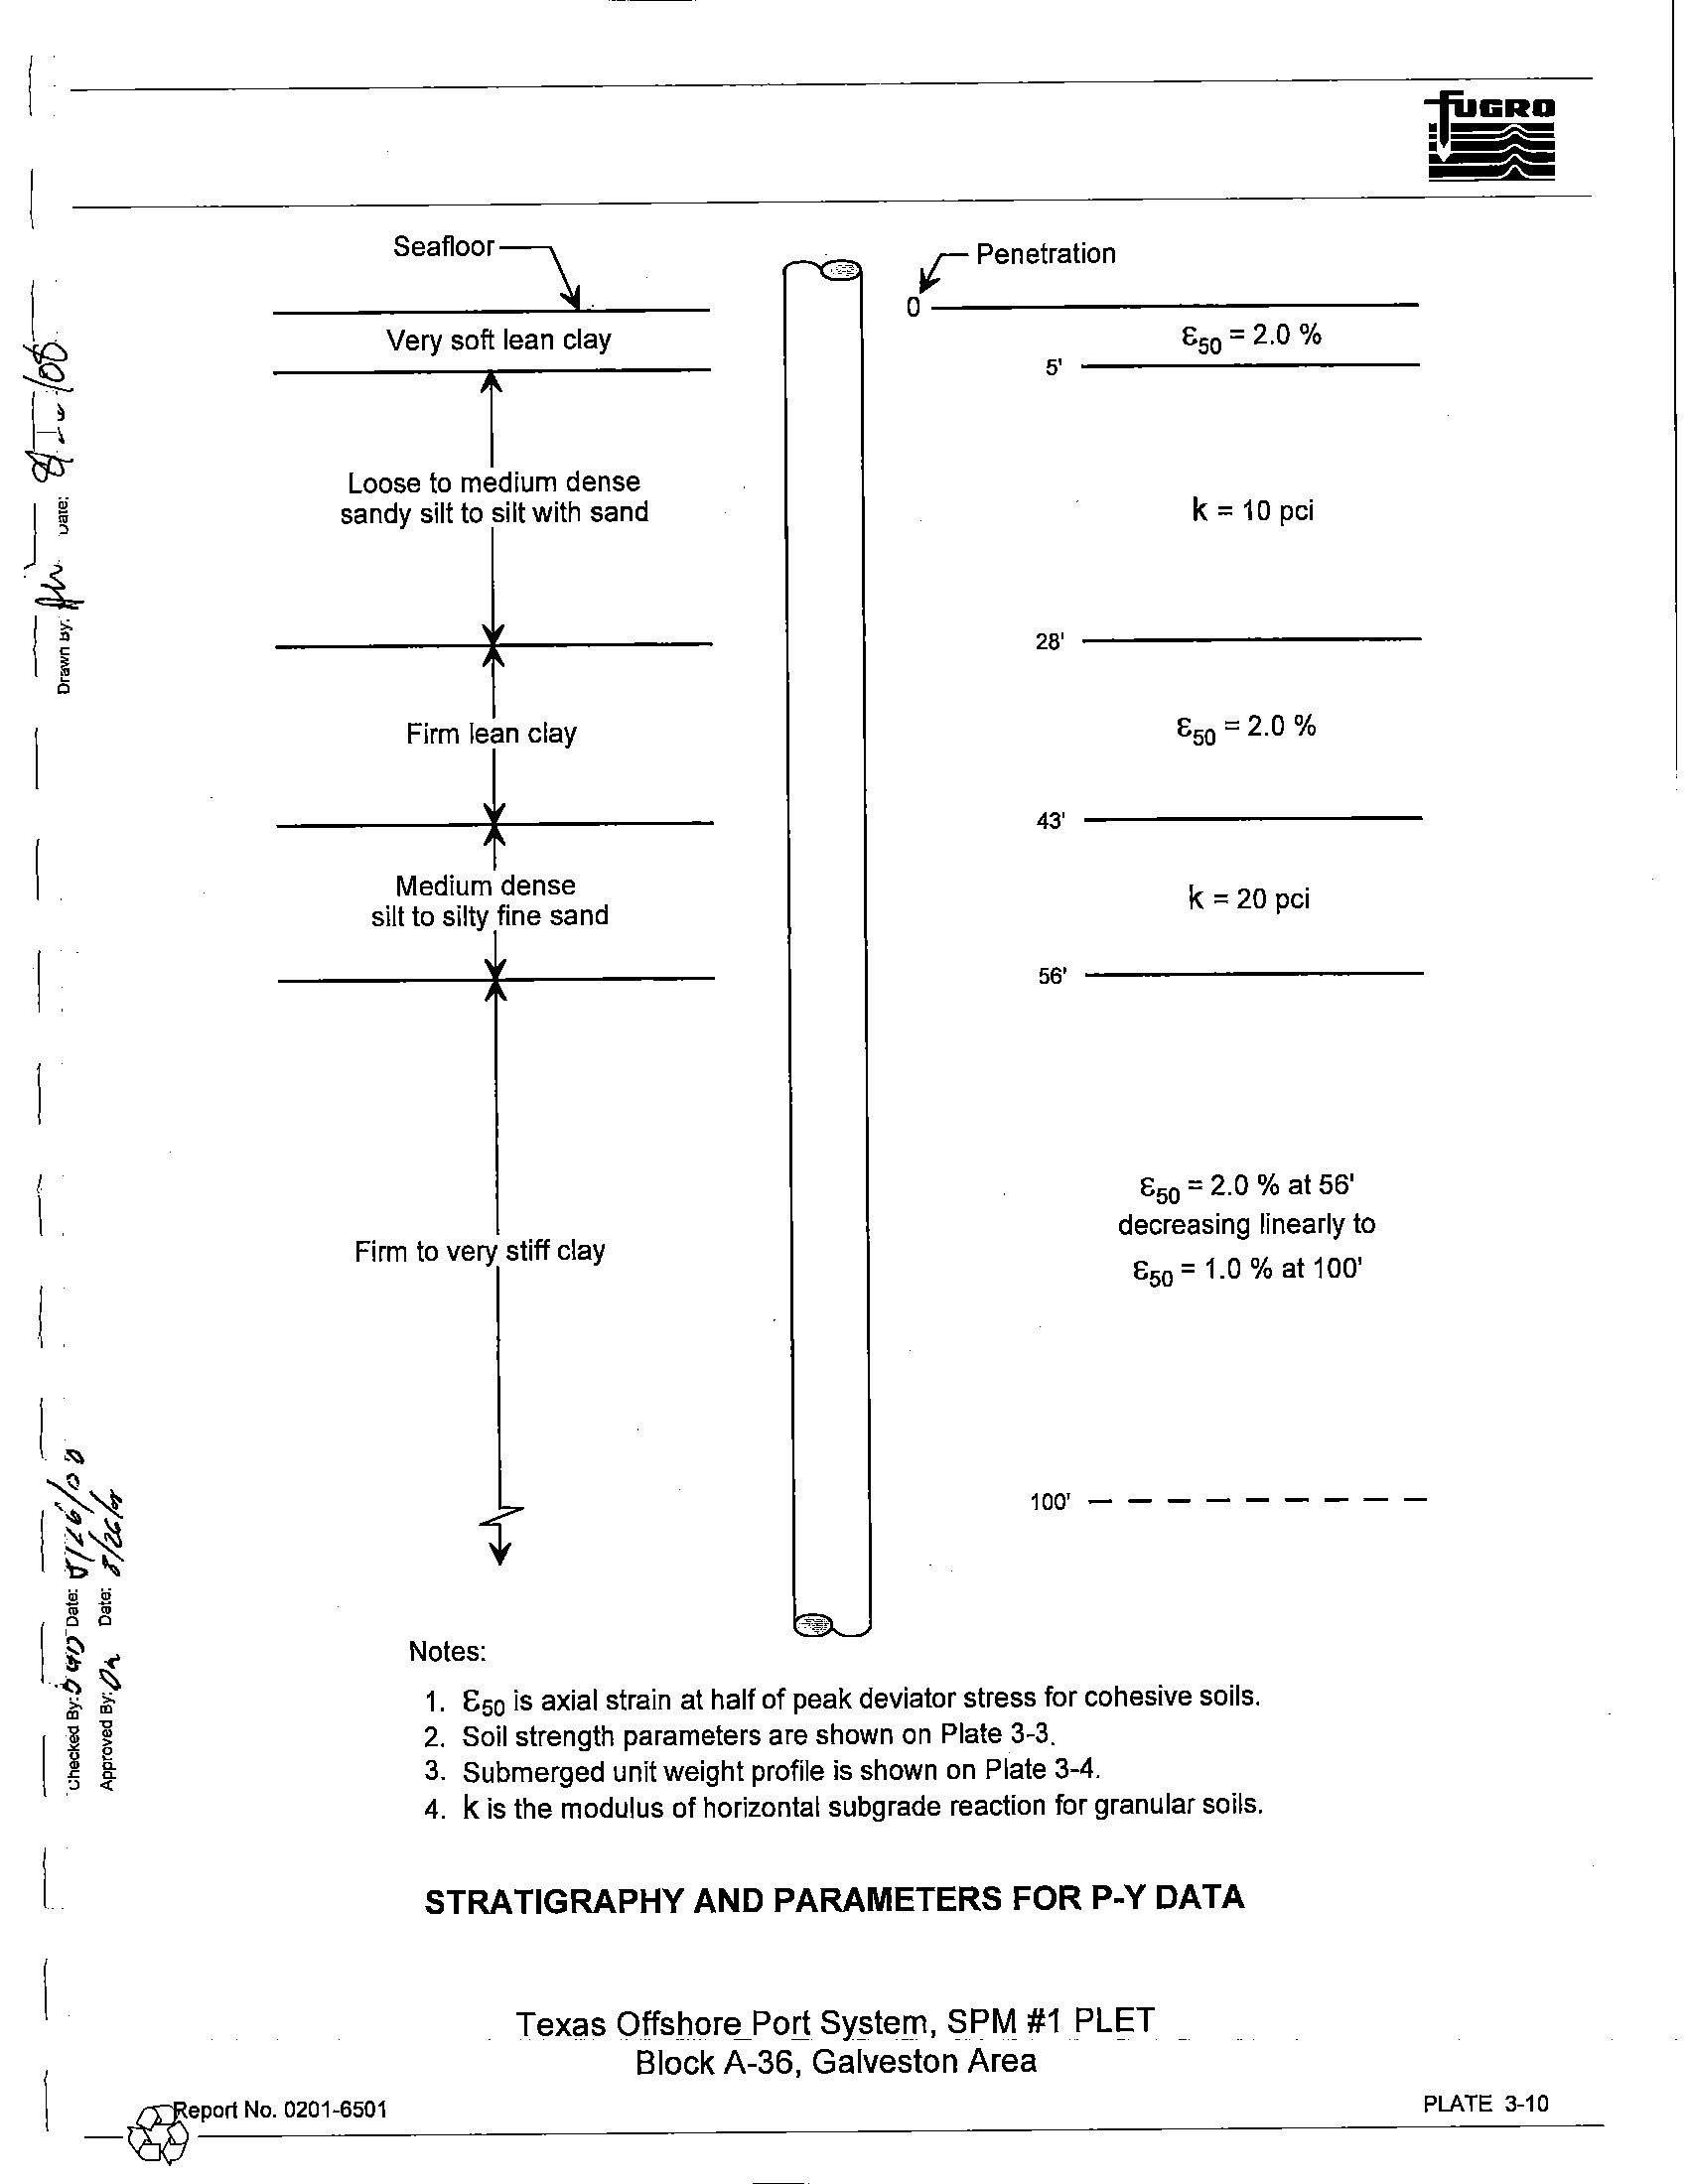
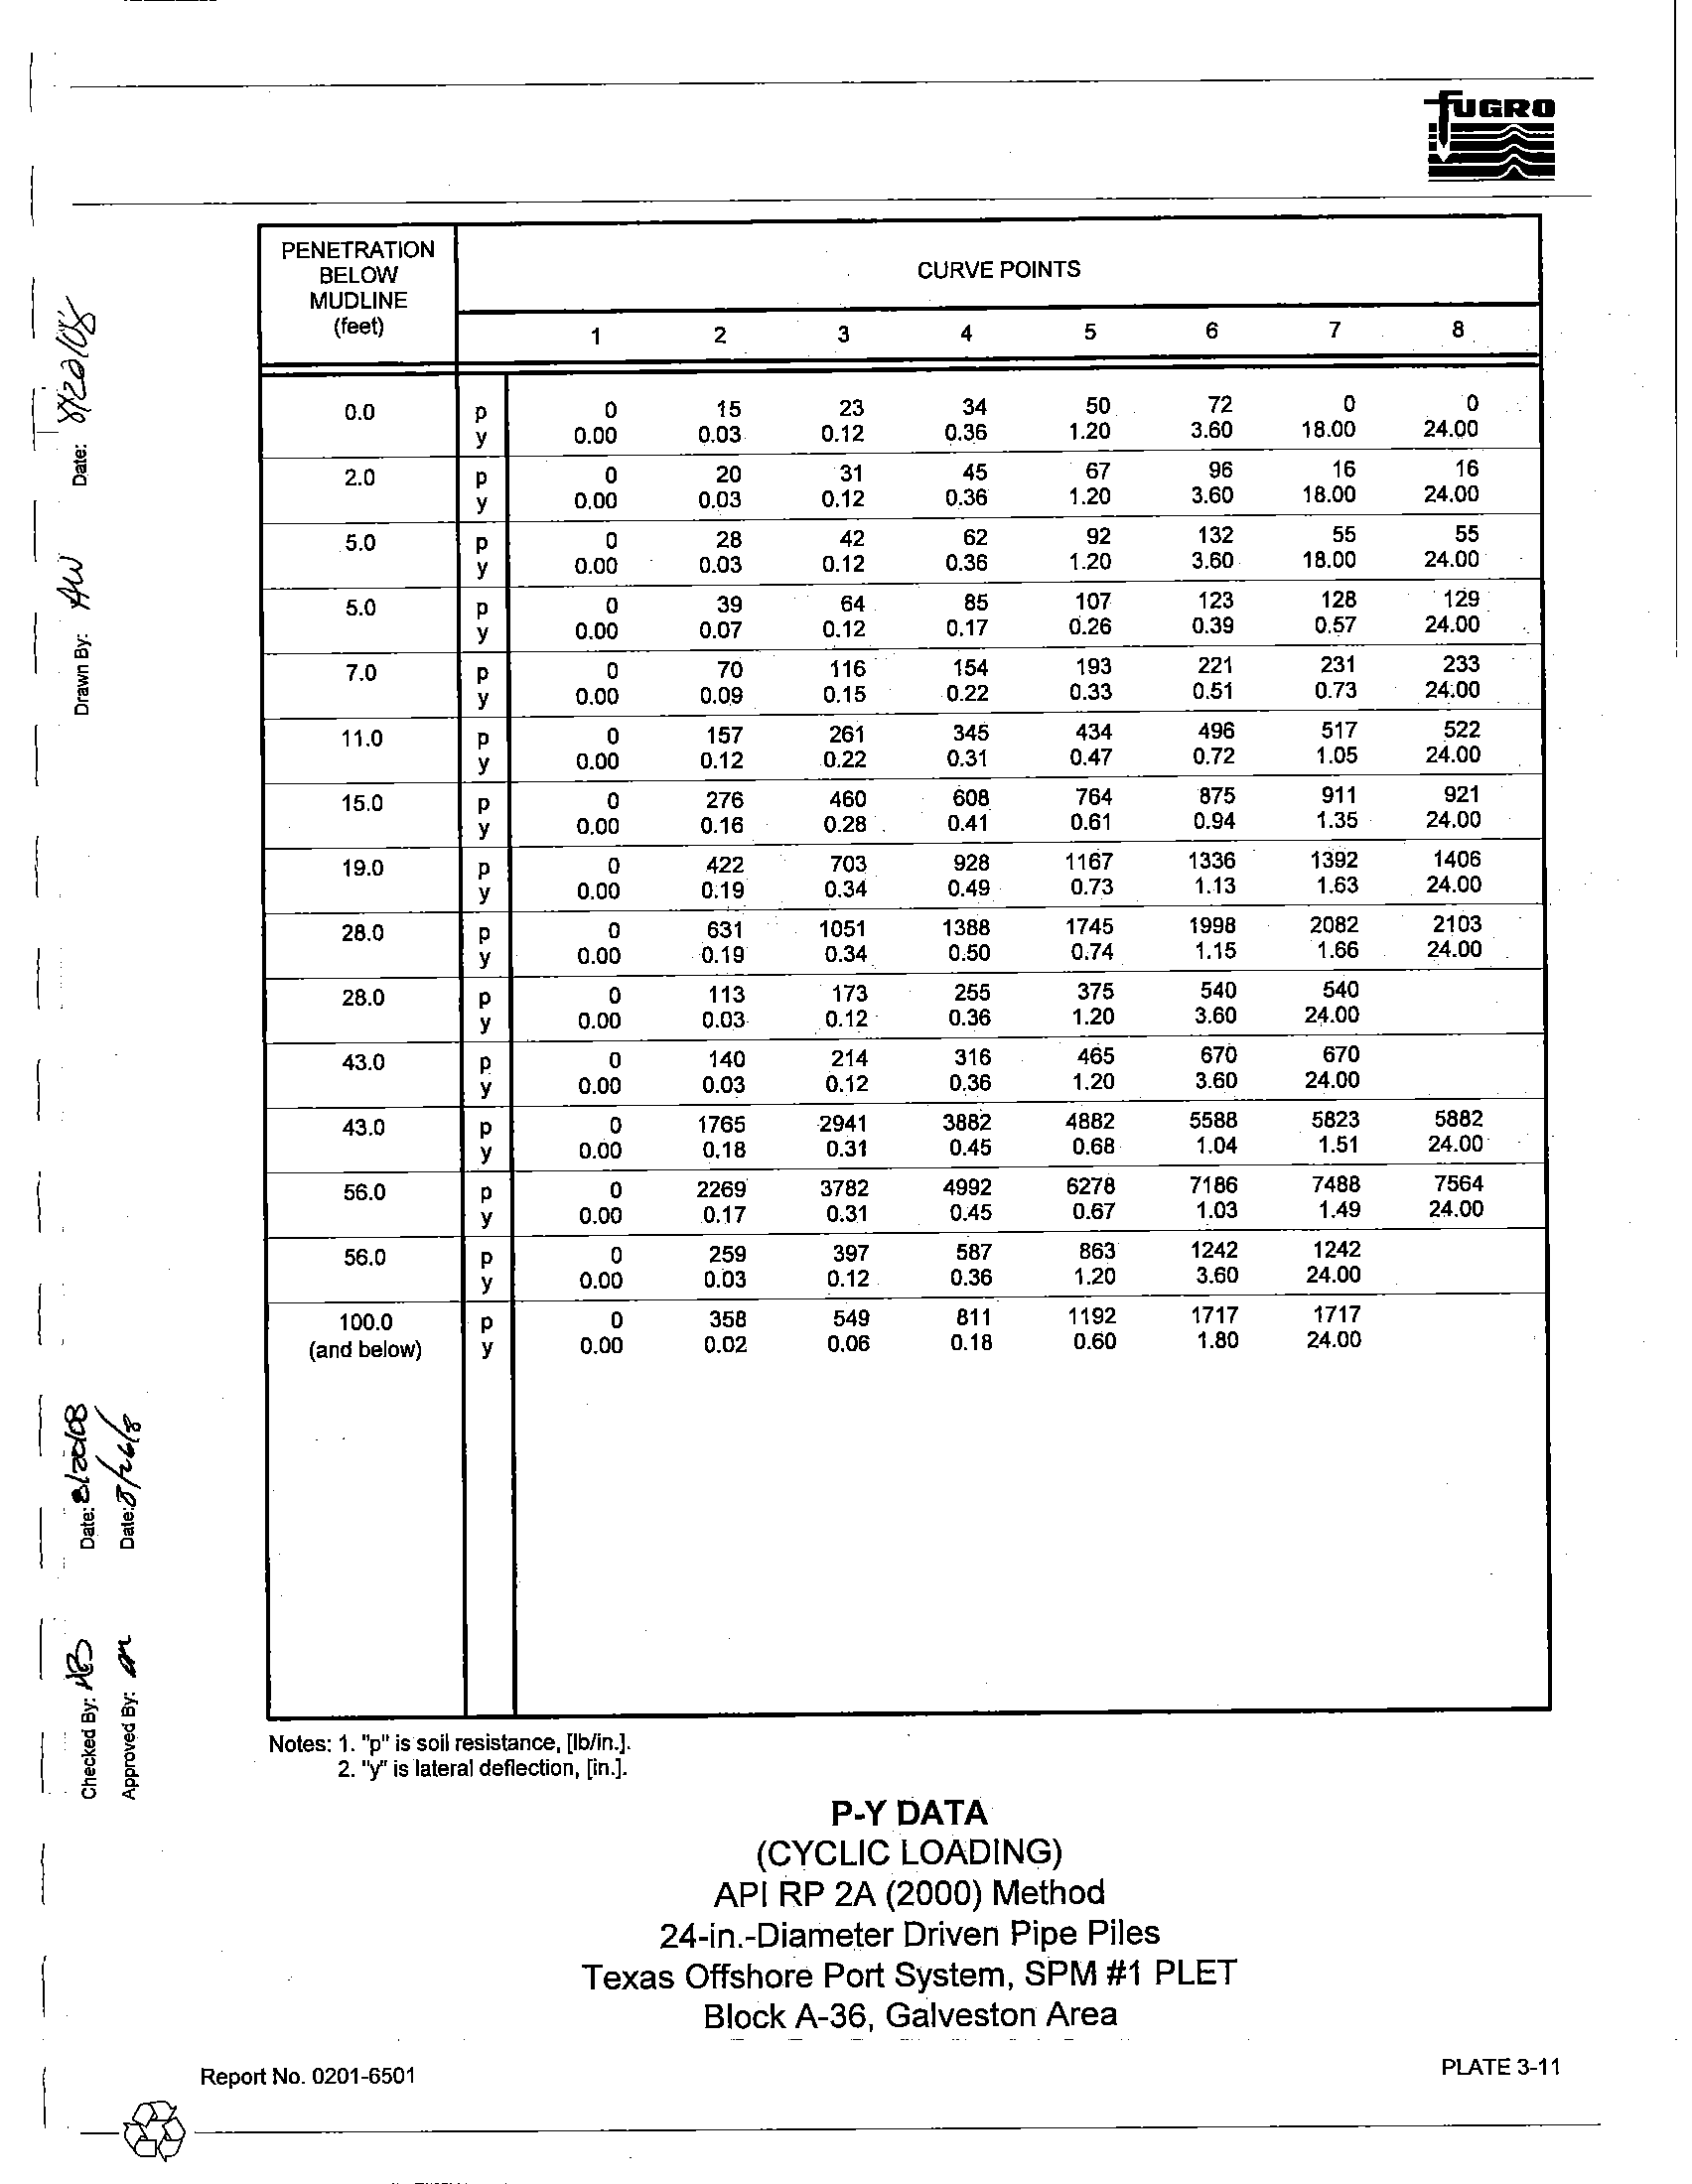
3.1.3.2 Lateral Pile Design Data
The soil resistance-pile deflection (p-y) characteristics of the soils at the boring location were
developed for individual 24-in.-diameter driven pipe piles. These data may be used
in lateral load analyses
of driven piles, conductors and caissons.
The p-y data for cyclic loading were developed to 100-ft
penetration using procedures that have been outlined
in API RP 2A and briefly explained in Appendix B.
The stratigraphy and parameters used to develop the p-y data are presented on Plate 3-10. The p-y data
for 24-in.-diameter driven pipe piles are presented on Plate 3-11. P-y values presented at 100-ft penetration
may
be used for lateral load analyses at greater depths.
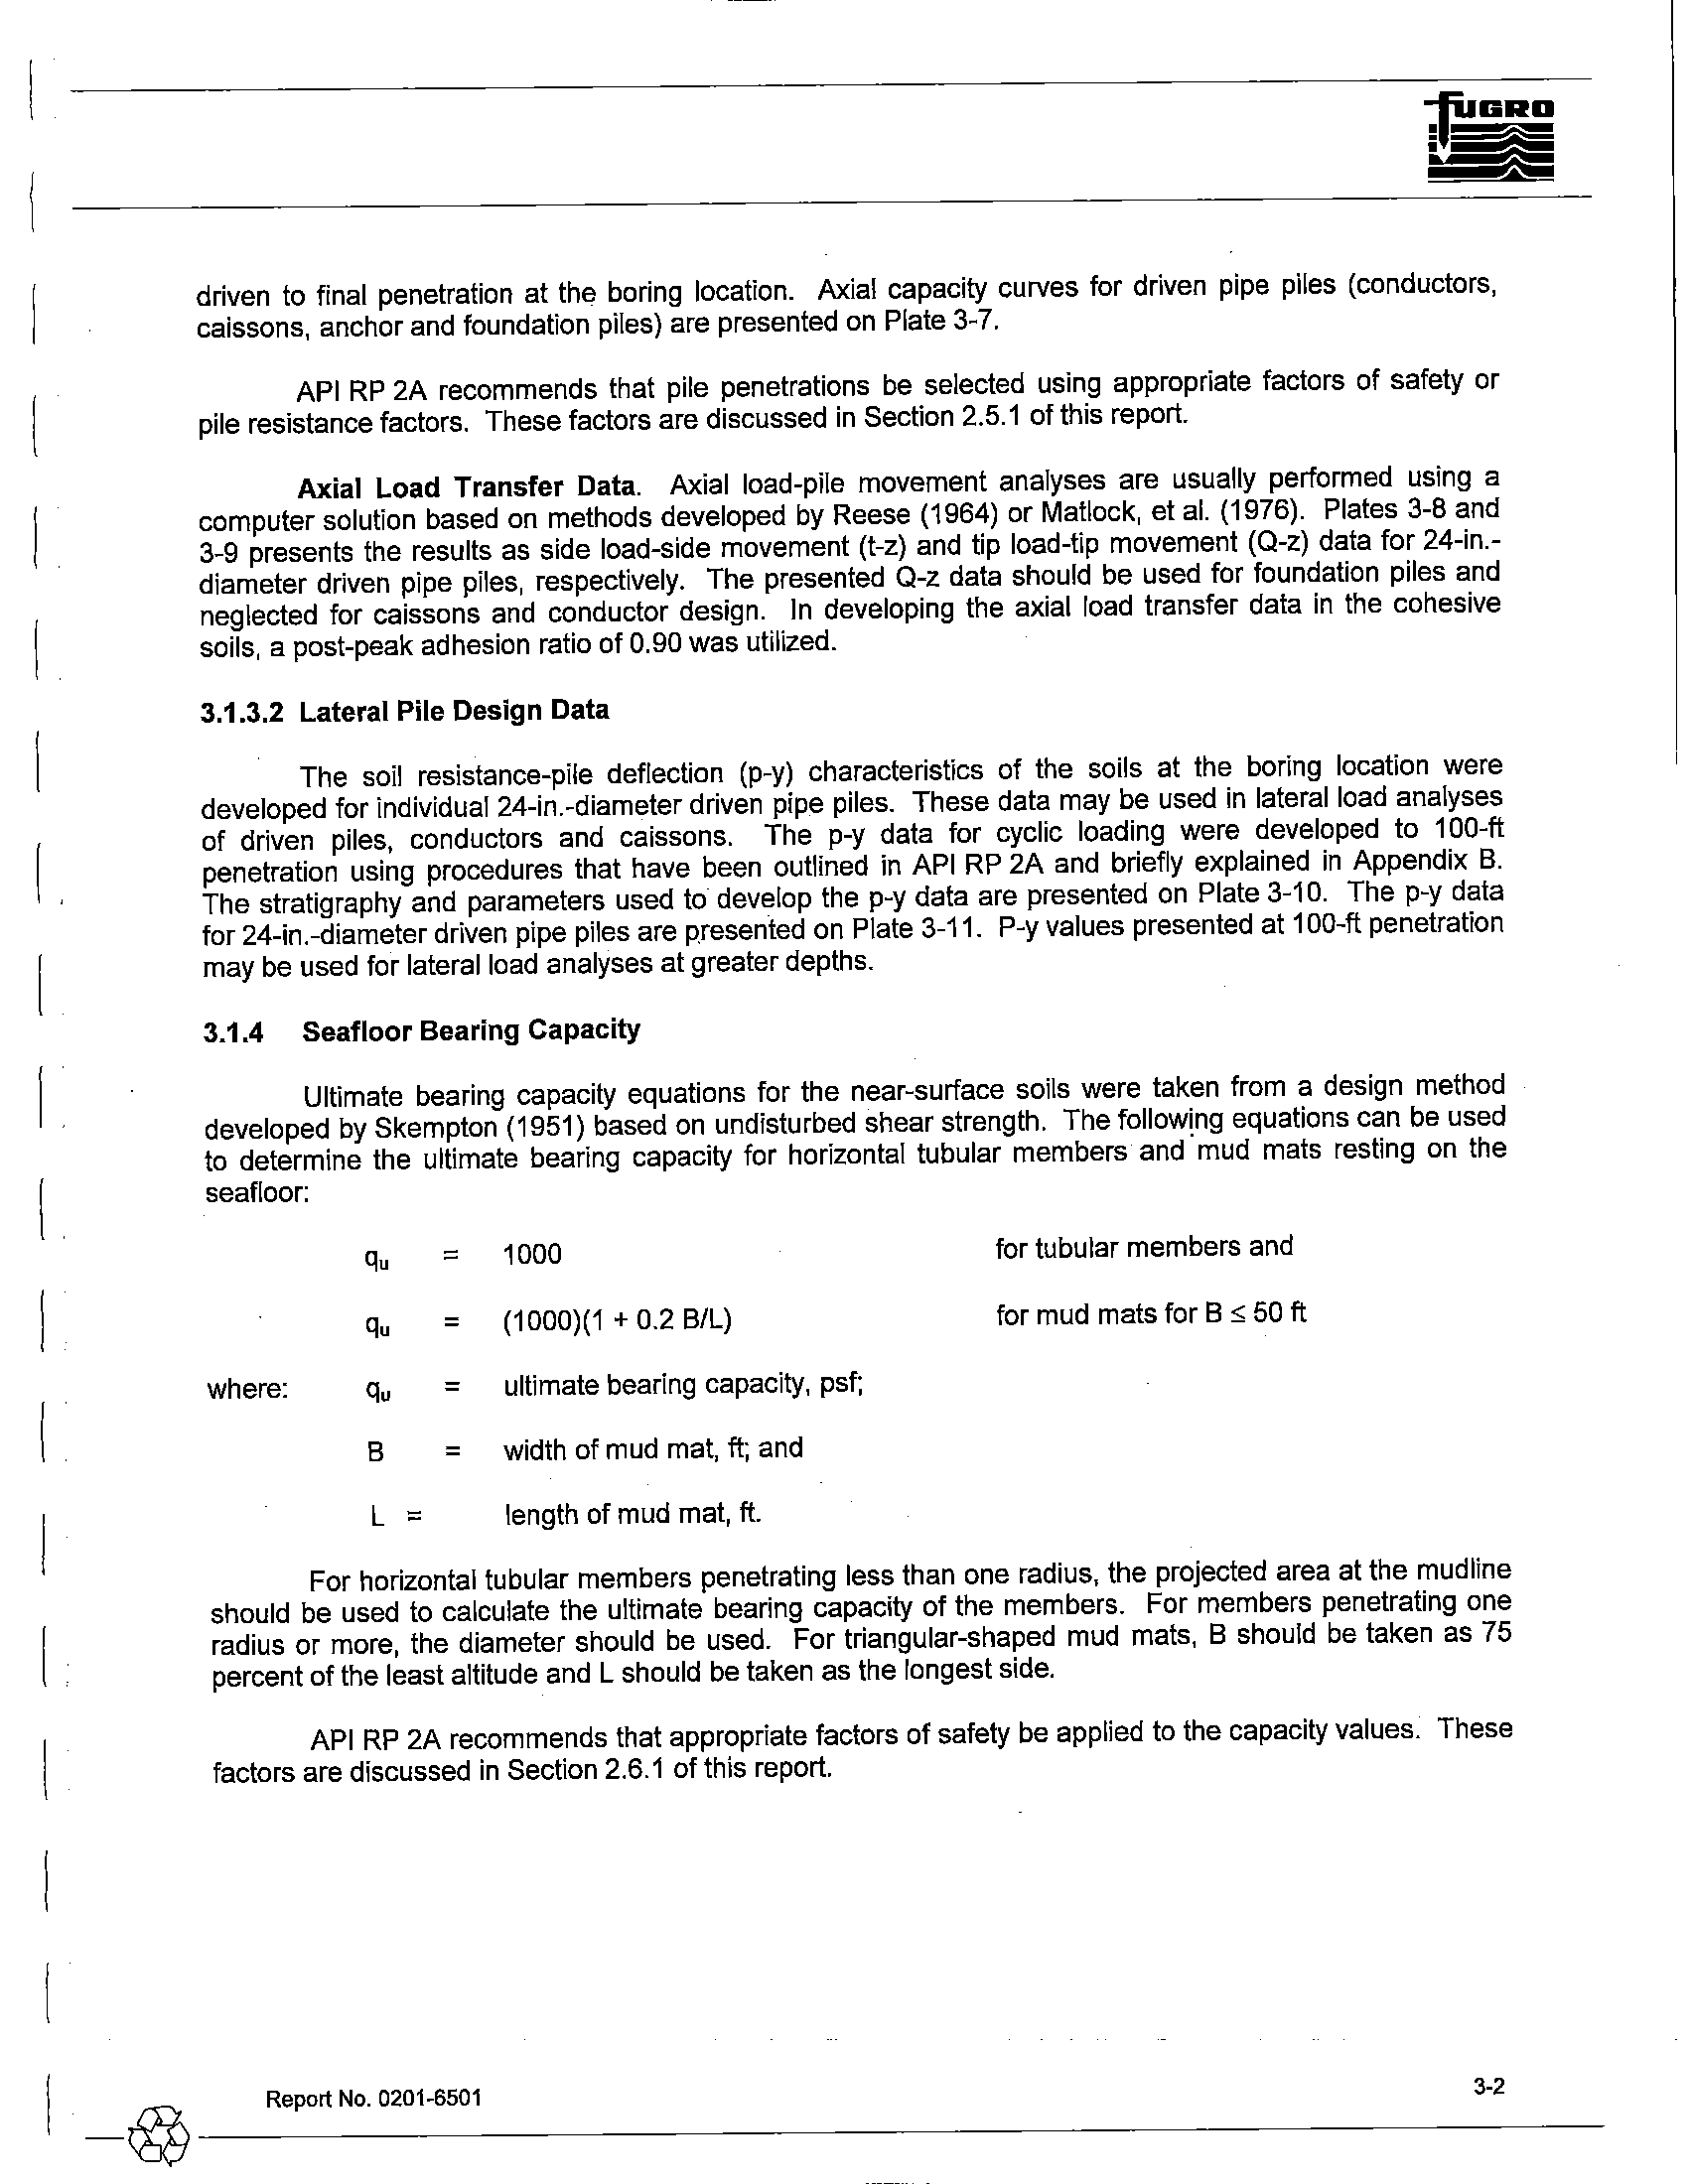
3.1.4
Seafloor Bearing Capacity
Ultimate bearing capacity equations for the near-surface soils were taken from a design method
developed by Skempton (1951) based
on undisturbed shear strength. The following equations can be used
to determine the ultimate bearing capacity for horizontal tubular members and' mud mats resting on the
seafloor:
qu
=
1000
for tubular members and
qu
=
(1000)(1 + 0.2 B/L)
for mud mats for B
:>
50 ft
where:
qu
=
ultimate bearing capacity, psf;
B
=
width of mud mat, ft; and
L
=
length of mud mat, ft.
For horizontal tubular members penetrating less than one radius, the projected area at the mud line
should be used to calculate the ultimate bearing capacity of the members. For members penetrating one
radius or more, the diameter should
be used. For triangular-shaped mud mats, B should be taken as 75
percent
of the least altitude and L should be taken as the longest side.
API
RP 2A recommends that appropriate factors of safety be applied to the capacity values. These
factors are discussed
in Section 2.6.1 of this report.
I __
~
_____
Re_p_o_rt_N_O_.O_2_01_-_65_0_1___________________________________________________________3_-2______
I
@
D-'T:~
rr- - - - -,.
" -
Date,
f, W"I;.
x
=
3,276,615'
IDENTIFICATION TESTS,
[%1
Y =265,270'
BLOW
20
.0
60
80
UNDRAINED SHEAR STRENGTH
COUNT
[ksij
Texas South Central Zone Coordinates
SUBMERGED UNIT WEIGHT, [kef]
-r-'~
;0
ro
0
"0
a
"-
Z
?
0
<l>
~
5
:<
<.n
SEAFLOOR AT EL. - 112'
0.03
0,04
0.05
0.06
0.2
0.'
0.6
0.8
~
VERY SOFT OLIVE GRAY LEAN CLAY
WOH.
00
-with many sand pockets and few shell fragments
+--
-----fl
~
[
I
102'
00'
o
-with sand and 511t pockets and a
few
silt seams
WOH
0
0+•
at 3'
+--
---..
•
0
15.0'
LOOSE TO MEDIUM DENSE GRAY SANDY
SILT
TO SILT WITH SAND
,
•
0
-greenish gray, with a few clay seams, S'
to
10'
•
o
5
10
'-
...
-motUed with brownish yellow at 10'
20
10
'<if
~
...
-with mica and a few shell fragments at 13'
12
•
.0
...
16
~
...:
0
15
0
'iii
Q)
(/)
~
20
a;
ro
'- :-:
-with a few clay pockets and shell fragments
II ..:
below 15'
,
•
•
0
,
-
•
.0
15
...:
0
0
0=
Q)
ro
(/)
20
a;
ro
~
c
0
Q)
~
25
c
Q)
tL
10
-
r---
<28.0't
FIRM OLIVE GRAY LEAN CLAY
12
0
c
.2
25
rn
~
Q)
c
Q)
tL
30
I-
-with sand at 28'
;
-+e
•
30
35
-
.with many silt pockets to 35'
III
8
!.
00
~
I-
0
...
35
•
-with many sand pockets and a few wood and snell
fragments and sand seams below 38'
10
0
~
+-
....-.
~
+
SAMPLING TECHNIQUES
CLASSIFICATION TESTS
STRENGTH TESTS
40
40
Number ef blews ef a 175-lb weight (hammer) dropped approldmately 5 file produce a
.,.
SOLUBILITY IN HCL,
[%]
@
POCKET PENETROMETER (PP)
maximum ef24 In. of penetration of a 2.25-in.-OD, 2.125-in.-ID thin-walled lube
•
PERCENT PASSING -200 SIEVE, [%1
•
TORVANE (TV)
~
sampler. "PUSH" denotes a 3.00-ln.-OD, 2.83-in.-ID thin-walled tube sampler was
•
WATER CONTENT (W),
[%]
¢>
REMOTEVANE(RV)
advanced 24 in. with !he weight efthe drill string. "WOW denotes a 2.S0-ln.-OD,
0
SUBMERGED UNIT WEIGHT (SUW)
•
MINIATURE VANE (MV)
(~
RESIDUAL (MVres) VALUE)
2.125-in._ID liner samplerwas advanced 24 in. with the weight of the hammer.
.&. UNCONSOLIDATED UNDRAINED TRIAXIAL (UU)
C"
~
PLASTIC LIMIT (PL)
LIQUID LIMIT (ll)
+----------------------+
(Open symbots indicate remolded (r) tests)
LOG OF BORING AND TEST RESULTS
Texas Offshore Port System, SPM #1 PLET
Block A-36, Galveston Area
---
._-
I
~
Q)
~
..:
0
0
<;::
III
Q)
(J)
;=
0
Q)
In
c
0
:;:::;
~
Q)
c
I.
a.
Q)
iog~
.~~
,.
,;
,.
;;
"
"
~
'"
~
.ii-
.,
>.
u
u
•
•
~
•
0
~
~
~
~
"
«
o
0.0
0.5
Shear Strength Profile, [ksf]
1.0
1.5
2.0
I
~~-.-
1----
--_.-
1--_.-
---
$ =
20°.
B=
5°. N
q
= B.a. !m.,.
=
1.0 kg!, qmax
=
akg!
II
20
2.5
---'-
r----
--_.-
1---'-
---.-
40
60
80
100
120
140
\
III
--_.-
I-L __
---.-
1----
---
$ =
25°,
B=
0°, N
q
= 12.0, !m
= 1.4 kg!, qmax =
60 kg!
IV
~--.-
----
--~-.-
~--.-
---
\
\
V
INote: Roman numerals refer to the stratigraPhY, as
described in the text and on the boring log.
I
------------------
___i_
-----
DESIGN STRENGTH PARAMETERS
Texas Offshore Port System, SPM
#1 PLET
Block A-36, Galveston Area
I
_@
Report No. 0201.6501
PLATE
3.3
i
[
[
I
I
I~
I-'~
c
!
I
I~
c
~
"'"
Q)
~.
..:
0
0
<;::::
«l
Q)
(J)
..Q
:::
Q)
aJ
c
0
:;:;
«l
J:l
(])
c
Q)
0...
Submerged Unit Weight, [kef]
o
000
O~
OW
000
008
I
010
20
40
60
80
100
120
140
I
f----------
-
--~
---
II
f----.-
---~
---
'-------
-----
Il!
r---'-
----
--- ---.--
---
I
Not.: Roman numerals refer to the straligraphy as
V
IV
described in the text and on the boring log.
f------------~-
---'
---
---
V
------------
--
--~-
------
------
DESIGN SUBMERGED UNIT WEIGHT
Texas Offshore Port System, SPM
#1
PLET
Block A-36 , Galveston Area
[
_~_R-e-po-rt-N-0.-O-20-1--65-0-1~----------------------------------------
_____
P~
__
TE_34
_____
I~
I-~
o
~
I~
I
I
I
~
.ii-
0
Jl
~
M
0
~
"'
'"
0
•
e
>
~
«
~
'iii
~
..:
o
'lij
Ql
C/)
~
Ql
In
Unit Skin Friction, [ksf]
0.0
0.5
1.0
1.5
2.0
2.5
O~----~------~-------r------~------'
I
-_._------_._--_.- --_.-
II
20~~*---~-------+--------Y-~--~~------~
~
-\->-.....\1- ------------. ---.-.-, - - --
\
III
40~~--~----~----~~--+---~
--_._-
\
._~.-
-
---.---~===--==- =~=
60
5
80
1------l__----l__-+-~l__----l__---__1
Qi
~
c:
Ql
0..
v
100~------~-------+------~Y-------~------~
.
1. Roman numerals refer to the stratigraphy as
described in the text and on the boring log.
Notes:
\
120~_2._T_en_$iO_n_an_d~oo_m_pre_s_sio_n_cu_w_.s_oo~in_cid_._.---l--~.---l-----~
140
1---------------------- -------
UNIT SKIN FRICTION
API
RP
2A (2000) Method
Texas Offshore Port System, SPM
#1 PLET
Block A-36, Galveston Area
PLATE 3-5
I
Report No. 0201.6501
._@-----------
[ r
[
r
•
$.~
.~i-
;;
fi
1ii
0
0
[
r~
~
m
'"
£;
[
~
~
jj
•
•
e
>
•
~
~
~
0
«
Unit End Bearing, [ksf]
o
o
10
20
30
40
1E
~
..:
o
20
40
0::
60
C\l
en
Q)
:w
co
~
§
80
""
~
Q)
c
a.
Q)
100
120
140
-----
---
---.-
,----
\
\
,
"-
'<',
f--
f--
f----
1-------
-
---.-
,----
/
~-
~
Notes:
1. Roman numerals refer to the stratigraphy as
described in the text and on the boring log.
2. Dashed line represents equivalent unit end
bearing available from frictional resistance
of soil plug inside the indicated pile size.
3. End bearing component is neglected for
caissons and conductors.
.
___L_
------ ------
UNIT END BEARING
API RP 2A (2000) Method
I
---
II
---
III
---
IV
--
V
.
.
-----
Texas Offshore Port System, SPM #1 PLET
Block A-36, Galveston Area
50
1 __
~_R_e_po_rt_N_O
___
02_0_1_-6_50_1____________________________________________________________P_LA
__
TE__
3-_6____
I
\
I
I~
;;,
'"
~
•
~
•
u
~
"
~
;;,
'"
~
~
~
~
'"
if
~
i....:-
a
20
40
iii
60
ID
(j)
"iii
~
III
5
80
~
Q)
c:
a.
ID
100
120
140
Ultimate Axial Capacity, [kips]
. 200
400
600
800
1000
I
,,--_.-
1----
--_.-
r---.~
_._-
Note: Roman numerals refer to the stratigraphy as
,
described in the
text
and on the boring log.
,
-- Compression for piles
-
-
Tension for piles, or tension and compression
II
: I
for caissons and conductors
\
f-"{ -.-.-
1----
---.-
r---.-
---
\\
III
~~
1----
---.-
r---.-
---
.
\
D
IV
--
..
-..;~
\
1----
--_.-
r----
---
,
I'
\
.
\
\
"\
,"\
~
\
V
~~
~
"-
.
"~
1------
------------
------'
"-
~---
-'-
ULTIMATE AXIAL CAPACITY
API RP 2A (2000) Method
24-in."Diameter Driven Pipe Piles
Texas Offshore Port System, SPM #1 PLET
Block A-36, Galveston Area
I
_~_R_e_po_rt_N_O._02~O~1-~65~01
_________________________________
~P_~
__
TE_3_-7___
I~
[-~
;;
"
•
.,
;:.
c
~
"
[
I
~
i
;;
.!i
"
•
"
•
~
>.
..
~
PENETRATION
BELOW
CURVE POINTS
MUDLINE
(feel)
1
2
3
4
5
6
0.0
I
0.00
0.00
0.00
0.00
0.00
0.00
z
0.00
0.04
0.07
0.14
0.19
0.24
1.0
I
0.00
0.02
0.04
0.05
0.06
0.07
z
0.00
0.04
0.07
0.14
0.19
0.24
4.0
I
0.00
0.03
0.05
0.07
0.09
0.10
z
0.00
0.04
0.07
0.14
0.19
0.24
5.0
I
0.00
0.03
0.06
0.08
0.10
0.11
.
z
0.00
0.04
0.07
0.14
0.19
0.24
5.0
I
0.00
0.05
0.05
z
0.00
0.10
24.00
28.0
I
0.00
0.35
0.35
z
0.00
0.10
24.00
28.0
I
0.00
0.14
0.23
0.34
0.41
0.45
z
0.00
0.04
0.07
0.14
0.19
0.24
42.0
I
0.00
0.18
0.31
0.46
0.55
0.61
z
0.00
0.04
0.07
0.14
0.19
0.24
43.0
I
0.00
0.19
0.31
0.46
0.56
0.62
z
0.00
0.04
0.07
0.14.
0.19
0.24
43.0
I
0.00
0.73
0.73
z
0.00
0.10
24.00
56.0
I
0.00
0.94
0.94
z
0.00
0.10
24.00
56.0
I
0.00
0.29
0.48
0.72
0.87
0.96
z
0.00
0.04
0.07
0.14
0.19
0.24
88.0
I
0.00
0.40
0.67
1.00
1.20
1.33
z
0.00
0.04
0.07
0.14
0.19
0.24
119.0
I
0.00
0.50
0.84
1.25
1.50
1.67
z
0.00
0.04
0.07
0.14
0.19
0.24
131.0
I
0.00
0.54
0.90
1.35
1.63
1.81
z
0.00
0.04
0.07
0.14
0.19
0.24
Notes: 1. "t" is mobilized soil-pile adhesion, [ksf}.
2.
liZ"
is axial pile displacement, [in.}.
3. Data for tension and compression coincide.
AXIAL LOAD TRANSFER DATA
(T-Z DATA)
API
RP
2A (2000) Method
24-in.-Diameter Driven Pipe Piles
Texas Offshore Port System, SPM
#1 PLET
Block A-36, Galveston Area
7
8
0.00
0.00
0.48
24.00
0.06
0.06
0.48
24.00
0.09
0.09
0.48
24.00
0.10
0.10
0.48
24.00
0.41
0.41
0.48
24.00
0.55
0.55
0.48
24.00
0.56
0.56
0.48
24.00
0.87
0.87
0.48
24.00
1.20
1.20
0.48
24.00
1.50
1.50
0.48
24.00
1.63
1.63
0.48
24.00
\
Report No.
0201-6501
PLATE 3-8
-@--------------------------------
I~
~~
11
0
•
I
I~
>.
m
c
0
~
I
I
,~
l'iti
"-.!
~
..
;;
M
0
"
0
•
~
m
>.
u
~
PENETRATION
BELOW
CURVE POINTS
MUDLINE
(feet)
1
2
3
4
5
56.0
Q
0
8
16
24
29
z
0.00
0.05
0.31
1.01
1.75
131.0
Q
0
13
27
40
48
z
0.00
0.05
0.31
1.01
1.75
Notes: 1. "a" is mobilized end bearing capacity, [kips}.
2. "z" is axial tip displacement, [in.].
AXIAL LOAD TRANSFER DATA
(Q-Z DATA)
API RP 2A (2000) Method
24-in.-Diameter Driven Pipe Piles
Texas Offshore Port System, SPM
#1 PLET
Block A-36, Galveston Area
6
7
33
33
2.40
24.00
54
54
2.40
24.00
I __
~_R_e_po_rt_N_O_.0_20_1_-6_50_1
________________________________________________________
P_~_T_E_3_-9
___
Firm to very stiff clay
8
50
=
2.0 % at 56'
decreasing linearly to
8
50
=1.0
% at
100'
100' -
-
-
-
-
-
-
-
-
_@eport No. 0201-6501
Notes:
1.
850
is axial strain at half of peak deviator stress for cohesive soils.
2. Soil strength parameters are shown on Plate 3-3.
3. Submerged unit weight profile is shown on Plate 3-4.
4. k is the modulus of horizontal subgrade reaction for granular soils.
STRATIGRAPHY AND PARAMETERS FOR P-Y DATA
Texas Offshore_Pol"! System, SPM #1
PLET
Block A-36, Galveston Area
PLATE
3-10
fJ
"
>-
"'
c
~
[~
[
"
~
..
~
!'<i
;;
•
;;;
•
"
"
,
>-
>-
"'
"'
~
PENETRATION
BELOW
CURVE POINTS
MUDLINE
(feet)
1
2
3
4
5
6
0.0
P
0
15
23
34
50
72
y
0.00
0.03
0.12
0.36
1.20
3.60
2.0
P
0
20
31
45
67
96
Y
0.00
0.03
0.12
0.36
1.20
3.60
5.0
P
0
28
42
62
92
132
Y
0.00
0.03
0.12
0.36
1.20
3.60
5.0
P
0
39
64
85
107
123
Y
0.00
0.07
0.12
0.17
0.26
0.39
7.0
P
0
70
116
154
193
221
y
0.00
0.09
0.15
0.22
0.33
0.51
11.0
p
0
157
261
345
434
496
Y
0.00
0.12
0.22
0.31
0.47
0.72
15.0
P
0
276
460
608
764
875
Y
0.00
0.16
0.28
0.41
0.61
0.94
19.0
P
0
422
703
928
1167
1336
Y
0.00
0.19
0.34
0.49
0.73
1.13
28.0
P
0
631
1051
1388
1745
1998
Y
0.00
0.19
0.34
0.50
0.74
1.15
28.0
P
0
113
173
255
375
540
Y
0.00
0.03
0.12
0.36
1.20
3.60
43.0
P
0
140
214
316
465
670
Y
0.00
0.03
0.12
0.36
1.20
3.60
43.0
P
0
1765
2941
3882
4882
5588
Y
0.00
0.18
0.31
0.45
0.68
1.04
56.0
P
0
2269
3782
4992
6278
7186
Y
0.00
0.17
0.31
0.45
0.67
1.03
56.0
P
0
259
397
587
863
1242
Y
0.00
0.03
0.12
0.36
1.20
3.60
100.0
P
0
358
549
811
1192
1717
(and below)
y
0.00
0.02
0.06
0.18
0.60
1.80
Notes: 1.
"p"
is soil resistance, [Ib/in.].
2.
"'I'
is lateral deflection, [in.].
P-YDATA
(CYCLIC LOADING)
API
RP
2A (2000) Method
24-in.-Diameter Driven Pipe Piles
Texas Offshore Port System, SPM
#1 PLET
Block A-36, Galveston Area
-
-
-
7
8
0
0
18.00
24.00
16
16
18.00
24.00
55
55
18.00
24.00
128
129
0.57
24.00
231
233
.
0.73
24;00
517
522
1.05
24.00
911
921
1.35
24.00
1392
1406
1.63
24.00
2082
2103
1.66
24.00 .
540
24.00
670
24.00
5823
5882
1.51
24.00
7488
7564
1.49
24.00
1242
24.00
1717
24.00
I
Report No. 0201-6501
PLATE 3-11
-~---------------------------------
I
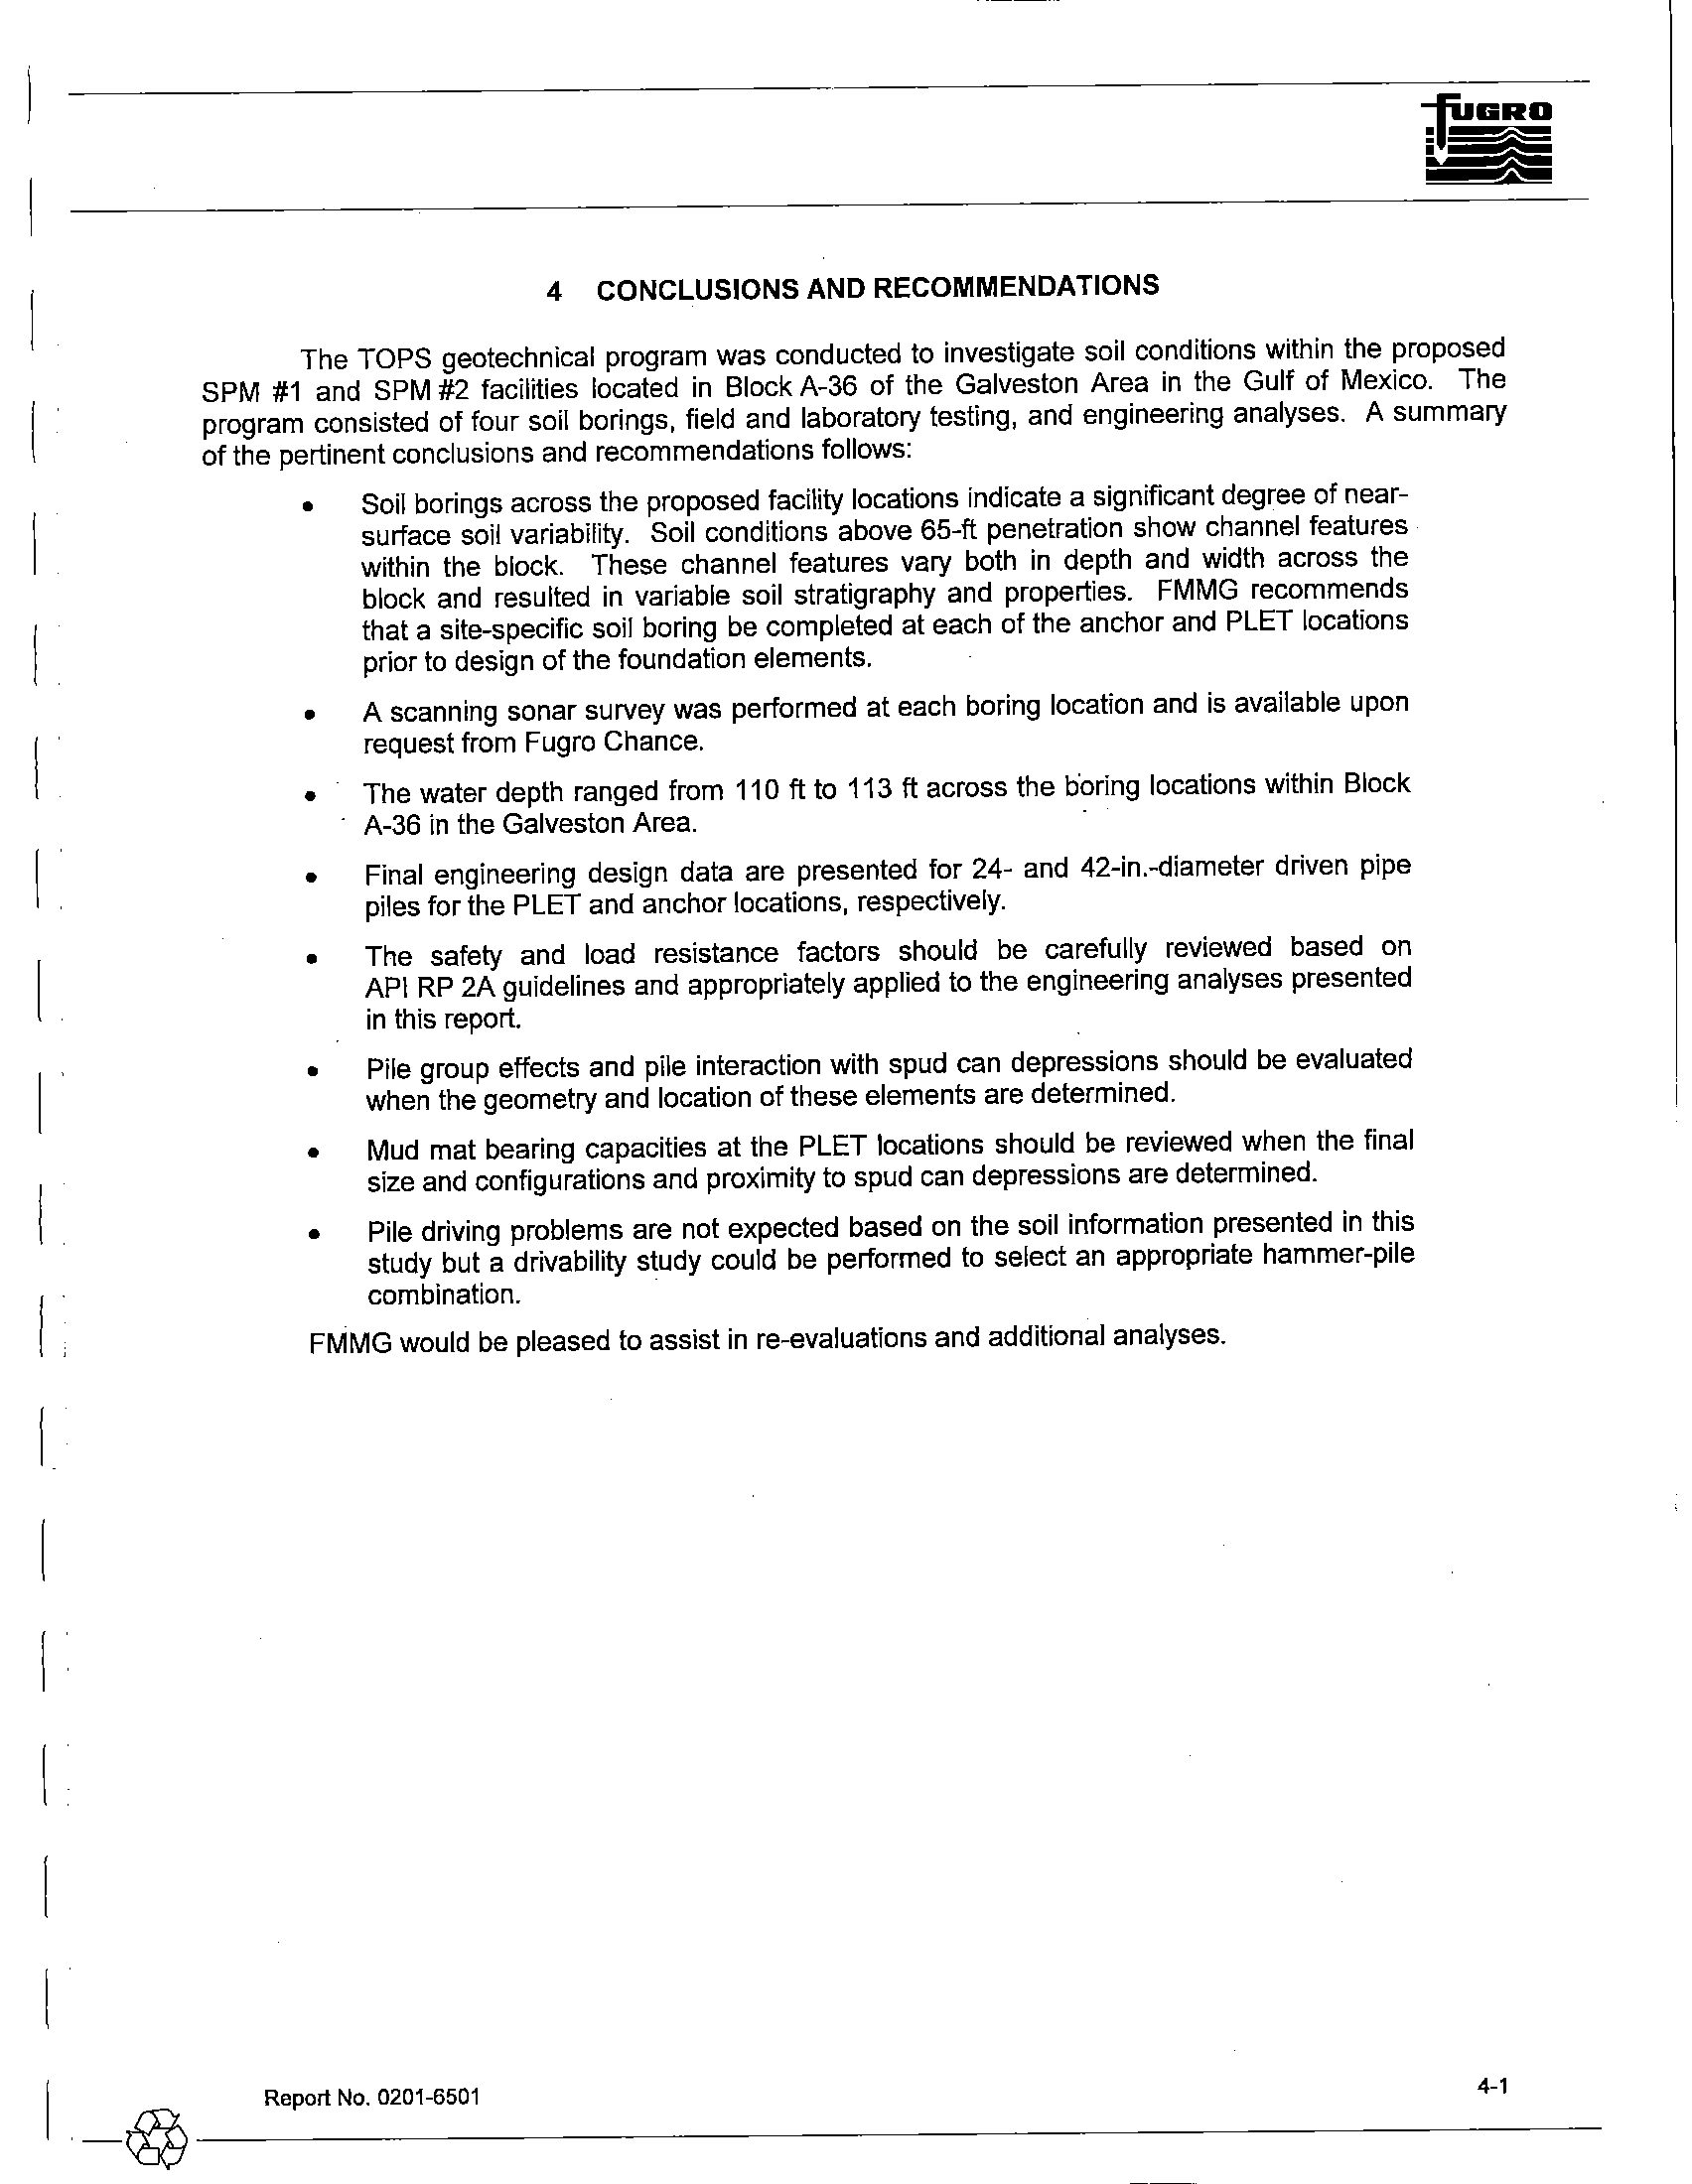
4
CONCLUSIONS AND RECOMMENDATIONS
The TOPS geotechnical program was conducted to investigate soil conditions within the proposed
SPM
#1 and SPM #2 facilities located in Block A-36 of the Galveston Area in the Gulf of Mexico. The
program consisted of four soil borings, field and laboratory testing, and engineering analyses. A summary
of the pertinent conclusions and recommendations follows:
•
Soil borings across the proposed facility locations indicate a significant degree of near-
surface soil variability. Soil conditions above 65-ft penetration show channel features
within the block. These channel features vary both
in depth and width across the
block and resulted in variable soil stratigraphy and properties. FMMG recommends
that a site-specific soil boring
be completed at each of the anchor and PLET locations
prior
to design of the foundation elements.
•
A scanning sonar survey was performed at each boring location and
is available upon
request from Fugro Chance.
•
The water depth ranged from
110ft to 113 ft across the boring locations within Block
A-36
in the Galveston Area.
•
Final engineering design data are presented for 24- and 42-in.-diameter driven pipe
piles for the PLET and anchor locations, respectively.
•
The safety and load resistance factors should be carefully reviewed based on
API
RP 2A guidelines and appropriately applied to the engineering analyses presented
in this report.
•
Pile group effects and pile interaction with spud can depressions should
be evaluated
when the geometry and location of these elements are determined.
•
Mud mat bearing capacities at the PLET locations should be reviewed when the final
size and configurations and proximity to spud can depressions are determined.
•
Pile driving problems are not expected based
on the soil information presented in this
study but a drivability study could
be performed to select an appropriate hammer-pile
combination.
FMMG would
be pleased to assist in re-evaluations and additional analyses.
I
Report No. 0201-6501
._@------------
4-1
I ------------------------------------
I'
5
REFERENCES
American Petroleum Institute (1993), Recommended Practice for Planning, Designing, and Constructing
Fixed Offshore Platforms-Load and Resistance Factor Design, API Recommended Practice 2A-LRFD
(RP 2A-LRFD), 1st Ed., API, Washington, D.C.
American Petroleum Institute (2000), Recommended Practice for Planning, Designing, and Constructing
Fixed Offshore Platforms - Working Stress Design, API Recommended Practice 2A-WSD (RP 2A-WSD),
21st Ed., December 2000, API, Washington, D.C.
American Society for Testing and Materials (2008), "Soil and Rock," Annual Book
of ASTM Standards, Vol.
4.08 and 4.09, ASTM,
West Conshohocken, Pennsylvania.
Dennis, N.D. and Olson, R.E. (1983), "Axial Capacity
of Steel Pipe Piles in Clay," Proceedings of the
Conference on Geotechnical Practice
in Offshore Engineering, Austin, April, pp. 370-388.
Fugro Geoservices, Inc. (2008), Archaeological and Hazard Survey Blocks A36 and A37 Galveston Area,
Report No
..2407-1298.
Matlock,
H. (1970), "Correlations for Design of Laterally Loaded Piles in Soft Clay," Proceedings, 2nd
Offshore Technology Conference, Houston, Vol.
1, pp. 577-594.
Matlock, H., Meyer, P.L., and Holmquist, D.V. (1976), "A Program for Discrete-Element Solution
of Axially
Loaded Members with Linear or Nonlinear Supports," A Report to the American Petroleum Institute,
University
of Texas at Austin, Department of Civil Engineering, March.
O'Neill,
MW. and Murchison, J.M. (1983), "An Evaluation of p-y Relationships in Sands," Report PRAC
82-41-1, Prepared for the American Petroleum Institute, Houston, May.
Quiros, G.W., Young, A.G., Pelletier, J.H., and Chan, J.H-C. (1983), "Shear Strength Interpretation for Gulf
of Mexico Clays," Proceedings of the Conference on Geotechnical Practice in Offshore Engineering, Austin,
April, pp. 144-165.
Reese, L.C. (1964), "Load vs Settlement
of an Axially Loaded Pile," Proceedings, Symposium on Bearing
Capacity
of Piles, Roorkee, India.
Skempton, A.W. (1951), "The Bearing Capacity
of Clays," Proceedings, Building Research Congress,
Institute
of Civil Engineers, London, pp. 180-183.
I
Report No. 0201-6501
'-@----------~
5-1
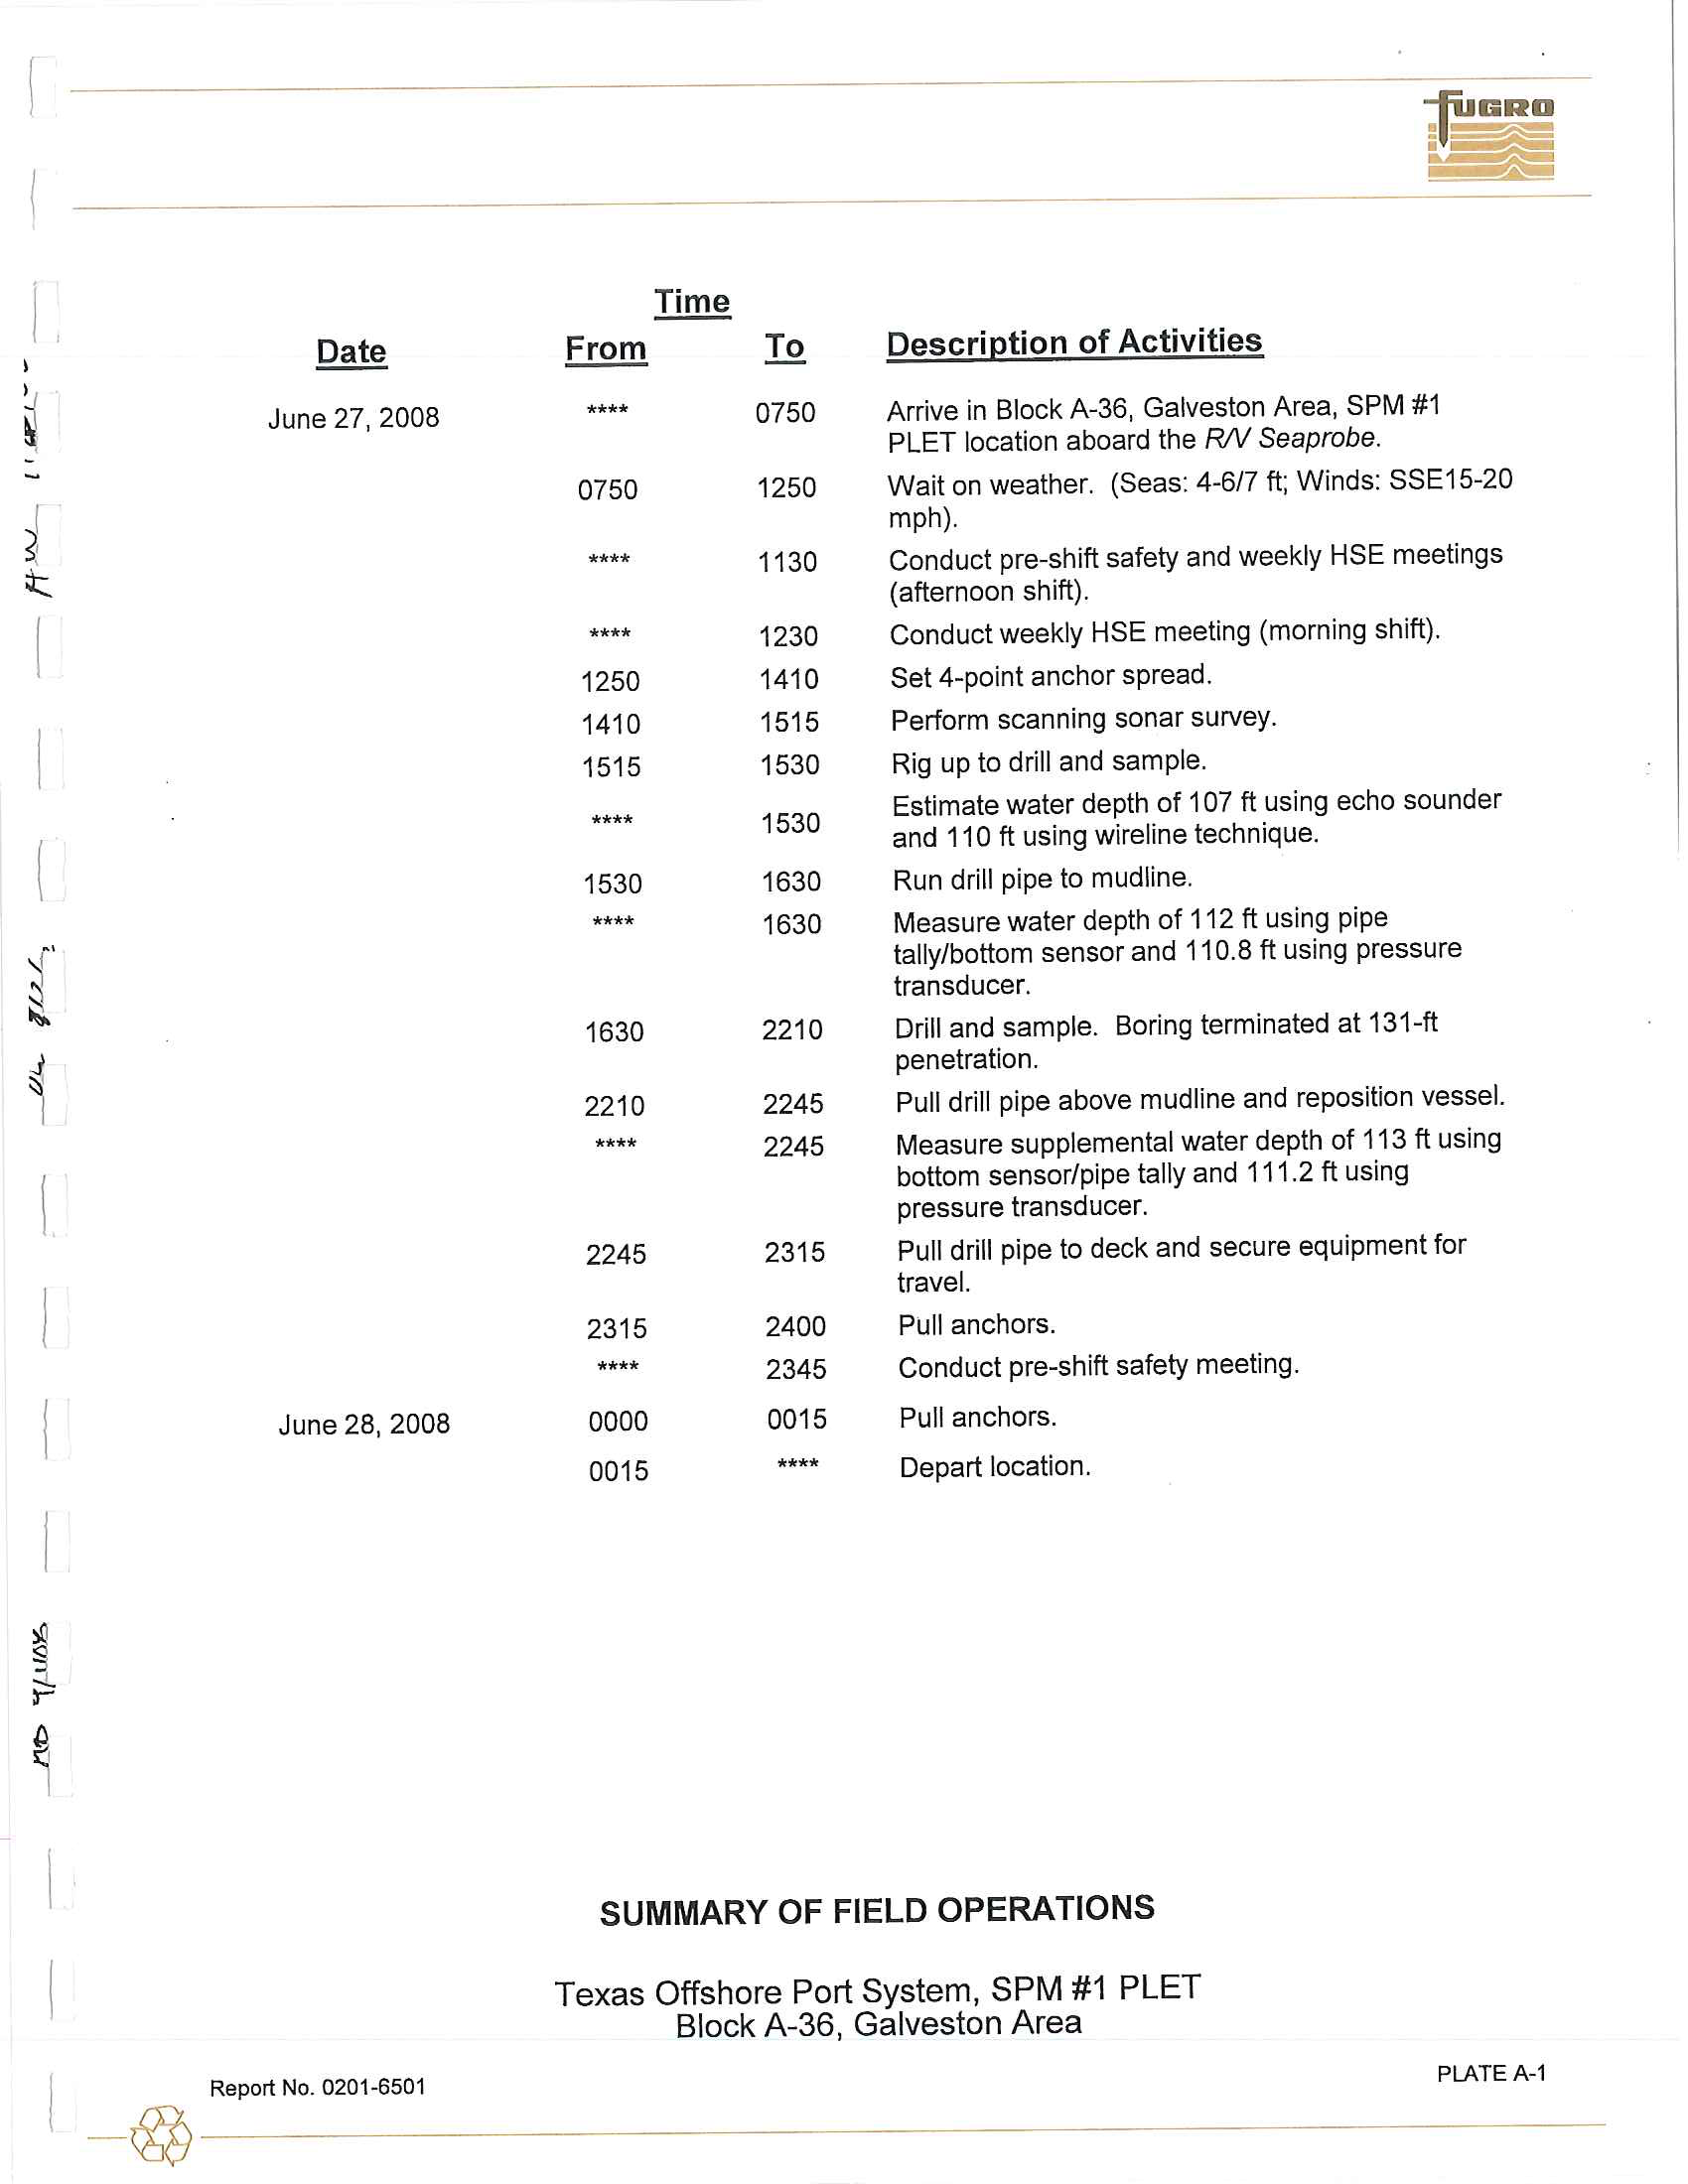
Date
~
~
,
June
27, 2008
~
ol:::.
I
J
~
-.;.
i
June 28,
2008
--
Time
From
To
DescriQtion
of Activities
.*.*
0750
Arrive
in Block A-36, Galveston
Area, SPM
#1
PLET
location
aboard the
RN Seaprobe
.
0750
1250
Wait
on
weather.
(Seas
:
4-6/7
ft
;
Winds
:
SSE15-20
mph)
.
.
*
**
1130
Conduct
pre-shift safety and weekly
HSE meetings
(afternoon
shift).
•
•
••
1230
Conduct
weekly
HSE meeting
(morning shift)
.
1250
1410
Set 4-point anchor
spread.
1410
1515
Perform scanning
sonar survey.
1515
1530
Rig up to drill and sample
.
.."'.
1530
Estimate water depth
of 1
07
ft using echo
sounder
and
110ft using wireline technique.
1530
1630
Run drill p
i
pe to mud line
.
••"'*
1630
Measure water depth of 112 ft using pipe
tally/bottom sensor and
110
.
8 ft using pressure
transducer
.
1630
2210
Drill and sample. Boring terminated at 131-ft
penetration
.
2210
2245
Pu
ll
drill pipe above mudline and reposition vessel.
.*.
"
2245
Measure supplemental
water depth of
113 ft
using
bottom sensor/pipe tally
and
111
.
2
ft using
pressure transducer
.
2245
2315
Pull drill pipe to deck
and
secure equipment for
travel.
2315
2400
Pul
l
anchors
.
•••
•
2345
Conduct pre-shift safety meeting
.
0000
0015
Pull anchors
.
0015
•••
•
Depart location.
SUMMARY OF FIELD OPERATIONS
Texas Offshore Port System, SPM #1
PLET
Block A-36, Galveston Area
-
I
__
~
_
R
_
e
_
po
_
rt
_
N
_
O
_
.
_
O 2
_
0
_
1-
_
65
_
0
_
1
_________________________________________________________
P
_
~
_
T
_
E
_
A
_
-
_
l
___
[
@
;0
,
{!i
o
"
z
?
[;l
:1
in
:1
'"
"U
:;-
~
'"
C
h
ecked By
:
P\
ob
Approved
B
y:
,..?\.
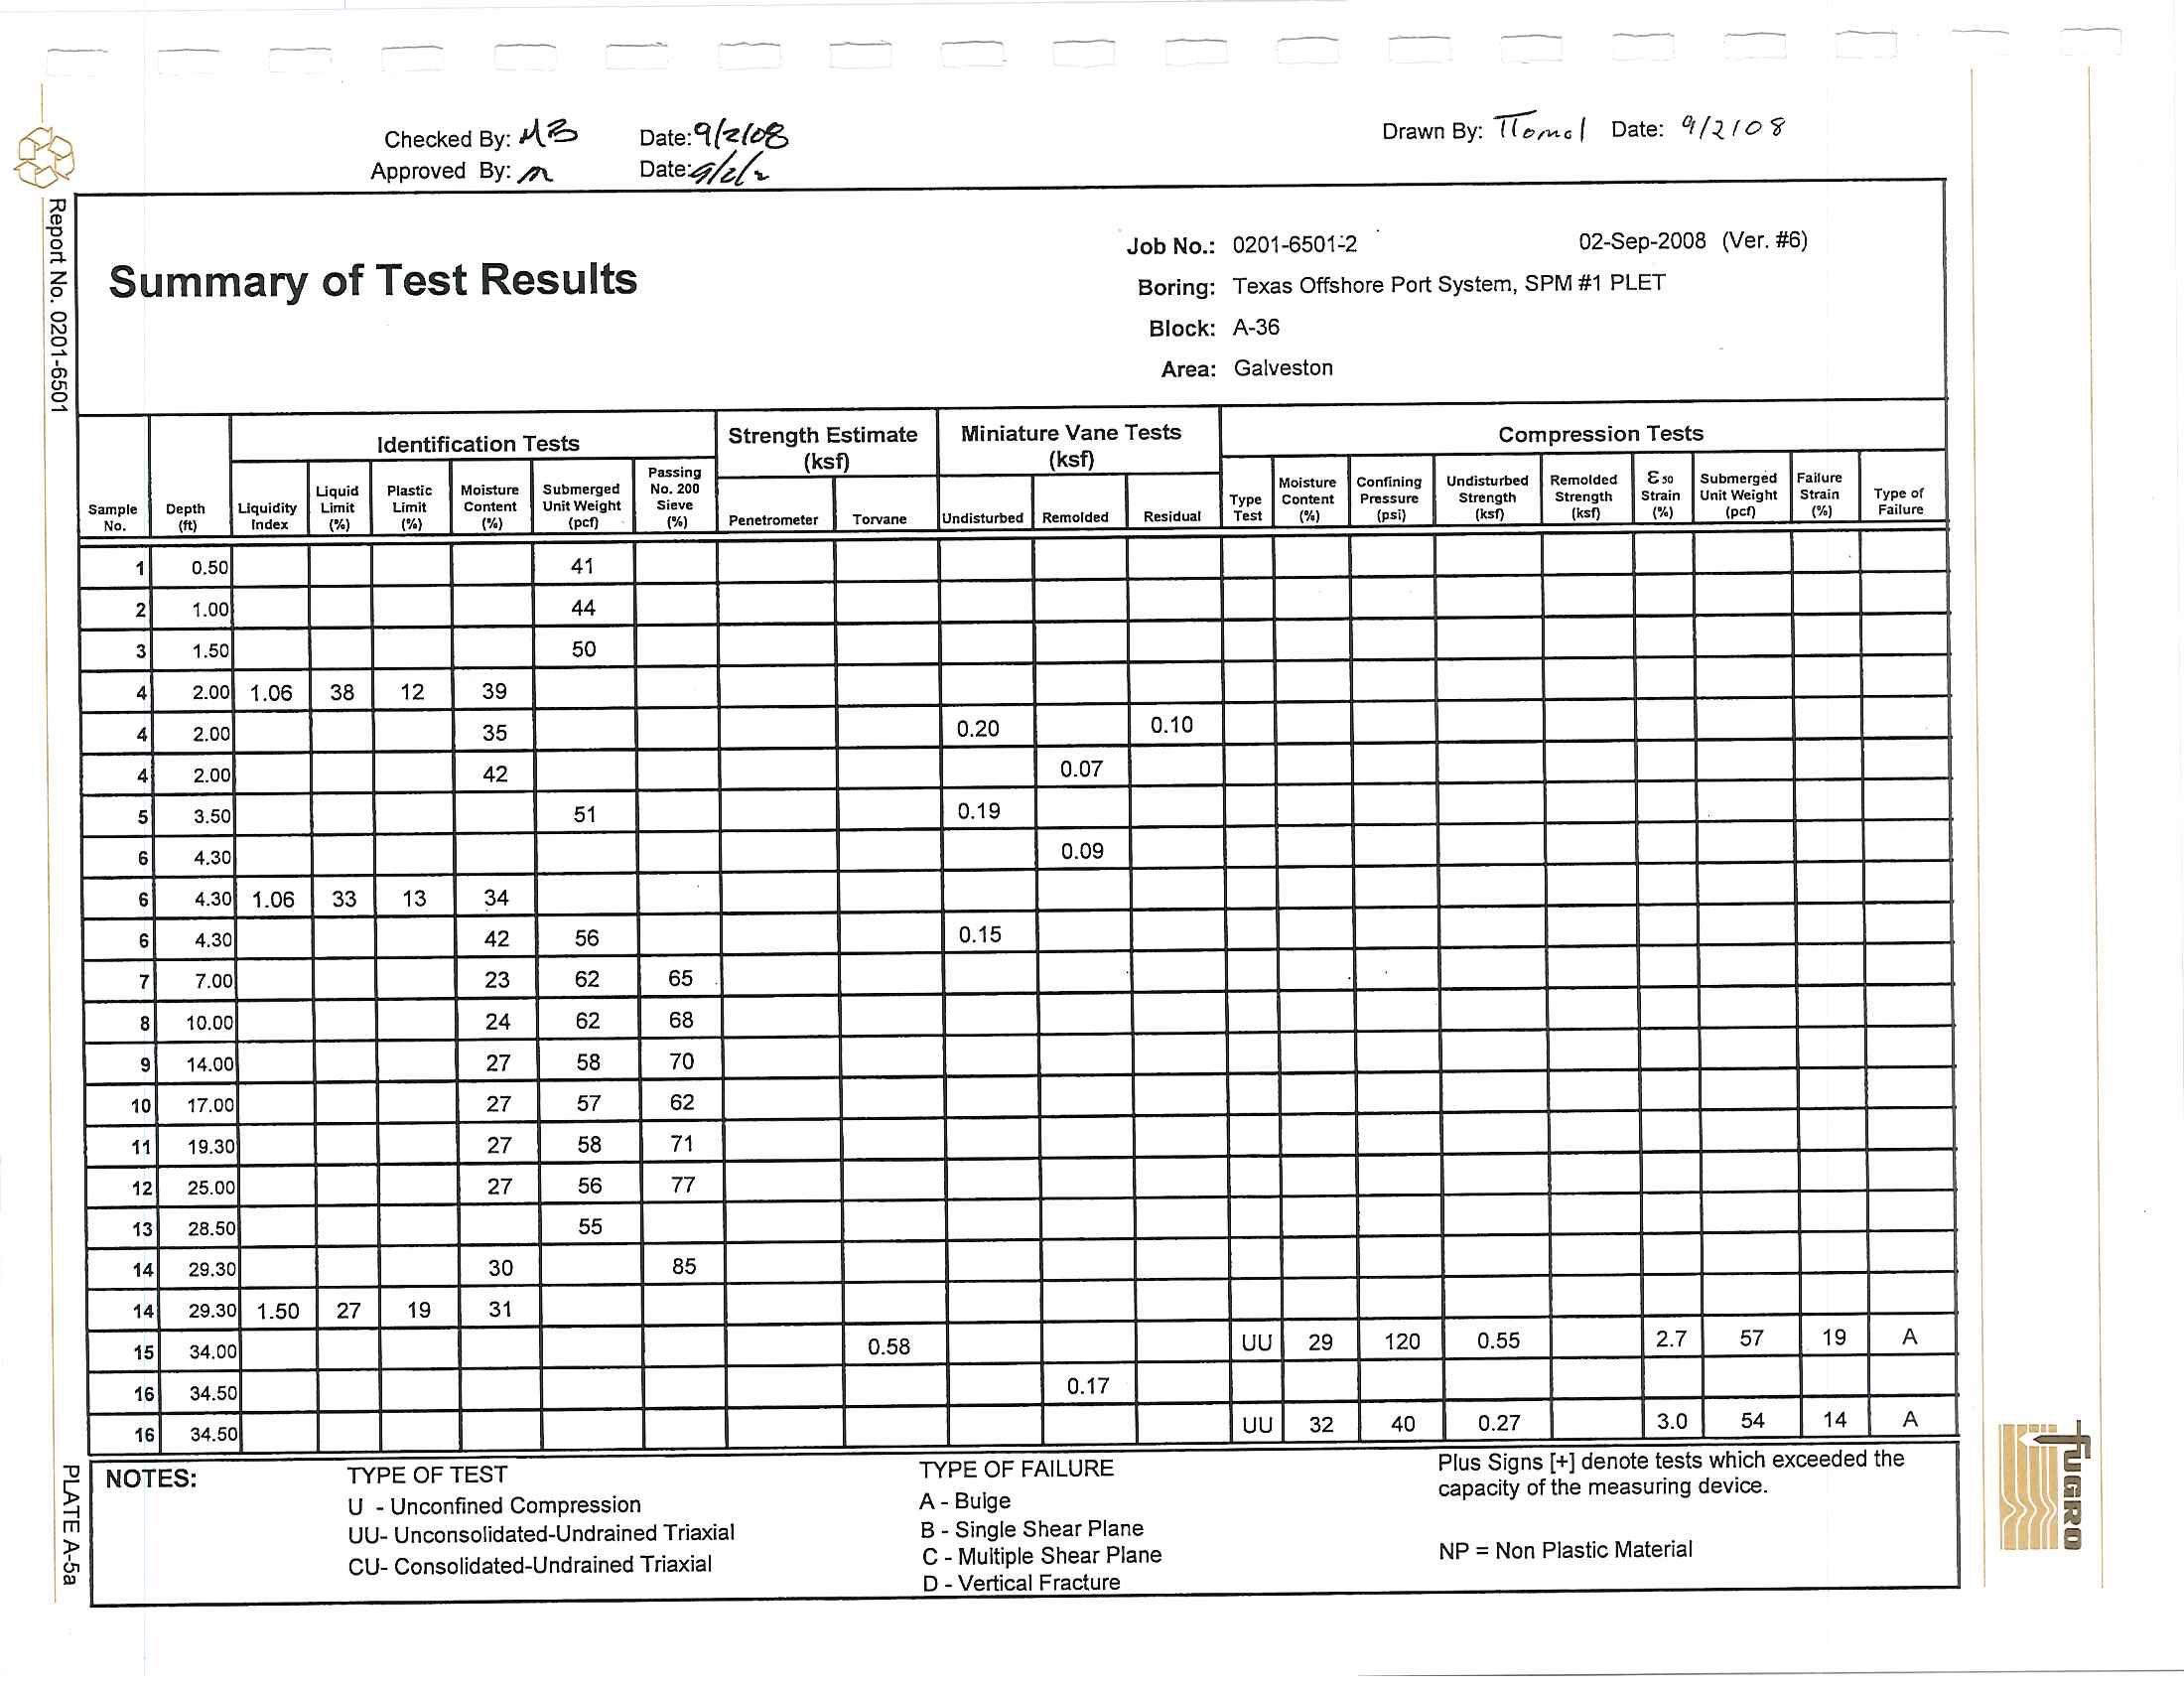
Summ
a
ry of T
es
t R
es
ult
s
D
ate
:
9
{"r
t>B
Date.,,4'/"
Drawn By: TT;;
,...
.r
Date
:
0,
/V 0
'if
Jo
b No
.
: 0201-6501
'
2
02-Sep-2008 (Ve
r
.
#6)
Borin
g: Texas Offshore Port System
,
SPM #1 PLET
B
l
o
ck: A-36
A
rea
:
Galveston
Id
ent
i
fica
t
i
o
n
T
ests
St
re
n
gt
h
Esti
m
ate
Mi
n
i
ature
V
a
n
e
T
ests
C
o
m
p
r
ess
i
o
n T
ests
P
using
(
ks
l)
(
ks
l)
Uquid
Plutic
Moisture
Submerged
No, 200
Moisture
Confining
U
n
disturbed
Remolded
E.
Submerged
Failure
SilITlp
l
e
Depth
Uquldity
Limit
LImit
Cootenl
UnilWelllht
Sieve
Type
Content
Pressure
Strength
S
t
rength
SII'II;n
Unll Weight
Stra
i
n
Type
Dr
N,.
(
ft'
Index
(.,
(
'/0}
('A.)
(pd)
(%(
Penetrometer
T
'
~
Undisturbed
Remolded
Residual
,,~
(%)
(psi)
("'.
Ibf)
(%,
(".
(%)
Failure
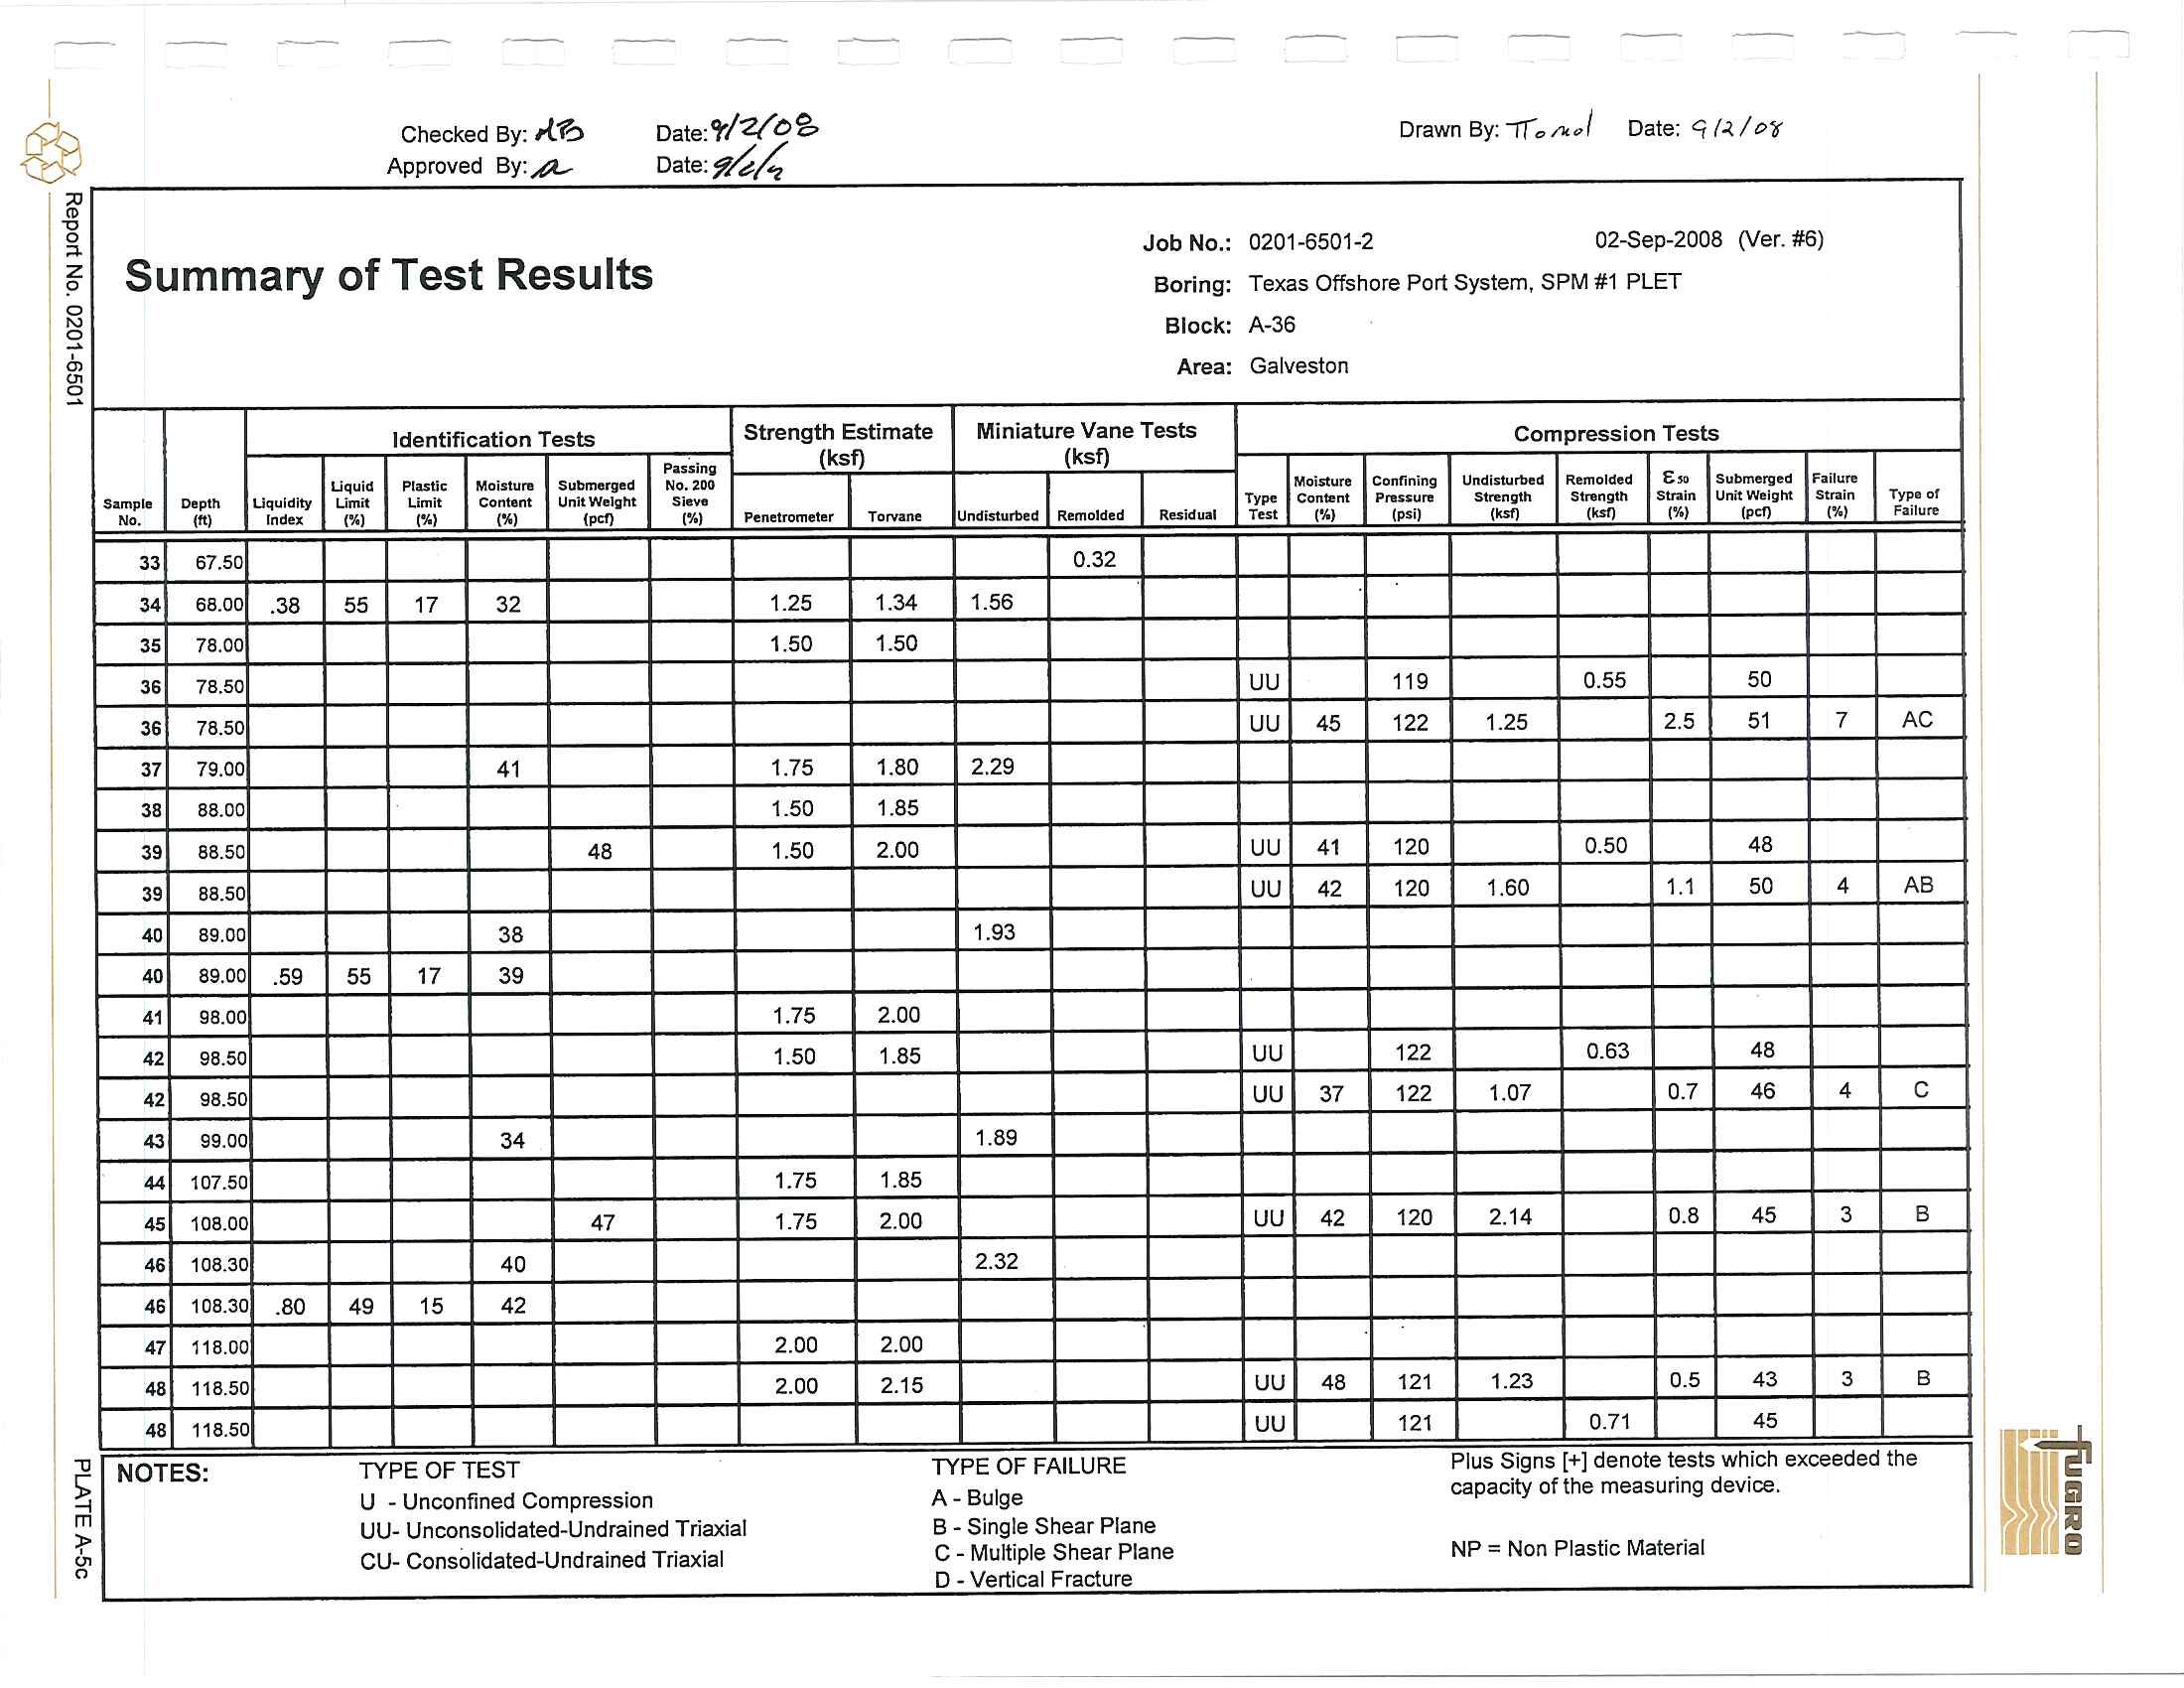
1
0
.
50
41
2
1
.
00
4
4
3
1
.
50
50
4
2.00
1.06
38
12
39
4
2.00
35
0.20
0.
1
0
4
2
.
00
42
0.07
5
3
.
50
51
0
.
1
9
6
4
.
30
0
.
09
6
4
.
30
1
.
06
33
13
34
6
4.3
0
42
56
0.
1
5
7
7
.
00
23
62
65
8
10
.
00
24
62
68
9
14
.
00
27
58
70
10
17
.
00
27
57
62
1
1
19
.
30
27
58
71
12
25.00
27
56
77
1
3
28
.
50
55
14
29.30
30
85
I
.
29
.
30
1.50
27
19
31
15
34
.
00
0.58
UU
29
120
0.55
2
.
7
57
19
A
16
34
.
50
0.
1
7
16
34
.5
0
UU
32
40
0.27
3.0
54
14
A
N
O
T
ES
:
TY
P
E O
F
T
E
ST
TYPE O
F
F
A
ILU
R
E
Plu
s Signs [+] deno
t
e
t
ests wh
i
ch exceede
d
the
U
- Unconfined Compression
A - Bulge
capacity of the measuri
n
g device.
U
U
-
U
n
co
n
soli
d
ated
-
U
nd
raine
d
T
r
iaxial
8
-
Single Shear P
l
ane
C
U
- Co
n
so
li
dated-
Un
d
r
ained T
r
iaxia
l
C - M
u
ltiple Shear
P
la
n
e
NP = Non Plastic Mater
i
a
l
0
-
Vertical
F
racture
i
i
I
I
@
'C
a
~
"-
Z
?
o
~
in
!!i
"
~
m
<-
'"
cr
Checke
d B
y
:
no
A
p
prove
d B
y
:
bt..
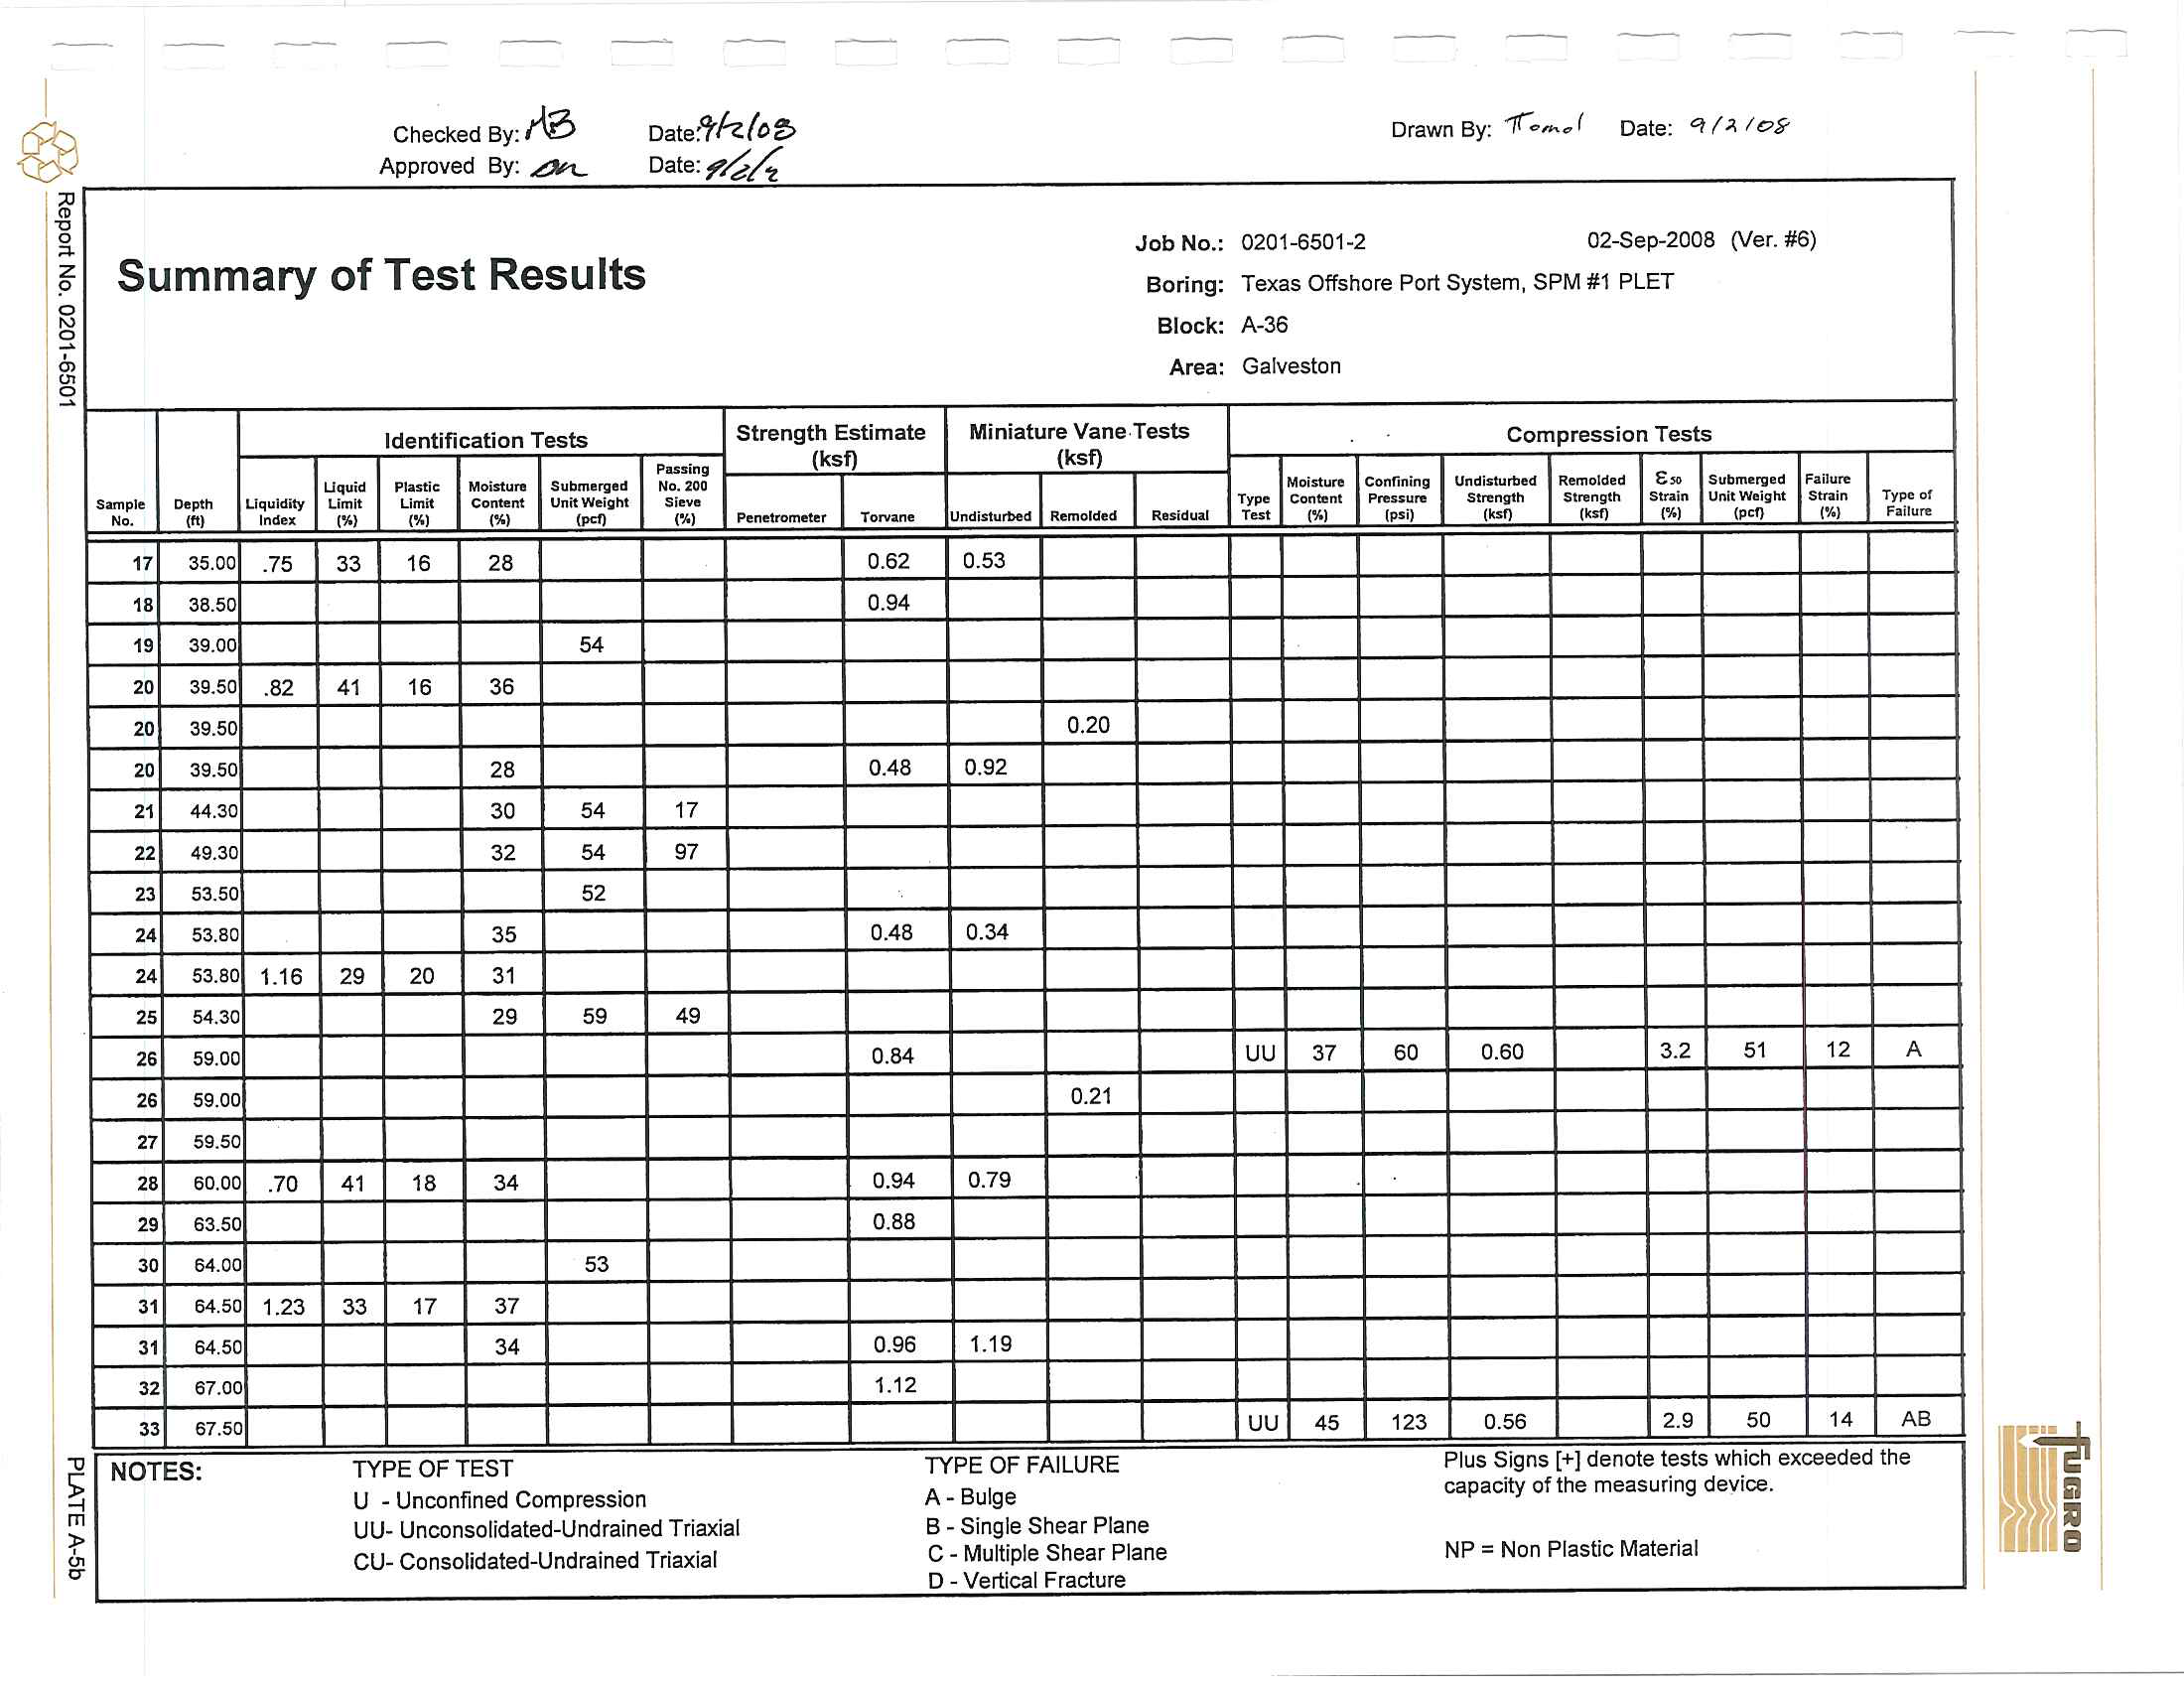
Summary of T
es
t R
es
ult
s
Date
:
'th
(
c~
D
ate:f'&A
Drawn By
:
1!G'''''",
(
Date:
q(~
1
0$-
J
o
b No
.
:
0201-650
1
-2
02-Sep-2008
(IIer
.
#6)
B
oring: Texas Offshore Port
System,
SPM #1 PLET
B
lock: A-36
Area
:
Ga
lves
ton
Ide
n
tifi
c
ati
o
n Tests
S
t
r
e
n
g
t
h Estimate
Mi
ni
atu
r
e
V
ane
.
T
ests
Co
m
p
r
ession Tests
Passi
n
g
(ksf)
(ksf)
Uquid
Plastic
M
oisture
Submerged
No
.
200
Moistu
r
e
Confin
i
ng
Undisturbed
Remolded
E
_
Submerged
Failure
Sample
Depth
Uquldity
Limi
t
L
imit
Contllrrt
UnitWerghl
Si
e
ve
Type
Content
Prenu",
Slreng1h
SlllIngth
Stra
i
n
Unll Wolg-ht
Stra
i
n
Ty
J>" of
'0.
tftl
Indell
t%J
t%J
(%1
t...
t%)
Penetromete
r
Torvane
Undist
u
rbed
Remo
l
ded
Residul.
l
TUI
t%J
[psi)
tu"
[k
s
f)
(%1
(
pet)
[
'!o
j
Fa
il
ure
17
35.00
.75
33
16
28
0
.
62
0.53
18
38
.50
0
.
94
19
39
.
00
54
2
0
39
.
50
.
82
41
16
36
20
39.50
020
2
0
39
.
50
28
0.48
0
.
92
2
1
44.30
30
54
17
22
49
.
30
32
54
97
23
53
.5
0
52
2.
53
.
8
0
35
0.48
0.34
2
.
53
.80
1.16
29
20
31
2
.
54
.30
29
59
49
2.
59
.
00
0.84
UU
37
60
0
.
60
3
.
2
5
1
12
A
2.
59
,
00
0
.21
2
7
59.50
2
8
60.00
.70
4
1
18
3
4
0.94
0.79
2
9
63
.50
0
.
88
3
0
64
.0
0
53
31
64
.50
1.23
33
17
37
31
64.50
3
4
0.96
1.1
9
3
2
67
.
00
1
.
12
3
3
67
.
50
UU
45
1
23
0.56
2.9
5
0
1
.
AB
N
O
TE
S
:
TY
PE
O
F TE
S
T
TYP
E
OF FAI
LU
R
E
Plus S
i
g
n
s
[
+
]
denote tests which
exceeded the
U
- Unconfined Compression
A
-
Bulge
capacity of the measuring device
.
U
U
- U
nco
n
solidated
-
Undrai
n
ed
Tr
iaxia
l
B
- Si
ng
le Shea
r
Plane
CU
-
Consol
i
dated-Undrained
T
riaxial
C - M
u
ltiple Shear Plane
NP
=
Non Plastic Material
0
- Vertical
Fractu
r
e
I
@
i:'
"0
o
"
z
?
a,
~
'"
~
."
S
m
:r-
g'
..-
,- -.
c
Job No.: 0201-6501-2
02-5ep-2008 (Ver
.
#6
)
Summary of Test Results
Boring: Texas
Offshore Port System, SPM #1
PLET
Block: A-36
Area: Galveston
Identification Tests
Strength Estimate
Miniature Vane Tests
Compression Tests
PassIng
(ksf)
(ksf)
Liquid
prullt
Moisture
Submerged
No. 2.00
Moisture
Connn
l
n51
Undisturbed
Remolded
E.
Submellled
Failu",
Sample
Depth
Uquldlty
Limit
Limit
Contlnt
UnIt WeIght
SIeve
Ty"
Conte
nt
Pressure
Strength
Strength
8tn1in
Unit Weight
Str.a
in
Typ
.
of
No.
")
Index
(%)
'%)
'%)
'''''
(%)
Penetrometer
Torv
~
l/\e
Undisturbed
Remolded
Residual
Test
(%)
(psi)
''''''
''''''
(%)
(pel)
(%1
F
ai
l
ul"ll
33
67
.
50
0
.
32
34
68
.
00
.38
55
17
32
1
.
25
1
.
34
1.56
35
78.00
1.50
1
.
50
36
78
.
50
UU
119
0.55
50
36
78
.
5
0
UU
45
122
1.25
2
.
5
51
7
AC
37
79,00
41
1
.
75
1
.
80
2
.
29
38
88
.0
0
1
.
50
1
.
85
3'
88
.
50
48
1
.
50
2
.
00
UU
41
120
0
.
50
48
3'
8B
.
SO
UU
42
120
1
.
60
1
.
1
50
4
AS
40
89
.
00
38
1.93
40
89
.
D
O
.59
55
17
39
41
98
.
00
1.75
2.00
42
98
.
50
1.50
1.85
UU
122
0
.
63
48
I
42
9
8.
50
UU
37
122
1.07
0.7
46
4
C
43
99
,
00
34
1
.
89
I
44
107.50
1.75
1
.85
45
108
.
00
47
1.75
2
.
00
UU
42
120
2.14
0.8
45
3
S
46
108
.
30
40
2
.
32
46
108
.
30
.
80
49
15
42
47
1
18.
00
2.00
2.00
48
118
.
5
0
2
.
00
2.15
UU
48
121
1.23
0.5
43
3
B
48
118
.
50
UU
121
0
.
71
45
NOTES:
TYPE OF TEST
TYPE OF FAILURE
Plus Signs
[+)
denote
tests
which e
x
ceeded the
U
-
Uncon
fined
Compression
A- Bulge
capacity of the
measuring device
.
UU-
Unconsolidated-Undrained Triaxial
B
-
Single Shear
Plane
CU-
Consolidated-Undrained Triaxial
C
-
Multiple
Shear
Plane
NP
=
Non Plastic Material
D
-
V
erti
ca
l
Fracture
I
@
il'
'"
o
""
o
Z
o
'"
~
.;,
'"
~
Checked By: 11. 0
Approved By:
/.7~
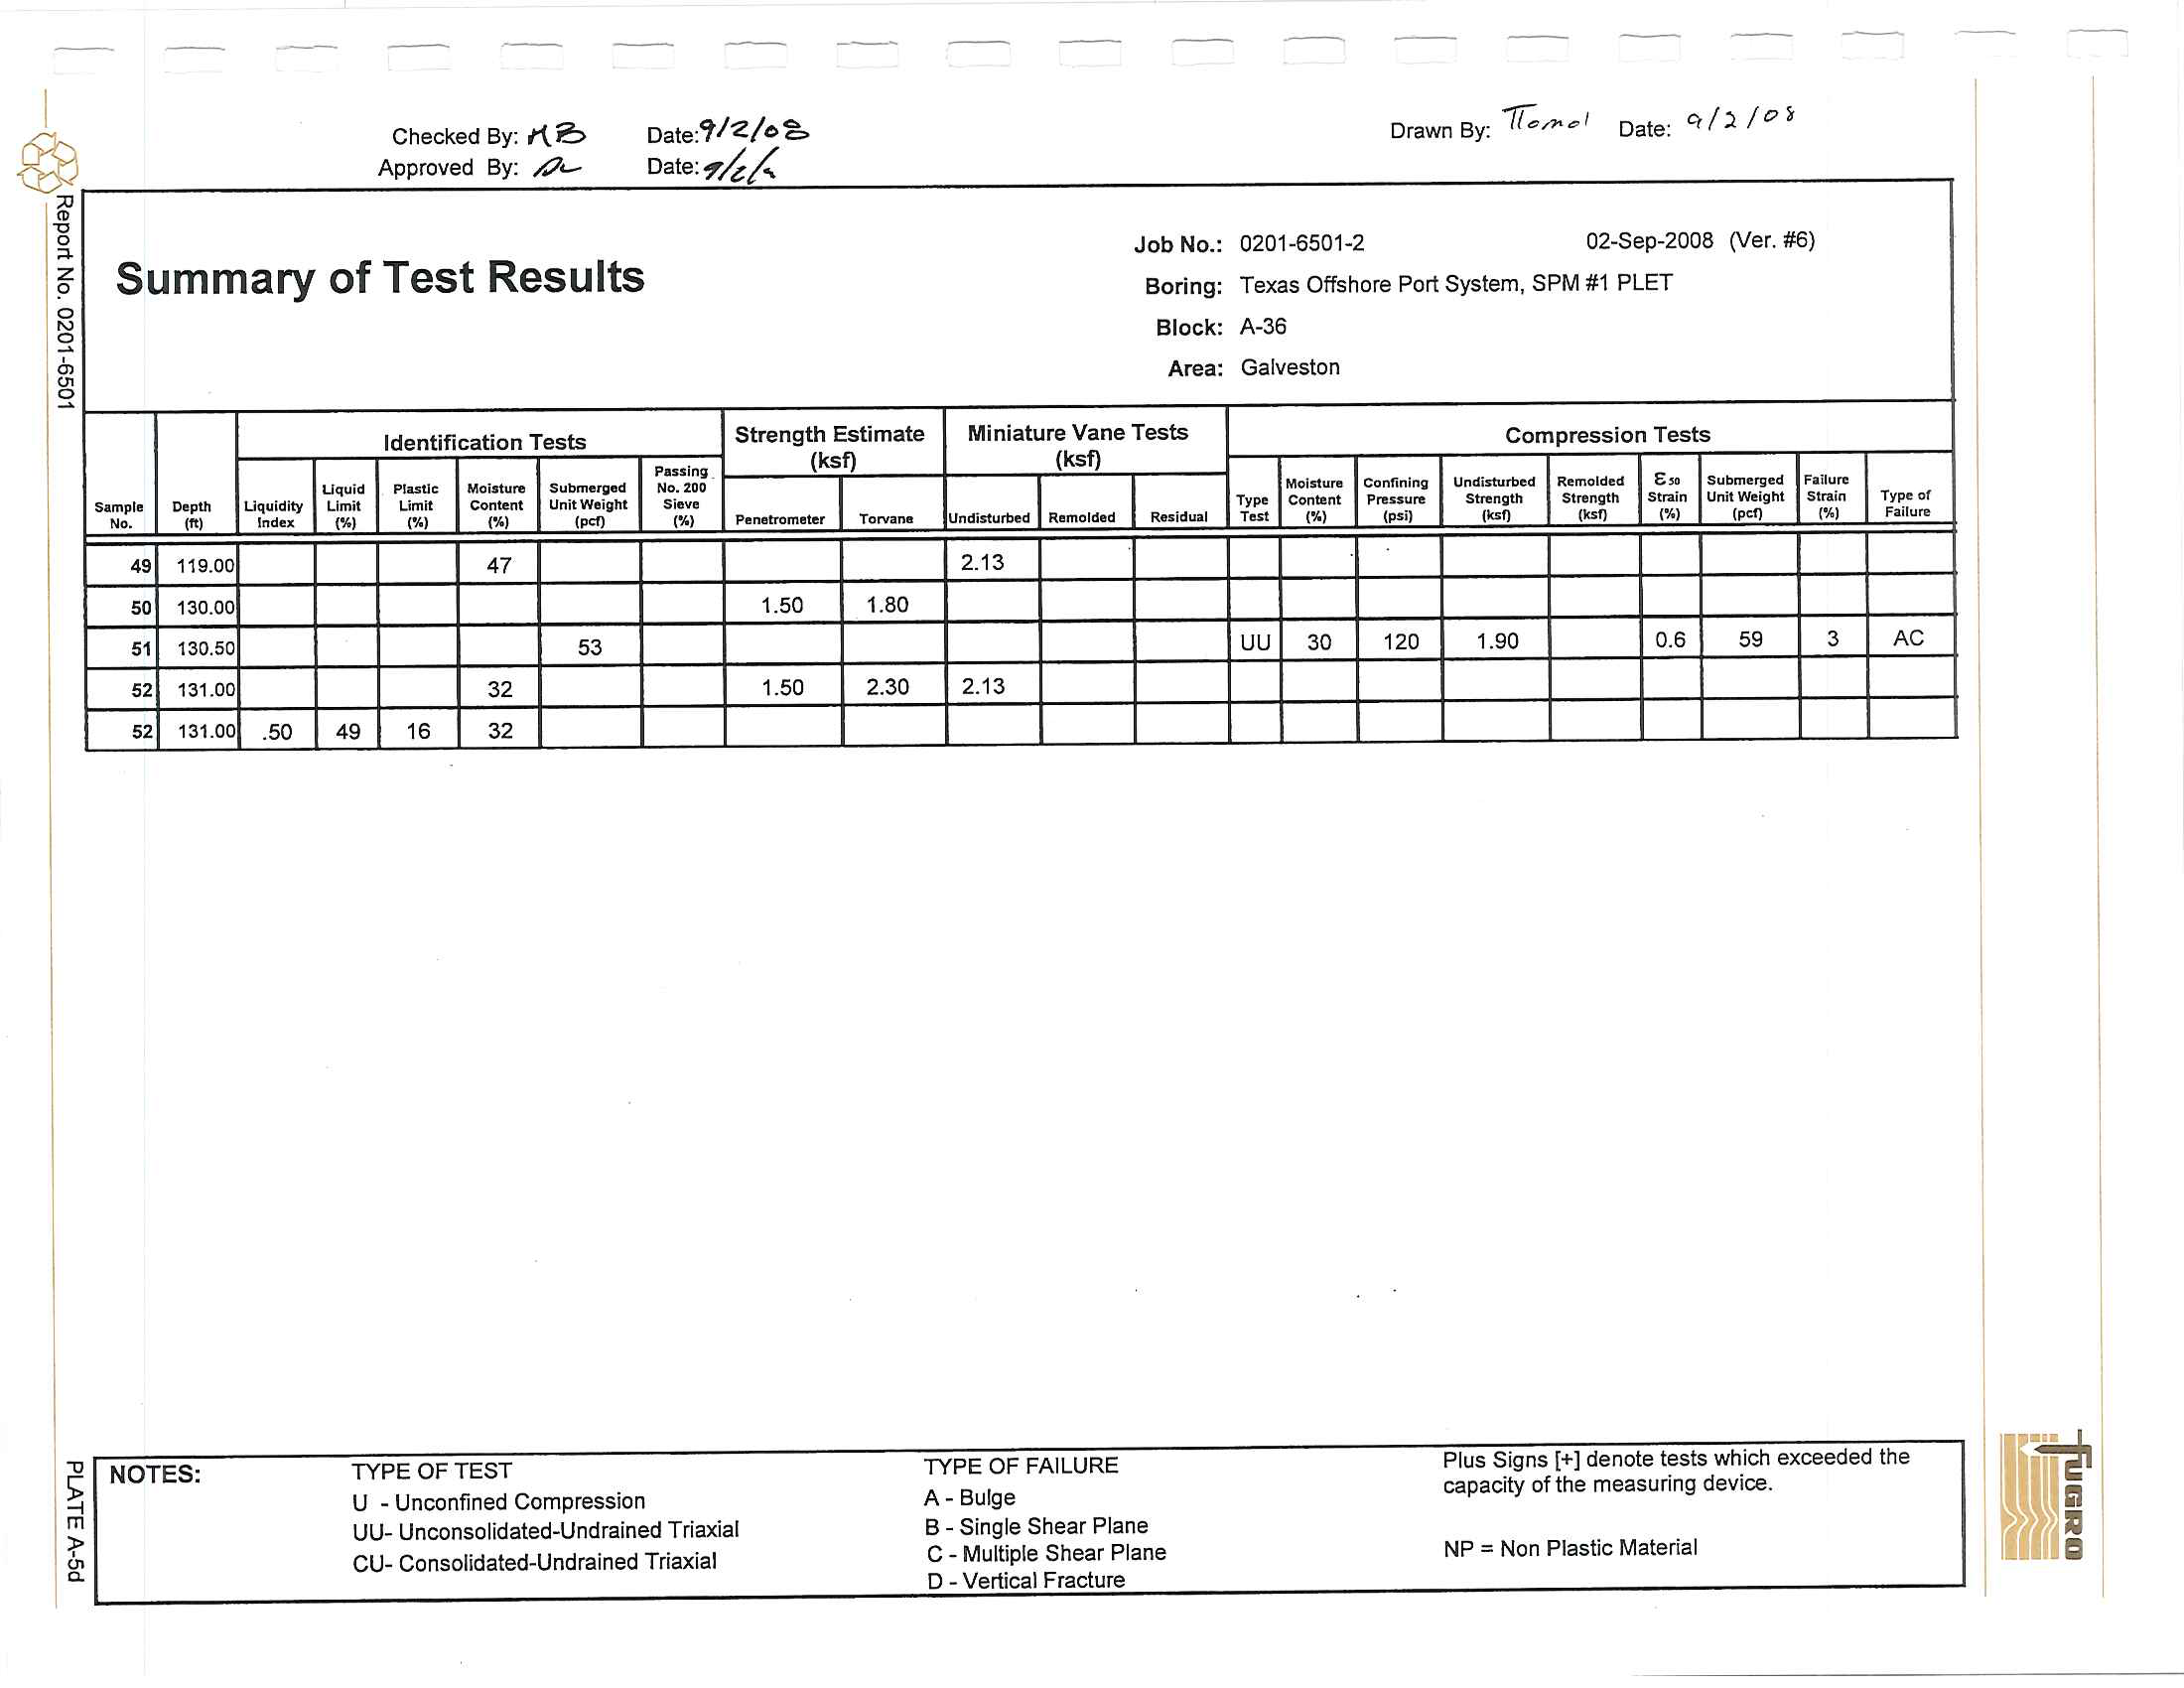
Summary of Test Results
Identification
Tests
Uquld
Plastic
Mol,tvre
Submerged
Simple
Depth
Liq
uid
ity
Limit
limit
Conlent
UnitW.
l
ght
--.
1'/
index
1'/
I'M
1%1
'''''
49
119
.
00
47
so
130
.
00
51
130.50
53
52
131
.
0
0
32
52
131
.
00
.50
49
16
32
Date
:
~/z!o~
Date
:
~,;,;;.:
Strength
Estimate
PUling
(ksf)
No. 200
Sieve
"I
Penetrometer
Torvan.
1.50
1
.
BO
1
.50
2.30
Drawn By
:
-rr;,,,,~
/
Date:
"'/1
/e>;
Job No.:
0201-6501-2
02-Sep-200B (Ver. #6)
Boring:
Texas Offshore Port
System, SPM #1
PLET
Block:
A-36
Area:
Galveston
Miniature Vane
Tests
Compression
Tests
(ksf)
Mol'ltu
flI
Confining
Und
i:rtu
rbed
R~m
o
lded
E.
Submerged
F
iliure
Type
Contf:nt
Pres
l
ure
Strenllth
Stl1lnlllh
Strain
Unit
Weight
Strain
Type
of
Undl
lt
umd
Remold,d
fWsidLlllI
Tu.
"I
IPsi)
I""
I""
1%1
(pef)
'"
~
Failure
2
.
13
UU
30
120
1
.9
0
0.6
59
3
AC
2
.
13
~
NOTES
:
TYPE OF TEST
TYPE
OF
FAILURE
Plus Signs
[+)
denote tes
t
s
which exceeded
t
he
..,
U
_
Unconfined Compression
A
_
Bulge
capacity
of the measunng
deVice
.
~
UU- Unconsolidated-Undrained Triaxial
B - Single Shear Plane
~
CU- Consolidated-Undra
i
ned
T
riaxia
l
C - Multiple Shear Plane
0
-
Vert
i
cal Fracture
NP = Non Plast
ic
Material
I
@
;u
~
"0
0
"-
z
100
~
0
N
~
in
90
'"
~
80
f-
I
70
(!)
~
60
>-
co
(!)
z
u;
50
<f)
<:
"-
f-
Z
40
w
0
n:
w
"-
30
20
10
0
100
"
m
~
~
C
h
ecked
by:
J,...\
fb
Approved
by:
L,7c..
U.S. STANDARD
SIEVE SIZES
IN IN
C
HE
S
3
2
I
Coarse
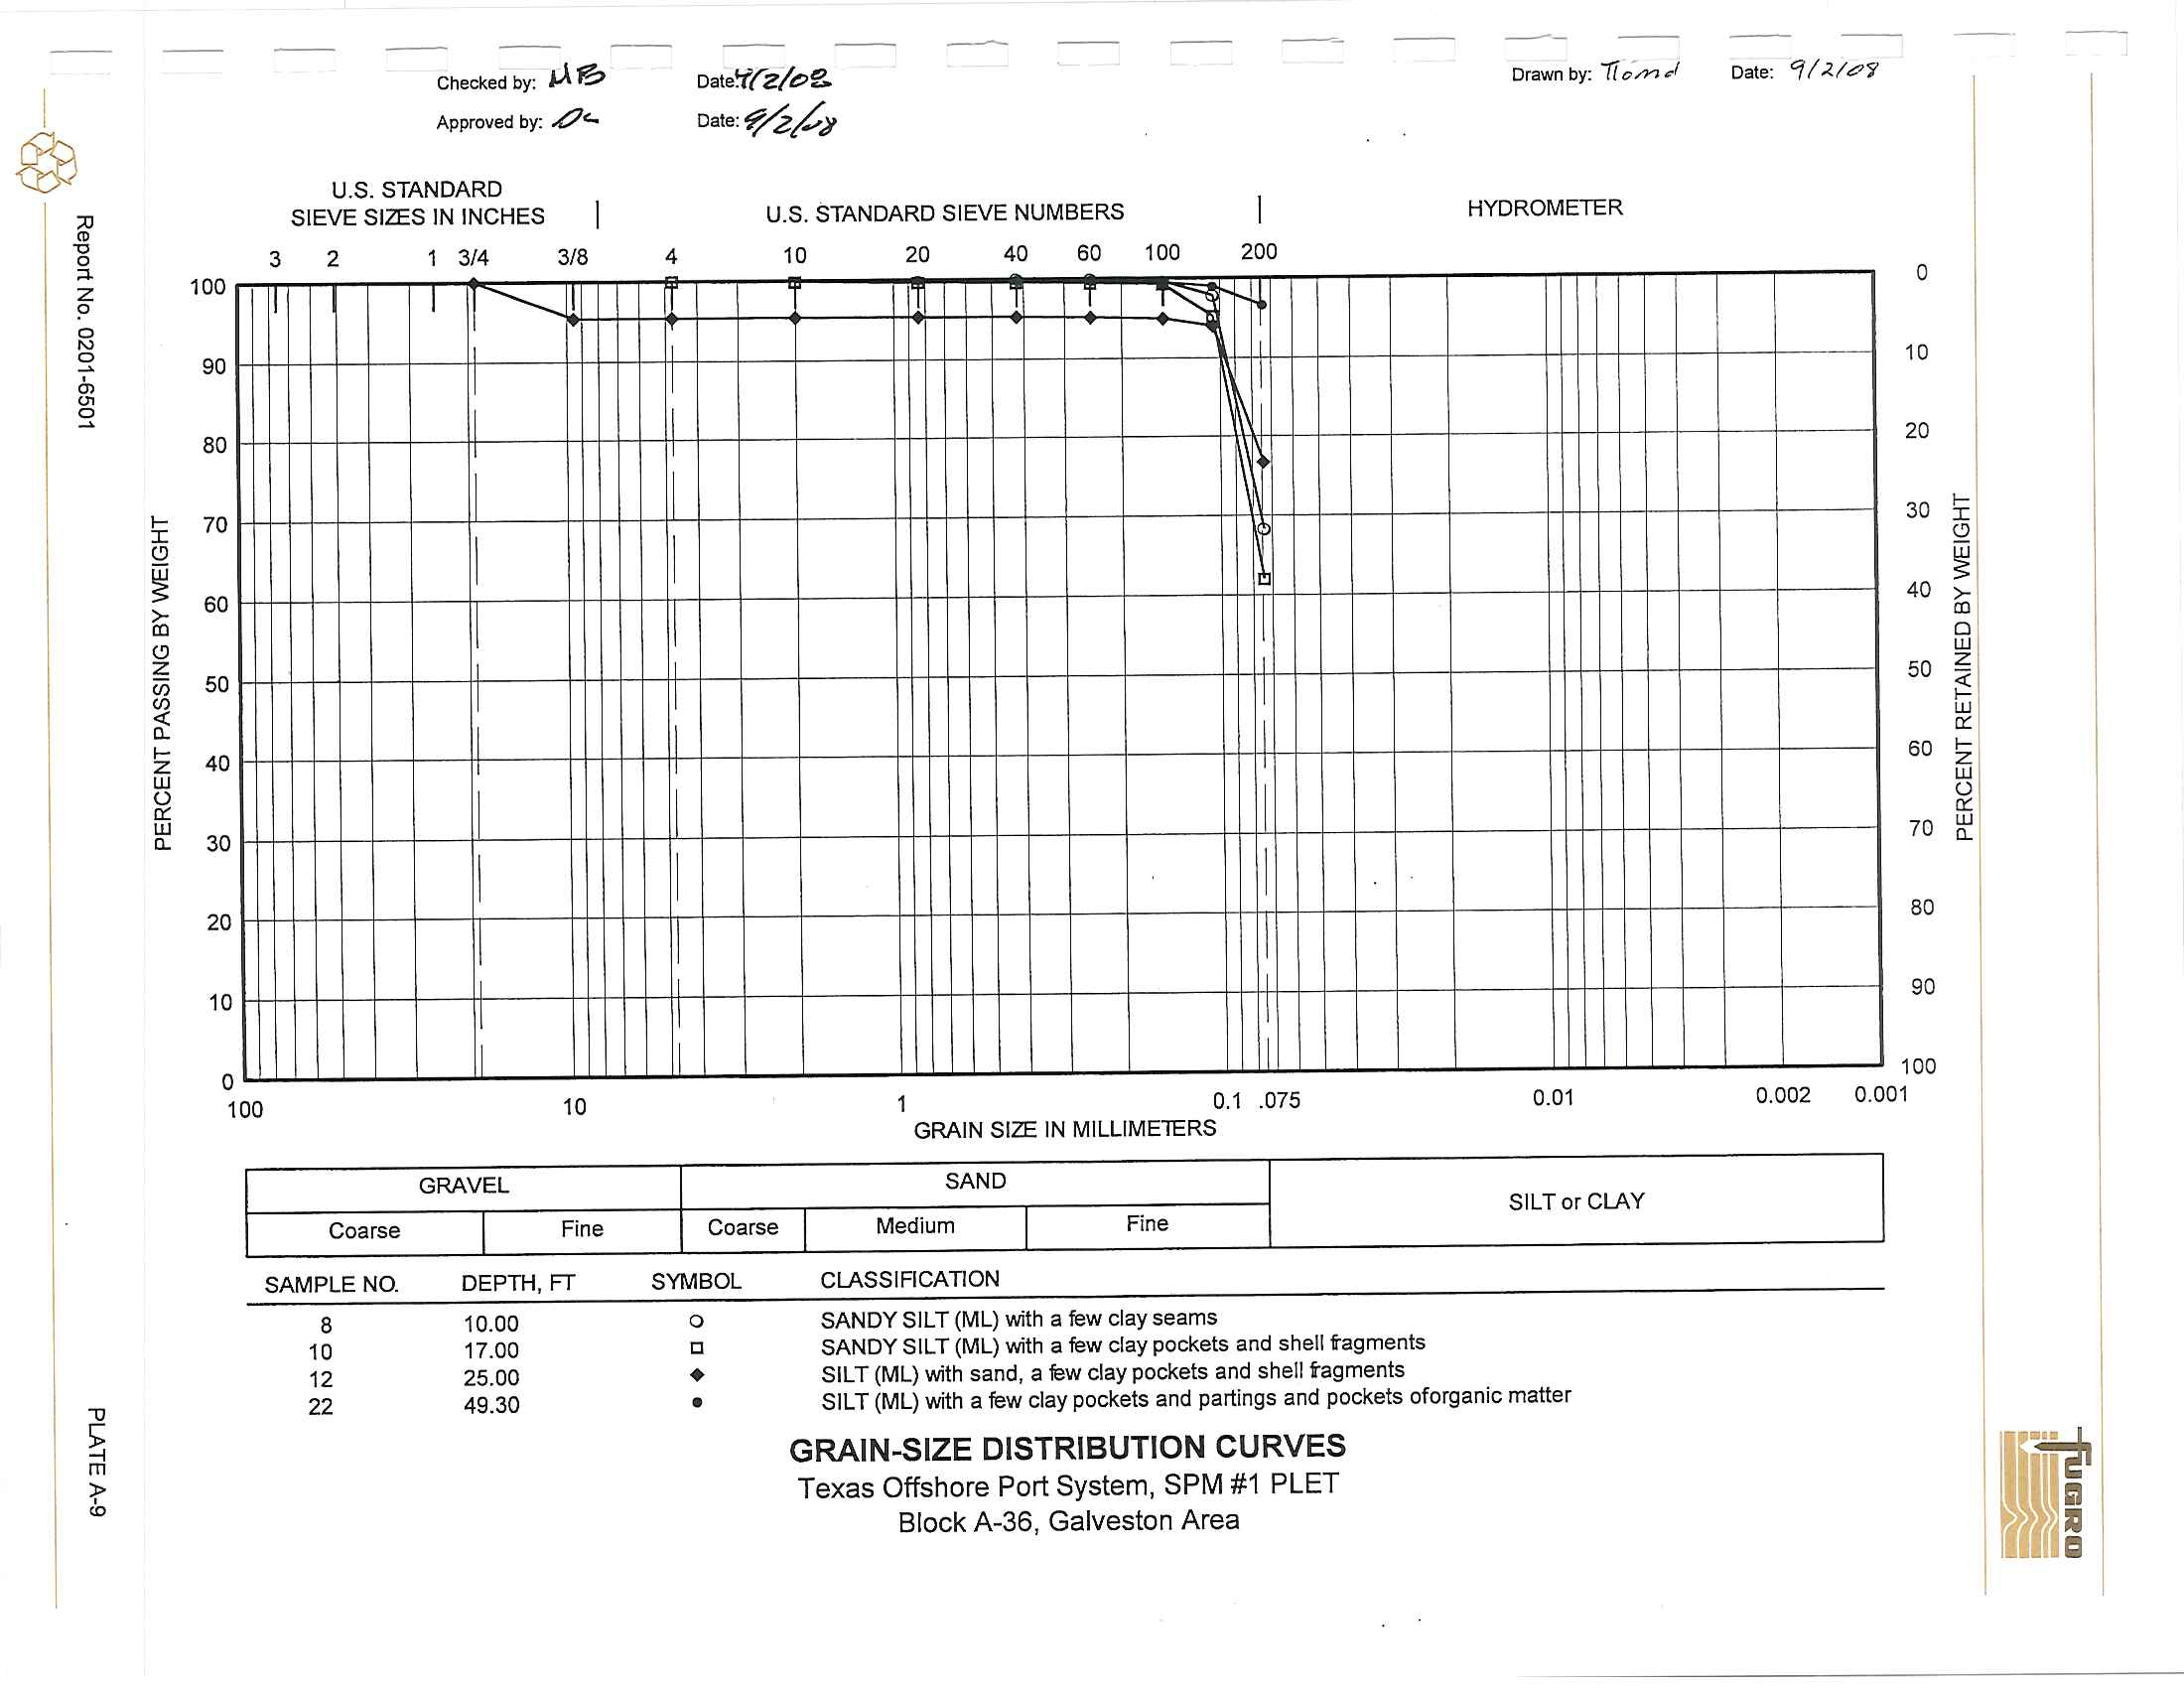
SAMPL
E
NO.
8
10
12
22
1
3/4
3/8
T-.........
I
I
I
10
GRAVE
L
I
Fine
DEPTH
,
FT
10.00
17
.00
25
.
00
49.30
4
I
I
I
Dat,'(rZ/"'f'.
Oat"
'f7Z~~
U.S
.
STANDA
RD
SIEVE NUMBERS
10
20
40
6
0
100
!
!~
200
I
I
I
1
0.1
.07
5
GRAIN
SIZE
IN
MILLIMETERS
SAND
Coarse
I
Medium
I
F
in
e
Drawn
by:
17
D/n
~
HYD
ROMETER
I
0.Q1
S
ILTorC
LAY
SYMBOL
C
LAS
SI
A
CATlON
o
c
•
SA
ND
Y
SILT (ML)
with
a
few
clay seams
SAN
DY
SILT
(ML) with
a
few
clay
pockets and
shell fagments
S
ilT
(ML)
'Nith sand, a
few
clay
pockets and
shell tagments
SILT
(
ML
)
with
a
few clay pockets and partings
and
pockets
oforgan
i
c
matte
r
GRAIN-SIZE DISTRIBUTION CURVES
Te
x
as
Offshore
Port
System,
SPM
#1
PLET
Block A-36
,
Galveston
Area
Date:
'1/'<:1<:7')'
0
10
20
30
f-
I
(!)
40
CO
>-
~
0
w
50
z
w
~
n:
60
f-
Z
W
0
n:
70
w
"-
80
90
100
0.002
0.001
1.25
"
V<>
•
~
""
~
1.00
0
I
~
•
~
<
en
~
en
OJ
'-
>.
.....
'"
(/')
~