2
GENERAL PROJECT INFORMATION
2.1 INTRODUCTION
2.1.1
Purpose and Scope
Fugro-McClelland Marine Geosciences, Inc. (FMMG) performed a geotechnical investigation
program to investigate soil conditions at the proposed Single Point Mooring (SPM) facility locations
in the
Texas Offshore Port System (TOPS), located
in Block A-36, of the Galveston Area in the Gulf of Mexico.
The primary purpose
of the investigation was to obtain data to develop foundation design recommendations
for anchor leg and Pipe Line End Termination (PLET) locations at the facility sites designated as the
SPM
#1 and SPM #2. To accomplish this objective, the following tasks were performed:
(1) Four soil borings, with one boring at a selected anchor leg location and one boring at the
proposed PLET location at each of the
SPM locations, were drilled to 131-ft penetration
below seafloor to explore the subsurface stratigraphy and obtain soil samples for laboratory
testing;
(2) Field and laboratory tests were conducted to evaluate pertinent index and engineering
properties of the foundation materials;
(3) A comparison of the geotechnical and geophysical data was performed to investigate soil
variability
to help in selecting soil parameters; and
(4) Engineering analyses were performed to develop pile design information, seafloor bearing
capacity, and a general pile installation assessment.
Enterprise Field Services,
LLC specified the boring locations and designations. A plan of borings
presenting the relative positions of the four borings is presented on Plate 2-1.
2.1.2
Report Format
The results of the geotechnical investigations completed for the TOPS campaign are presented in
the following reports:
0201-6500:
0201-6501:
0201-6502:
0201-6503:
0201-6504:
0201-6505:
Offshore Terminal Location, Block A-36, Galveston Area;
SPM
#1 and #2 PLET and Anchor Leg Locations, Block A-36, Galveston Area
(this report);
Offshore Terminal Location, Block A-56, Galveston Area;
SPM
#1 and #2 PLET and Anchor Leg Locations, Block A-56, Galveston Area;
Offshore Terminal Location, Block A-59, Galveston Area; and
SPM
#1 and #2 PLET and Anchor Leg Locations, Block A-59, Galveston Area;
The initial section
of this report contains brief descriptions of the field and laboratory phases of the
study, including a general description of the soil stratigraphy and a summary of the findings from the
geophysical survey across Block A-36.
Also included
in this section is a general discussion of the
engineering methods, axial and lateral pile design, used
at all the boring locations. Section 3 presets a
detailed description of the site-specific conditions encountered at each boring location followed
by brief
discussions
of axial pile design, lateral pile analyses, seafloor bearing capacity, and pile installation
recommendations.
Discussions of the field and laboratory investigations are presented
in Appendix A.
I ___
~
____
R_e_p_o_rt_N_O._O_2_01_'6_5_0_1___________________________________________________________
2_-1_______
I
I
Appendix B contains discussions of analytical procedures used in our engineering analyses. Appendix C
contains a positioning report by Fugro Chance, Inc.,
of Lafayette, Louisiana.
For the purposes
of discussion and presentation, "driven pipe pile" is used in this report to represent
foundation piles, caissons and conductors, unless otherwise specified.
2.2 FIELD AND LABORATORY INVESTIGATIONS
The field investigation was performed
on June 26 through 28, 2008, from the RN
Seaprobe.
The
soil conditions were determined by performing four exploratory borings, two at each SPM location with one
boring at a selected anchor leg location, and one boring at the proposed PLET location. Enterprise Field
Services selected the boring locations. These borings were drilled to a penetration of 131-ft below mudline.
The water depths
at the boring locations ranged from 110 to 113 It. A chronological summary of field
operations is presented
in Appendix A.
2.2.1
Exploratory Borings
FMMG personnel drilled the soil borings with a DMX drill rig positioned over the centerwell of the
RN
Seaprobe.
The vessel was anchored at the boring location by a 4-point mooring system.
Soil
conditions
at the site were explored by drilling a group of four soil borings to 131-ft penetration below the
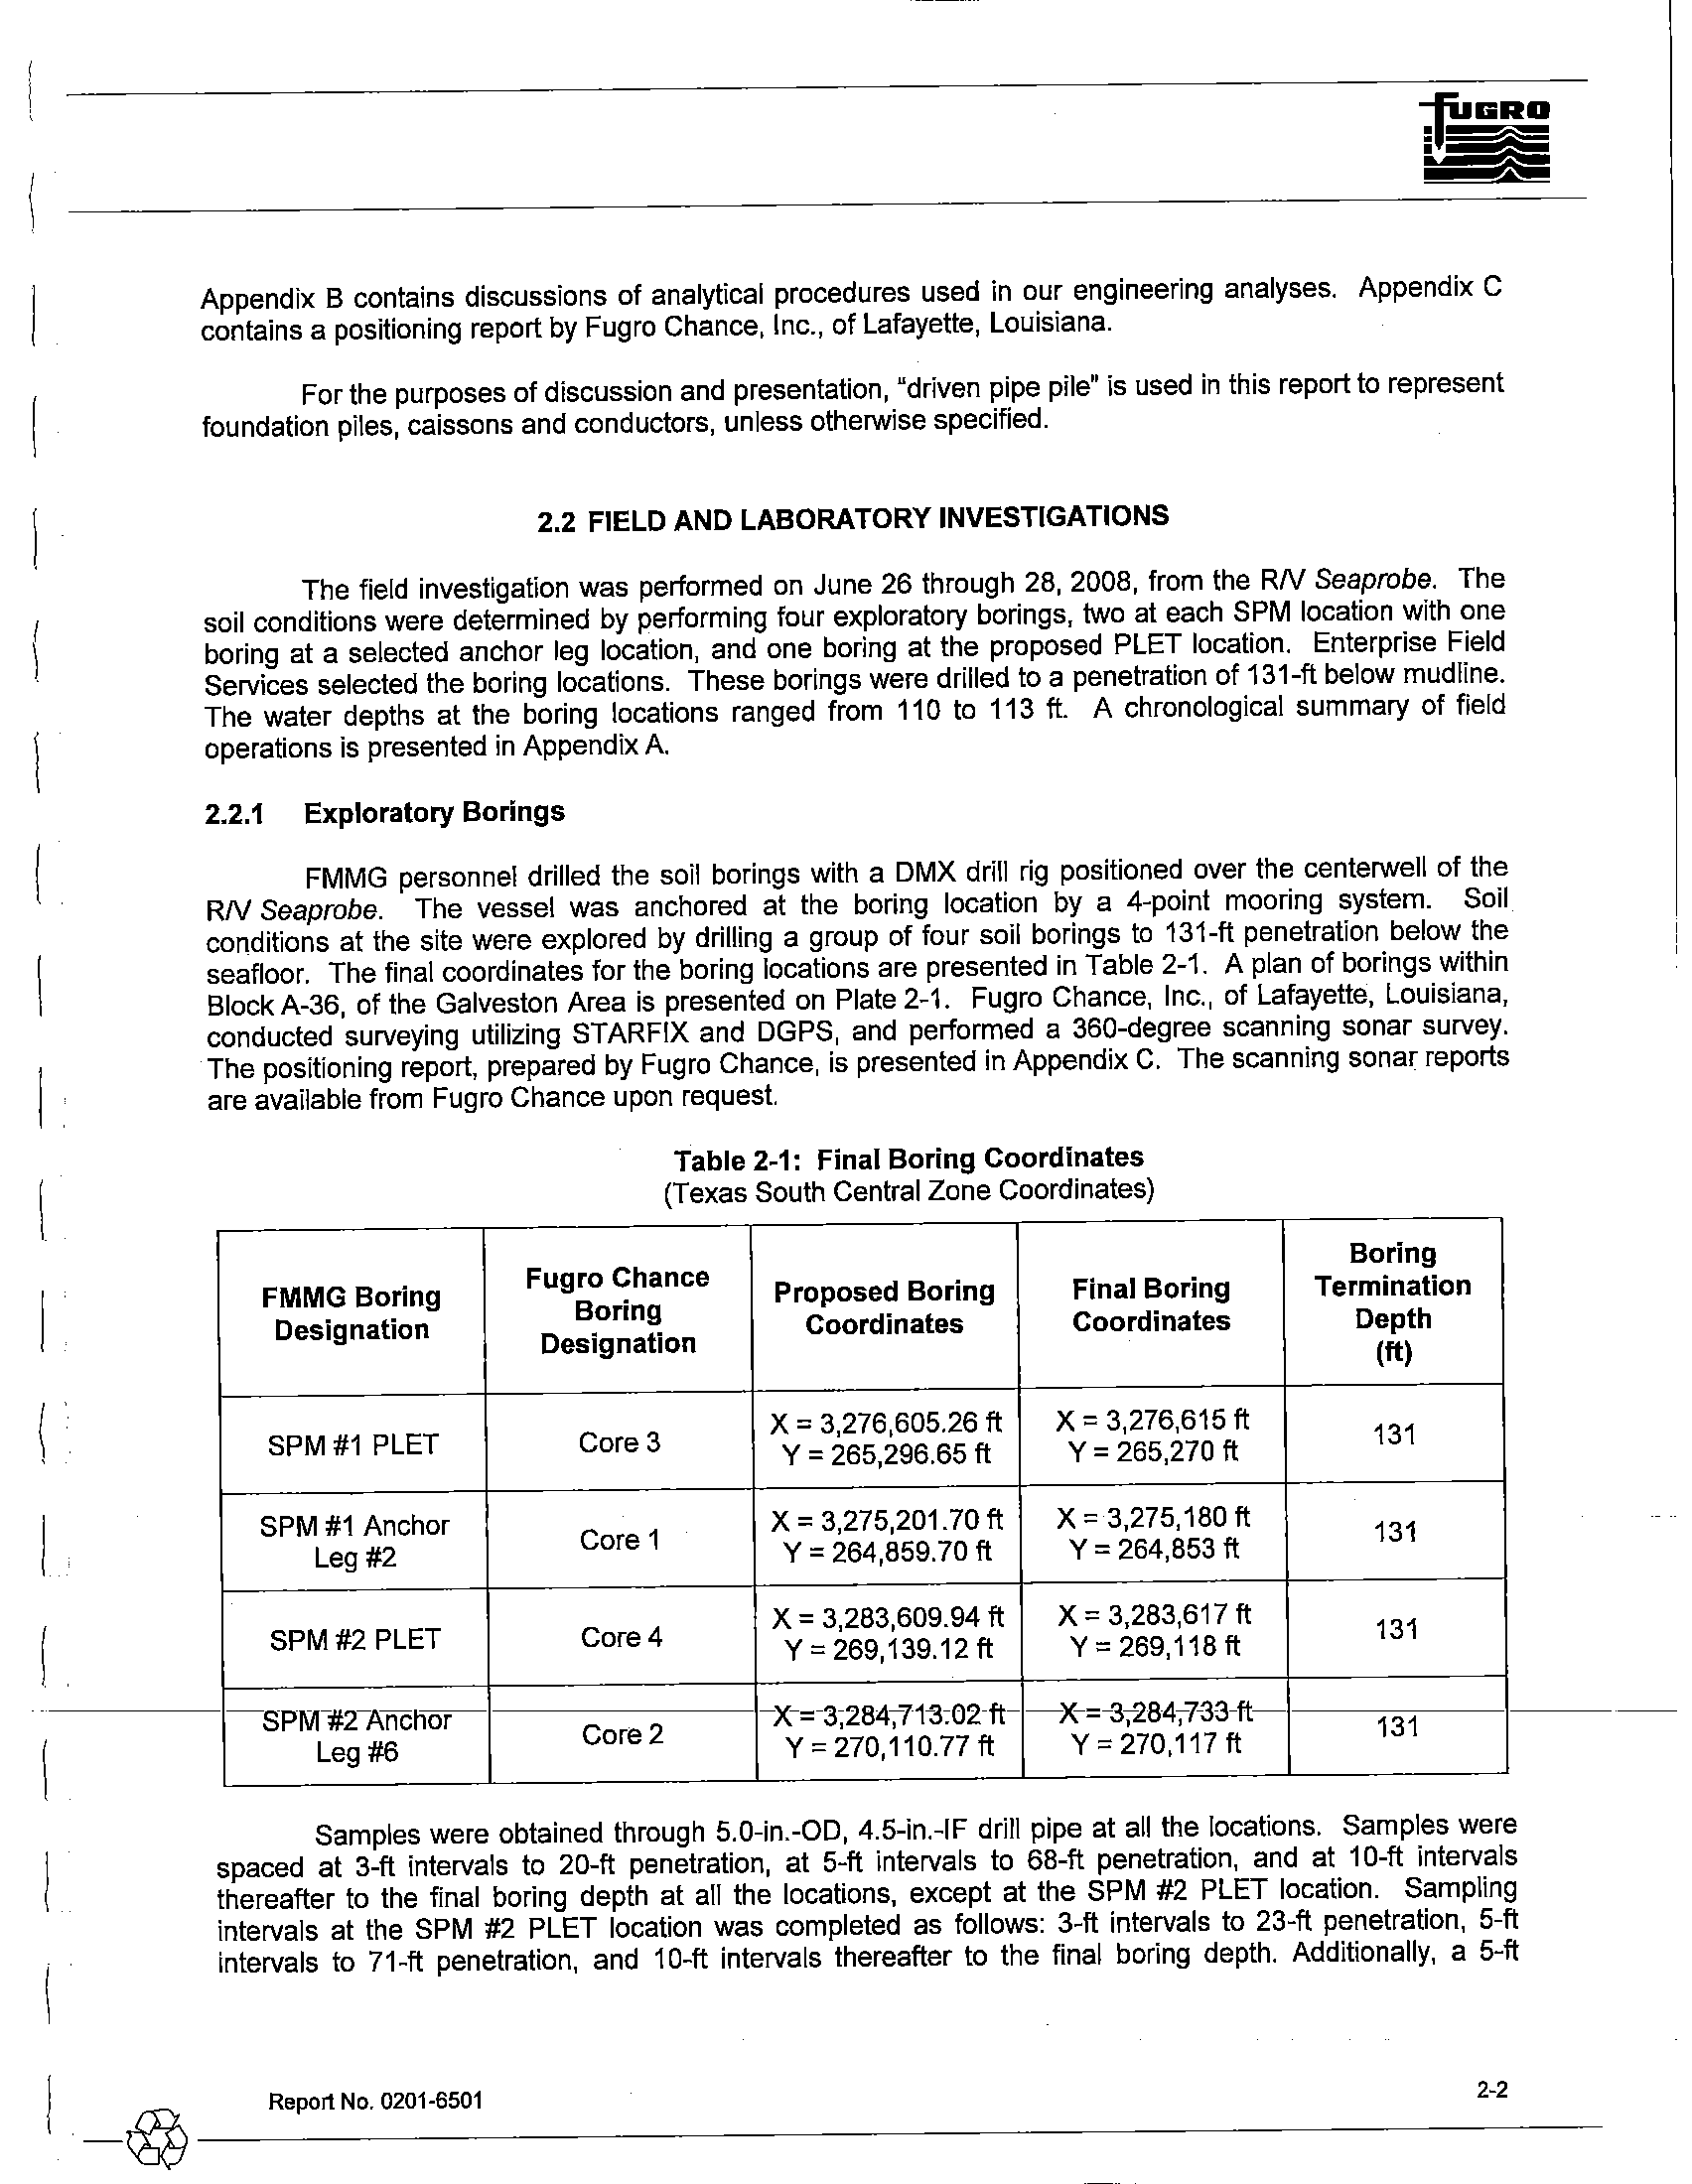
seafloor. The final coordinates
for the boring locations are presented in Table 2-1. A plan of borings within
BlockA-36, of the Galveston Area is presented on Plate 2-1. Fugro Chance, Inc., of Lafayette, Louisiana,
conducted surveying utilizing STARFIX and DGPS, and performed a 360-degree scanning sonar survey.
The positioning report, prepared by Fugro Chance, is presented in Appendix
C. The scanning sonar reports
are available from Fugro Chance upon request.
FMMG
Boring
Designation
SPM #1 PLET
SPM
#1 Anchor
Leg #2
SPM#2 PLET
SPM-#TAncnor
Leg
#6
Table 2-1: Final Boring Coordinates
(Texas South Central Zone Coordinates)
Fugro Chance
Boring
Proposed Boring
Final Boring
Designation
Coordinates
Coordinates
Core 3
X = 3,276,605.26 ft
X = 3,276,615 ft
Y = 265,296.65 ft
Y = 265,270 ft
Core 1
X = 3,275,201.70 ft
X = 3,275,180 ft
Y = 264,859.70 ft
Y
=
264,853 ft
Core 4
X = 3,283,609.94 ft
X = 3,283,617 ft
Y
=
269,139.12 ft
Y = 269,118 ft
Core 2
X-=-3;284~7t3:02-ft-
-X-=-3;-284;-7-33-ft
Y = 270,110.77 ft
Y = 270,117 ft
Boring
Termination
Depth
(ft)
131
131
131
131
Samples were obtained through 5.0-in.-OD, 4.5-in.-IF drill pipe at all the locations. Samples were
spaced
at 3-ft intervals to 20-ft penetration, at 5-ft intervals to 68-ft penetration, and at 10-ft intervals
thereafter to the final boring depth at all the locations, except at the SPM #2 PLET location. Sampling
intervals at the SPM #2 PLET location was completed as follows: 3-ft intervals to 23-ft penetration, 5-ft
intervals to 71-ft penetration, and 10-ft intervals thereafter to the final boring depth. Additionally, a 5-ft
I
_~
____
R_ep_o_rt_N_O._O_20_1_-6_50_1____________________________
2_~
____
I
shallow boring, designated as Core 4A by Fugro Chance, was drilled at the SPM #2 PLET location to allow
re-sampling. The drilling and sampling techniques used to complete these borings are explained
in detail in
Appendix A.
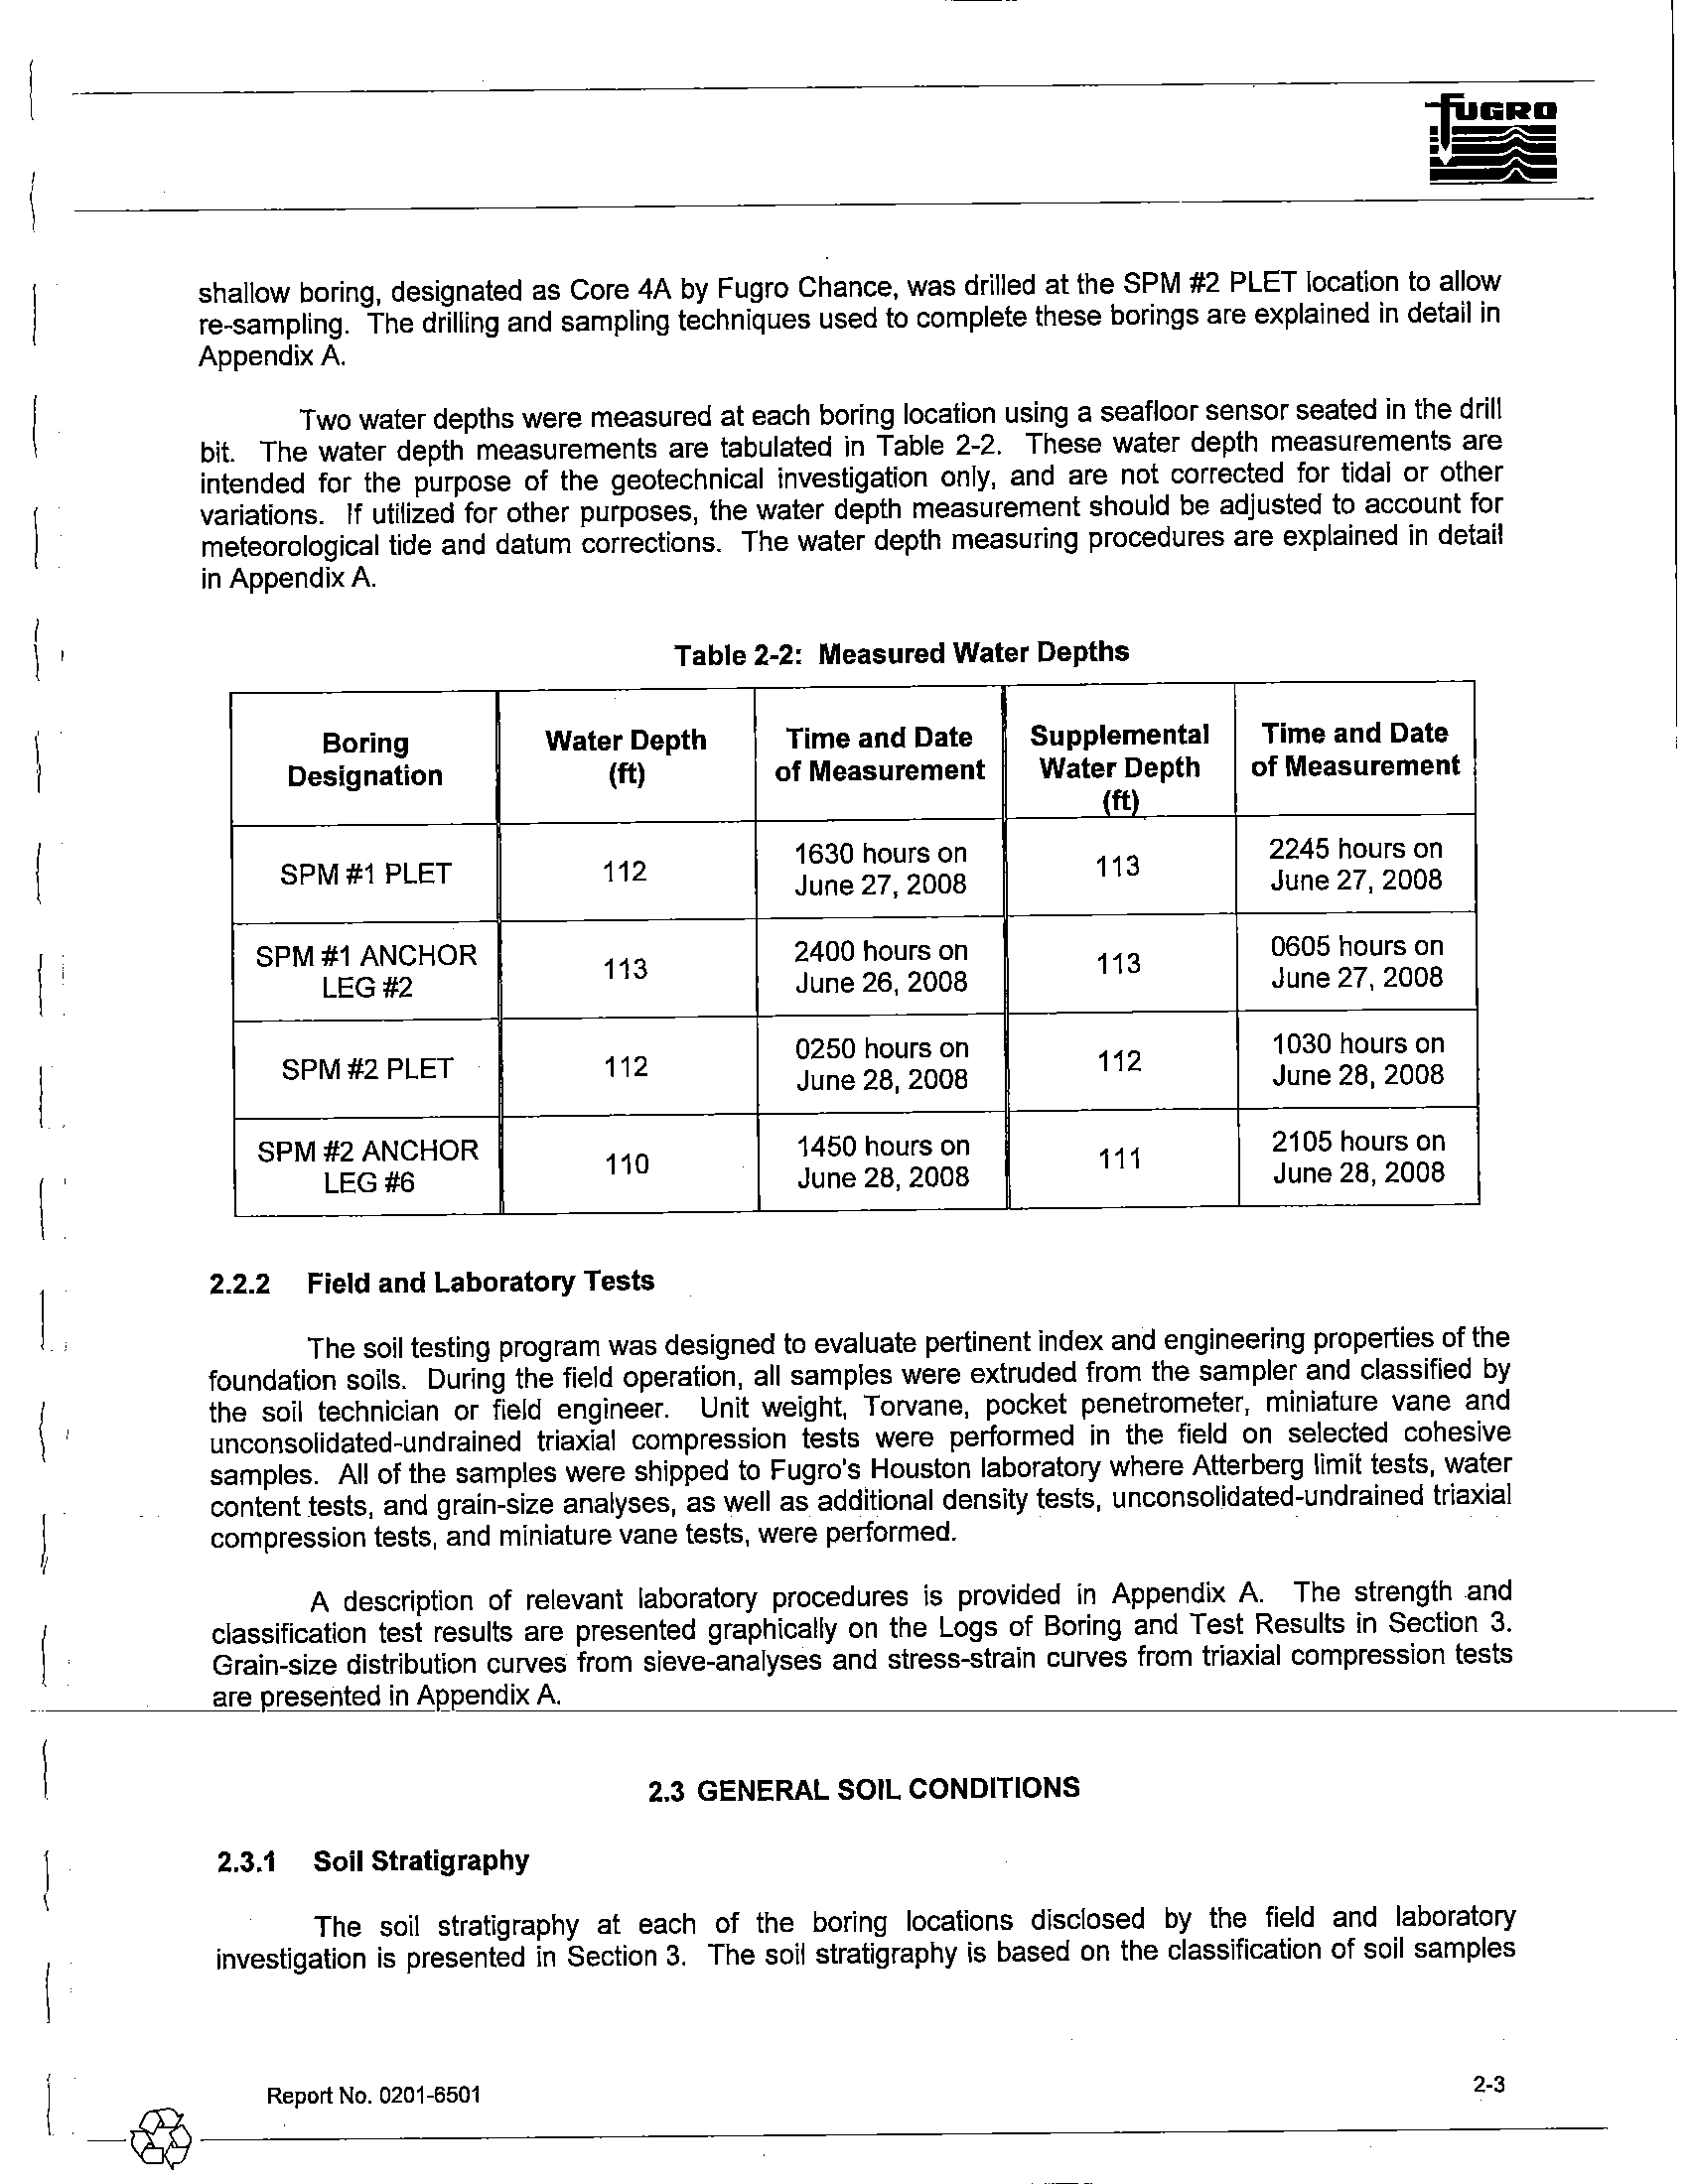
Two water depths were measured at each boring location using a seafloor sensor seated in the drill
bit. The water depth measurements are tabulated in Table 2-2. These water depth measurements are
intended for the purpose
of the geotechnical investigation only, and are not corrected for tidal or other
variations.
If utilized for other purposes, the water depth measurement should be adjusted to account for
meteorological tide and datum corrections. The water depth measuring procedures are explained in detail
in Appendix A.
\ '
Table 2-2: Measured Water Depths
Boring
Water Depth
Time and Date
Supplemental
Time and Date
Designation
(ft)
of Measurement
Water Depth
of Measurement
(ft)
SPM#1 PLET
112
1630 hours on
113
2245 hours on
June 27,2008
June 27, 2008
SPM
#1 ANCHOR
113
2400 hours on
113
0605 hours
on
LEG #2
June 26, 2008
June 27, 2008
SPM#2 PLET
112
0250 hours
on
112
1030 hours
on
June 28, 2008
June 28, 2008
SPM #2 ANCHOR
110
1450 hours on
111
2105 hours on
LEG #6
June 28, 2008
June 28, 2008
2.2.2 Field and
Laboratory Tests
The soil testing program was designed to evaluate pertinent index and engineering properties of the
foundation soils. During the field operation, all samples were extruded from the sampler and classified by
the soil technician or field engineer.
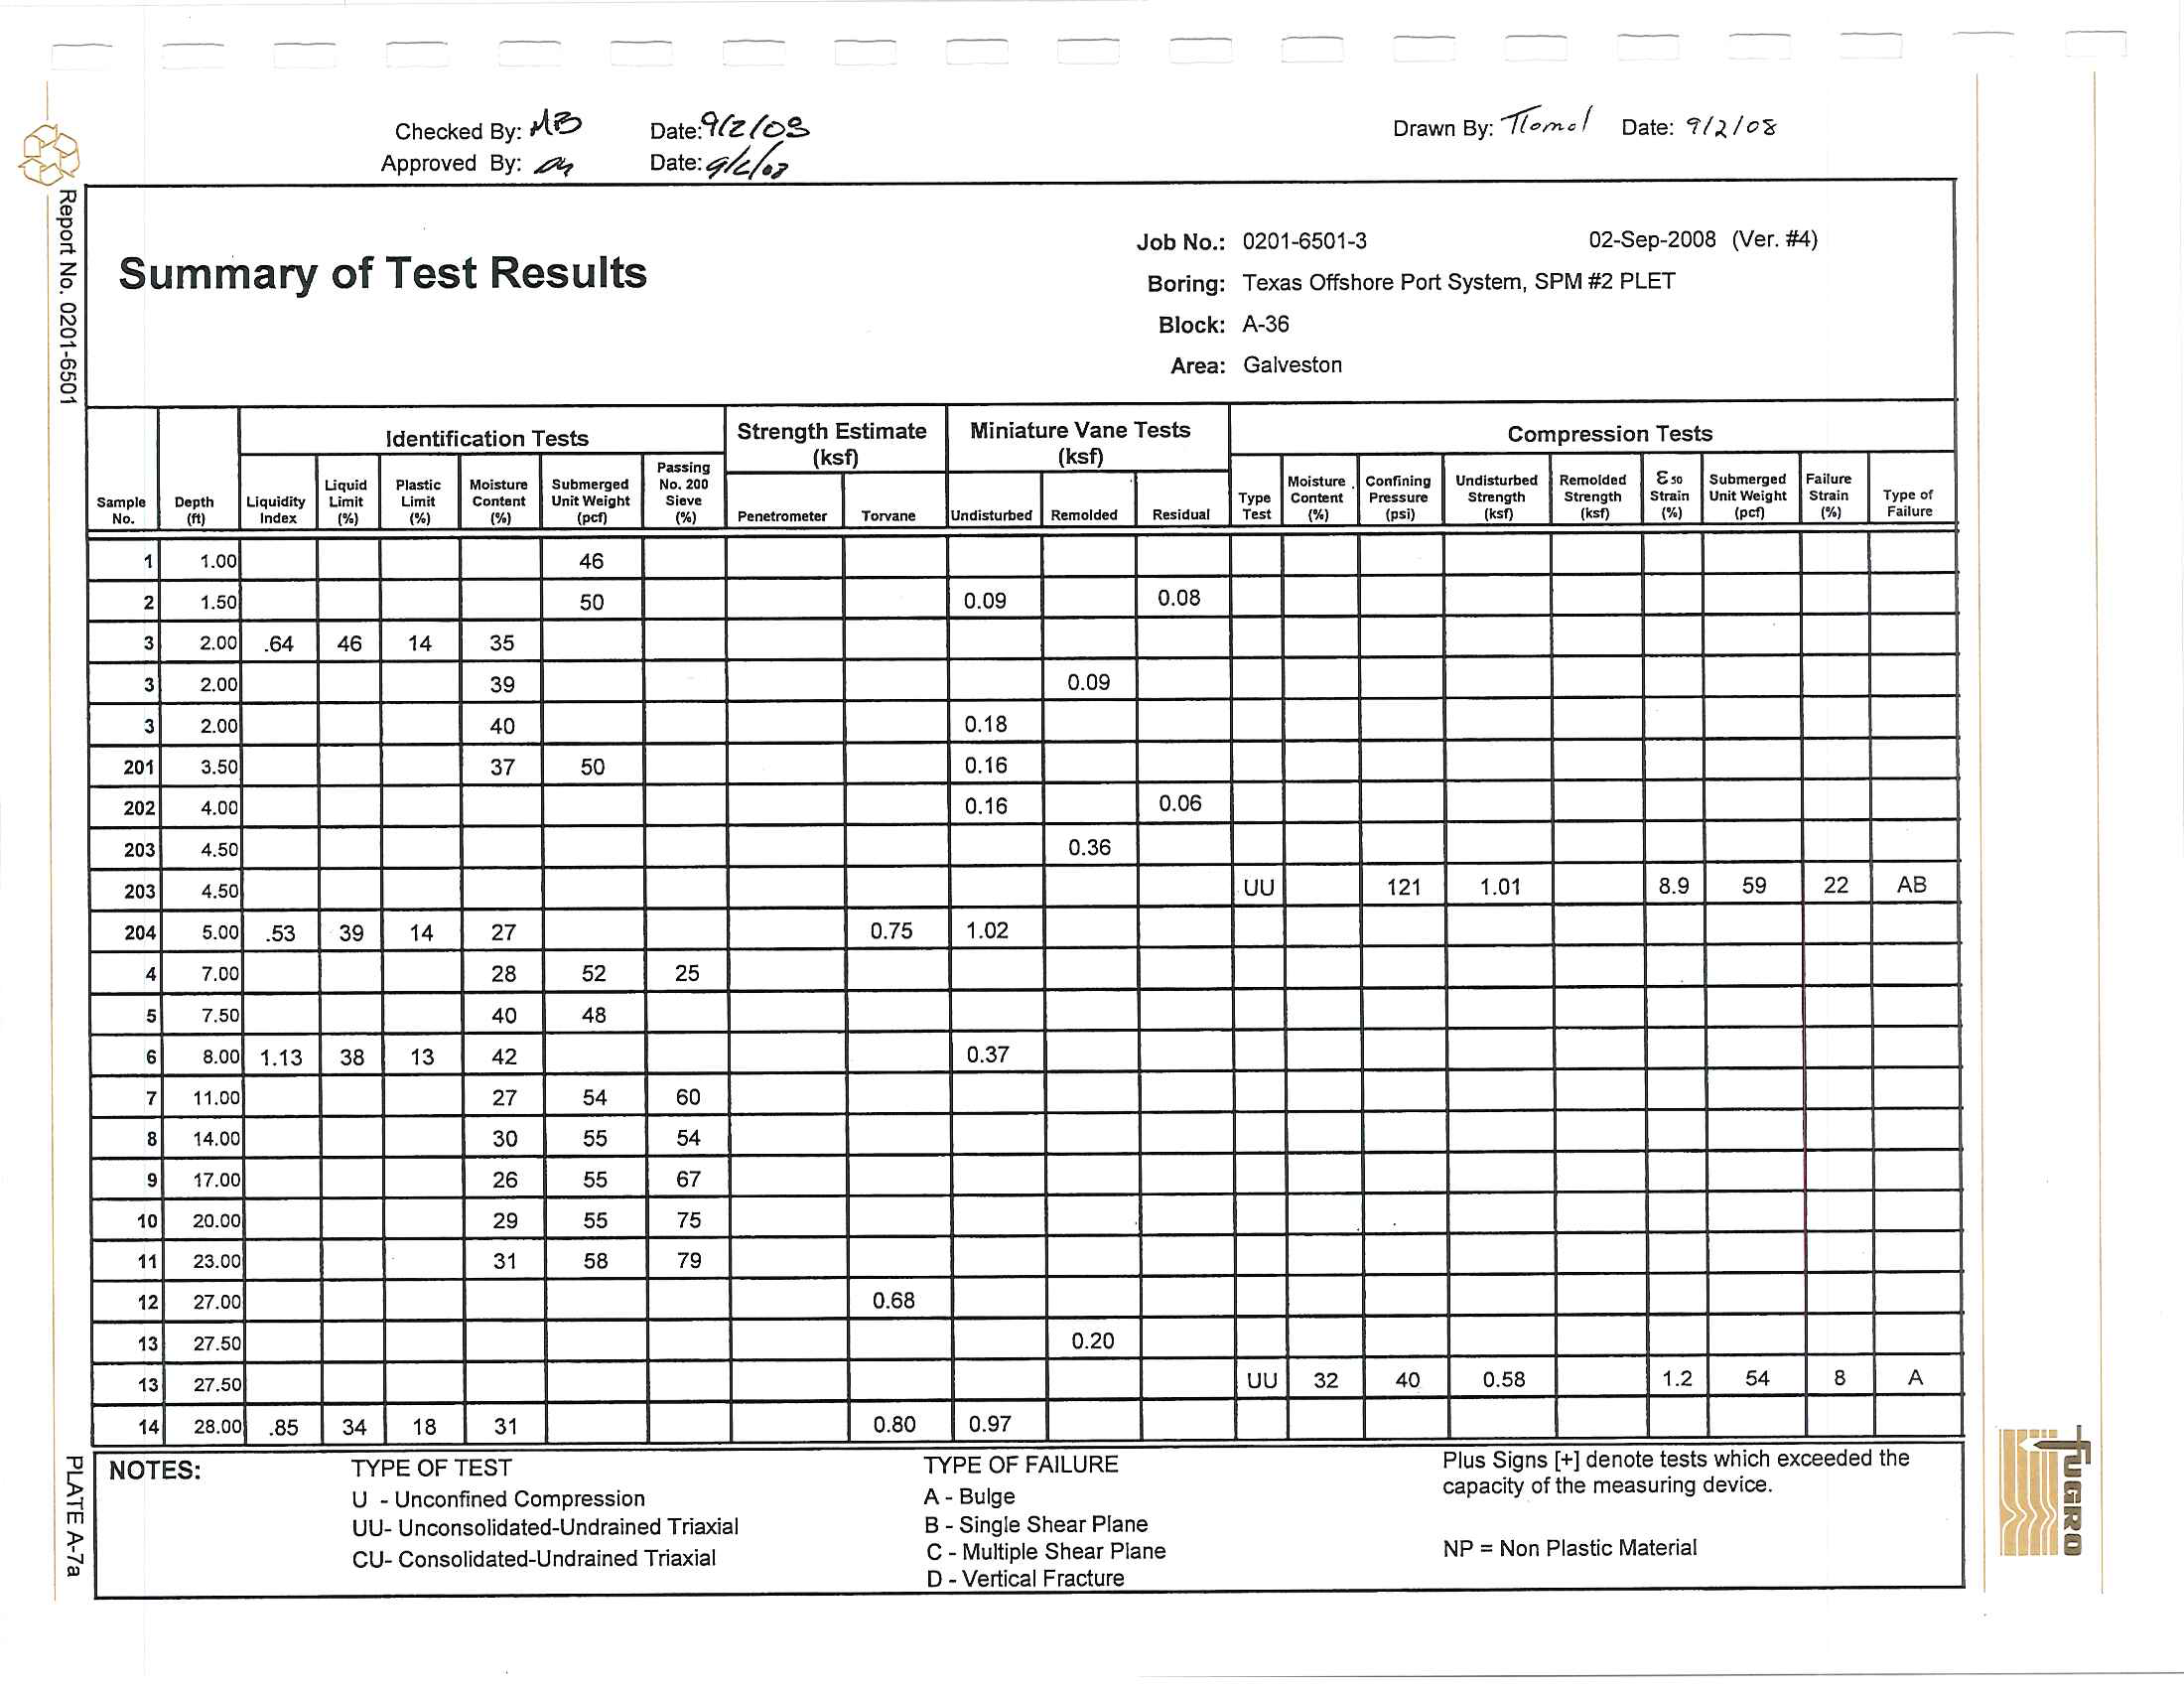
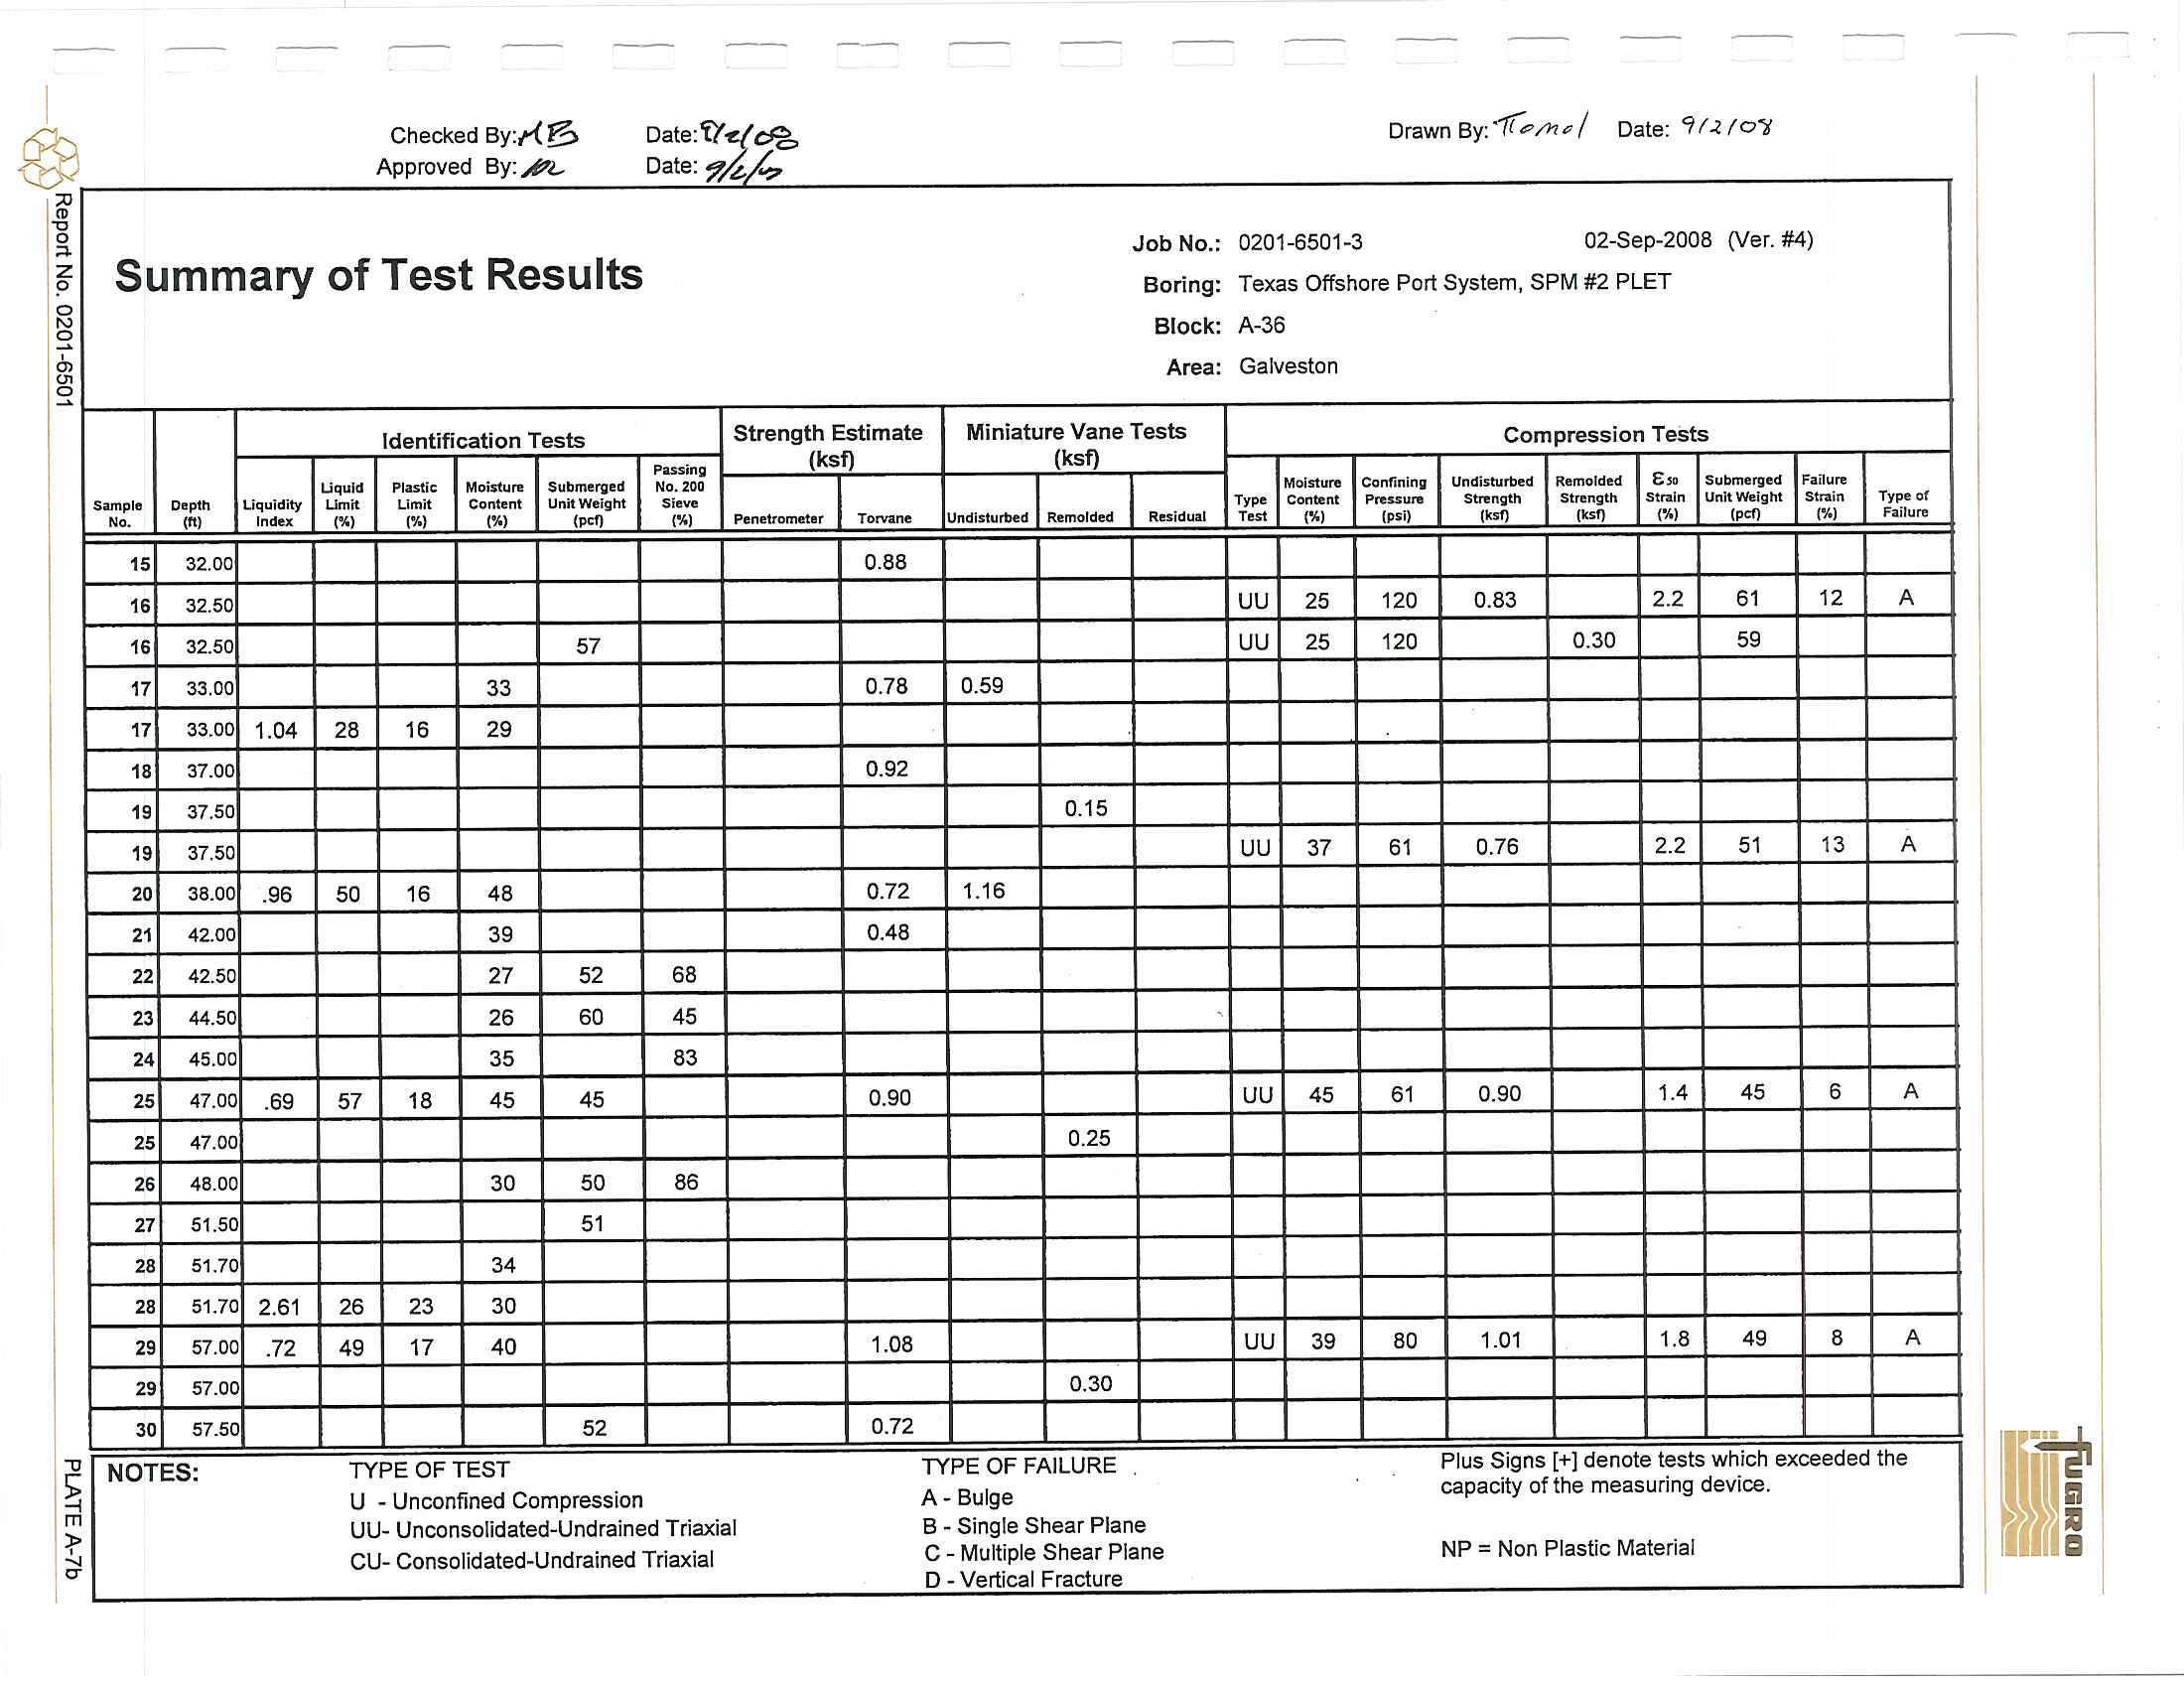
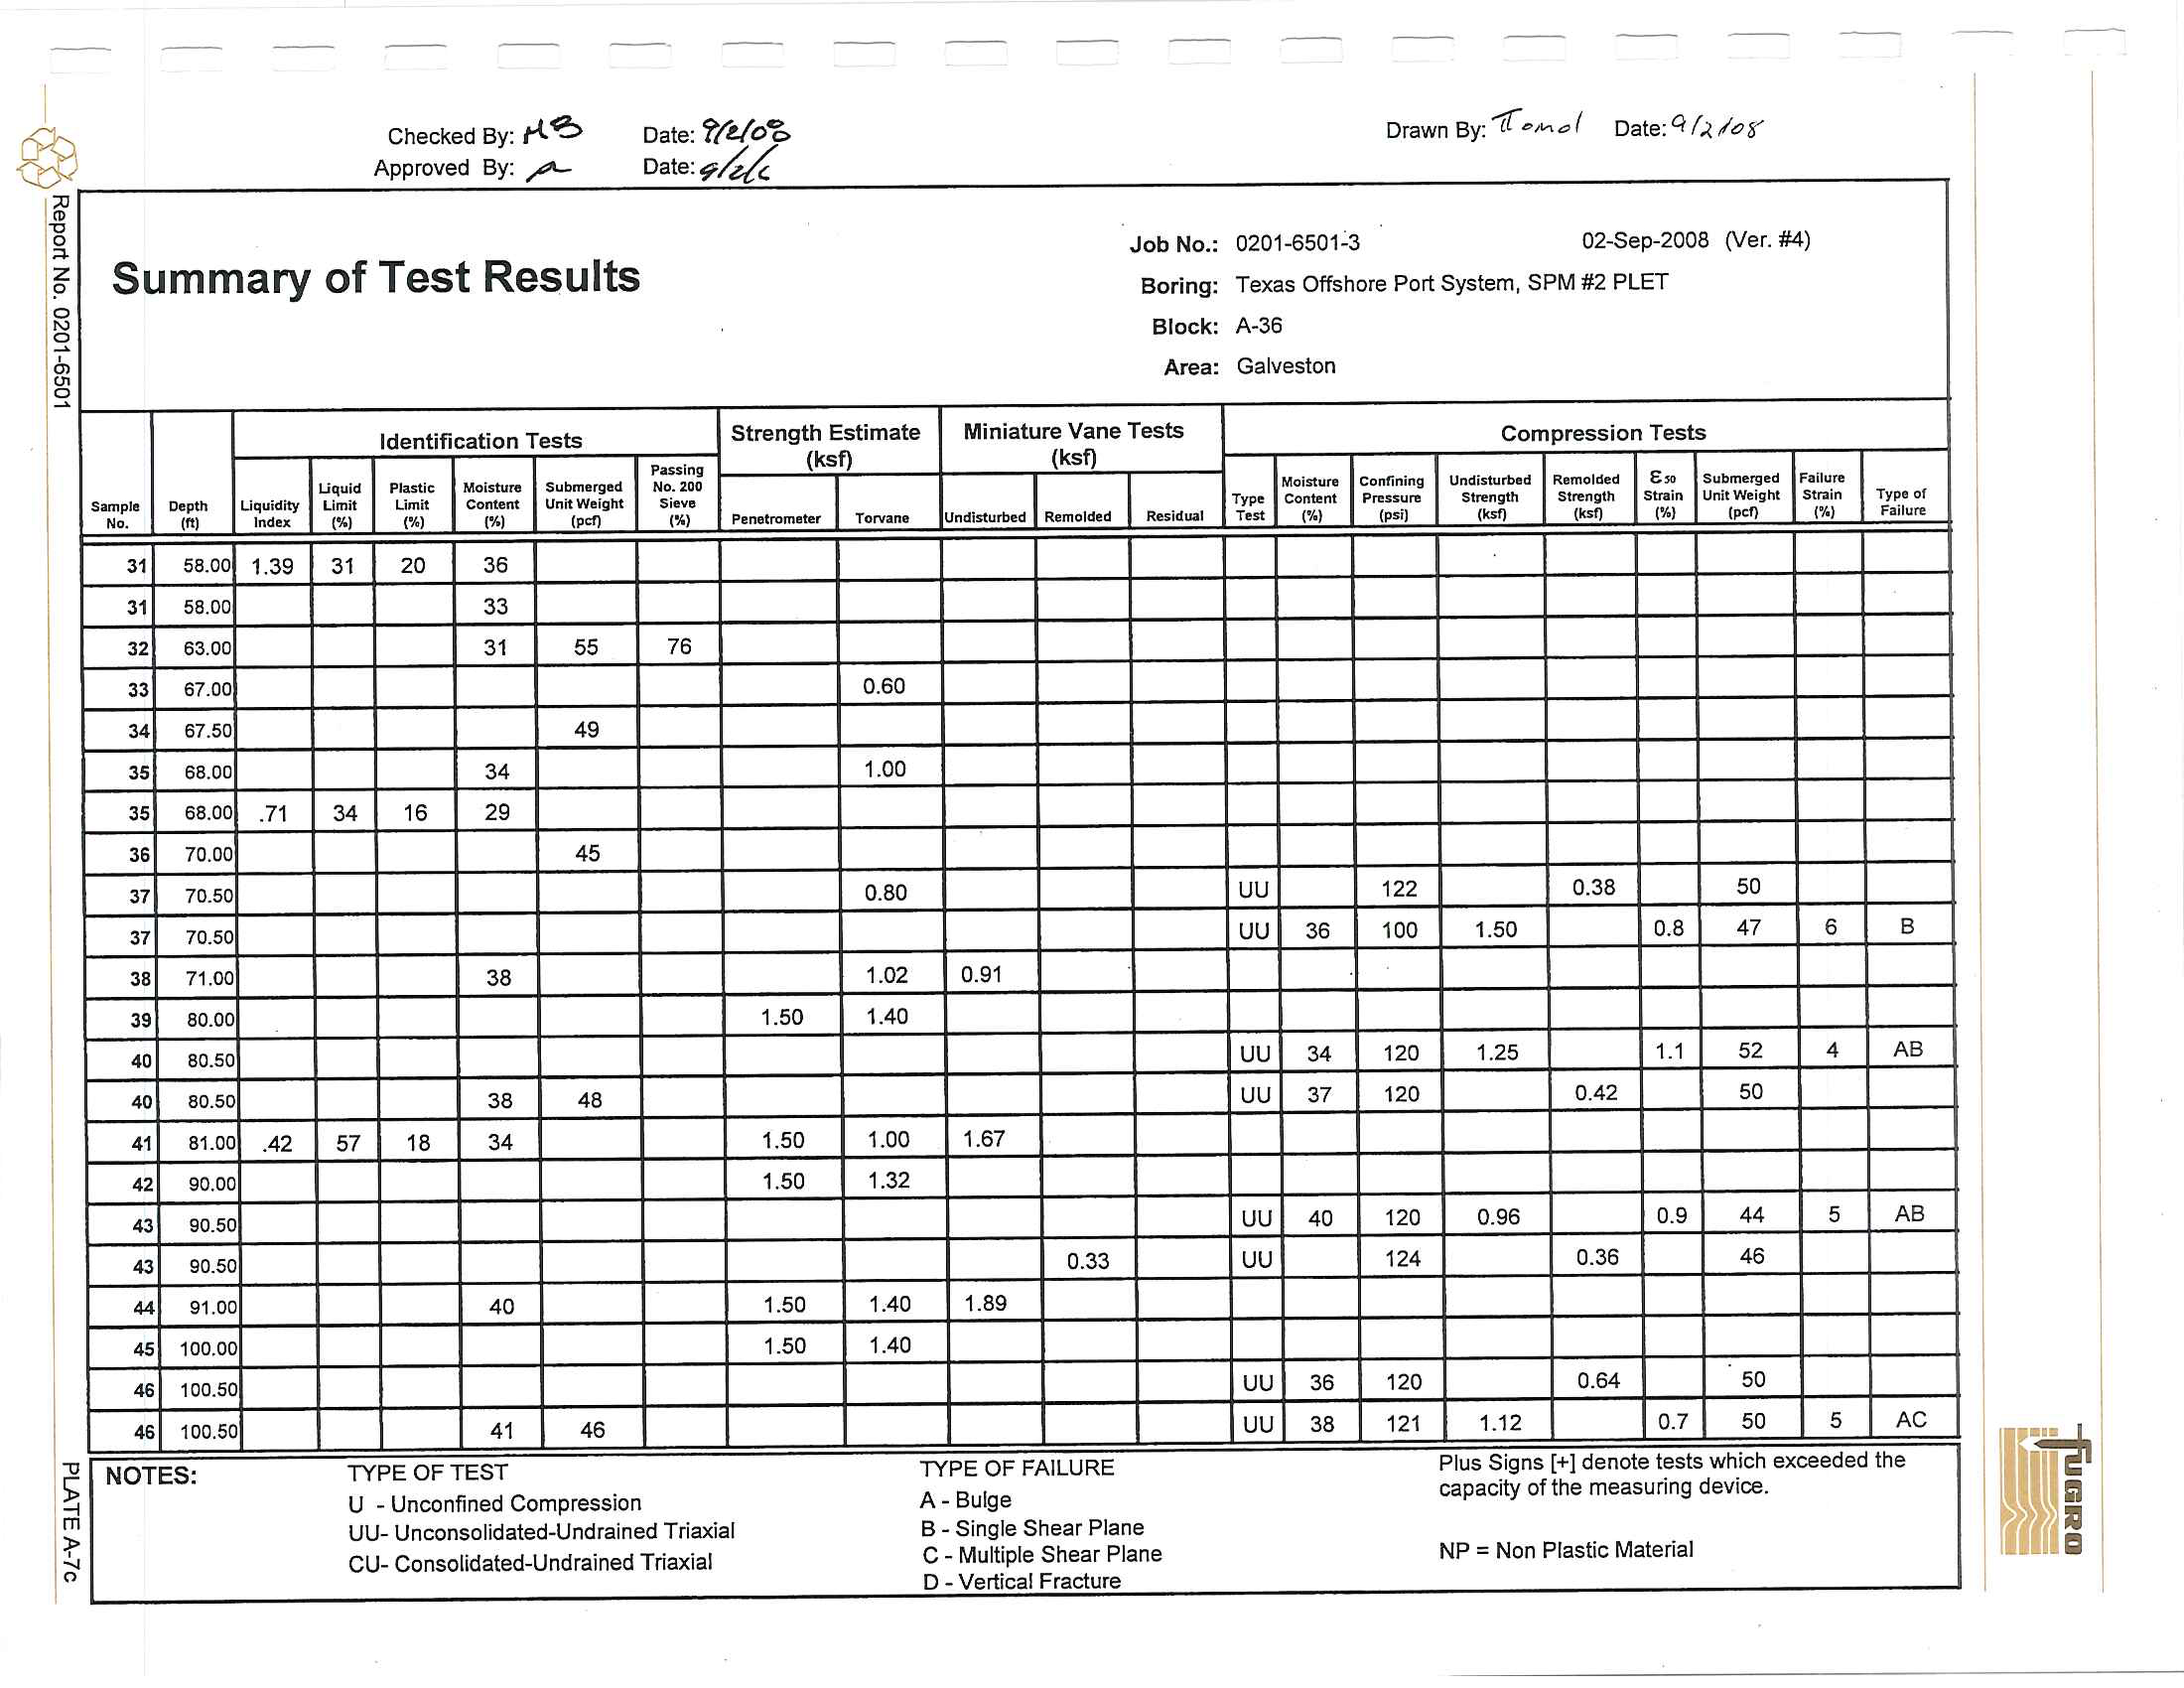
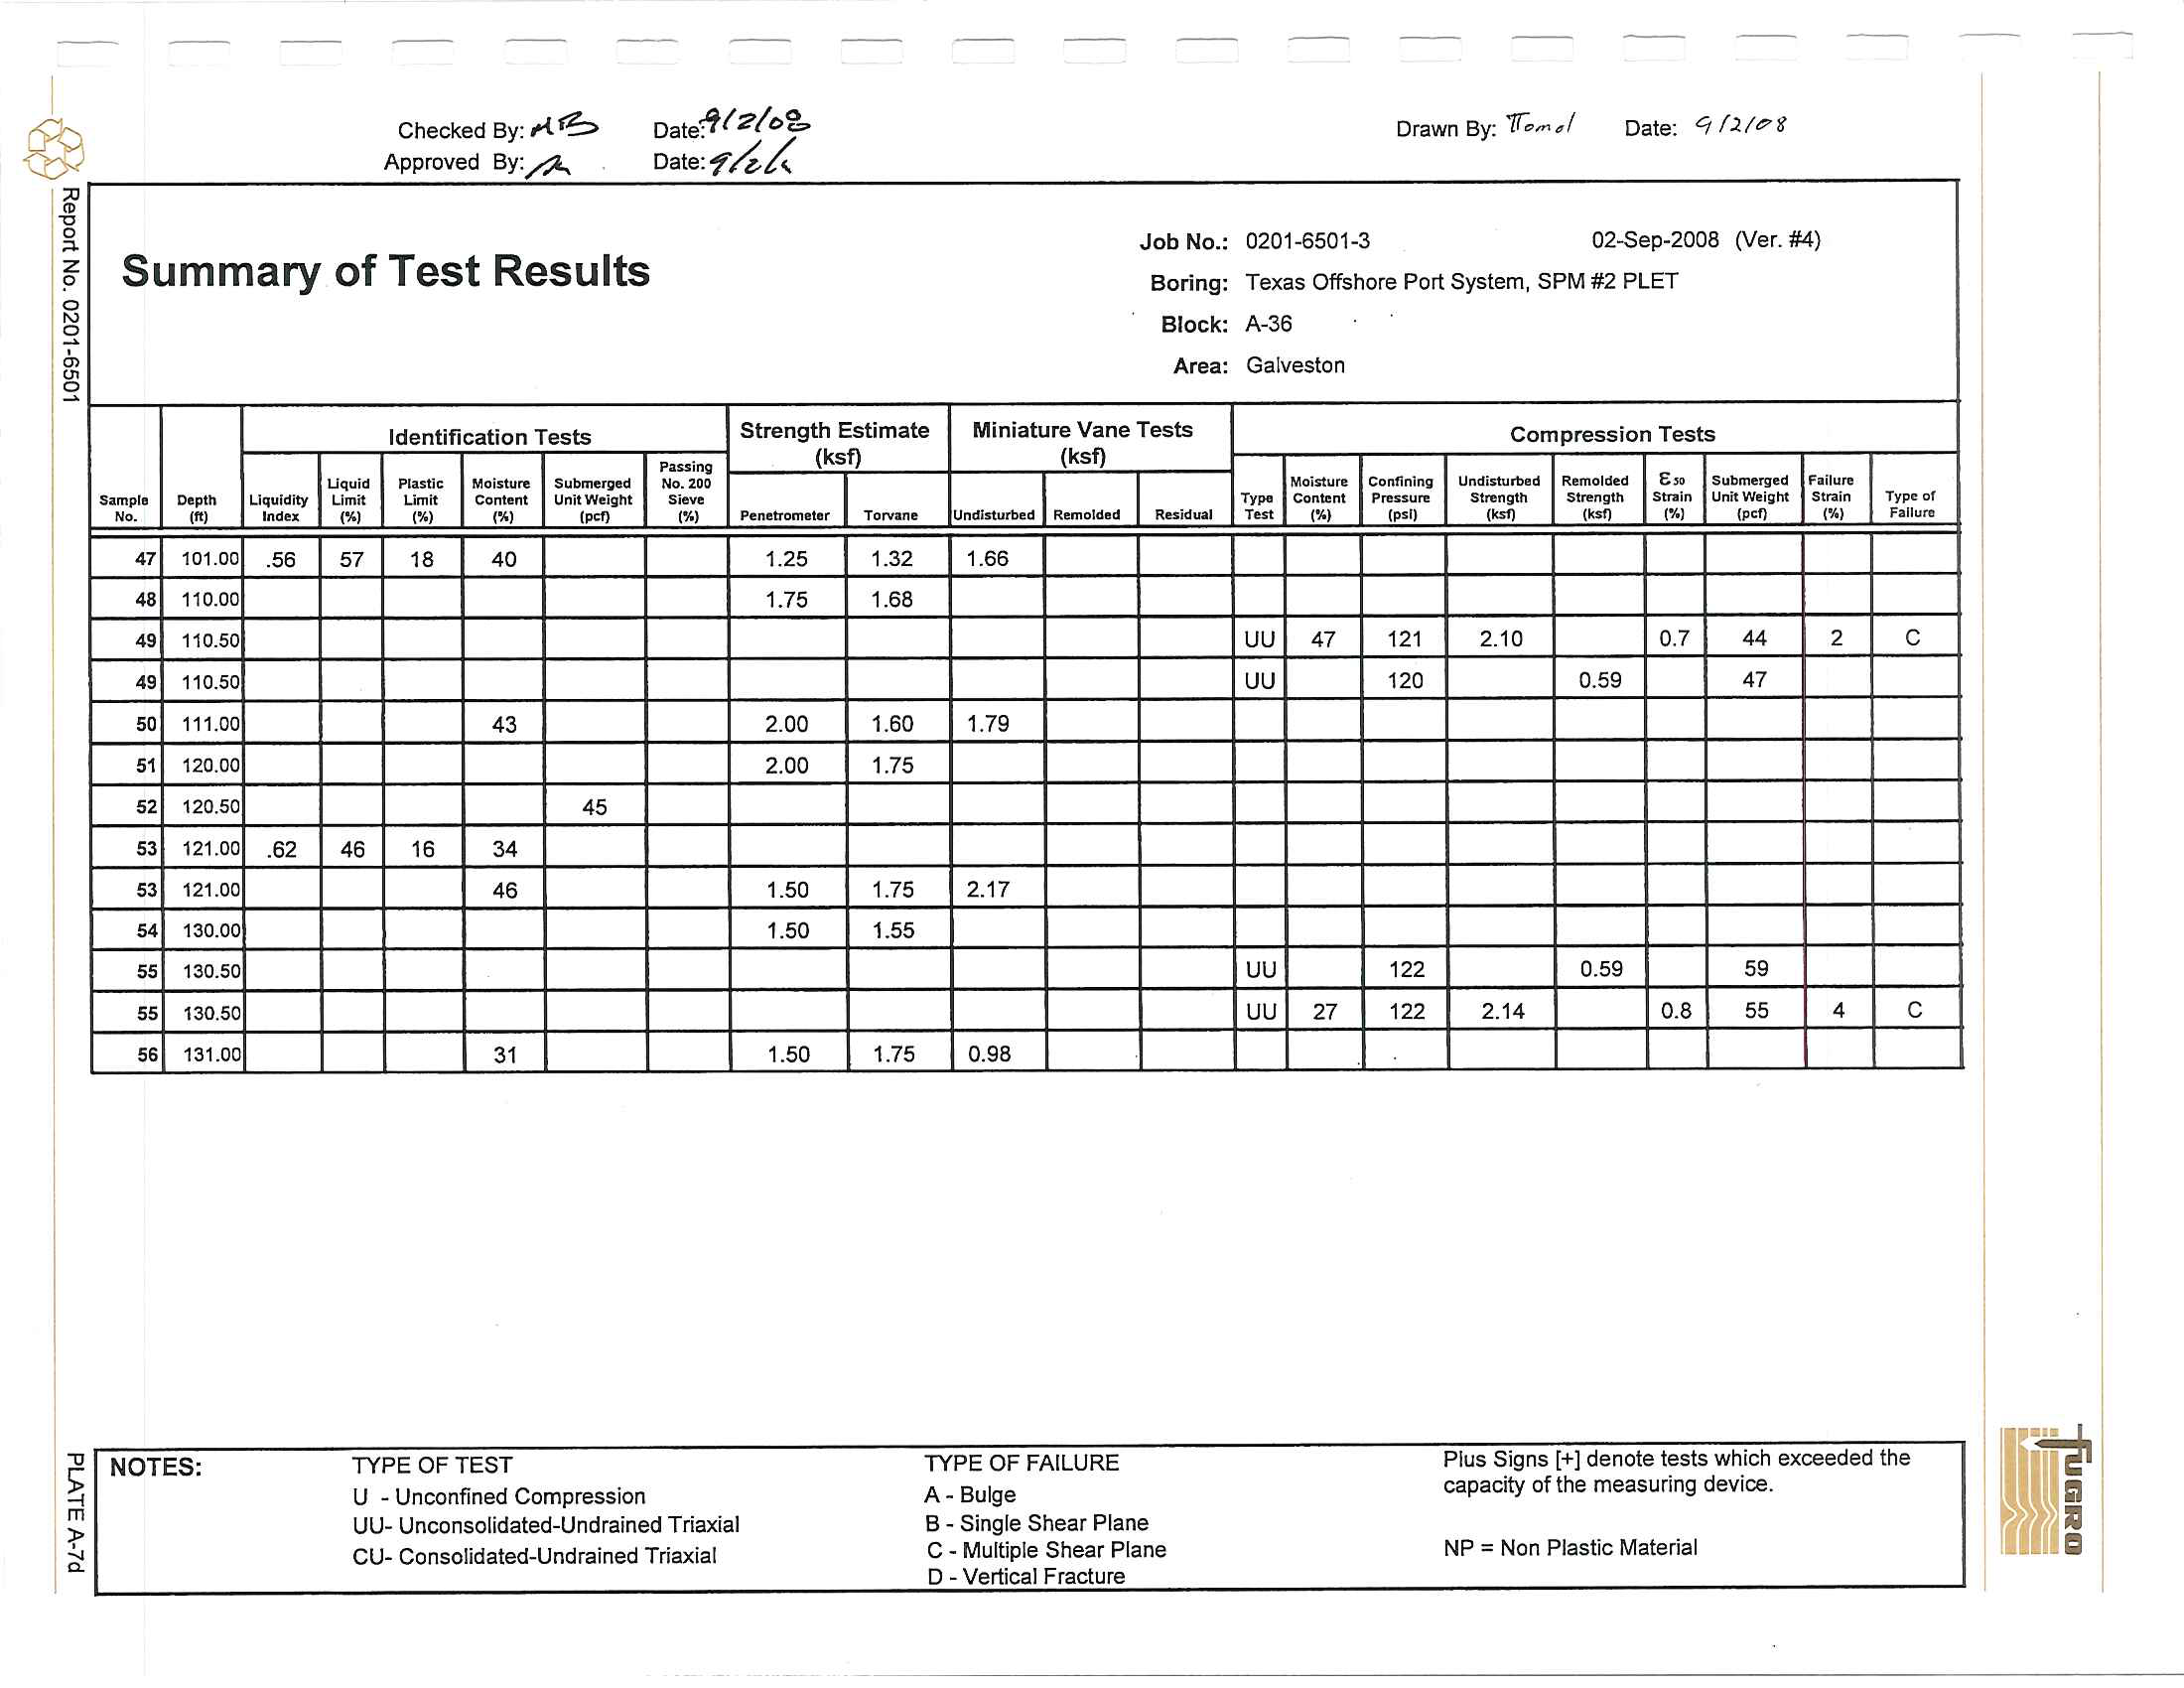
Unit weight, Torvane, pocket penetrometer, miniature vane and
unconsolidated-undrained triaxial compression tests were performed
in the field on selected cohesive
samples. All
of the samples were shipped to Fugro's Houston laboratory where Atterberg limit tests, water
content tests, and grain-size analyses, as well as additional density tests, unconsolidated-undrained triaxial
compression tests, and miniature vane tests, were performed.
A description
of relevant laboratory procedures is provided in Appendix A. The strength and
classification test results are presented graphically
on the Logs of Boring and Test Results in Section 3.
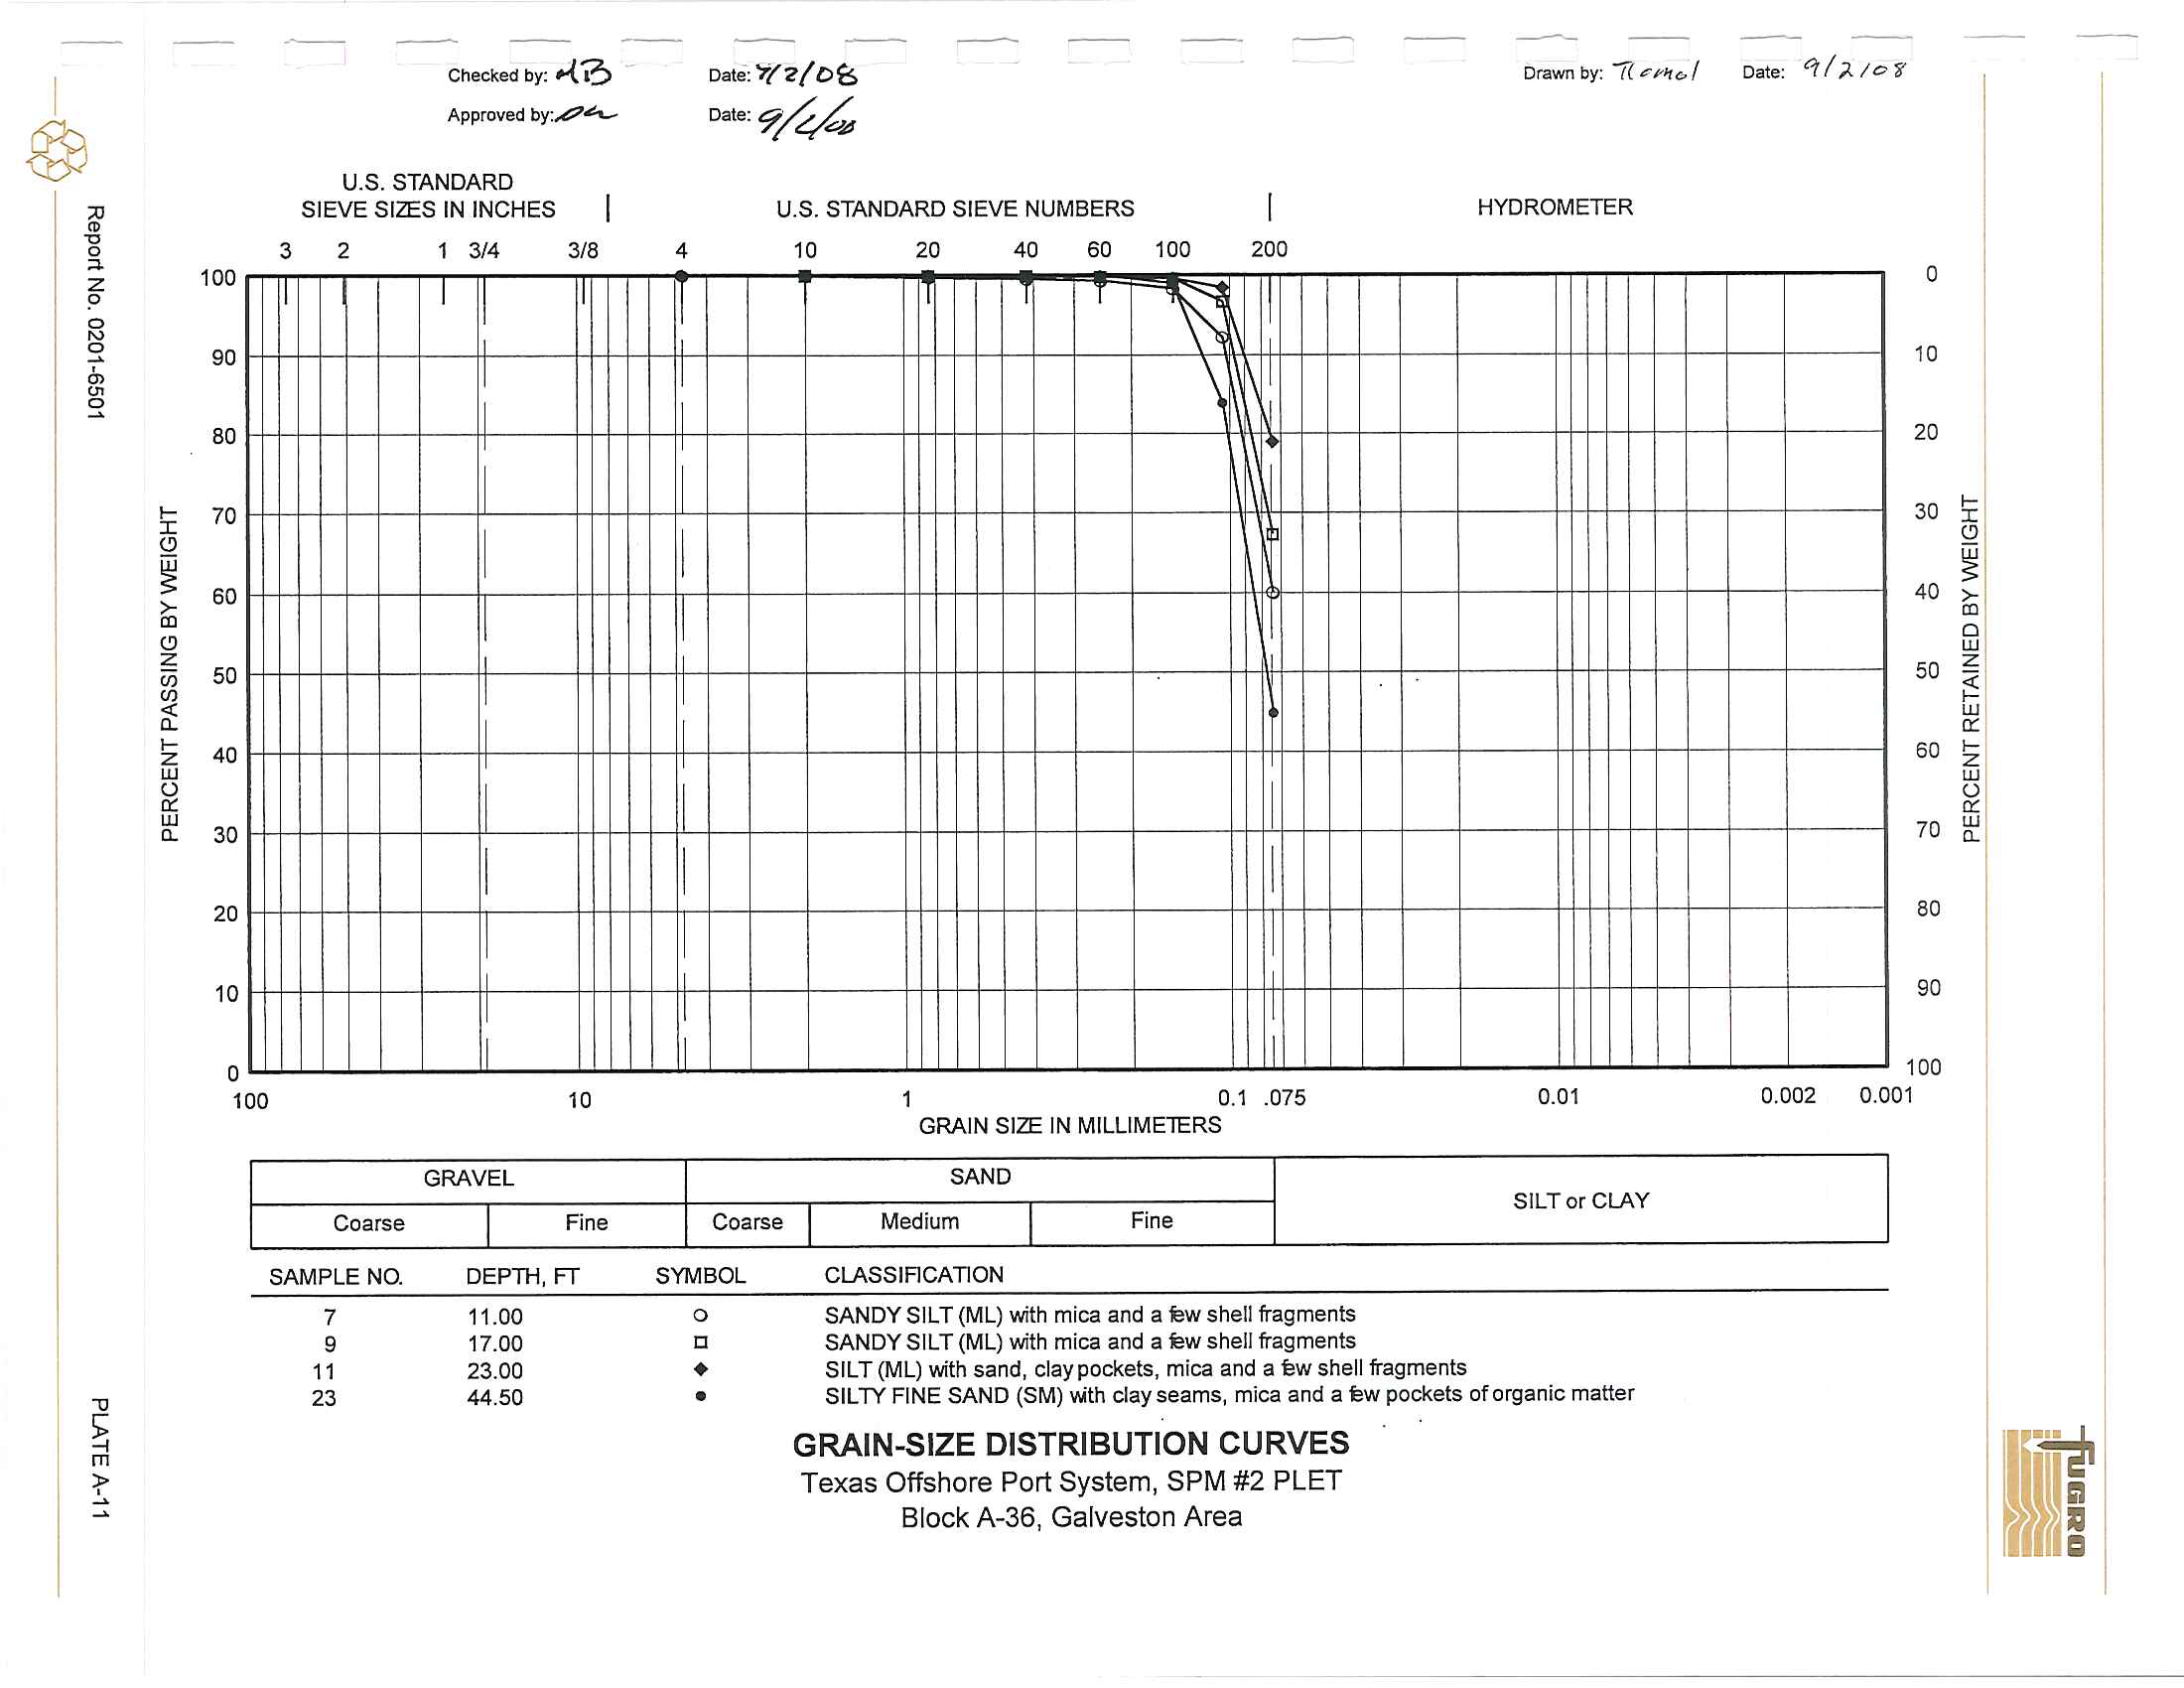
Grain-Size distribution curves from sieve-analyses and stress-strain curves from triaxial compression tests
____--'a"re
___llresented in
AflP~e~n~d~ix~A~.
______________________________
2.3 GENERAL SOIL CONDITIONS
2.3.1
Soil Stratigraphy
The soil stratigraphy at each of the boring locations disclosed by the field and laboratory
investigation
is presented in Section 3. The soil stratigraphy is based on the classification of soil samples
I __
~
___
R_ep_o_rt_N_O_.O_2_01_-_65_0_1______________________________2_.3_____
~
(
D
11-
I
l
1
~
(~:
...
x =
3,274,000«
~
Y =
275,800
It
N
~
...
X
=
3,279,000ft
Block A-36
Galveston Area
...
X
=
3,284,000ft
~
Y =
270,800
It
SPM.!2,.Anchor Leg #6'"
-
.....
Offshore
•
Terminal
/
,
~
Y =
265,800
It
I
SPM #1 PLET \
SPM
#1 Anchclr Leg
#21
\
•
I
\
1,470f!,
"
/
....
-
~
Y =
260,800
It
,.
.....
/
'e
I
\
...
I SPM #2 PLET \
\
1,47~1
"
.... _-
"
...
~
m
~
1l
---~-~------I---------~~----------------------------------------------I-----------
Ii!
15..
u
~
«
~
Projection: Texas South Central Zone Coordinates
__@
Report No.
0201-6501
PLAN OF BORINGS
Texas Offshore Port System, Offshore Terminal Location
BlockA-36, Galveston Area
PLATE
2-1
TERMS AND SYMBOLS USED ON BORING LOG
SOIL TYPES
SAMPLER TYPES
[]Sand
m
Sill
~Clay
~GraVel
~Debris
~Liner
~In
Silu
o:Iog
o
••
~Thin-
...
..•
Walled
Test
~coral
Tube
m
SillY
mSandY
~SandY
~peator
• Sand
. Sill
. Clay
Highly
Organic
I
~
[
J;
j
Sand
~Clayey
mClayey
Silt
mSillY
Clay
I
Rock
~PiSlon
v.,.v
Shell
~ROCk
~NO
"
Core
Recovery
"
"
I
SOIL GRAIN SIZE
u.s. STANDARD SIEVE
J"
314"
4
10
40
200
COBBLES
GRAVEL
SAND
SILT
COARSE
FINE
COARSE
MEDIUM
FINE
152
76.2
19.1
4.76
2.00
0.420
0.074
SOil GRAIN SIZE IN MILLIMETERS
STRENGTH OF COHESIVE SOILS(1)
Undrained
DENSITY OF GRANULAR SOILS
2•J
)
Consistency
Shear Strength,
Kips Per
89 Ft
Descriptive
*Relative
Term
Density,
%
Very Soft.................................................
less than 0.25
0.25100.50
Very Loose.................................................
less than 15
Soft............................................................
Loose................................ ,... .......................... 15 to 35
Firm................................................ ...........
0.5010 1.00
Medium Dense.................................................
351065
SliIL.........................................................
1.0010 2.00
Oense.............................................................
65 to 85
Very Sliff....................................................
2.00 to 4.00
Very Dense............................................
greater than
85
Hard..................................................",
greater than 4.00
*Estimated from sampler driving record
.Slickensided..........................
Fissured................................
Pocket. .................................
Parting.......................
Seam....................................
Layer....................................
Laminated.............................
SOIL STRUCTURE(1)
Having planes of weakness that appear slick and glossy. The degree of slickensidedness depends
upon the spacing
of slickensides and the ease of breaking along these planes.
Containing shrinkage
or relief cracks, often filled with fine sand or
sil~
usually more or less vertical.
Inclusion
of material of different texture that is smaller than the diameter of the sample.
InclusiOr1less
tfian'1/8 'iilch-ftlick extenCing-tIlrough-too-sample: -----
InclUsion
1/8
inch to 3 inches thick extending through the sample.
Inclusion greater than 3 inches
thick extending through the sample.
Soil
sample composed of alternating partings or seams of different soil types.
---~-~--------~~~~,-------------~~~~~~~~~~~~~~~~~~~~~Ch.~~-----------------------------
"C
"C
Interlayered...........................
Soil sample composed of alternating layers of different soil types.
x..
~
' 0
~
!
.:;:-
Intermixed.............................
Soil sample composed of pockets of different soil types and layered or laminated structure is not
evident.
Calcareous............................
REFERENCES:
(1) ASTM D 2488
(2) ASCE Manual
56 (1976)
(3)
ASTM D 2049
Having appreciable quantities of carbonate.
Information on each boring log is a compilation
of subsurface conditions and soil or rock
classifications obtained from the field as well as from laboratory testing
of samples. Strata have been
interpreted
by commonly accepted procedures. The stratum lines on the log may be transitional and
approximate in nature.
Water level measurements refer only to those observed at the times and
places indicated in the text, and
may vary with
tim~,
geologic condition or construction activity.
I
Report No.
0201-6501
-~---------------------------------
PLATE 2-2
'"
,.
."
Report No. 0201-6501
,
,
,
,
,
j
,
LINe
82212
»>
'.00
;;::
'00
,
,
N
.00
~
~
,.
-<'","~UNeS22H
,
,
,
~
<i.e.<UHE
S22trJ
il
li!
,
!il:
+,
,
,
+
+
-,
+
•
SPM#2 Anchor Leg #6
,
~
,
, ,I,
::-+--+---'-------"'4------ll.....----+--..::..------t"---...c-----'----+---..::.-----
+,L.--<;i(,dINESlP:M
l"A;Sr
.. SPM#2 PLET
l
'"
~~~~_~
____!_________
~~~--------JL--_t----l.....l.....---------~,,------------l--_t------!0---------4-2~~-
~
_u~s~~»~sr
+
.. SPM#1 PLET
,
,
,
•
J
+
+
SPM#1 Anchor Leg #2 ,
,
,
I
1
'"
+
,
,
,
,
,
.•
..
,
,
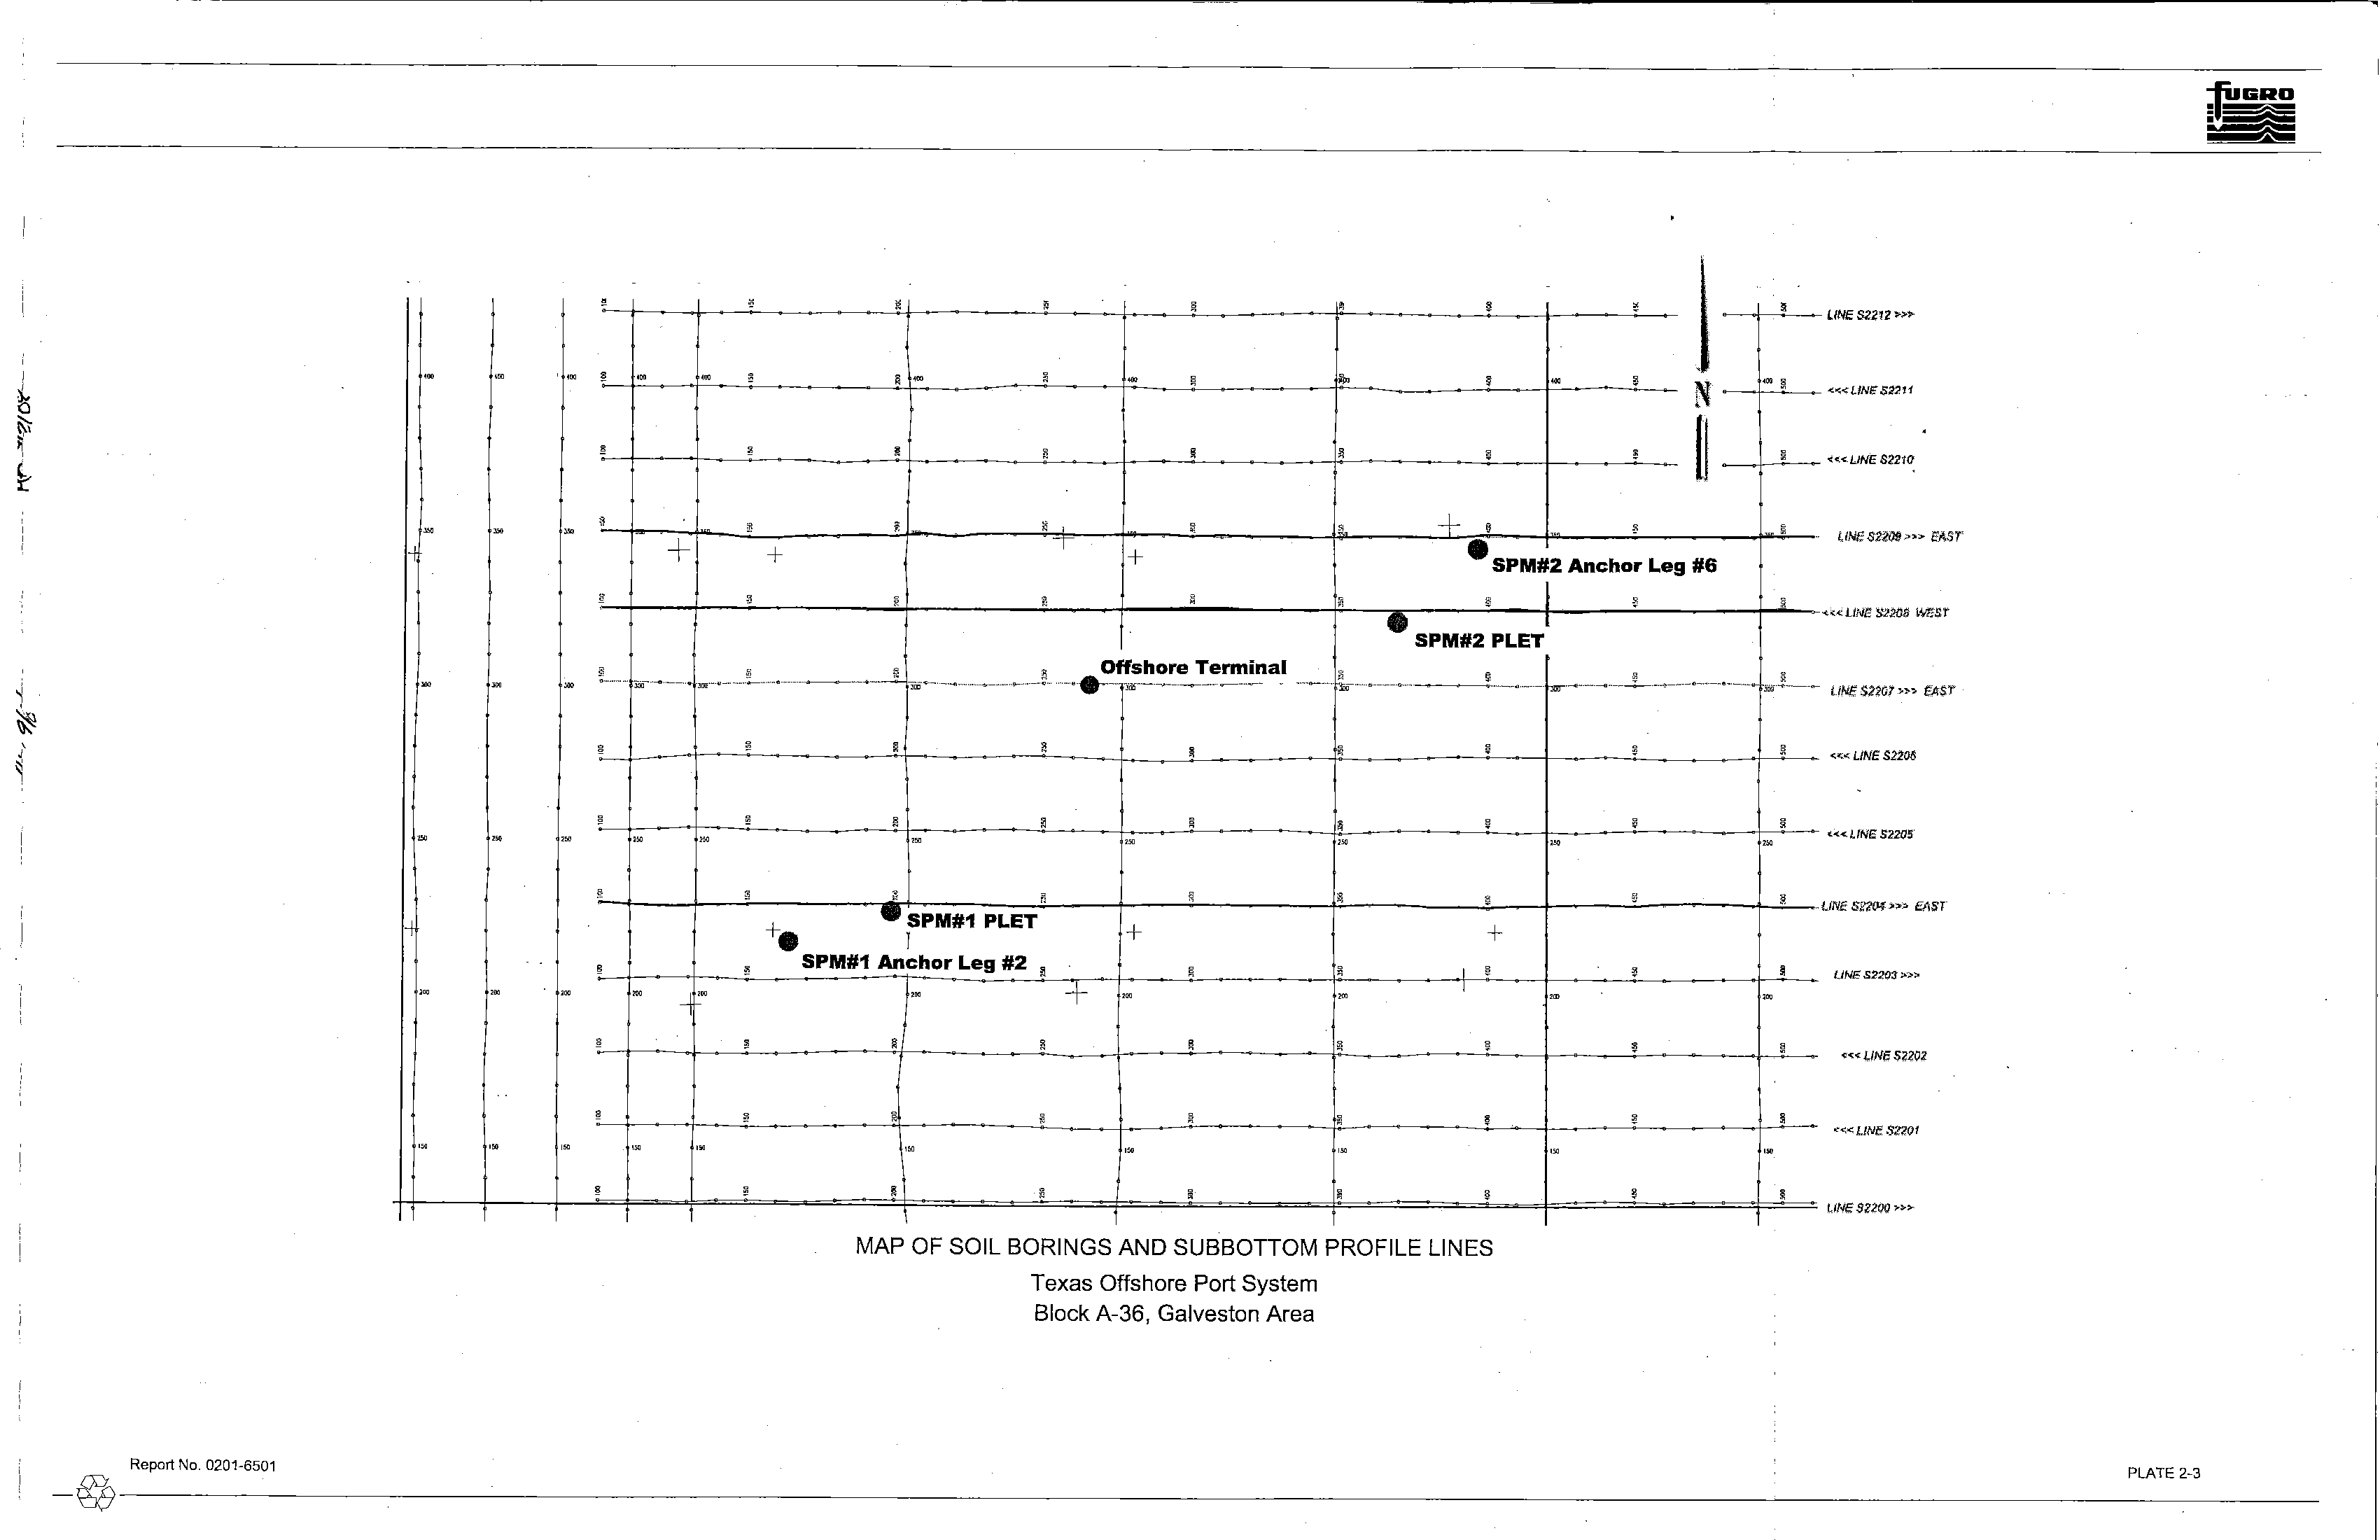
MAP OF SOIL BORINGS AND SUBBOTTOM PROFILE LINES
Texas Offshore Port System
Block A-36, Galveston Area
,
'"
,
,
....«
LINE .'5;,,'201
IJM~
$Z2Qt)
,..»
PLATE 2-3
-@-------------------------------------------------------------------------------
[~
[
3.3 SPM #2 PLET LOCATION
3.3.1
Introduction
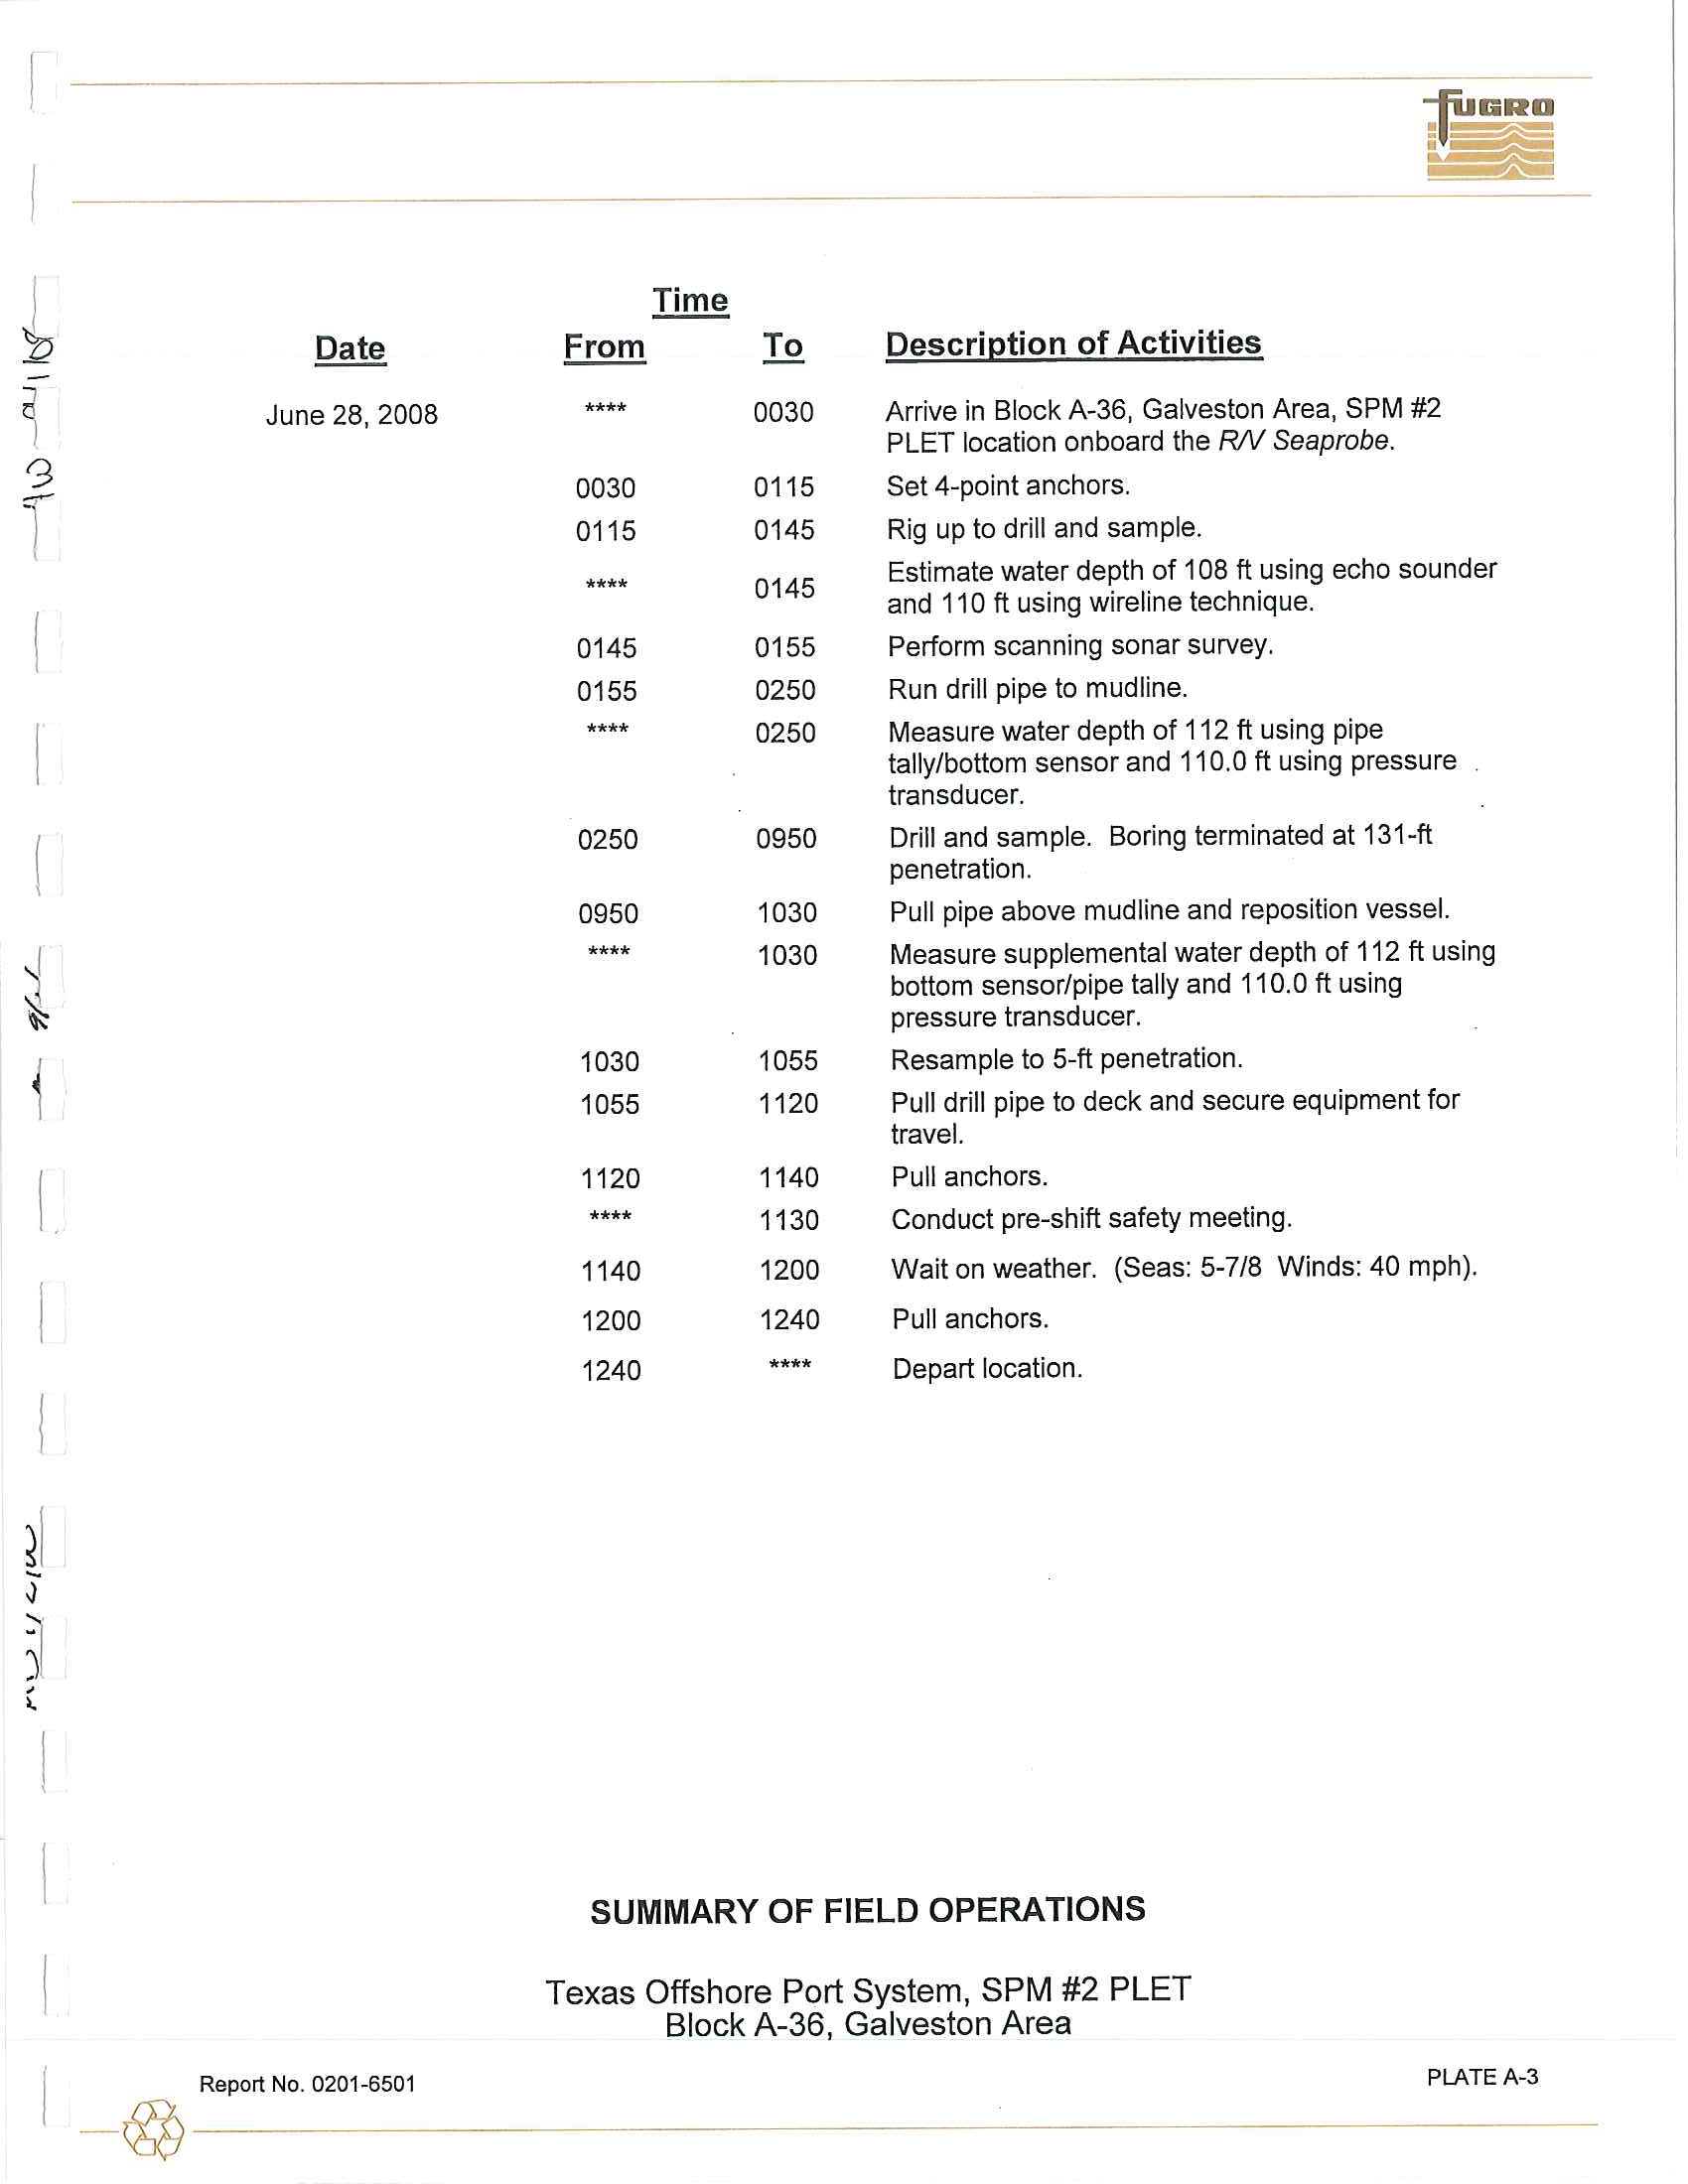
The field investigation at the location designated as SPM #2 PLET was performed on
June 28. 2008.
Soil sampling was performed
to 131-ft penetration at Texas South Central Zone
Coordinates X
=
3,283,617 ft and Y
=
269,118 ft. A second set of coordinates is presented in the survey
report (Appendix
C) for the SPM #2 PLET boring to account for 5 ft of additional surface soil samples taken
at the supplemental water depth location. The measured water depth was 112 ft.
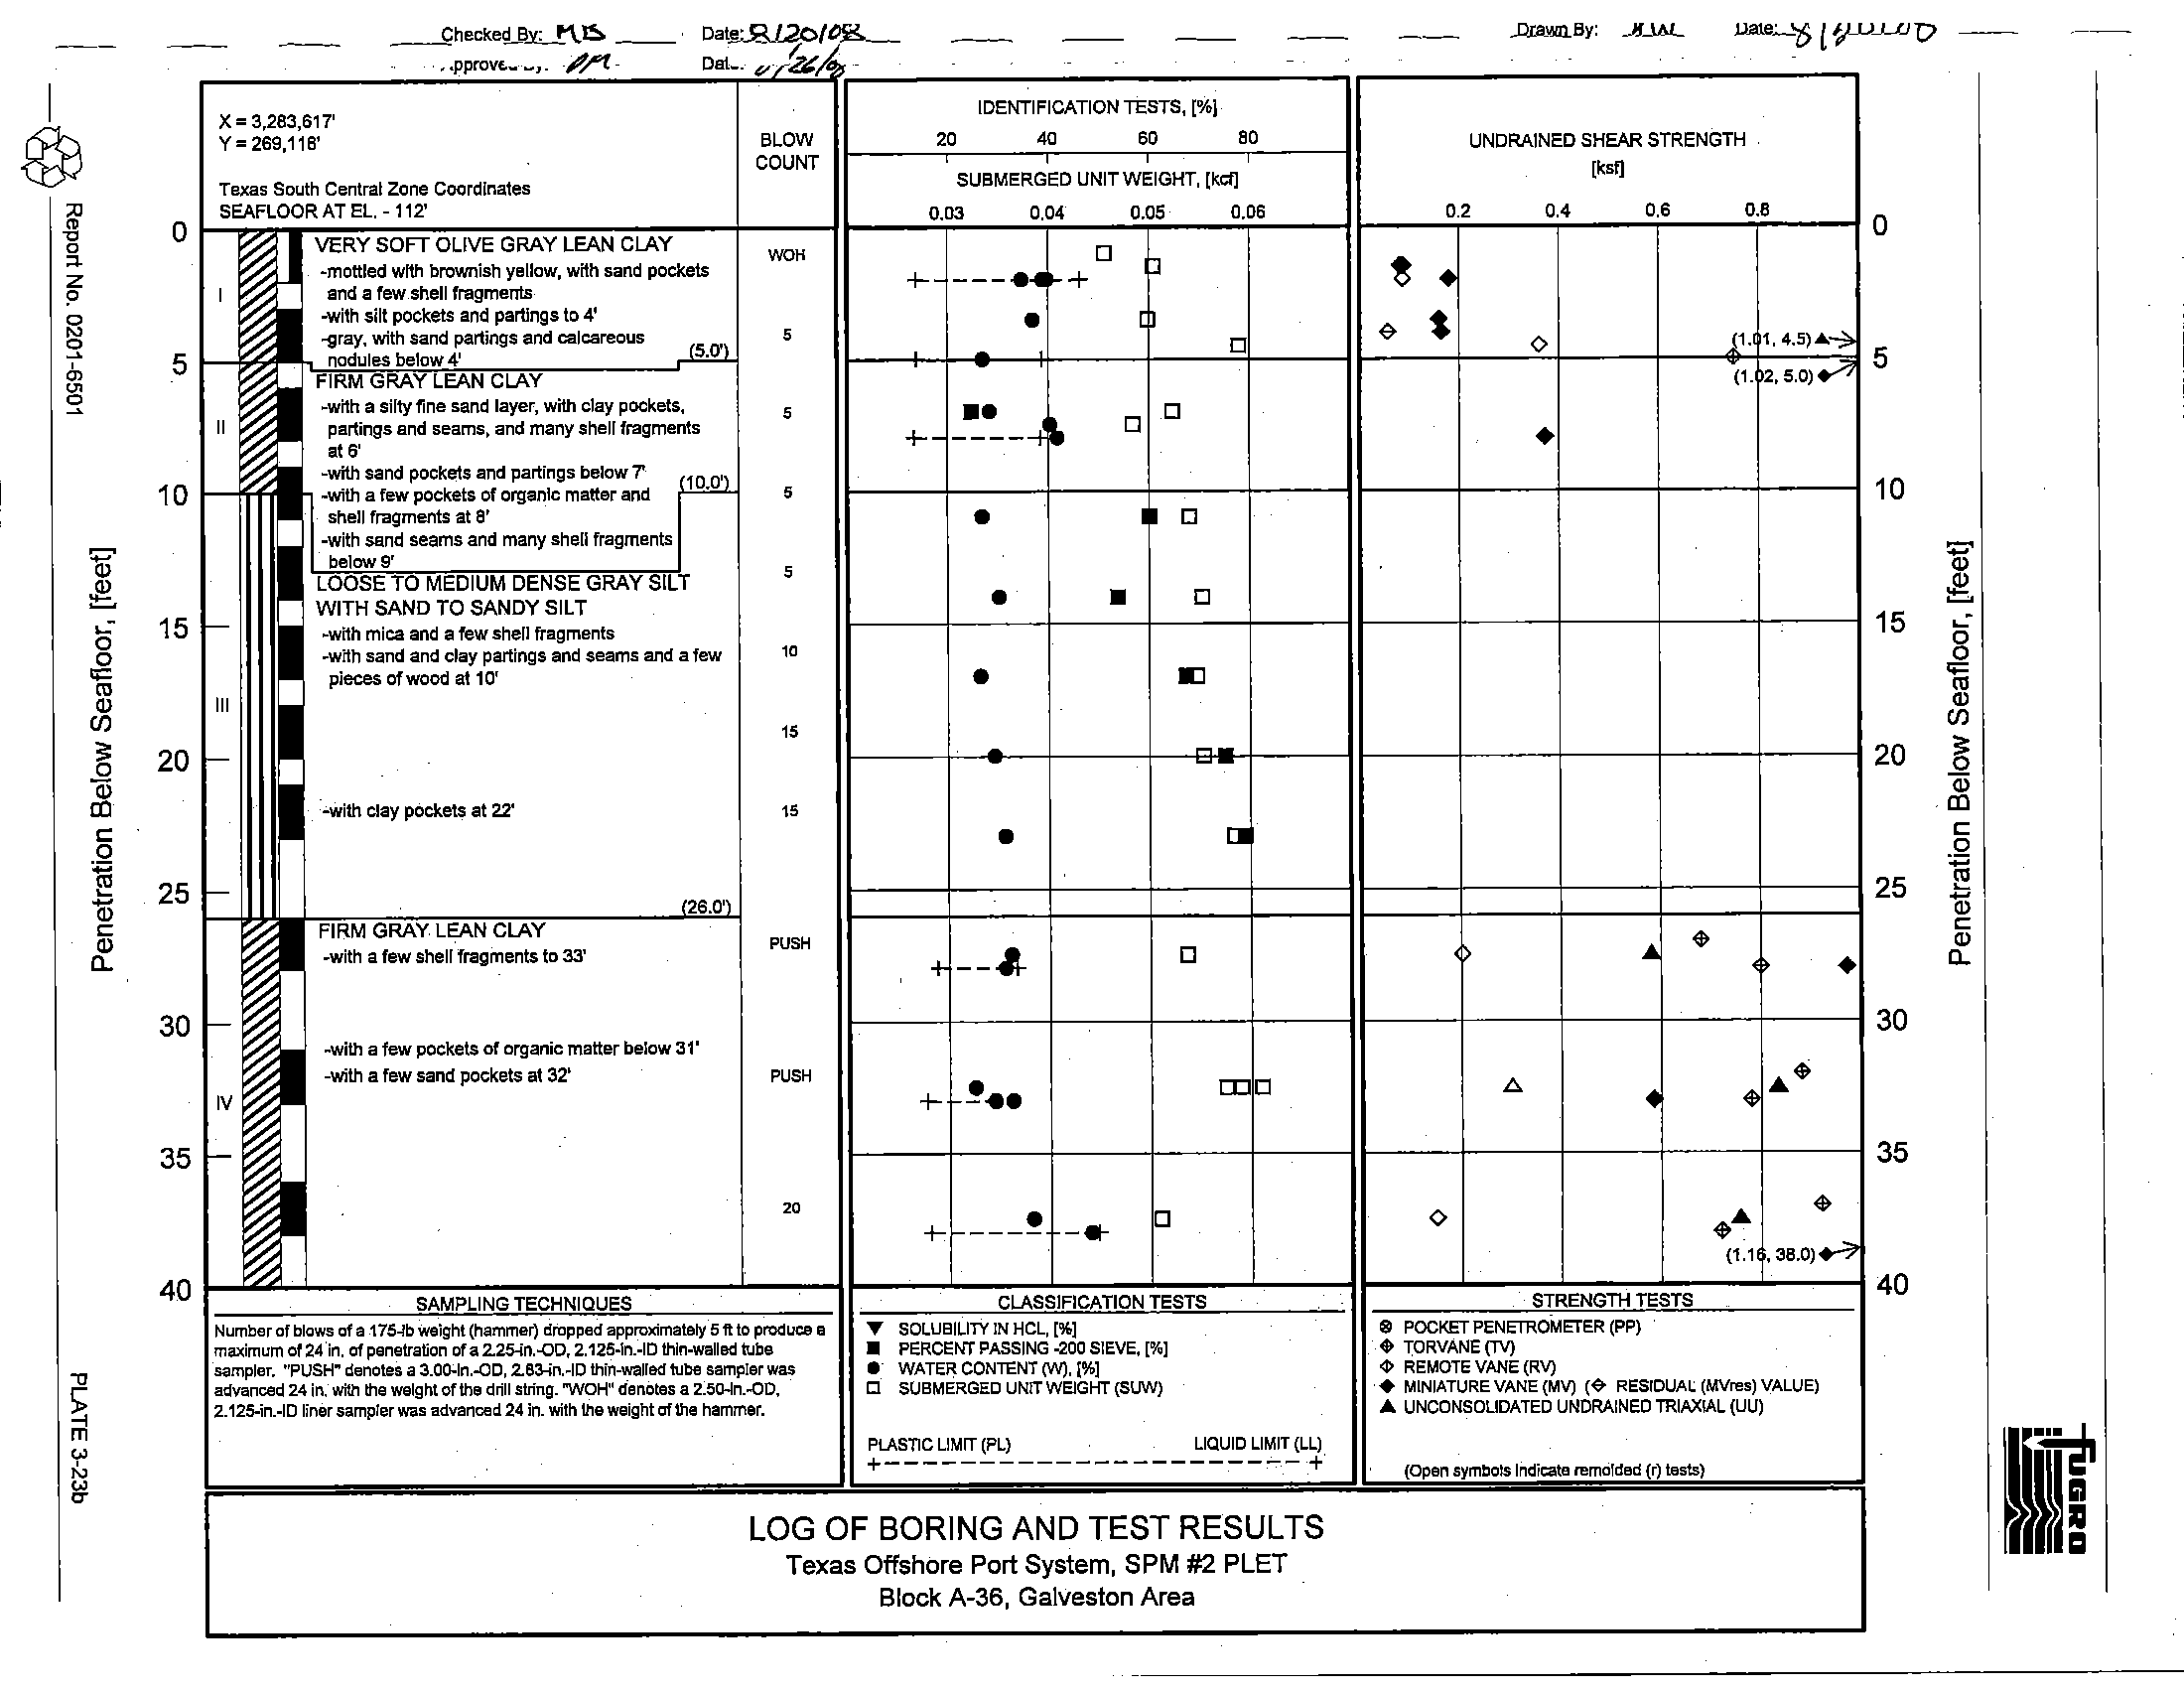
3.3.2
Soil Stratigraphy
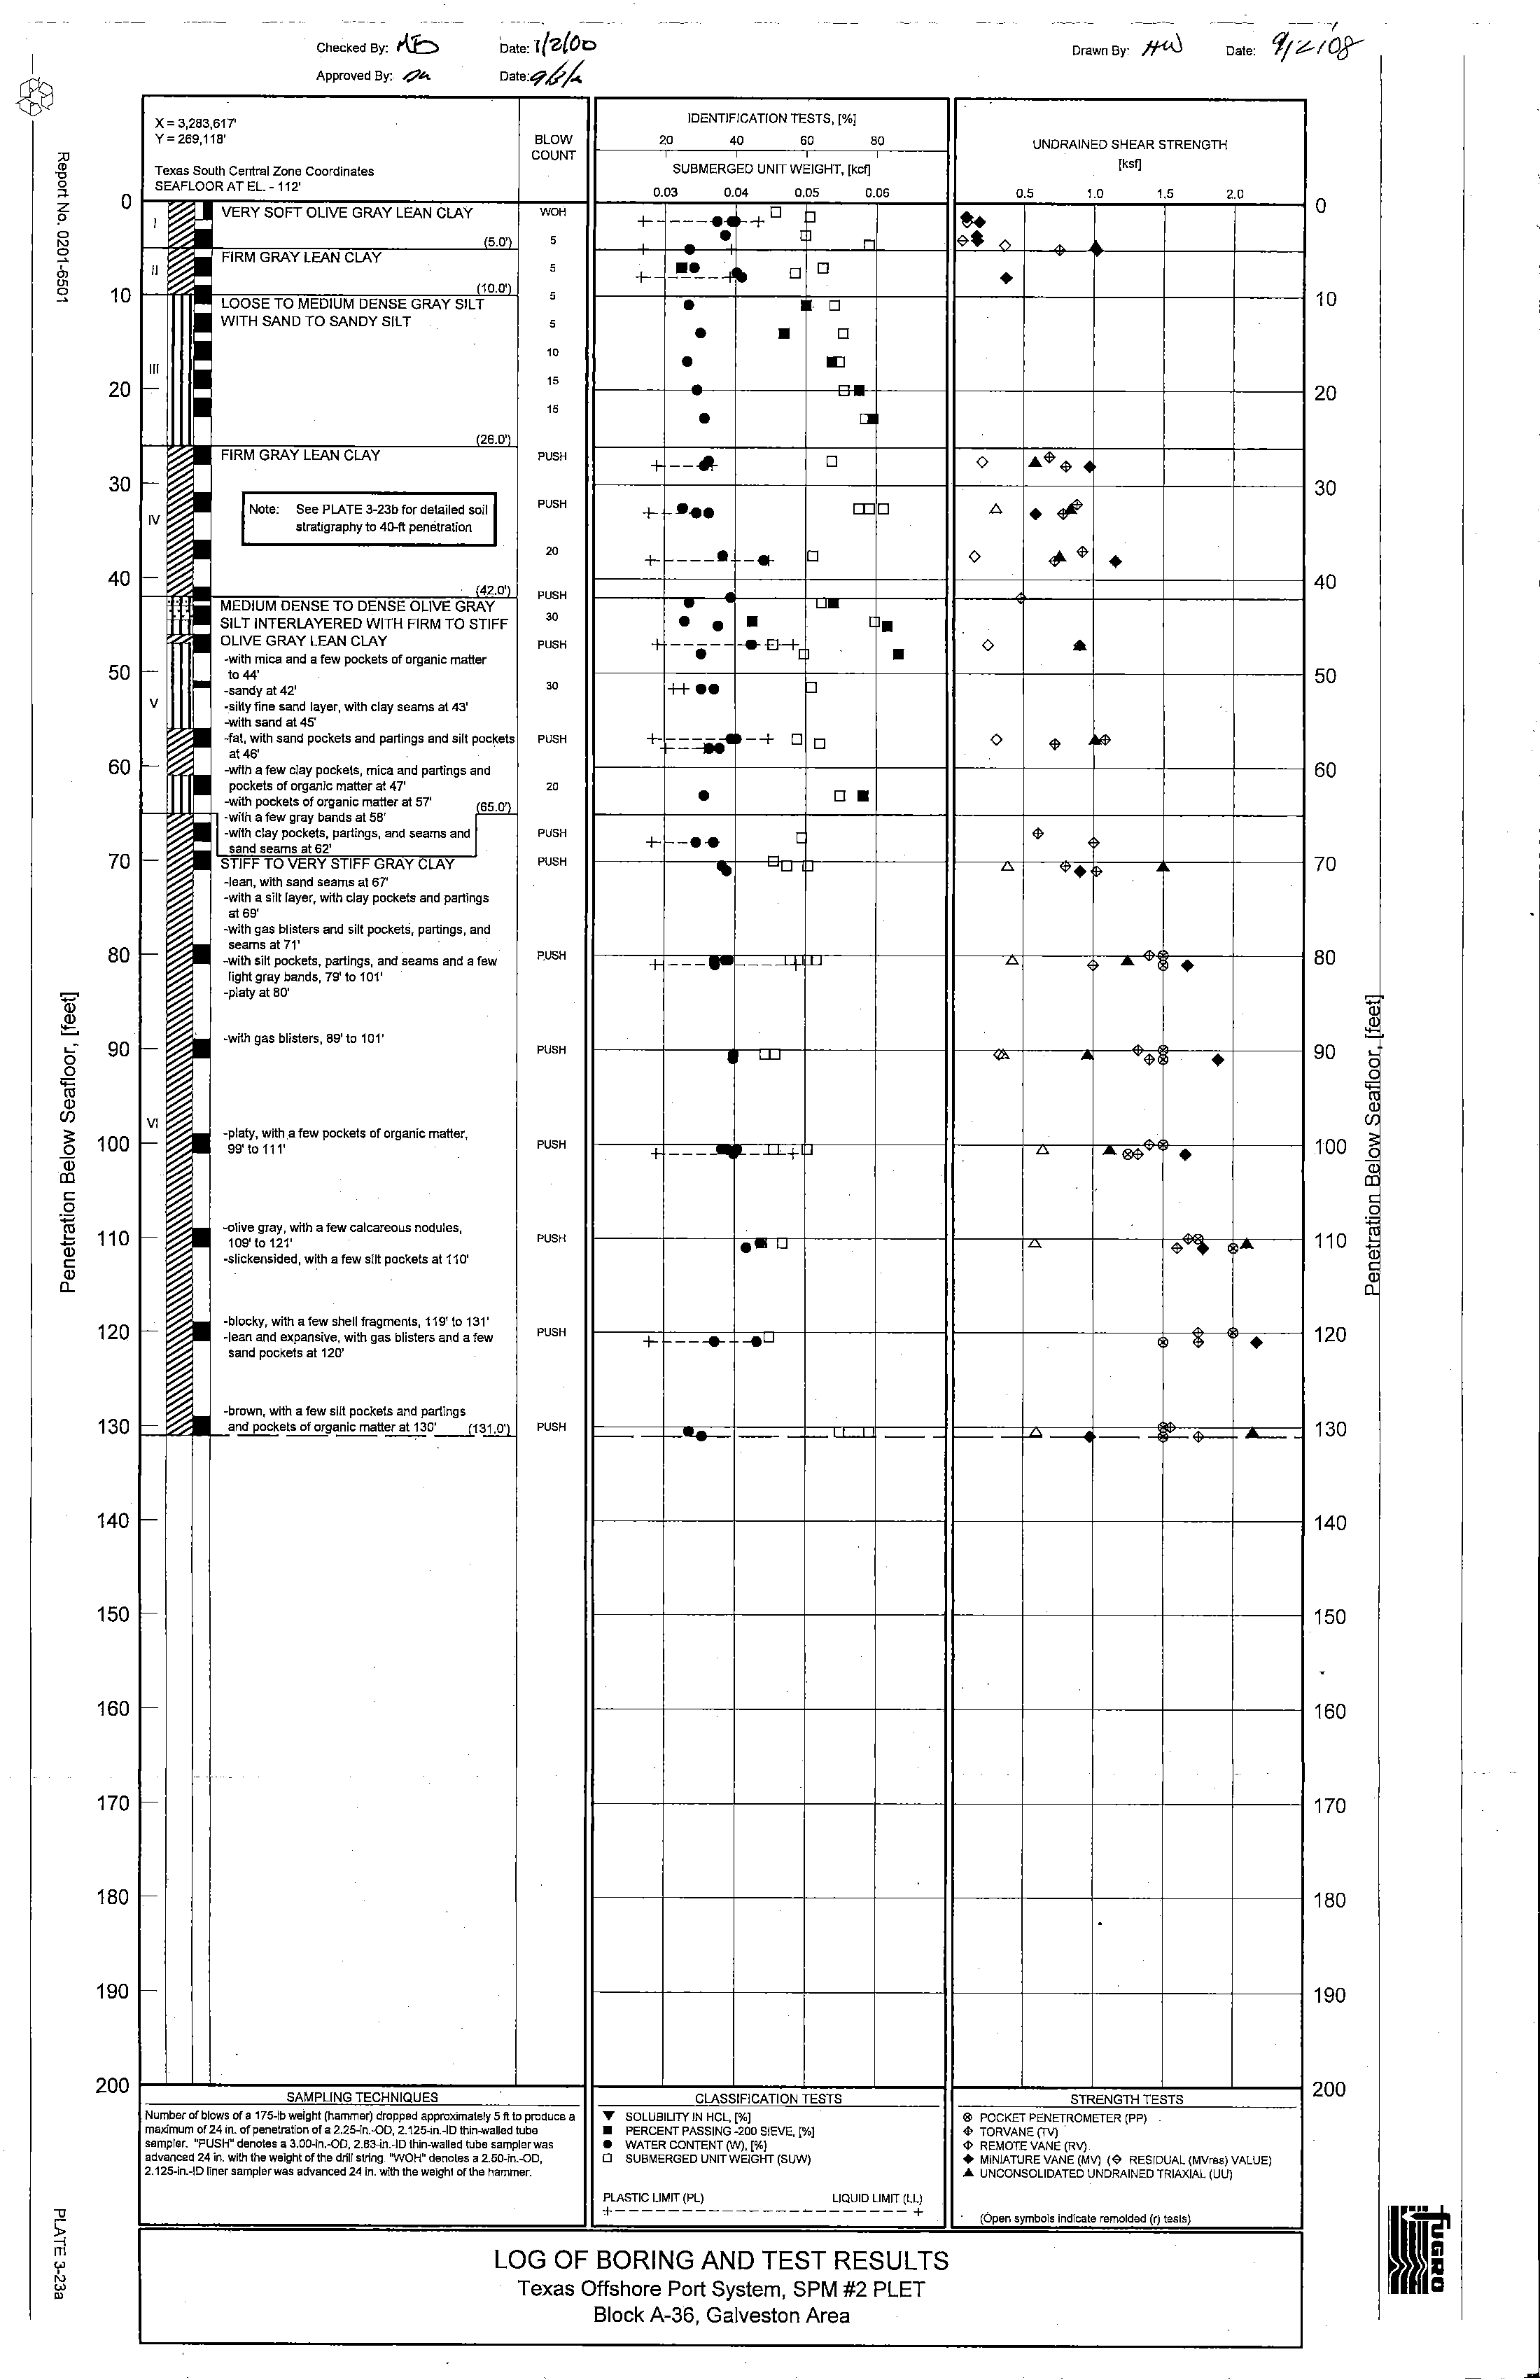
The soil stratigraphy disclosed by the field and laboratory investigations is presented on the boring
log, Plate 3-23. The soil stratigraphy is based on the classification of soil samples recovered from the
boring and observations made during drilling operations. A generalized summary
of the major soil strata is
tabulated below.
Penetration, ft
Stratum
From
To
Description
I
0
5
Very soft lean clay
II
5
10
Firm lean clay
III
10
26
Loose to medium dense silt with sand to
sandy silt
IV
26
42
Firm lean clay
V
42
65
Medium dense to dense silt interlayered
with firm to stiff lean clay
VI
65
131
Stiff to very stiff clay
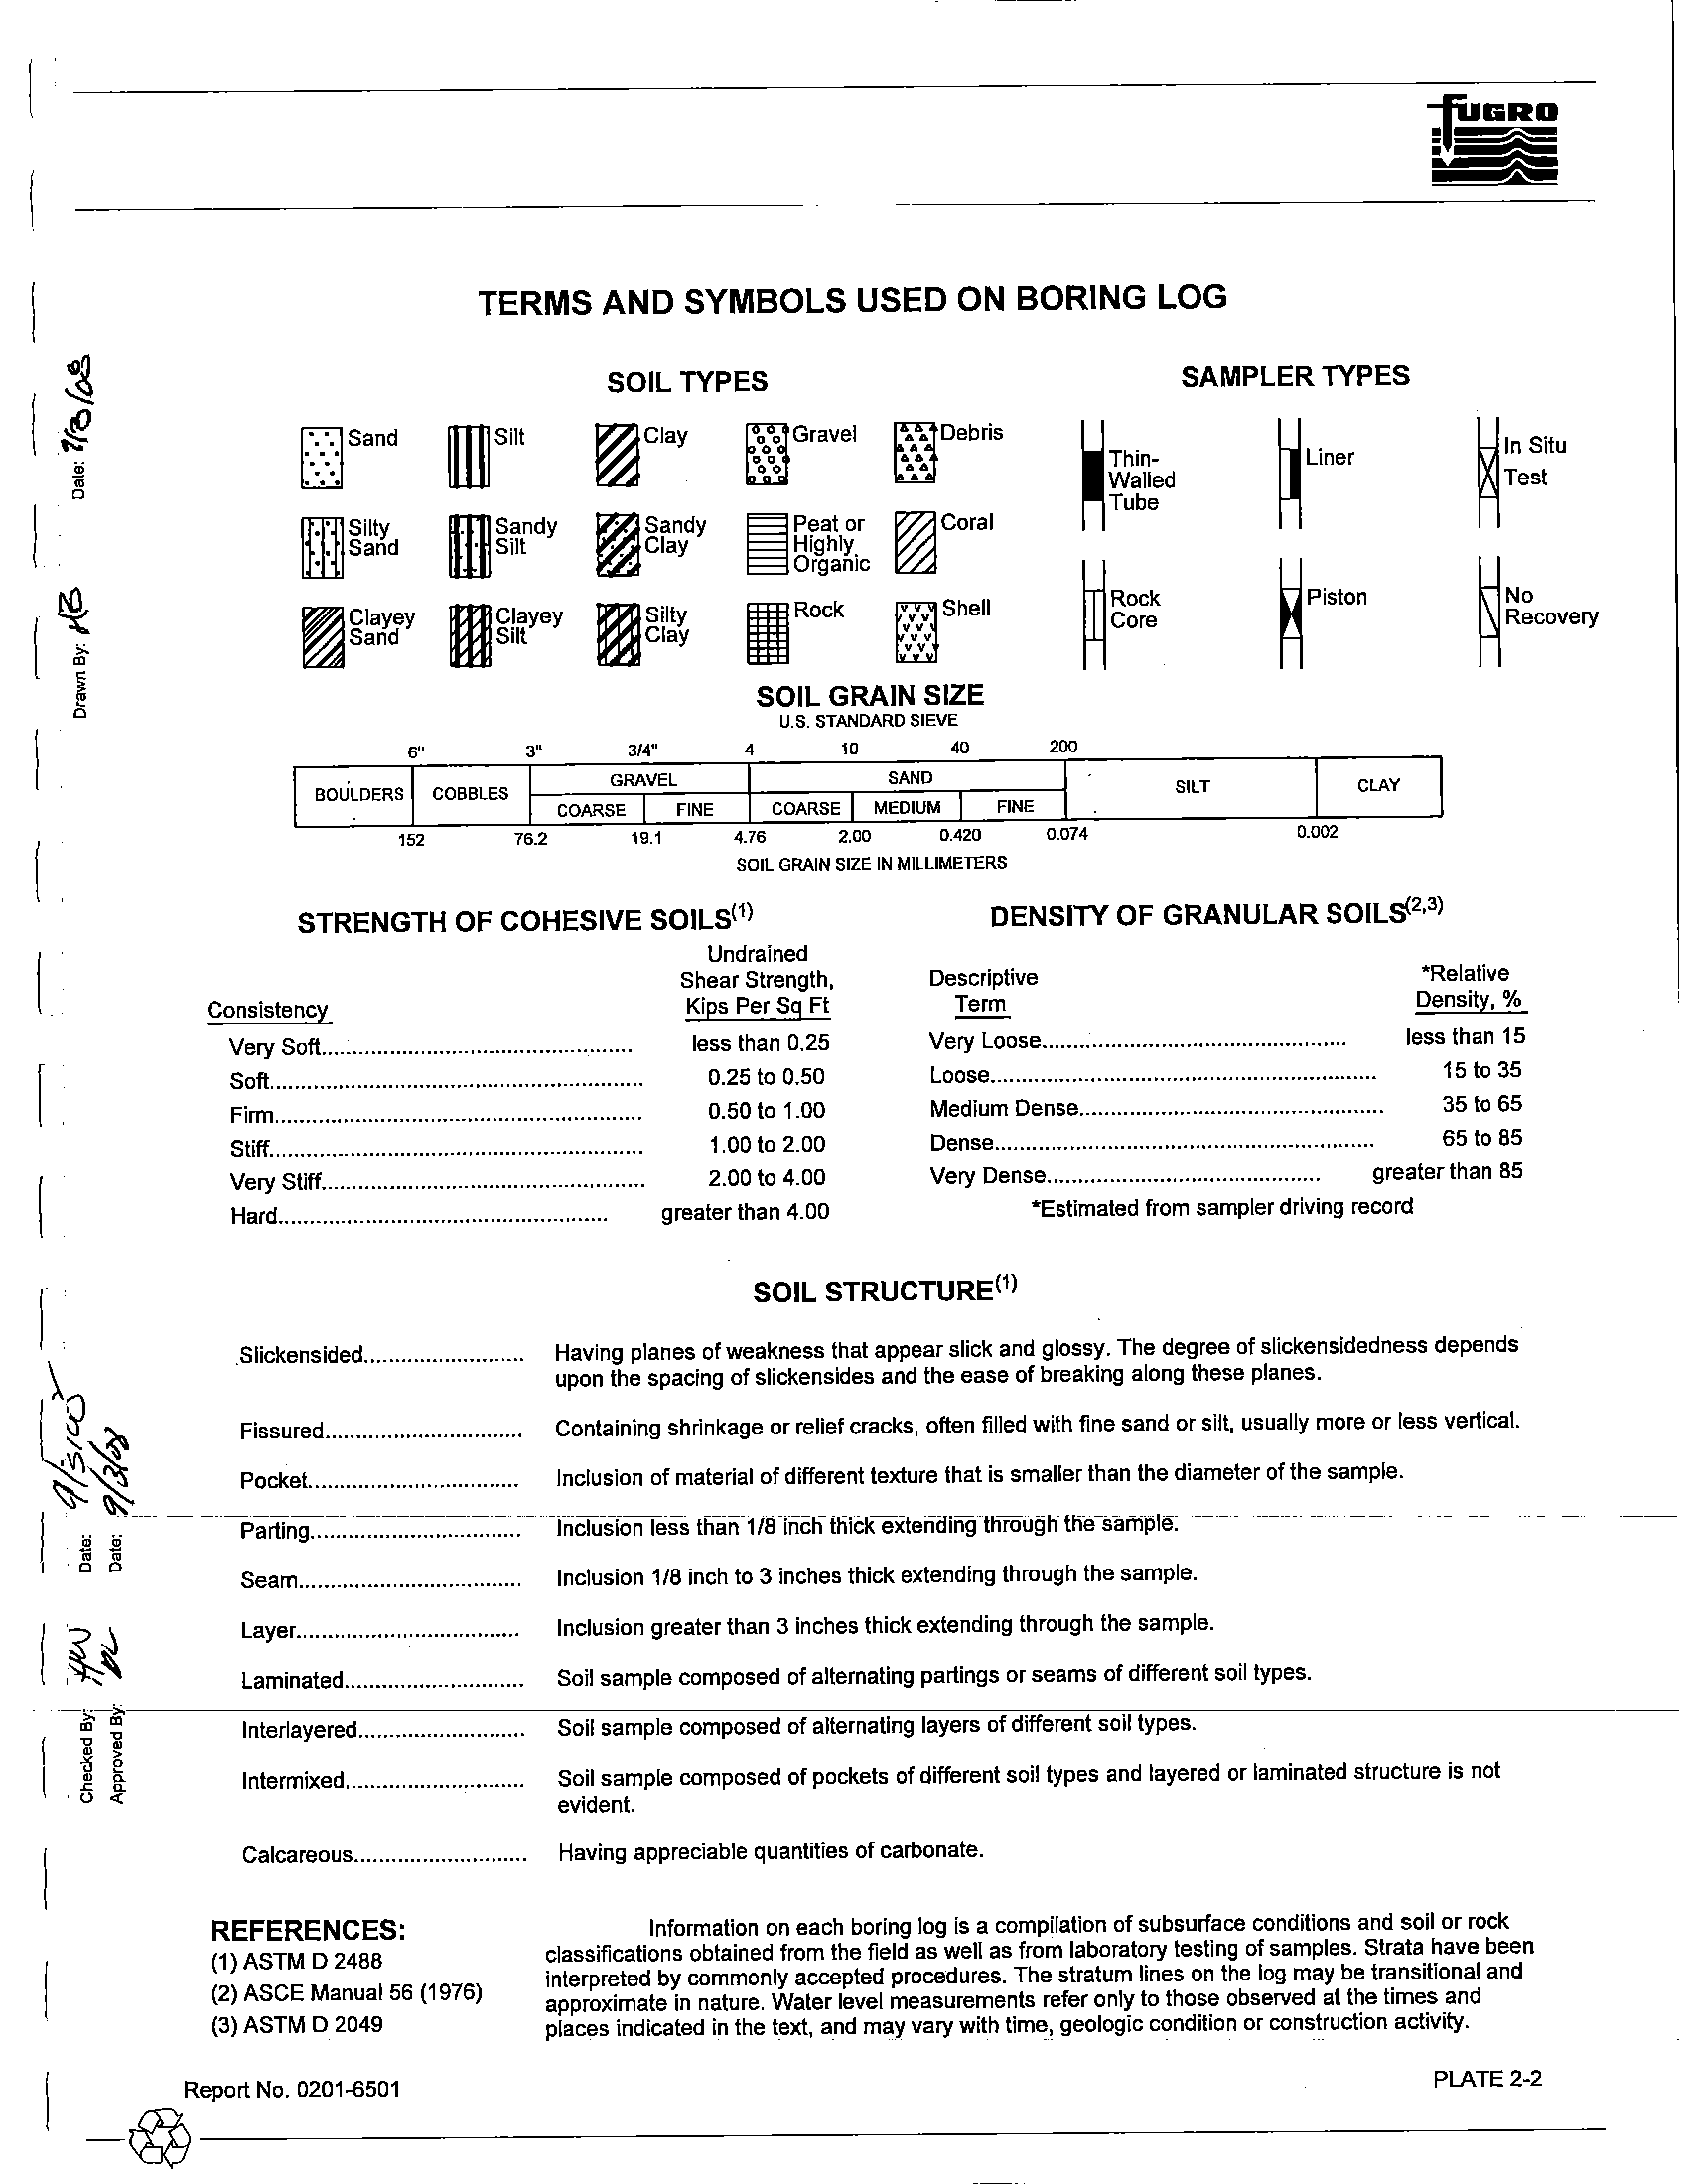
Detailed soil descriptions that include textural variations and inclusions are noted
on the boring log.
A key to the terms and symbols used
on the boring log is presented on Plate 2-2. The Roman numeral
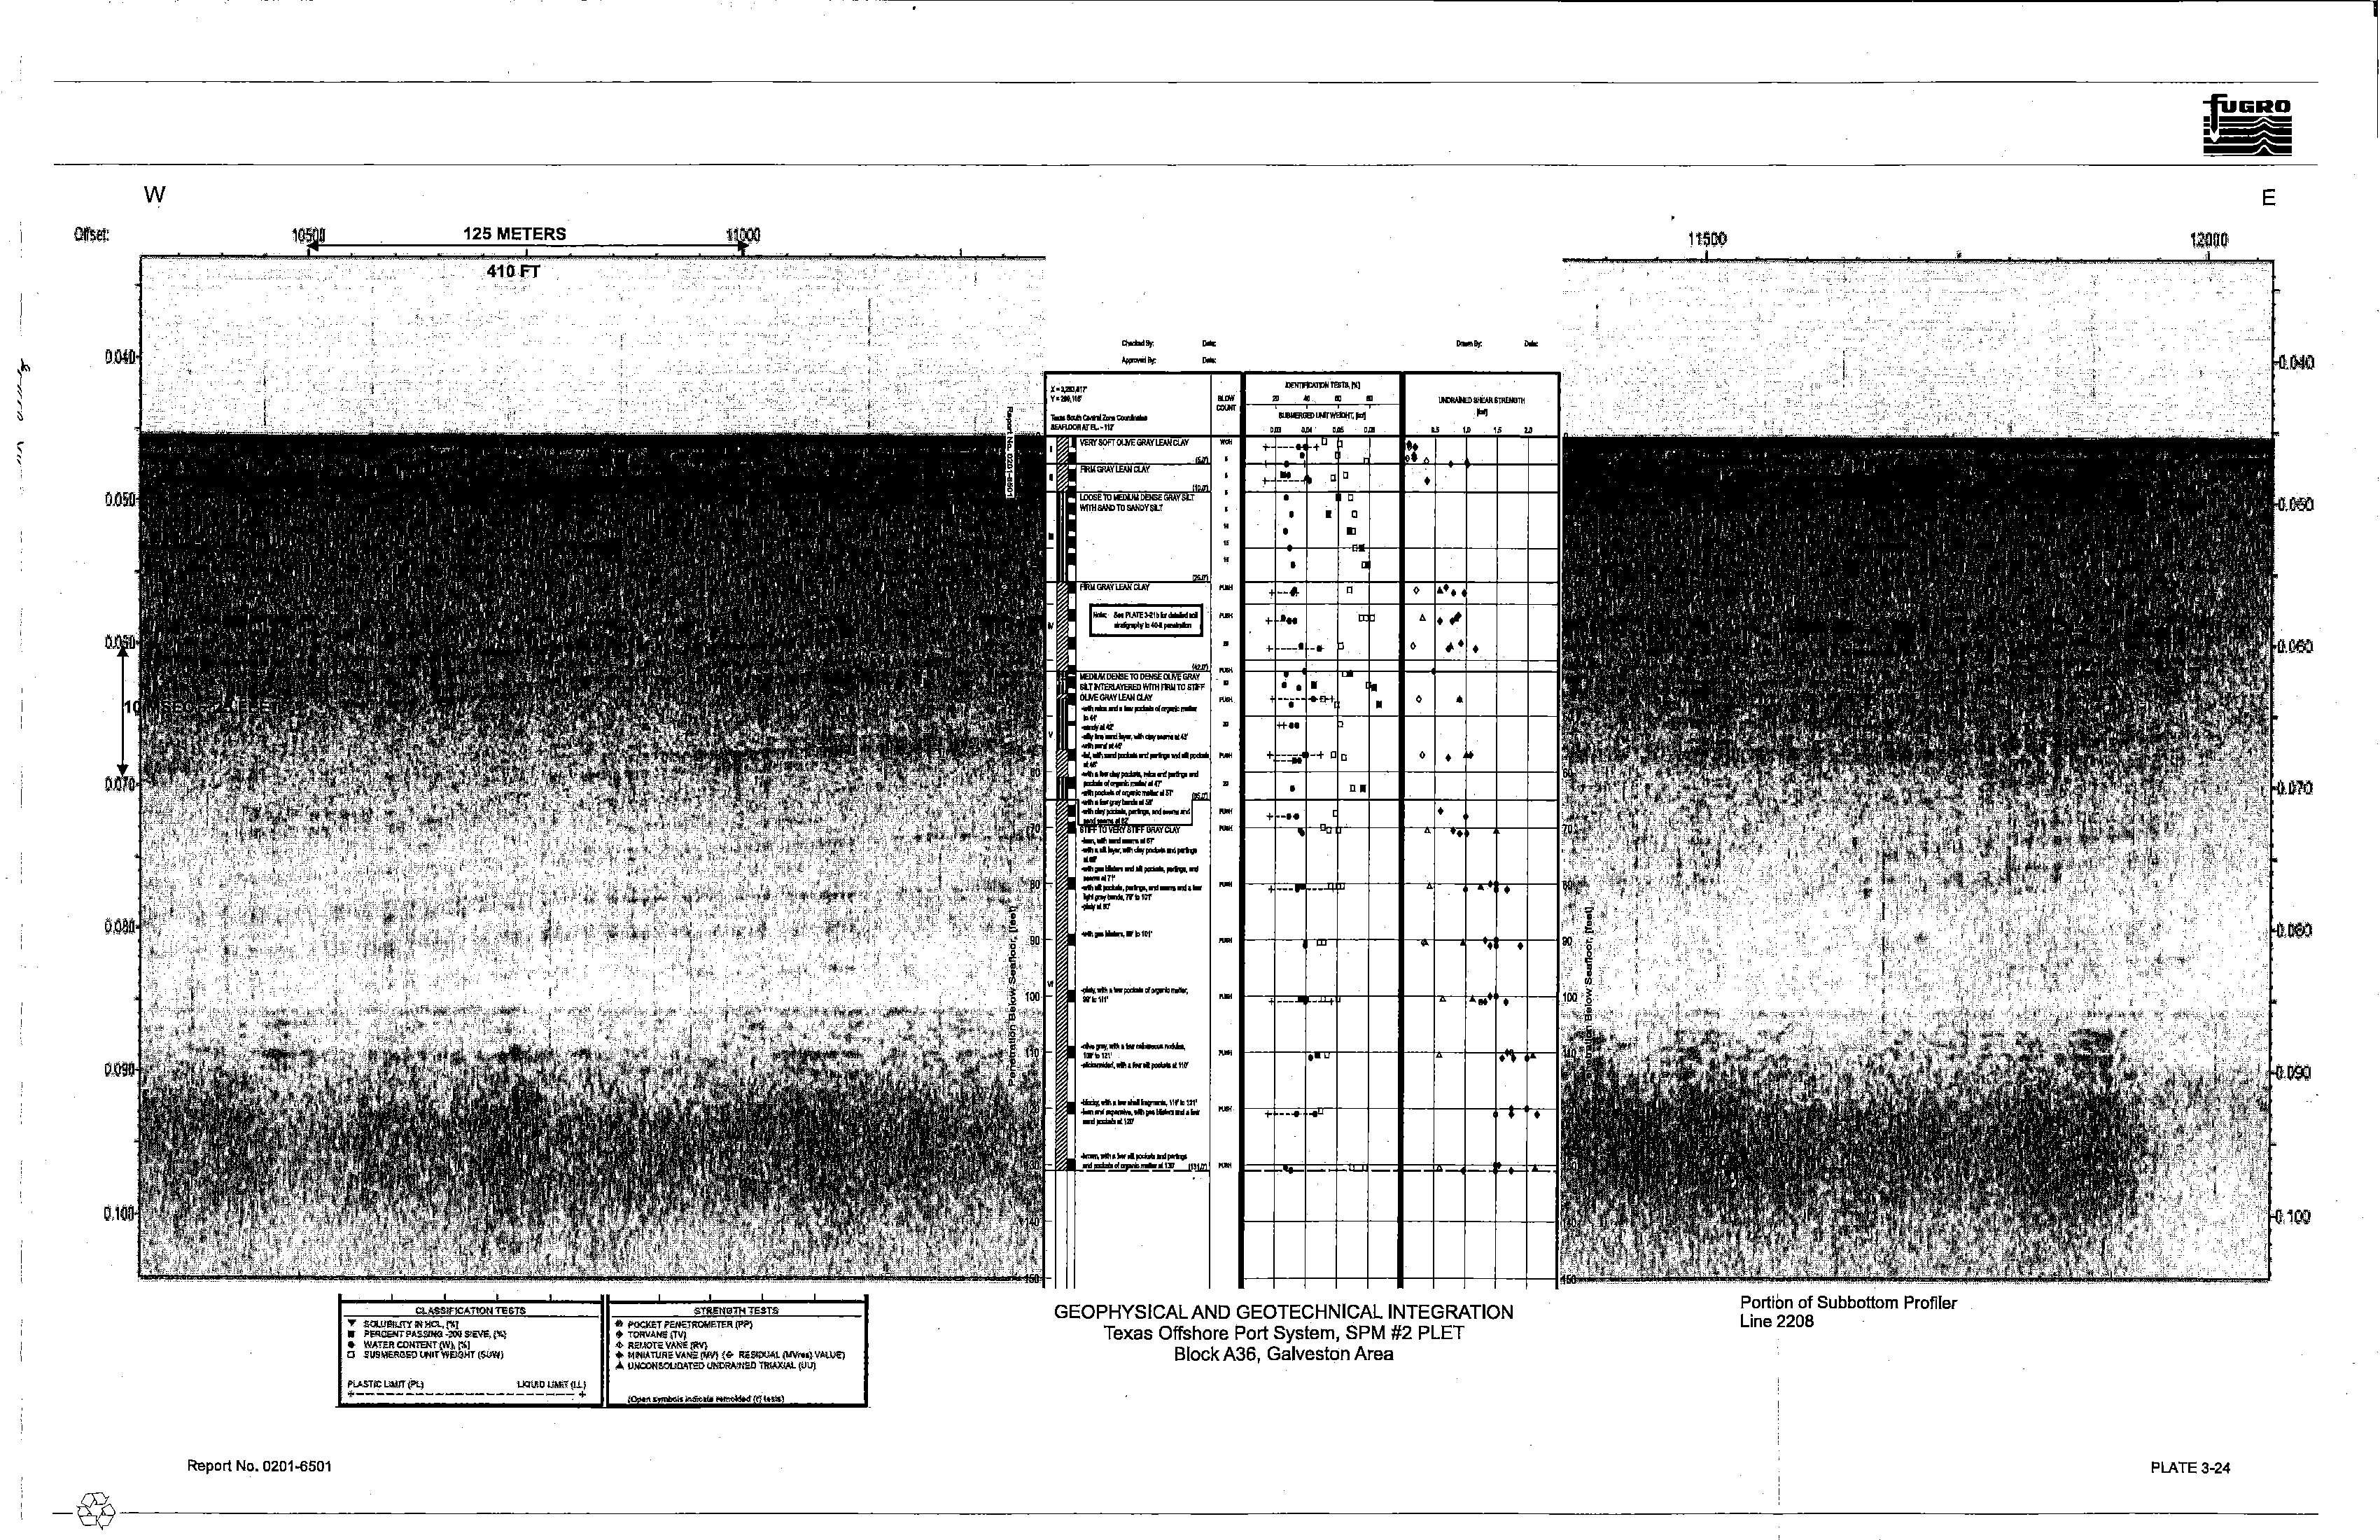
representing each stratum is also shown on the boring log and on relevant plates. The variation in soil
stratigraphy across this site is indicated in a comparison (integration)
of the geophysical and geotechnical
soil information presented on Plate 3-24.
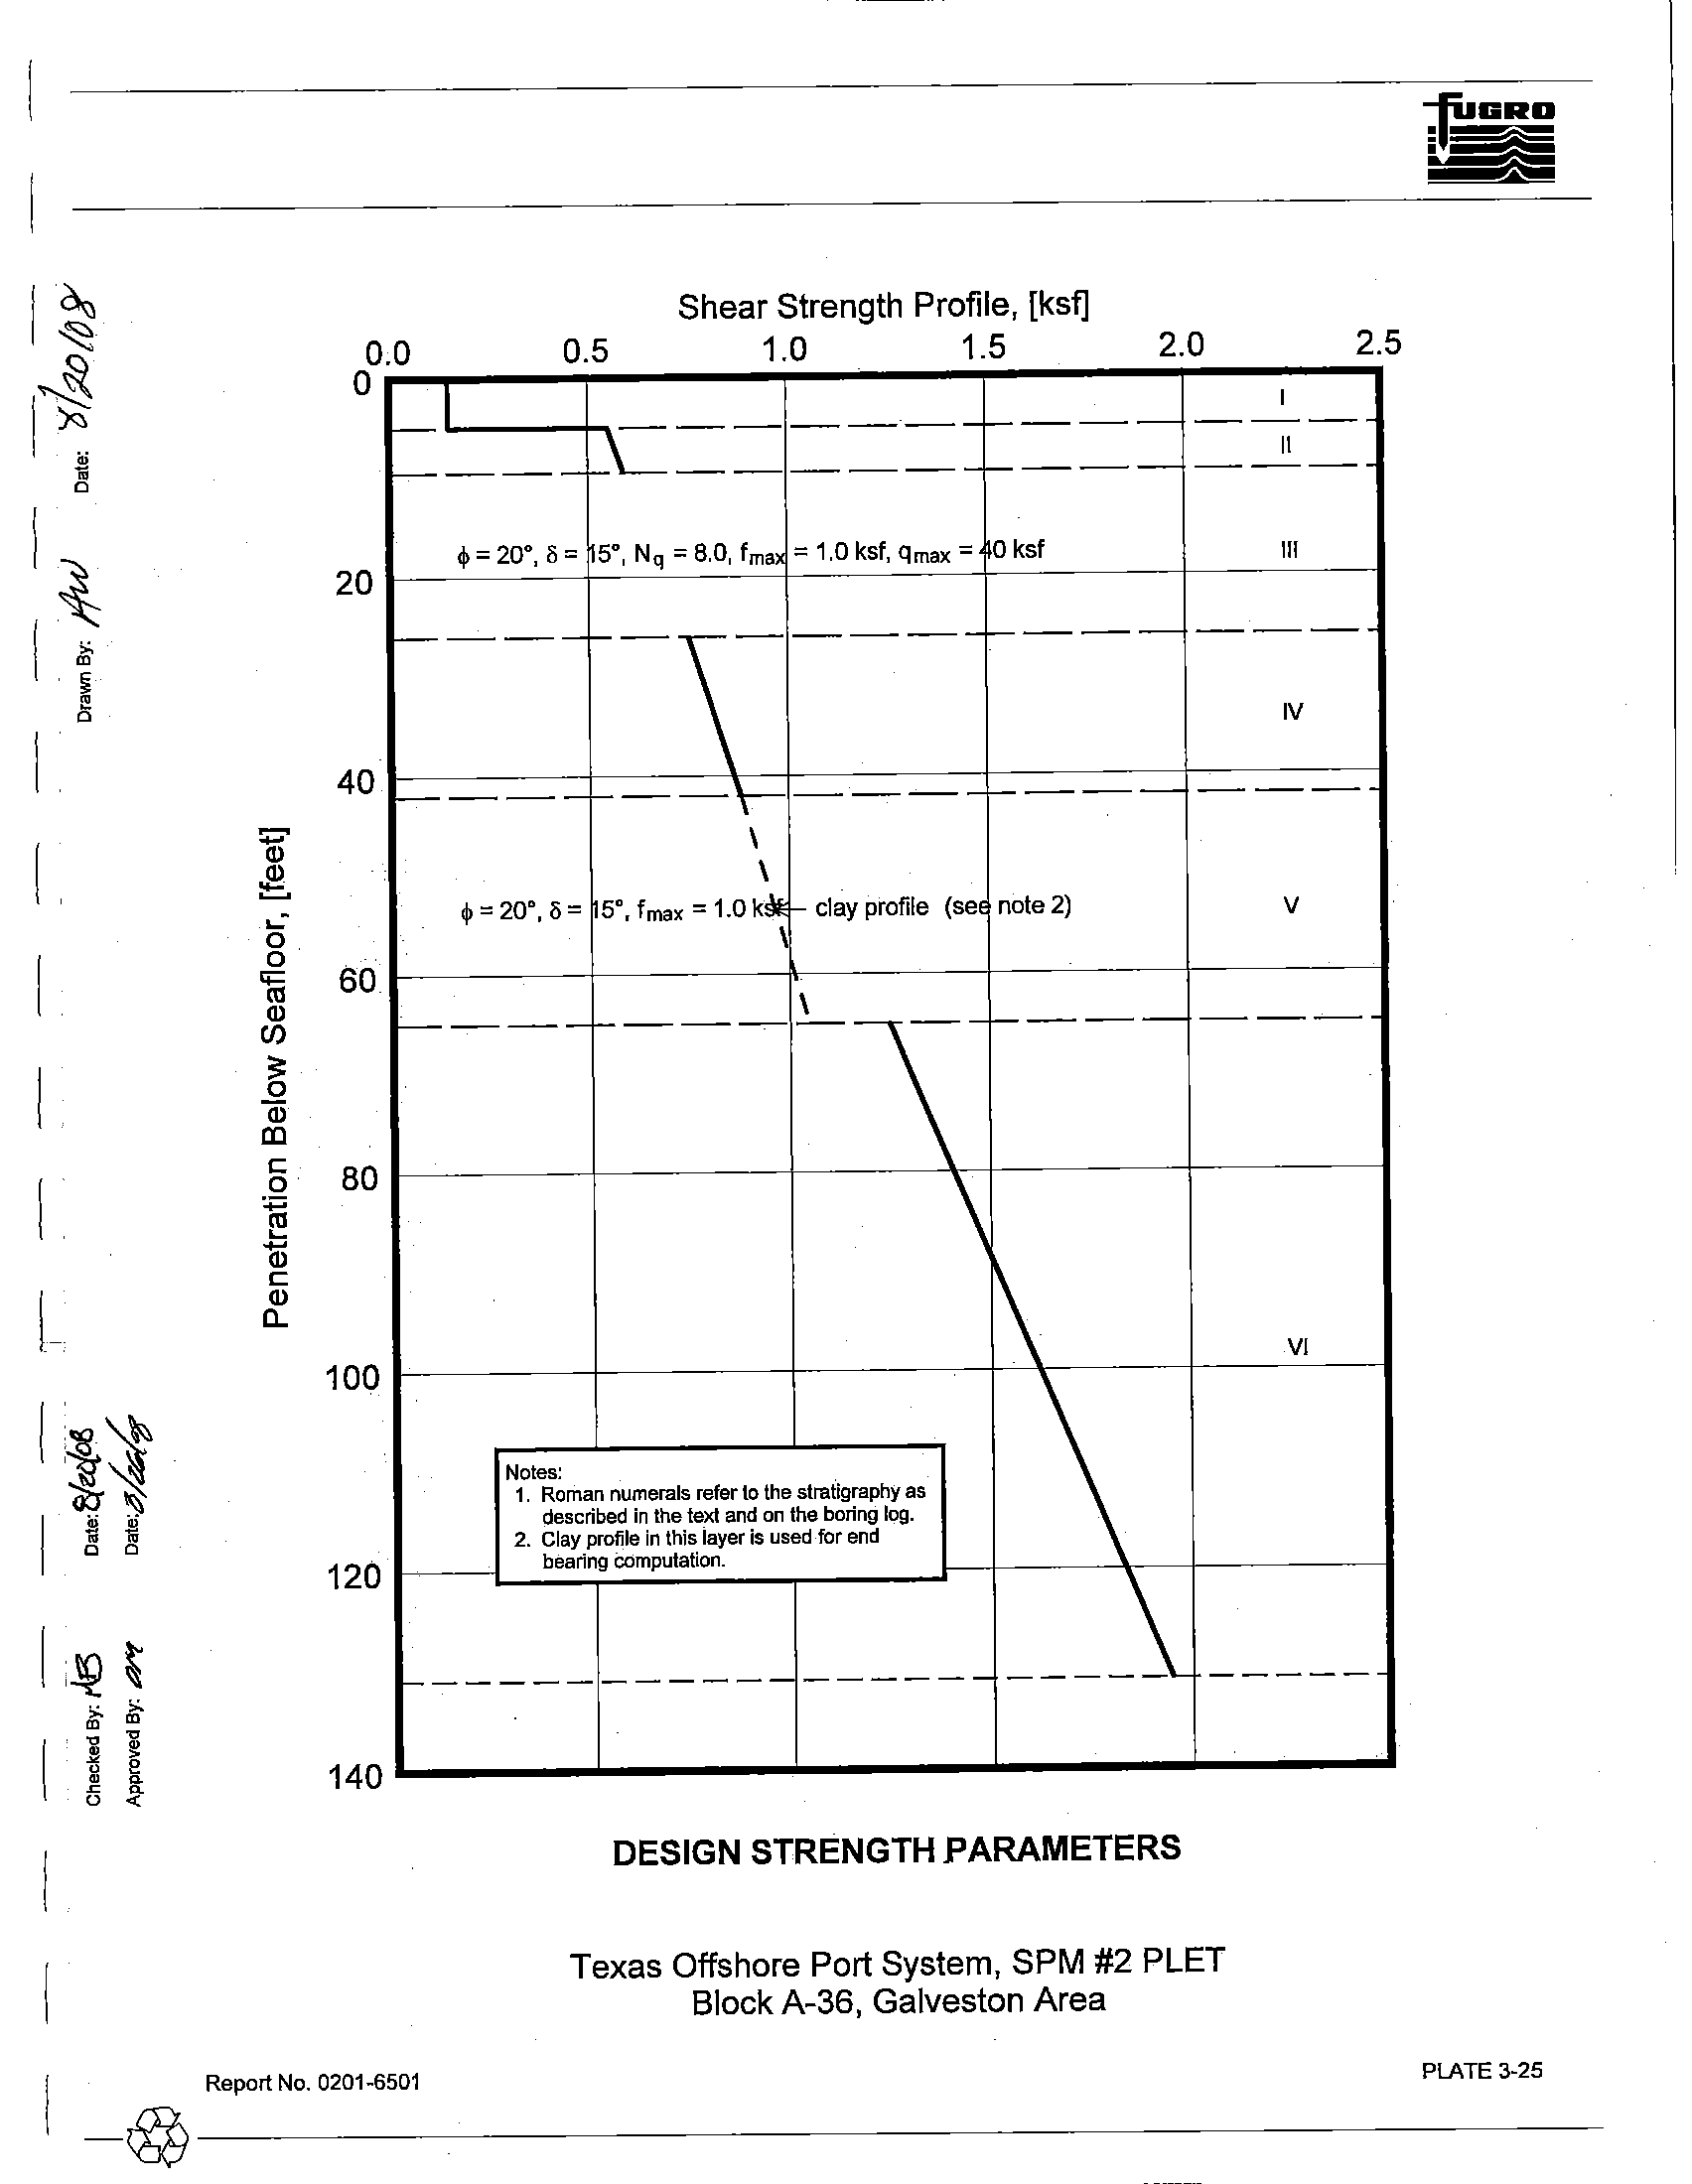
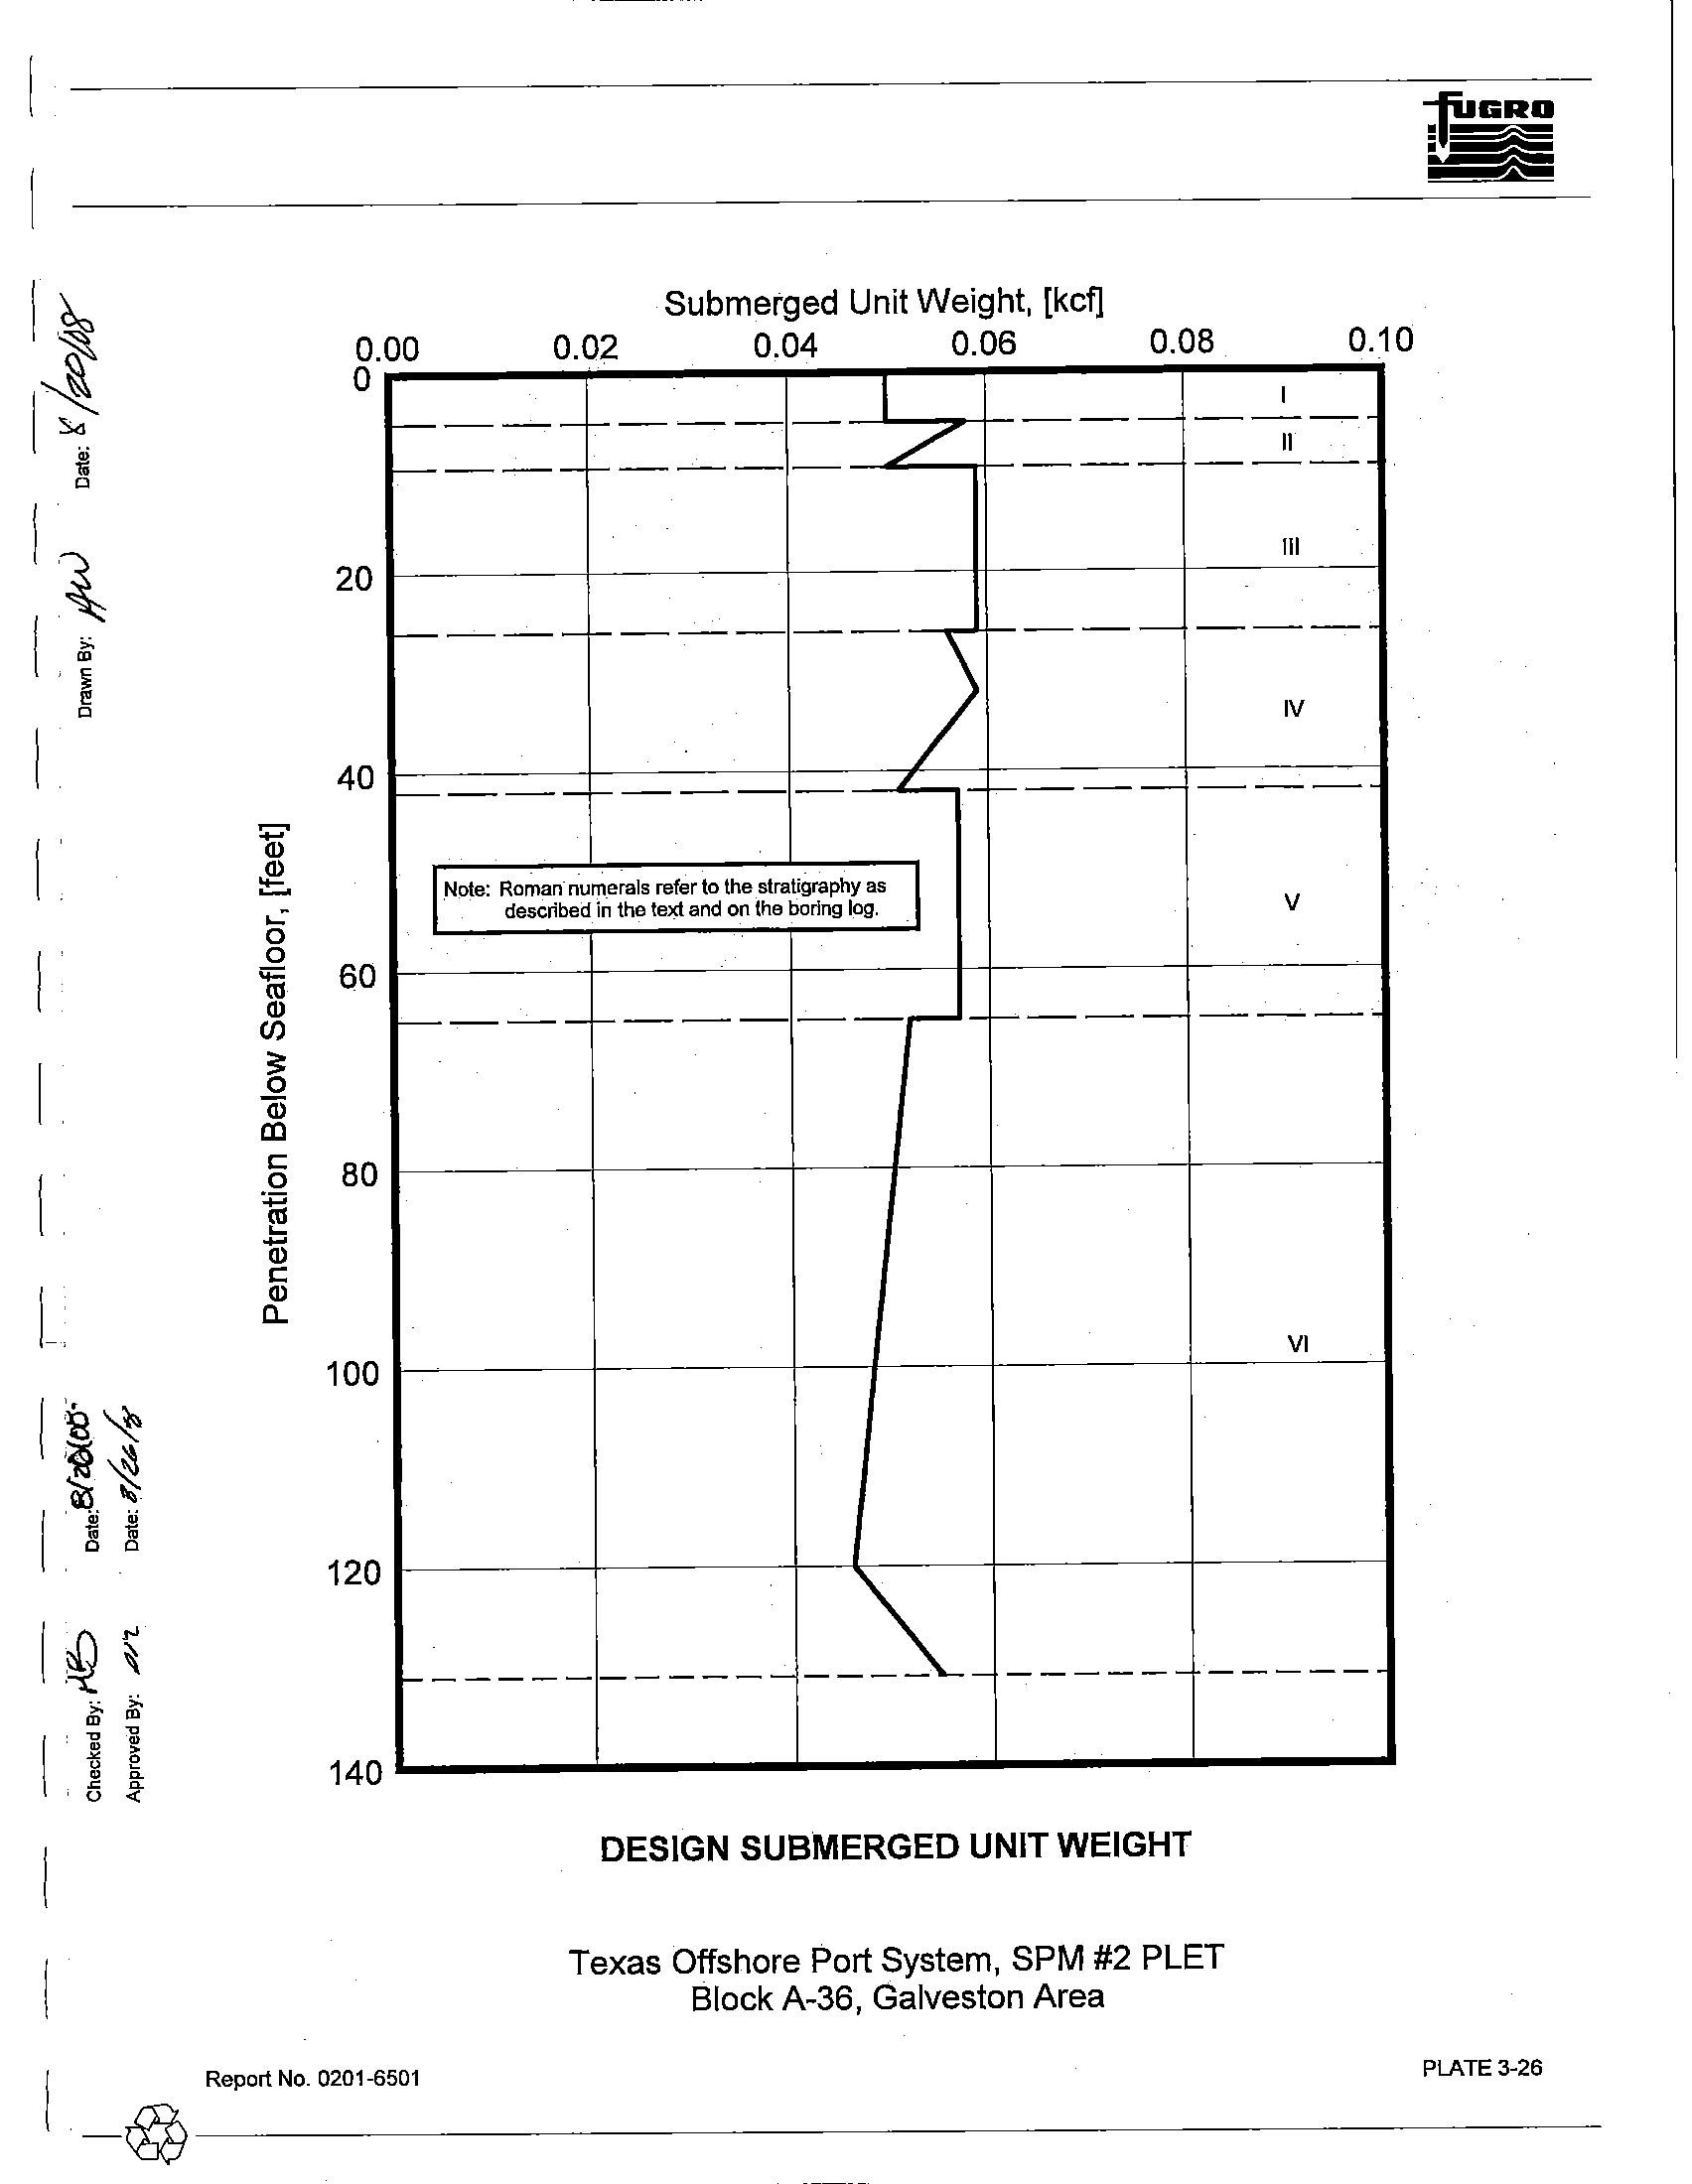
3.3.2.1 Interpretation of Soil Properties
The shear strength and submerged unit weight profiles shown on Plates 3-25 and 3-26,
respectively, best represent the assembled test results plotted on the boring log. These profiles were used
in the engineering analyses.
3.3.3
Pile Design Information
The pile design information developed for this study includes ultimate axial capacities, axial load-
pile movement data, and lateral soil reSistance-pile deflection (p-y) characteristics. The analytical methods
used to develop this information are presented briefly in Section 2.5 and
in more detail in Appendix B.
3.3.3.1 Axial Pile Design
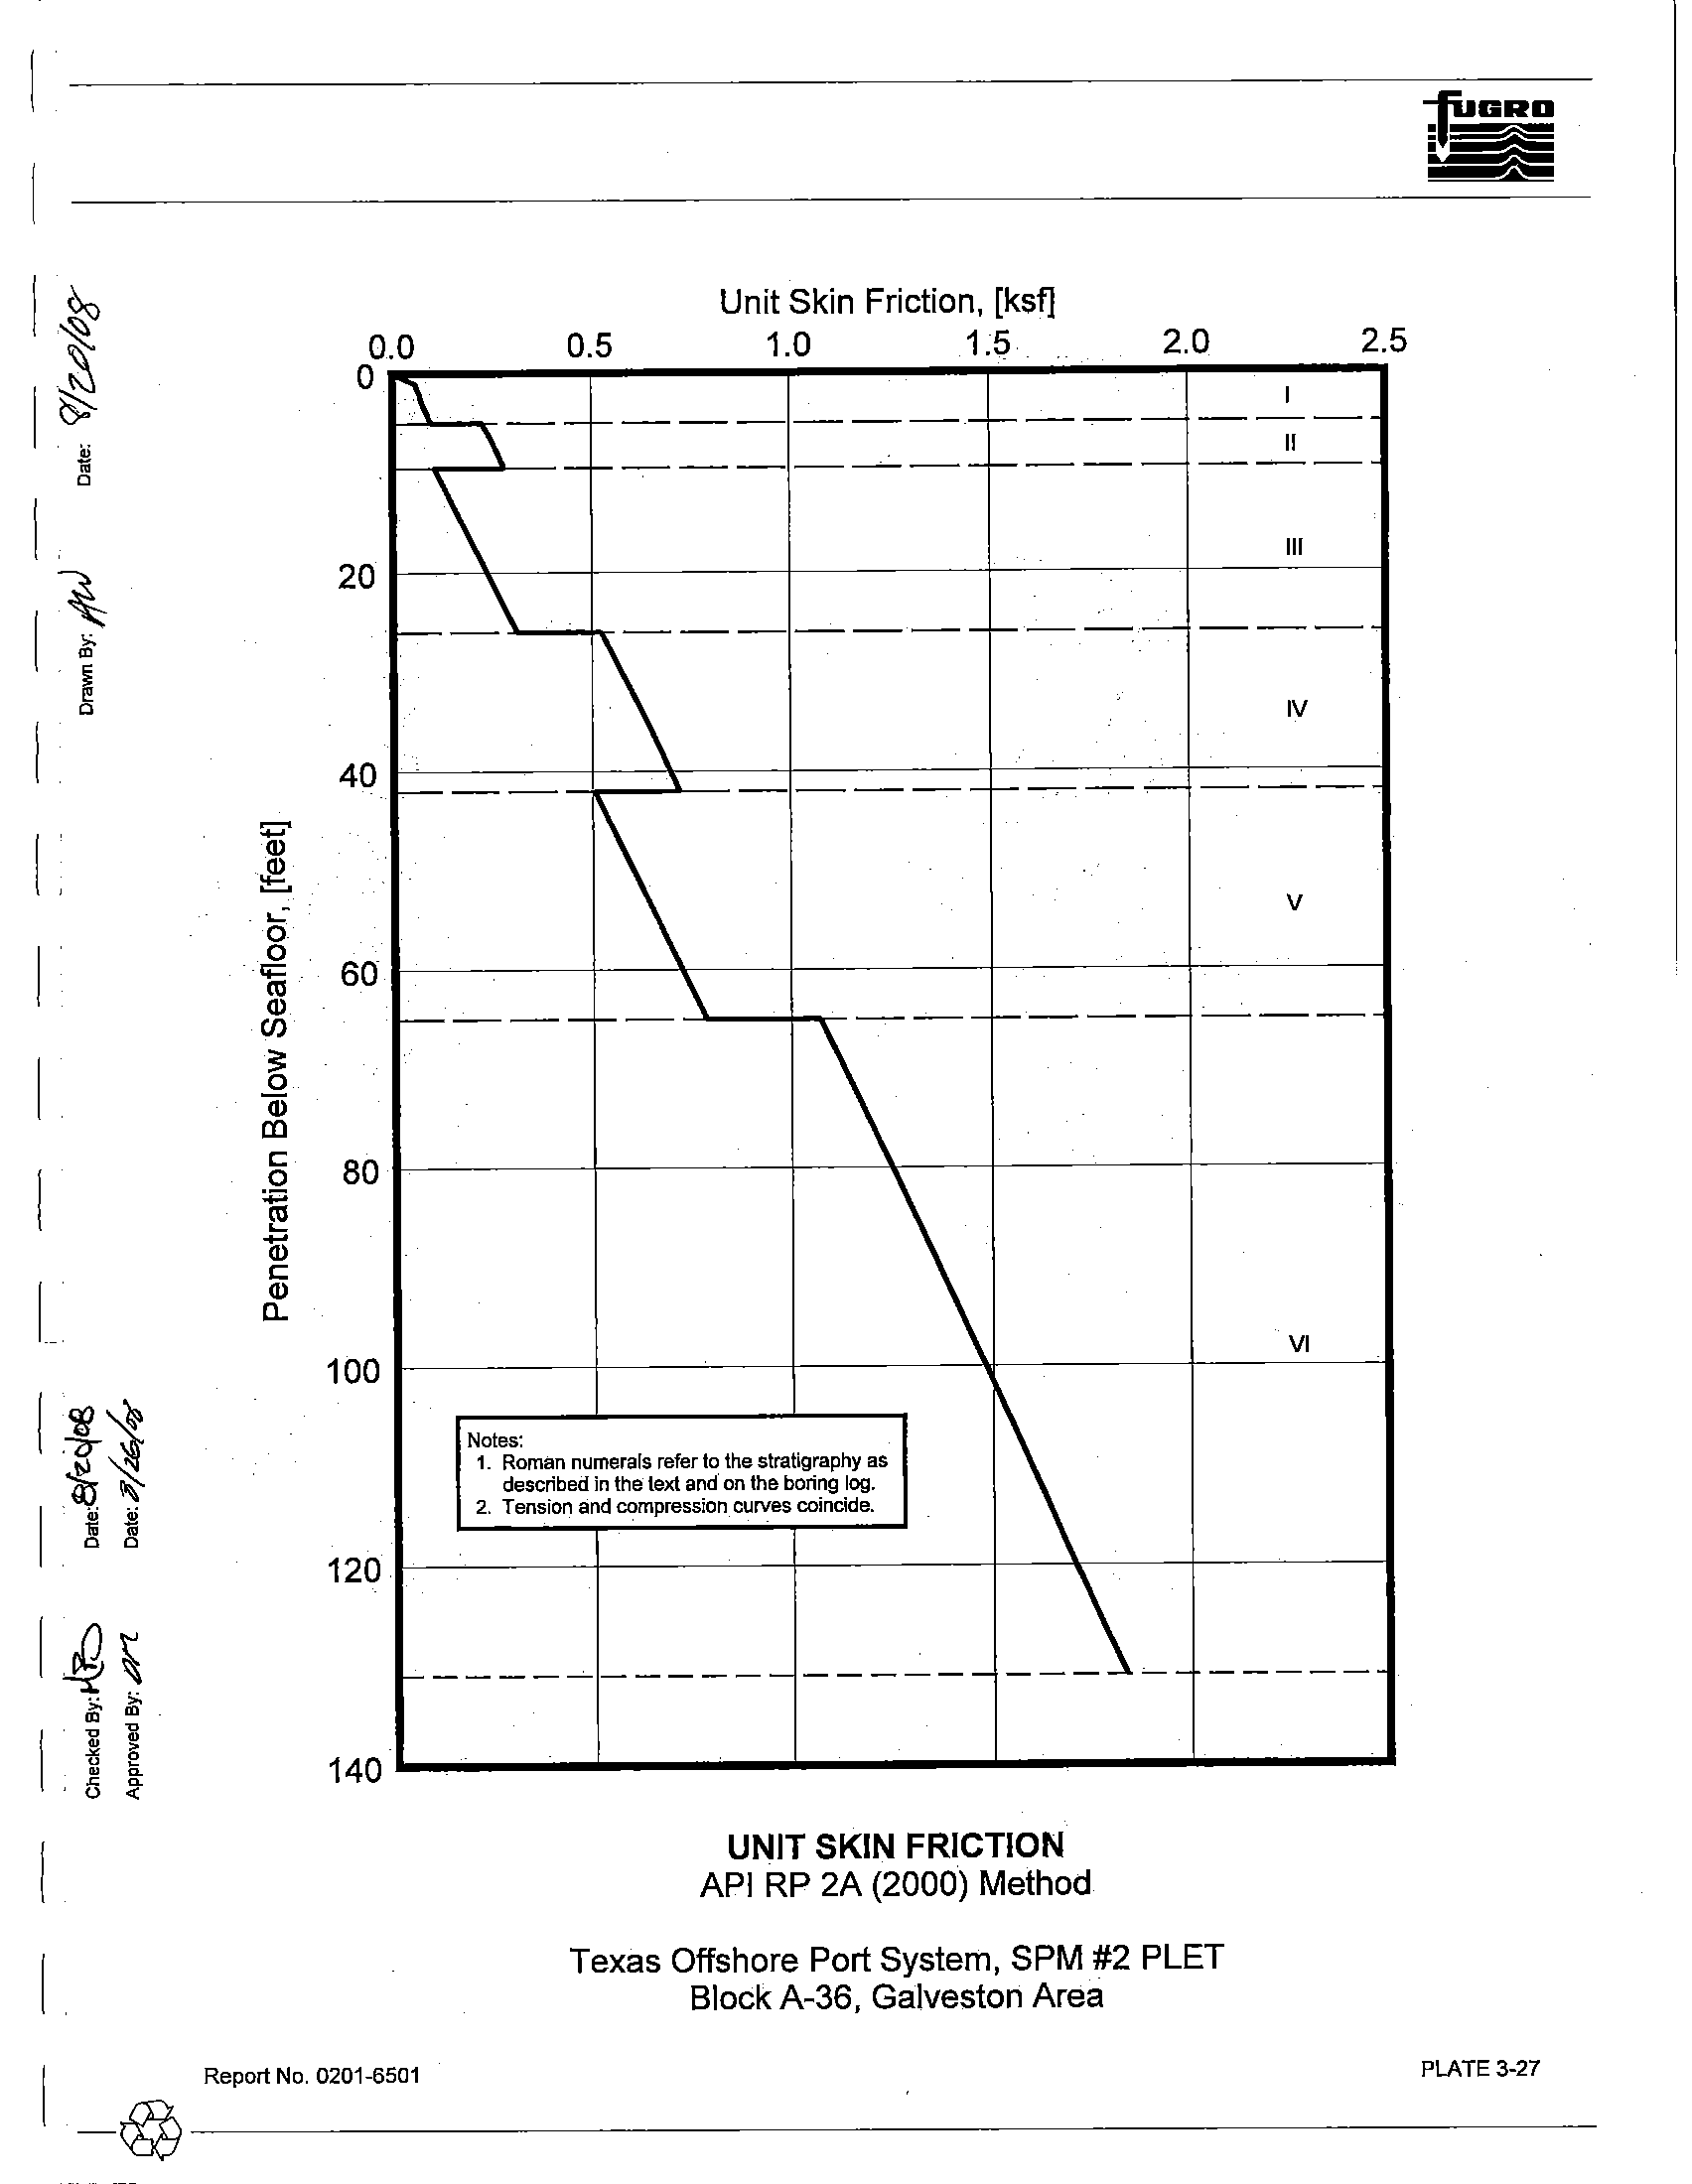
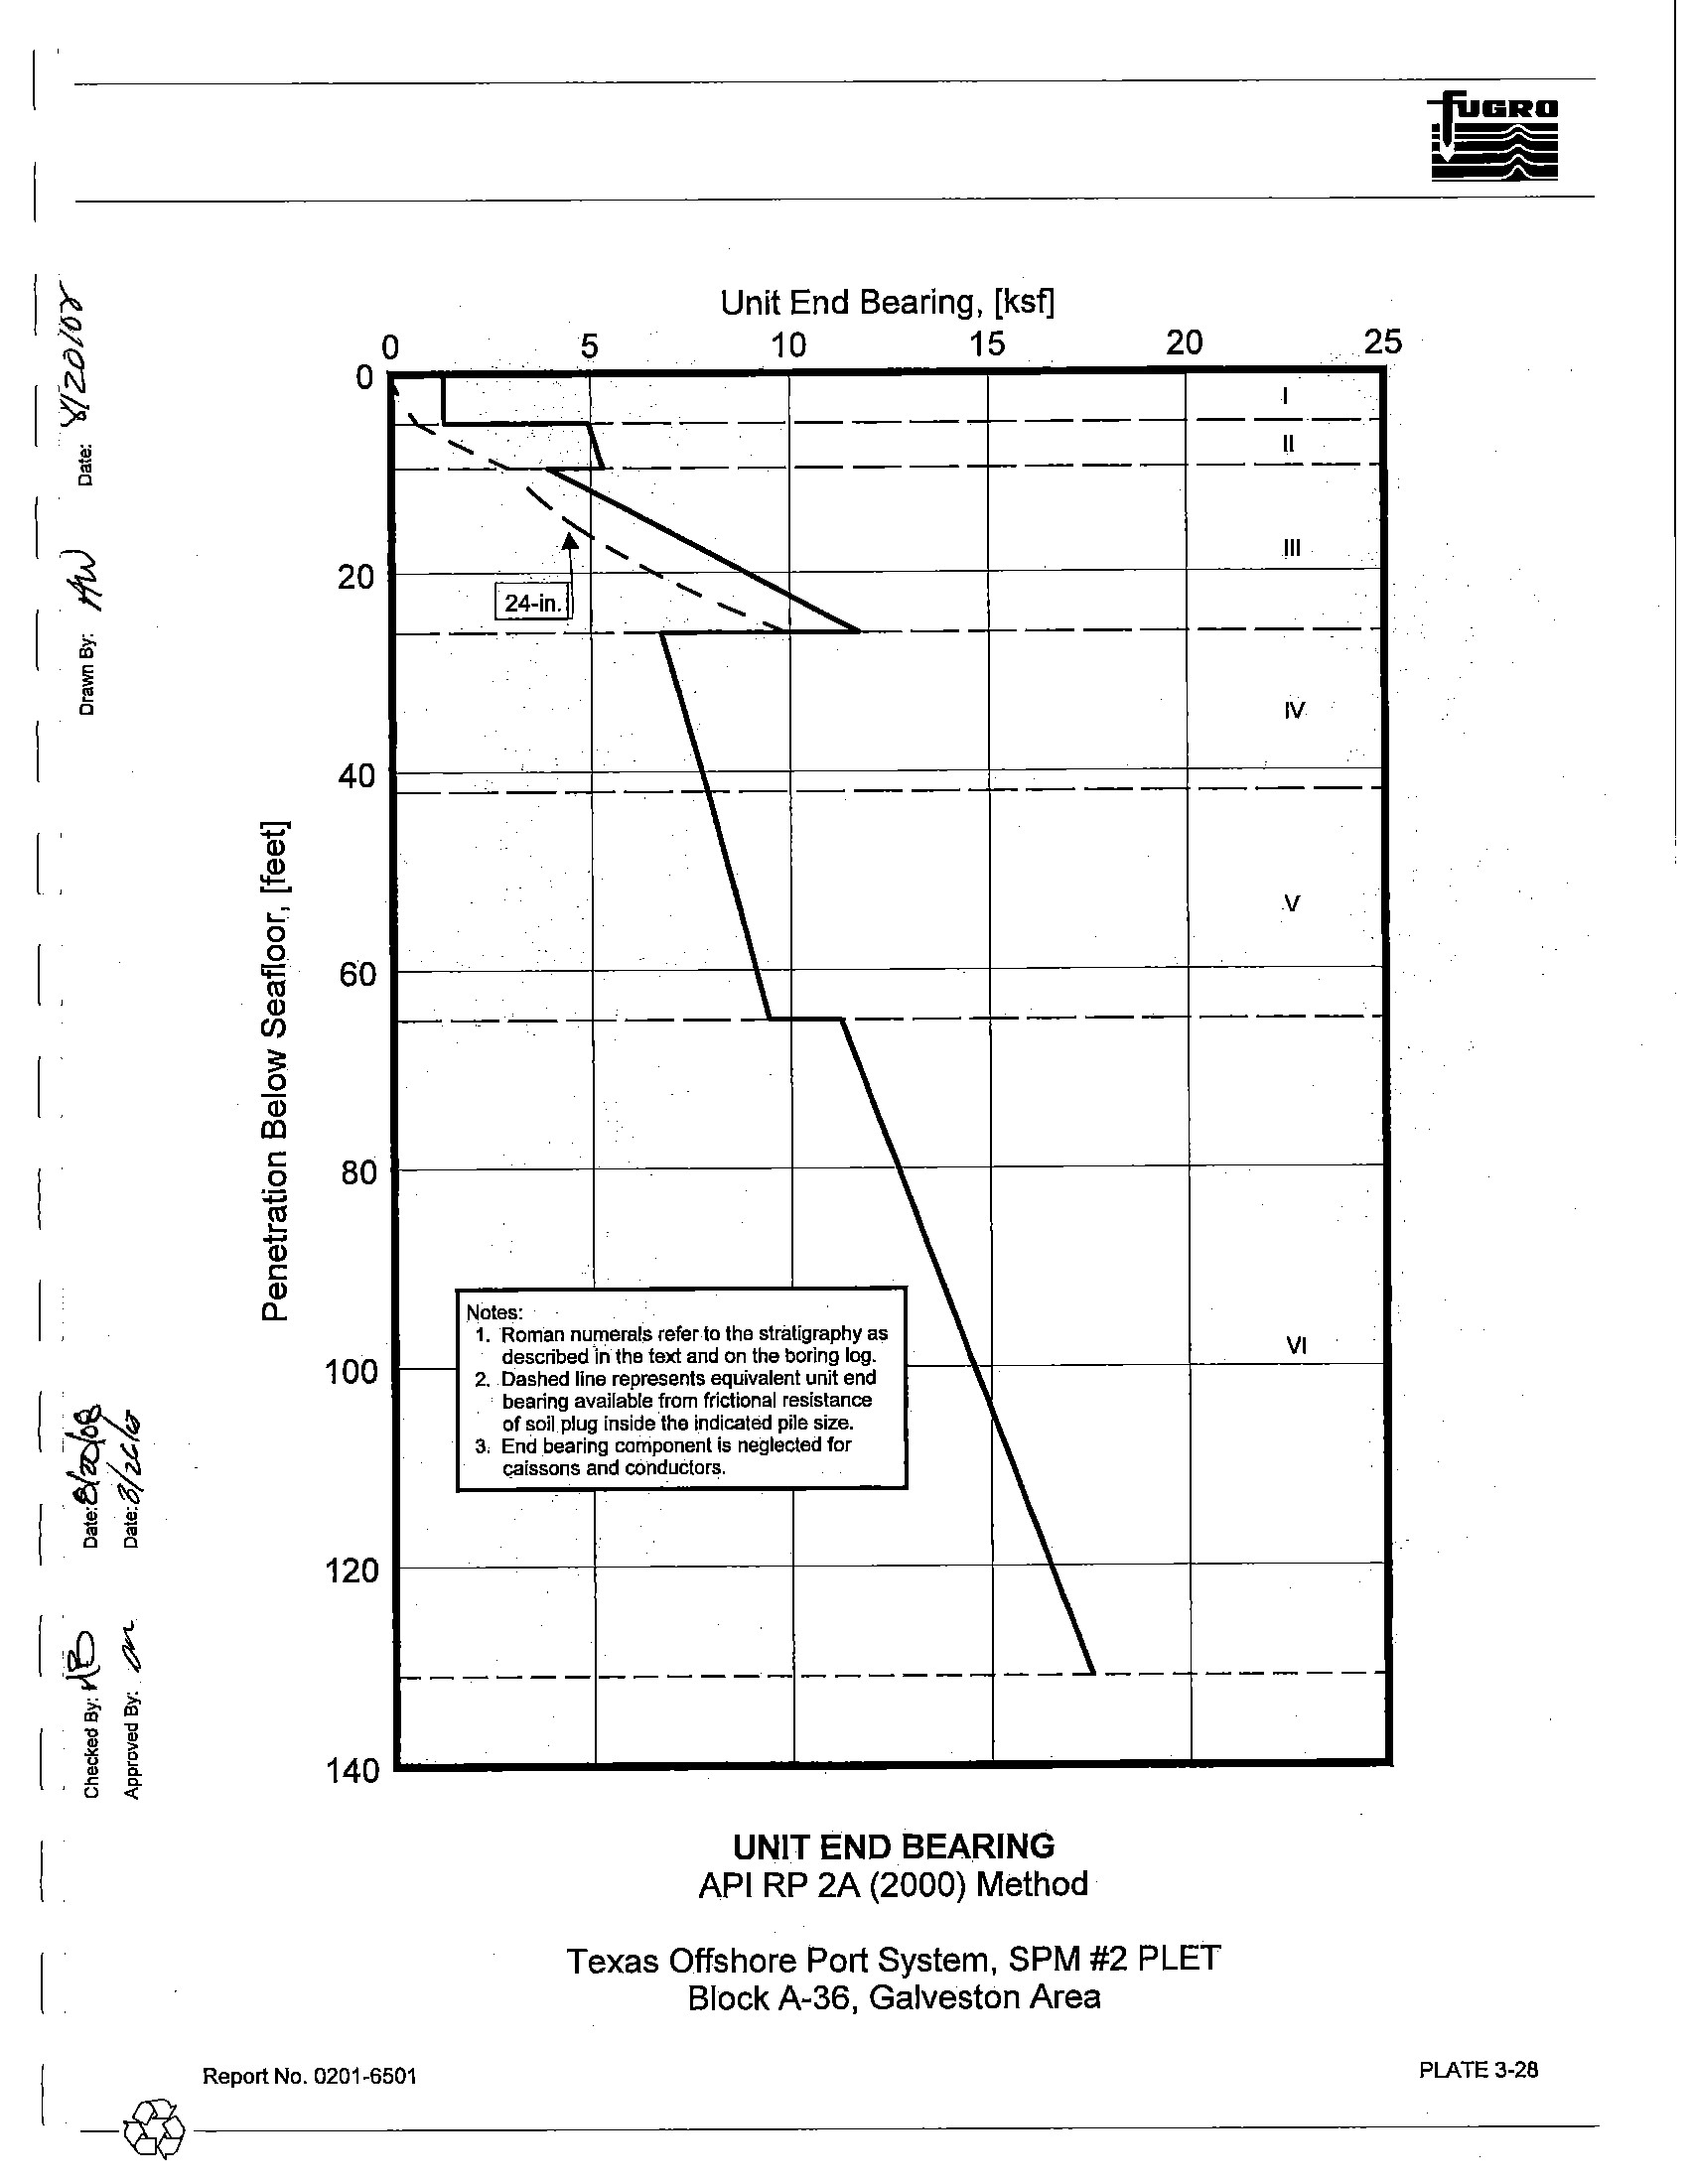
Ultimate Axial Capacity. The unit skin friction and unit end bearing values plotted on Plates 3-27
and 3-28, respectively, was calculated using the API RP 2A methods described in Appendix B. These
values were used to calculate the ultimate axial compressive and tensile capacities for 24-in diameter pipe
[
Report
No. 0201-6501
.-@~----------
3-7
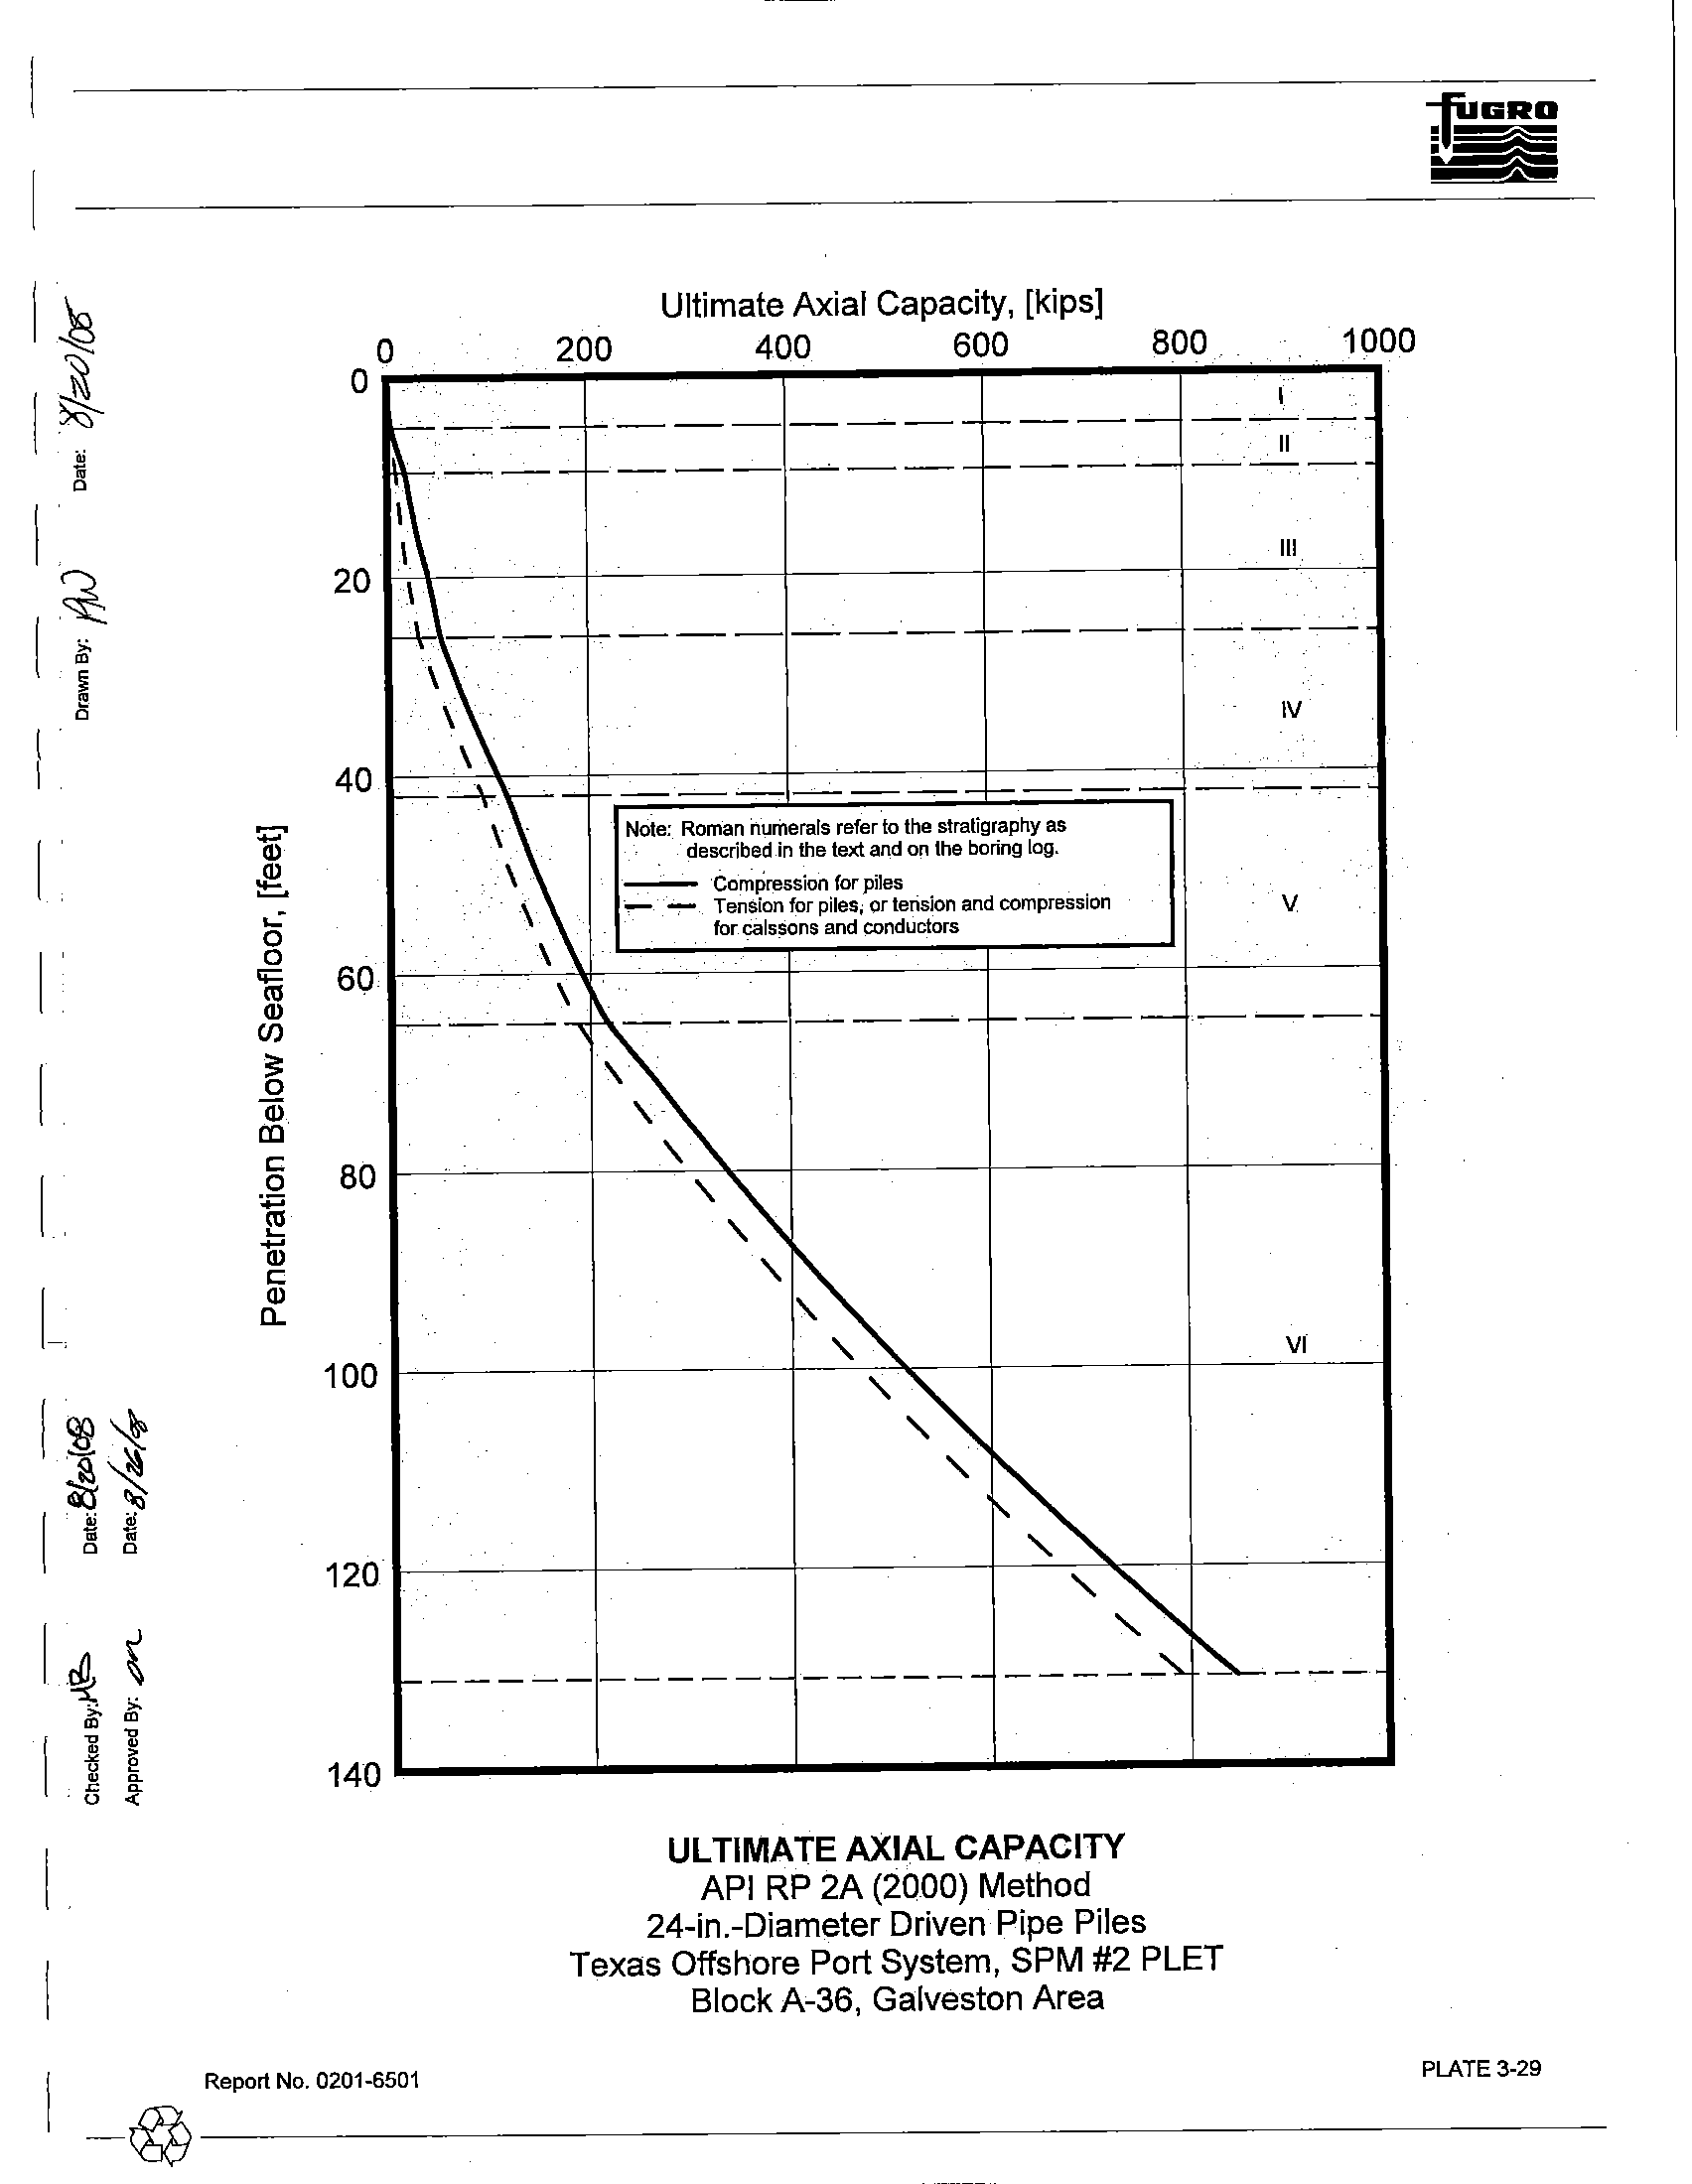
L
piles, driven to final penetration at the boring location. Capacity curves for driven pipe piles (conductors,
caissons, anchor and foundation piles) are presented
on Plate 3-29.
API
RP 2A recommends that pile penetrations be selected using appropriate factors of safety or
pile resistance factors. These factors are discussed in Section 2.5.1 of this report.
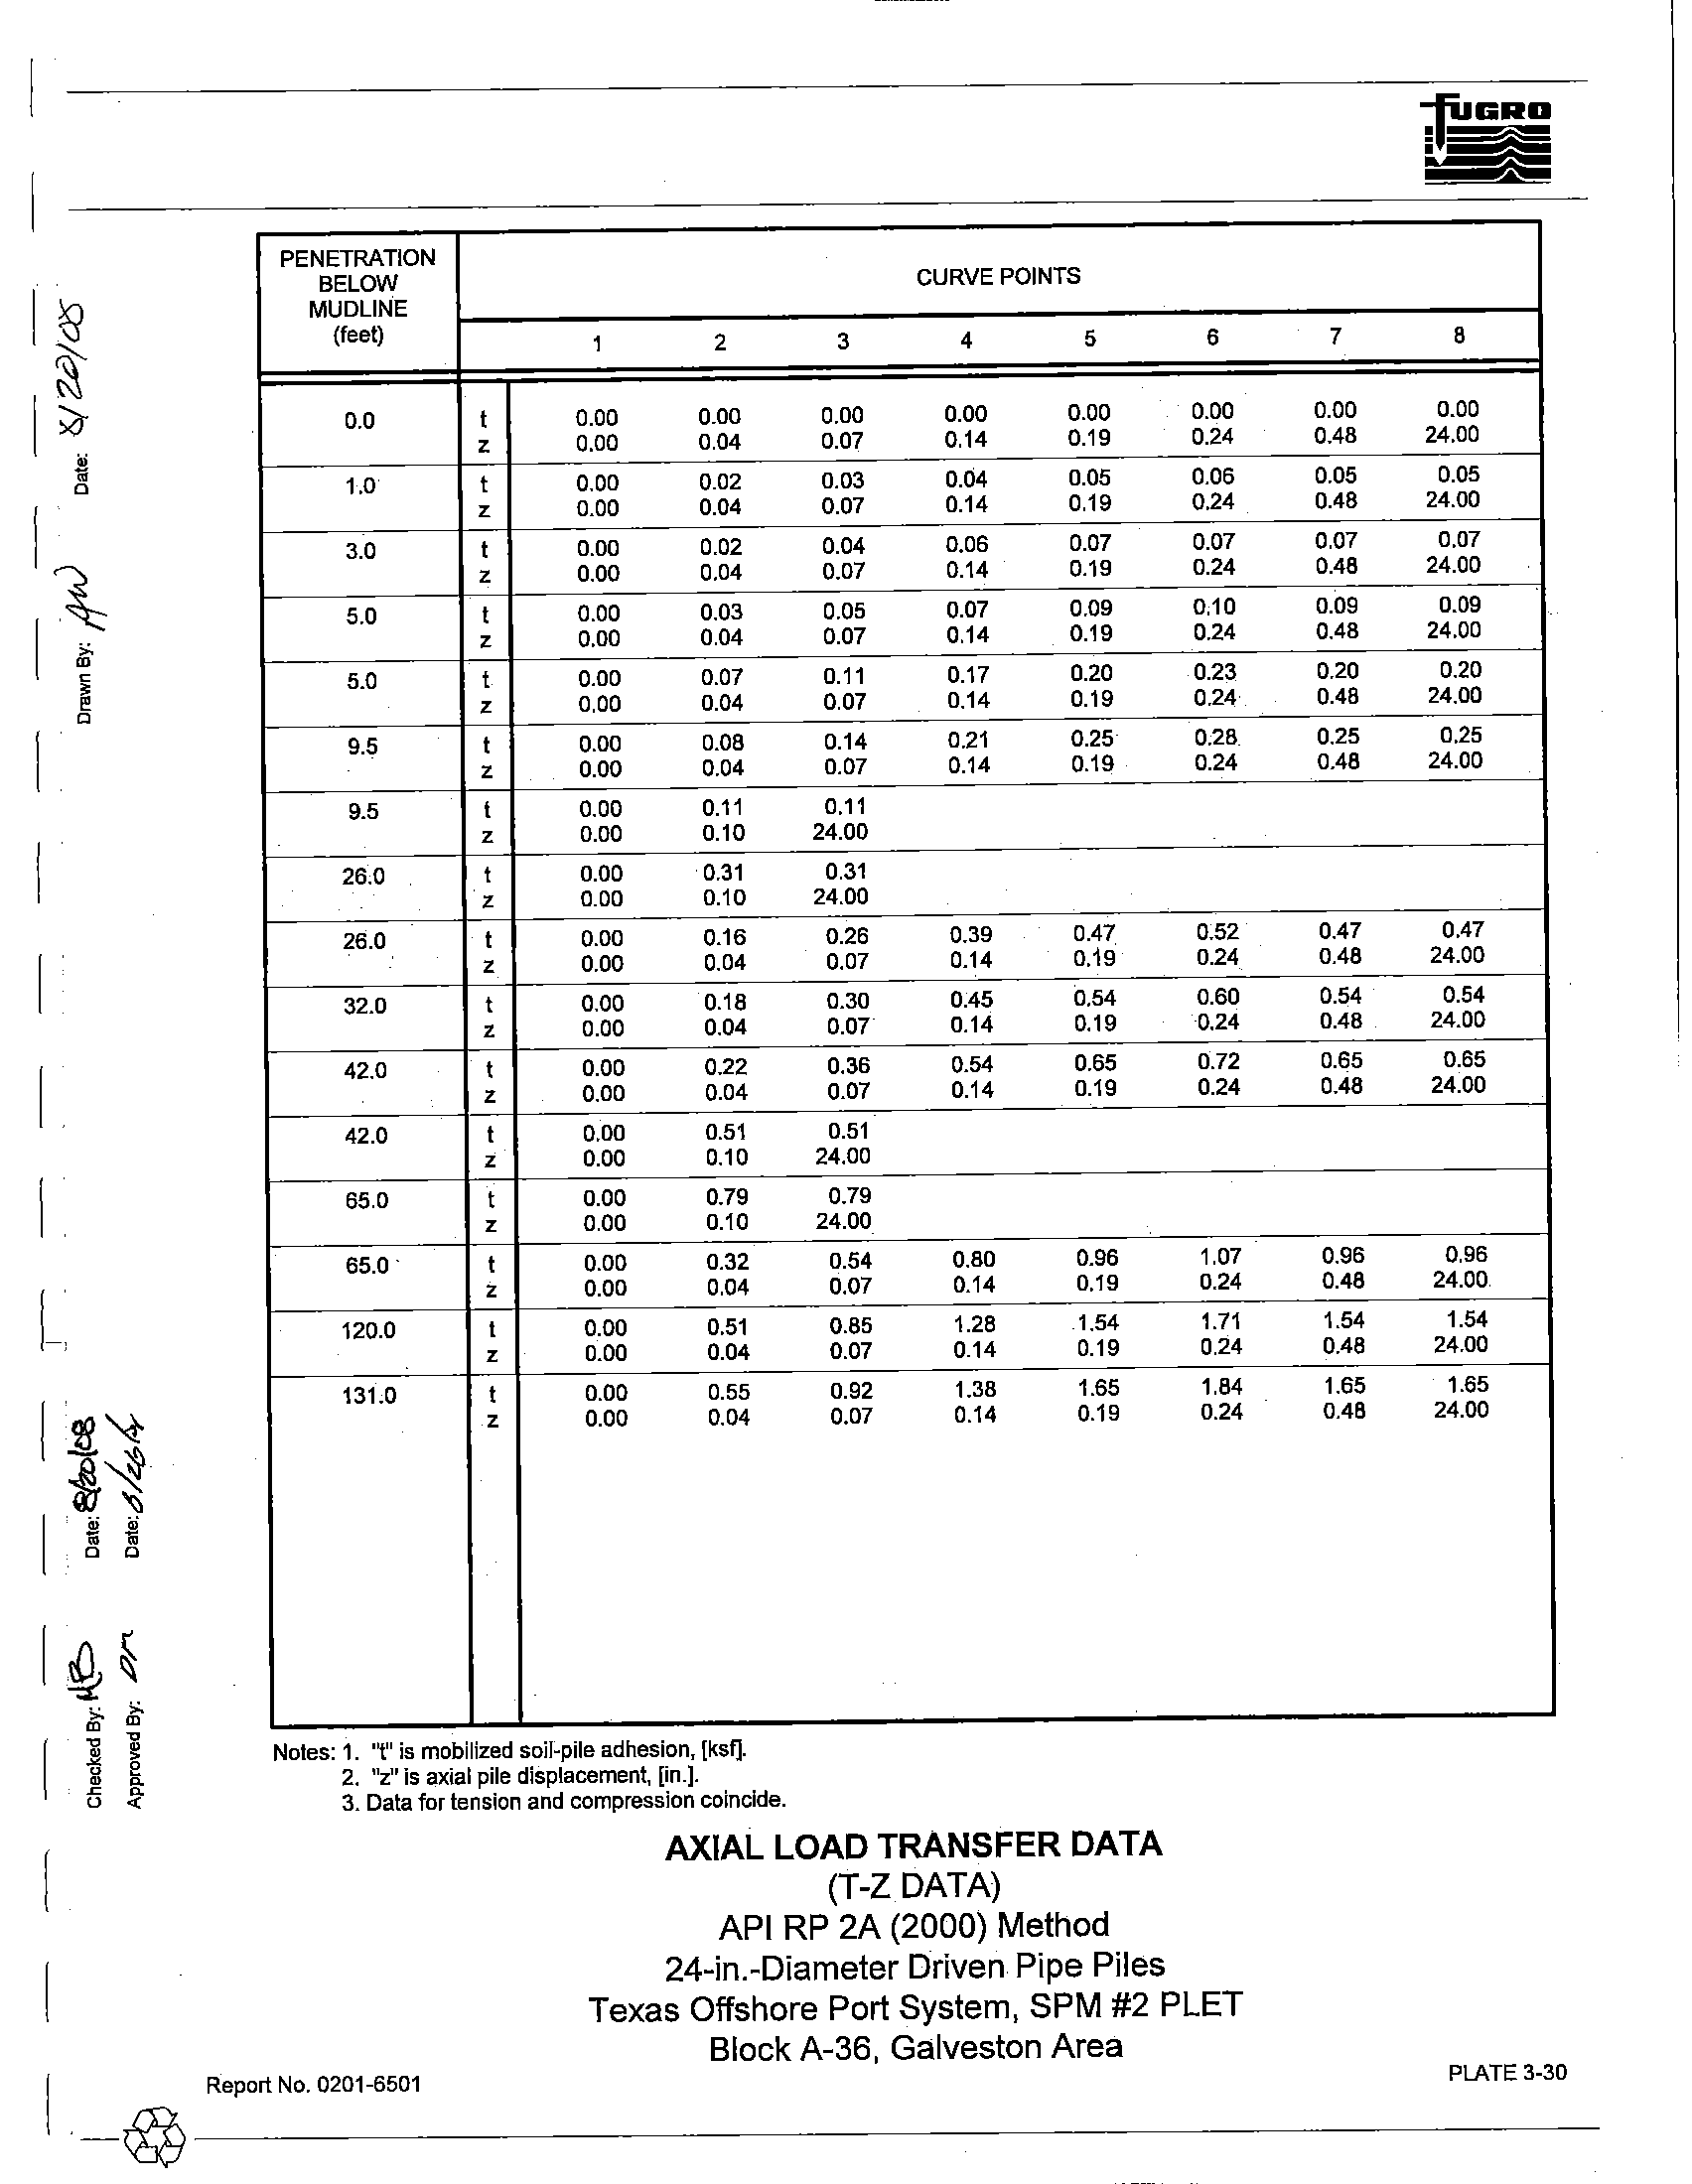
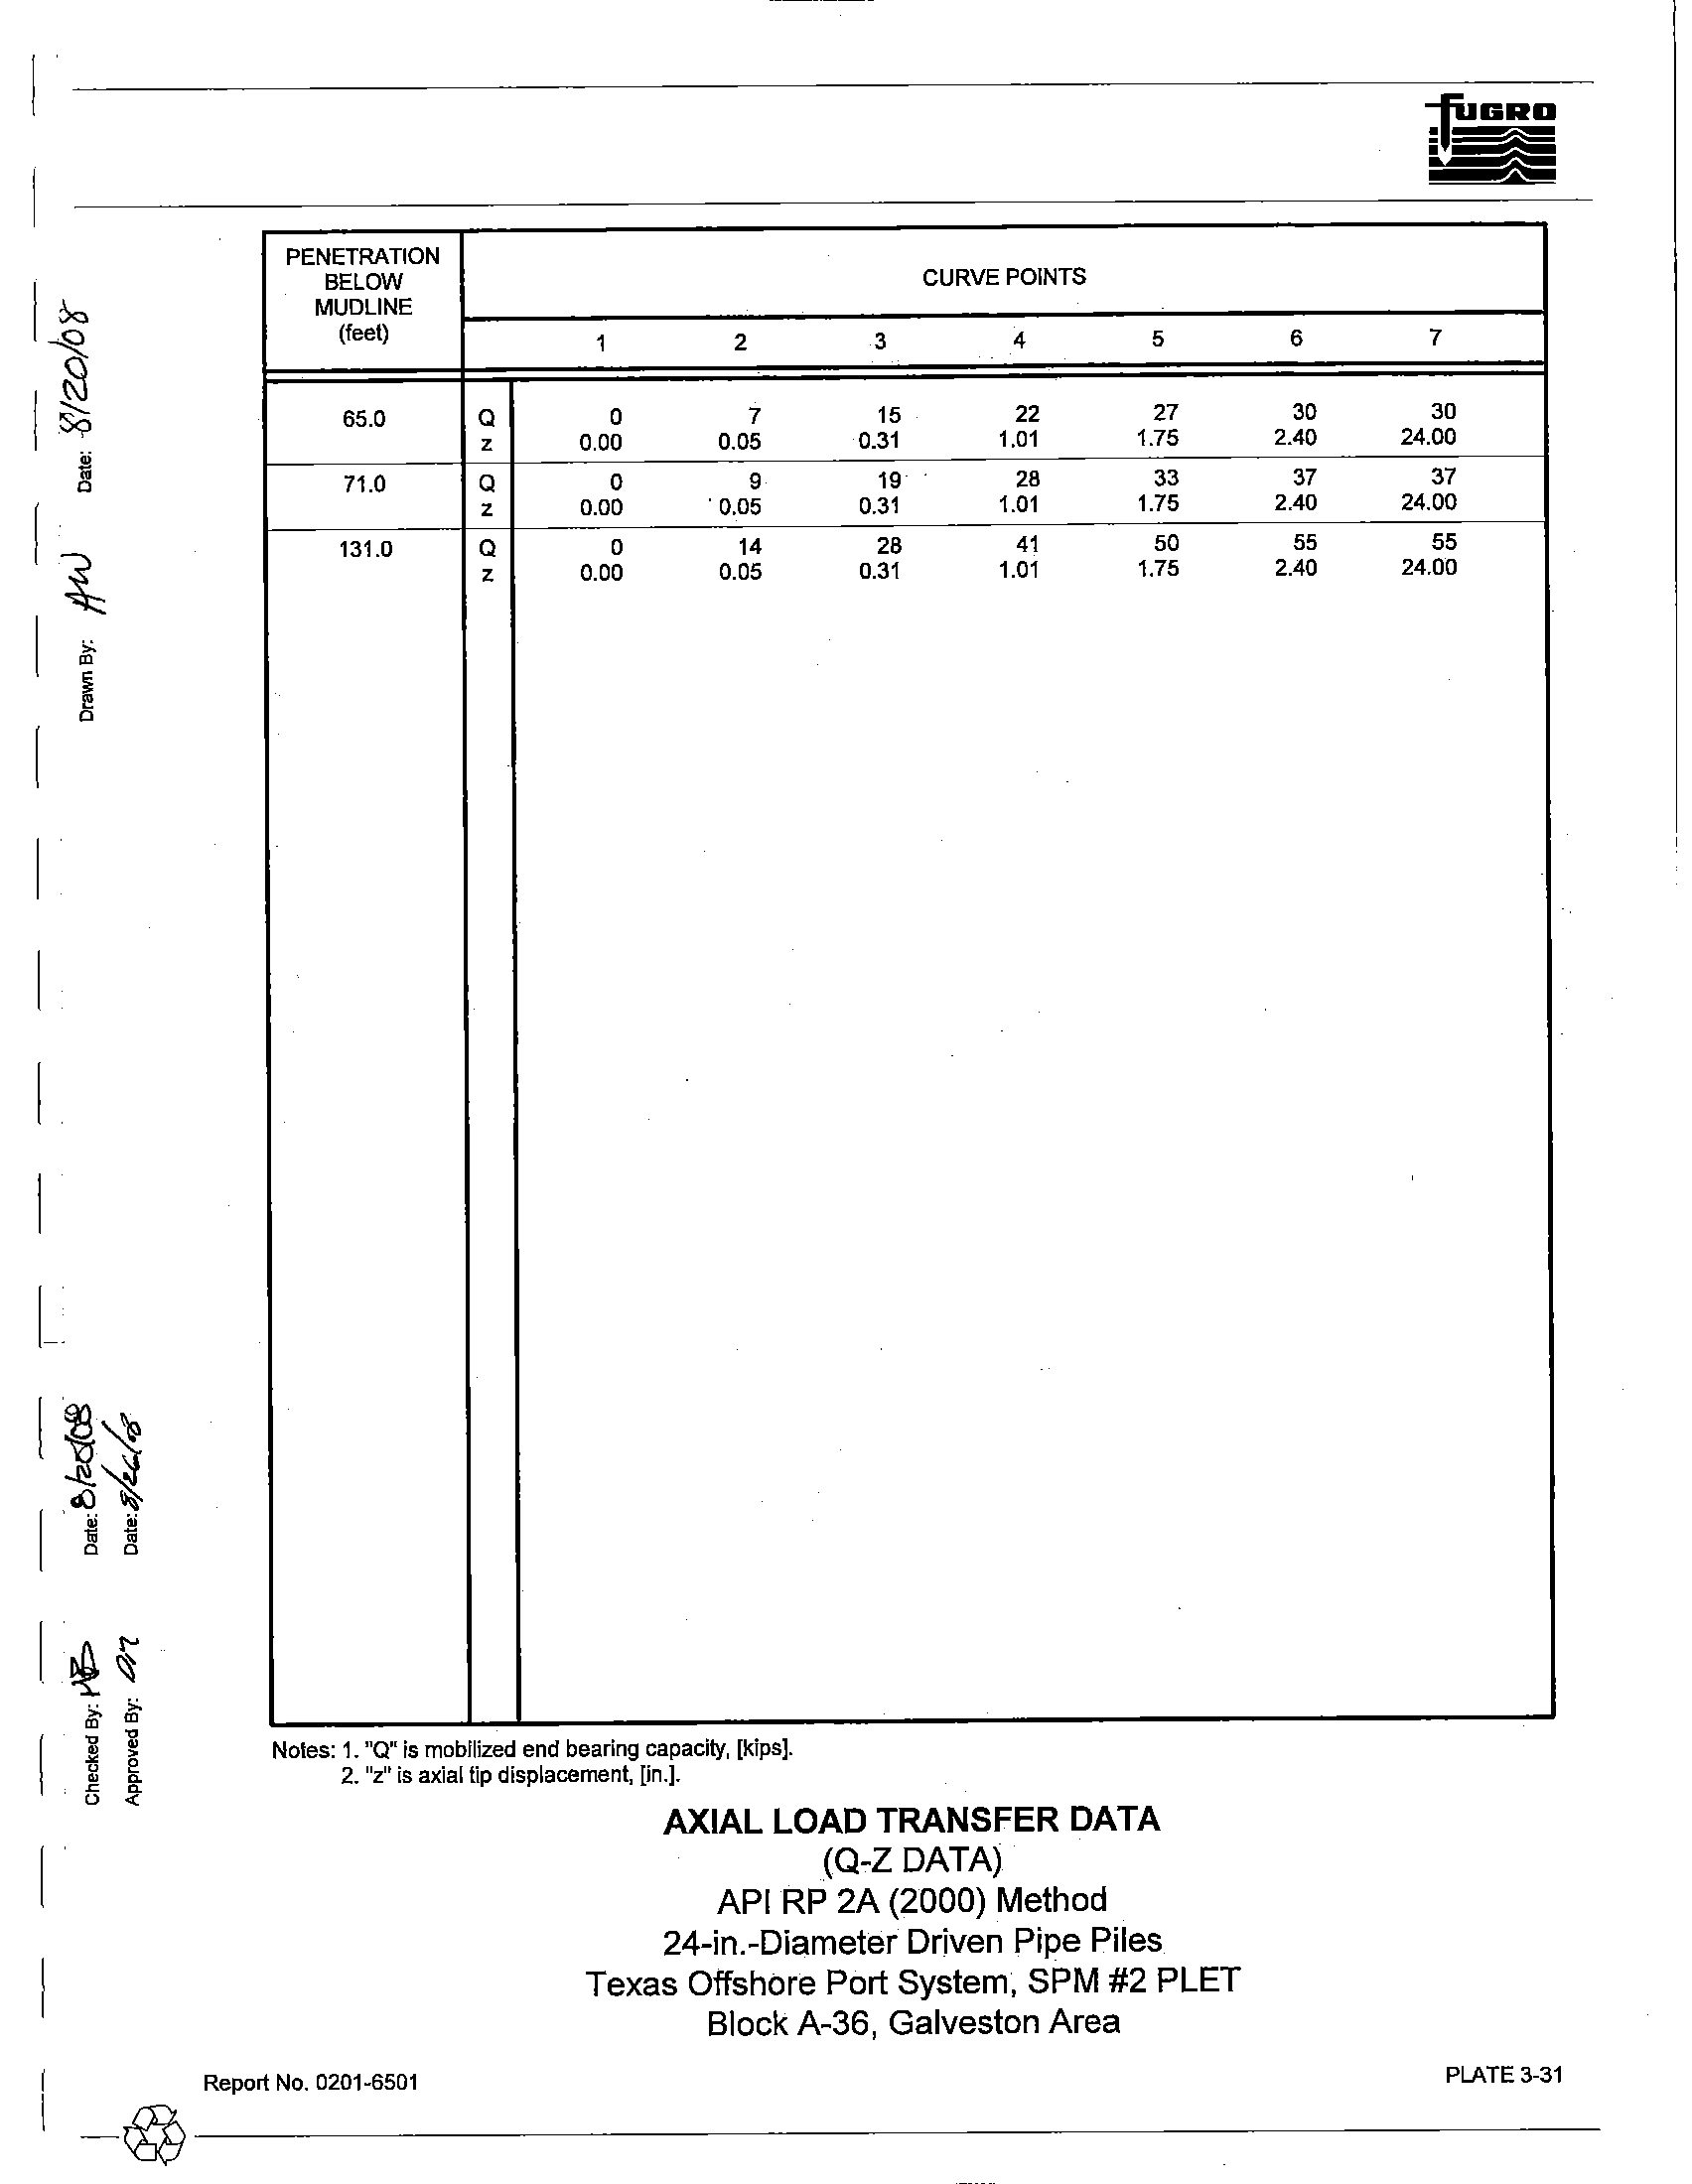
Axial Load Transfer Data. Axial load-pile movement analyses are usually performed using a
computer solution based
on methods developed by Reese (1964) or Matlock, etal. (1976). Plates 3-30 and
3-38 present the results
as side load-side movement (t-z) and tip load-tip movement (Q-z) data for 24-in.-
diameter driven pipe piles, respectively. The presented Q-z data should be used for foundation piles and
neglected for caissons and conductor design.
In developing the axial load transfer data in the cohesive
soils, a post-peak adhesion ratio
of 0.90 was utilized.
3.3.3.2 Lateral Pile Design Data
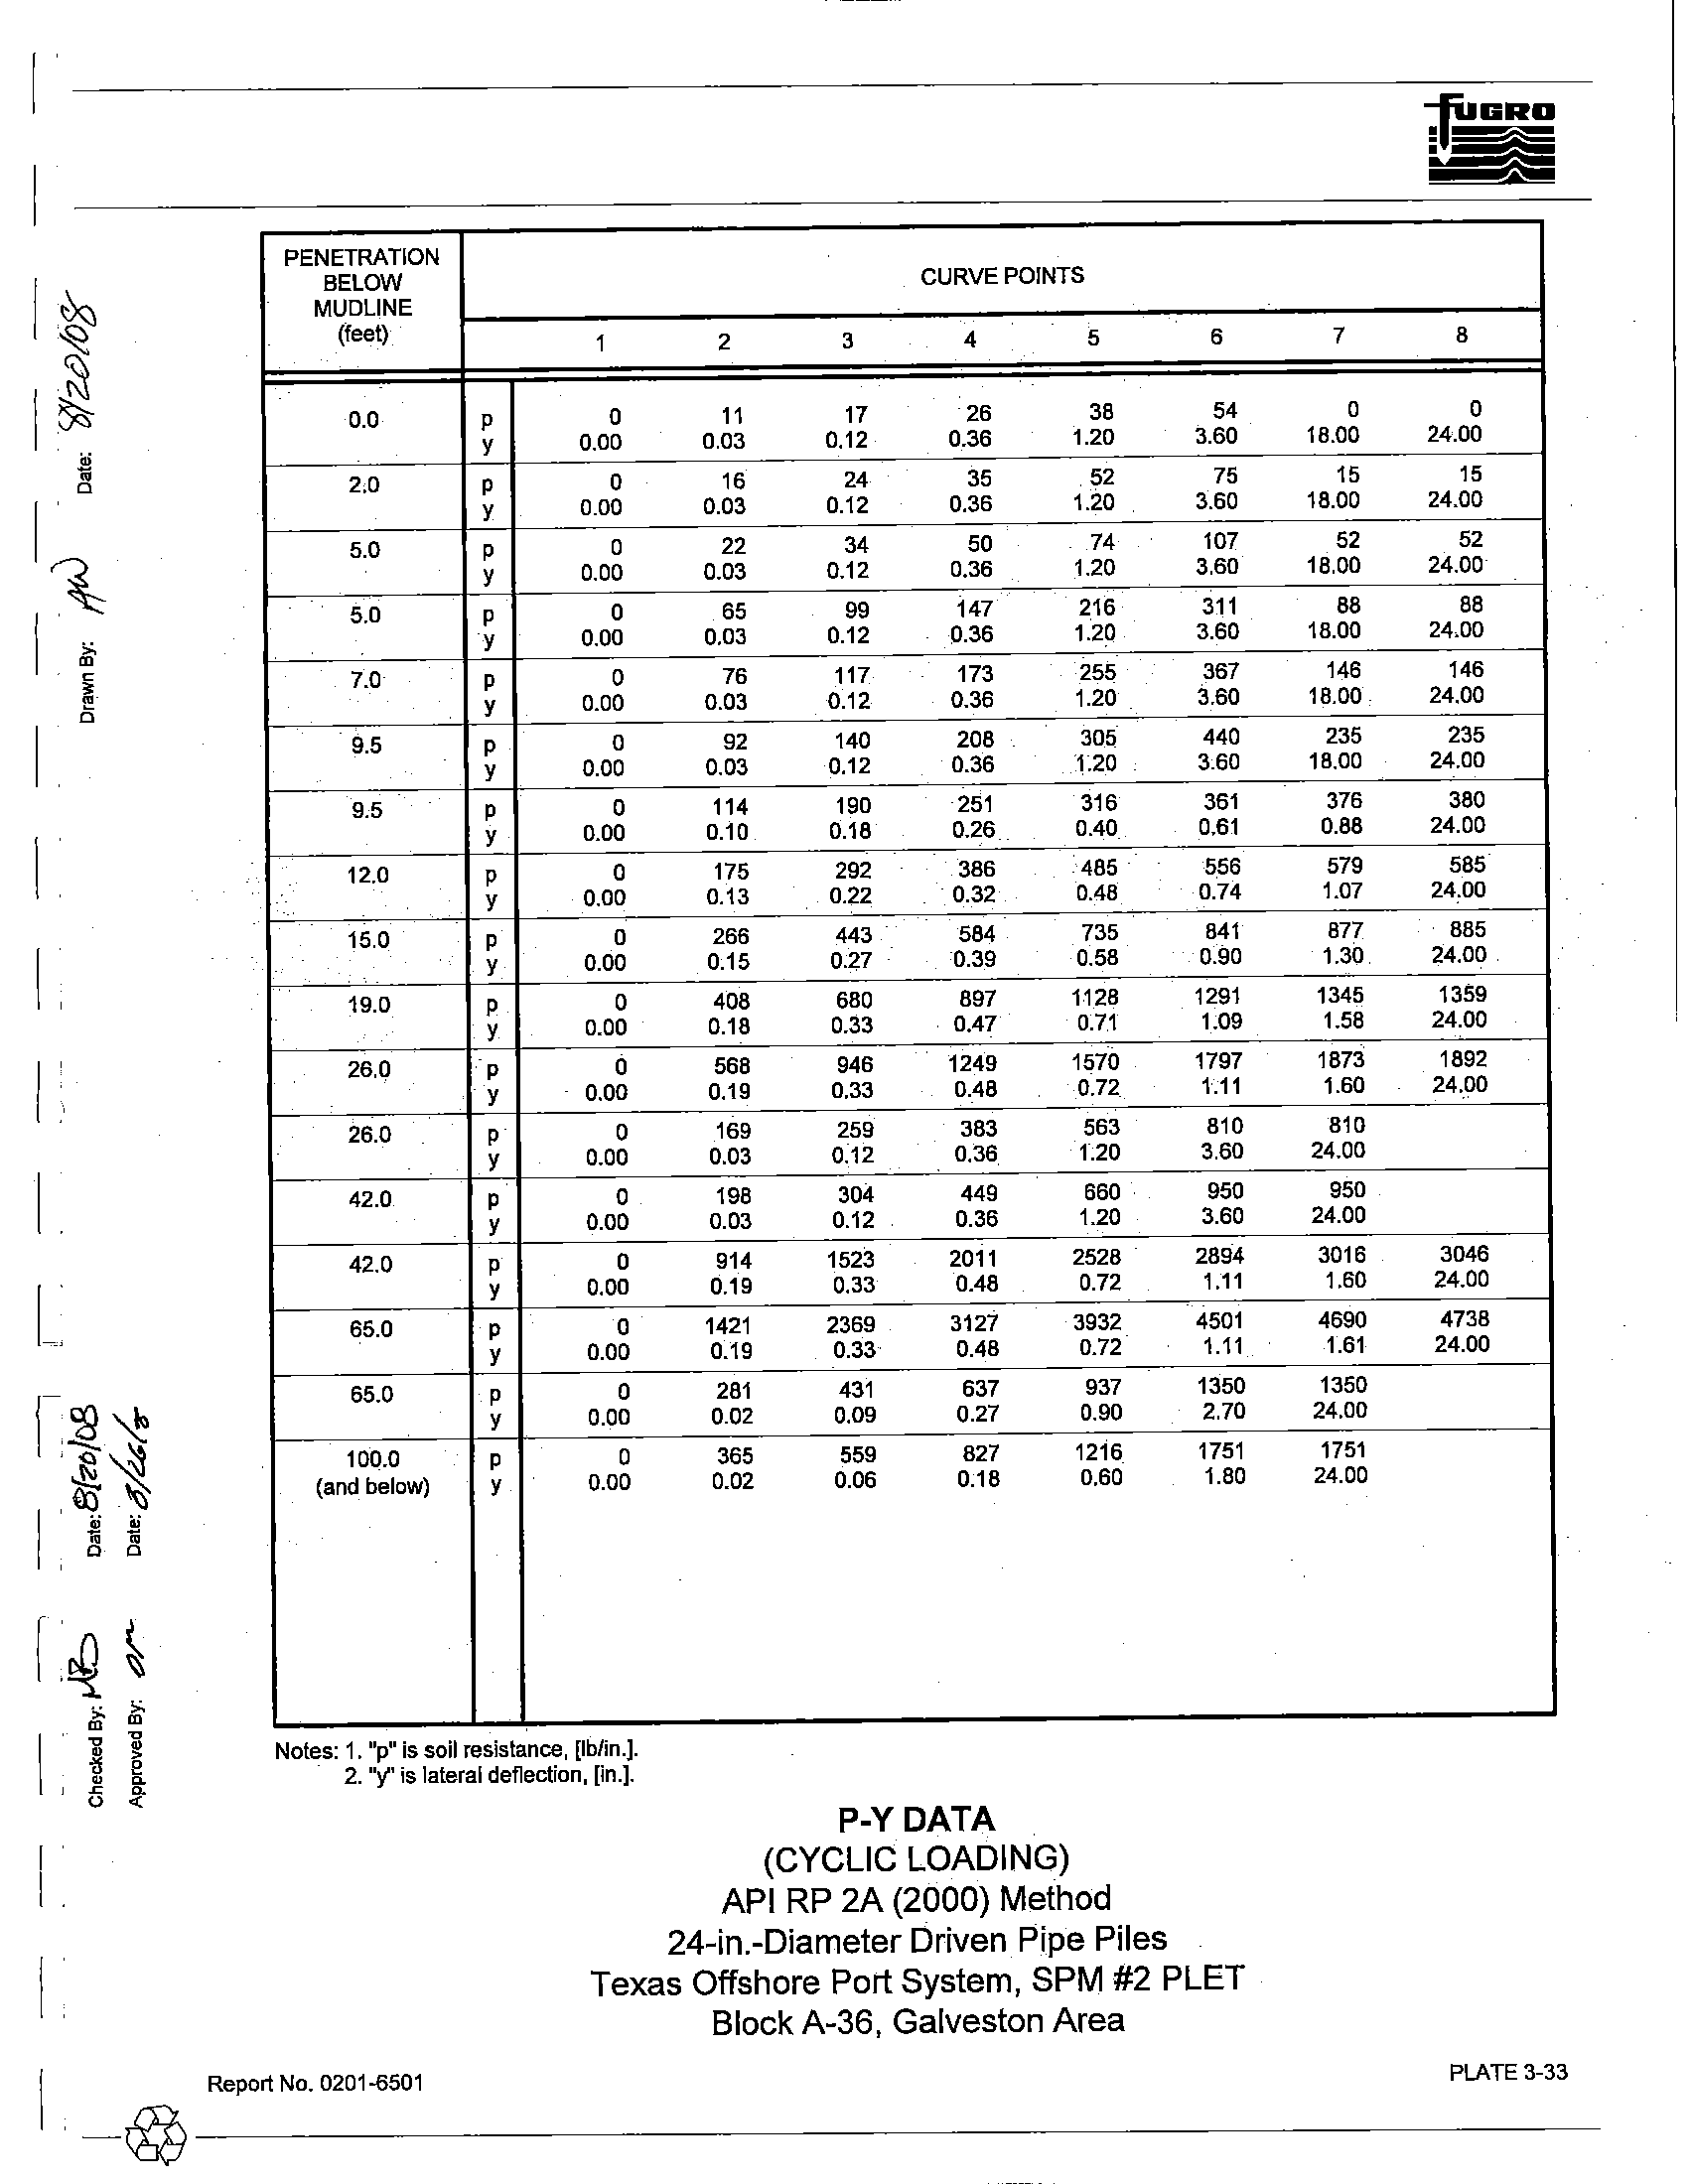
The soil resistance-pile deflection (p-y) characteristics
of the soils at the boring location were
developed for individual 24-in.-diameter driven pipe piles. These data may be used in lateral load analyses
of driven piles, conductors and caissons.
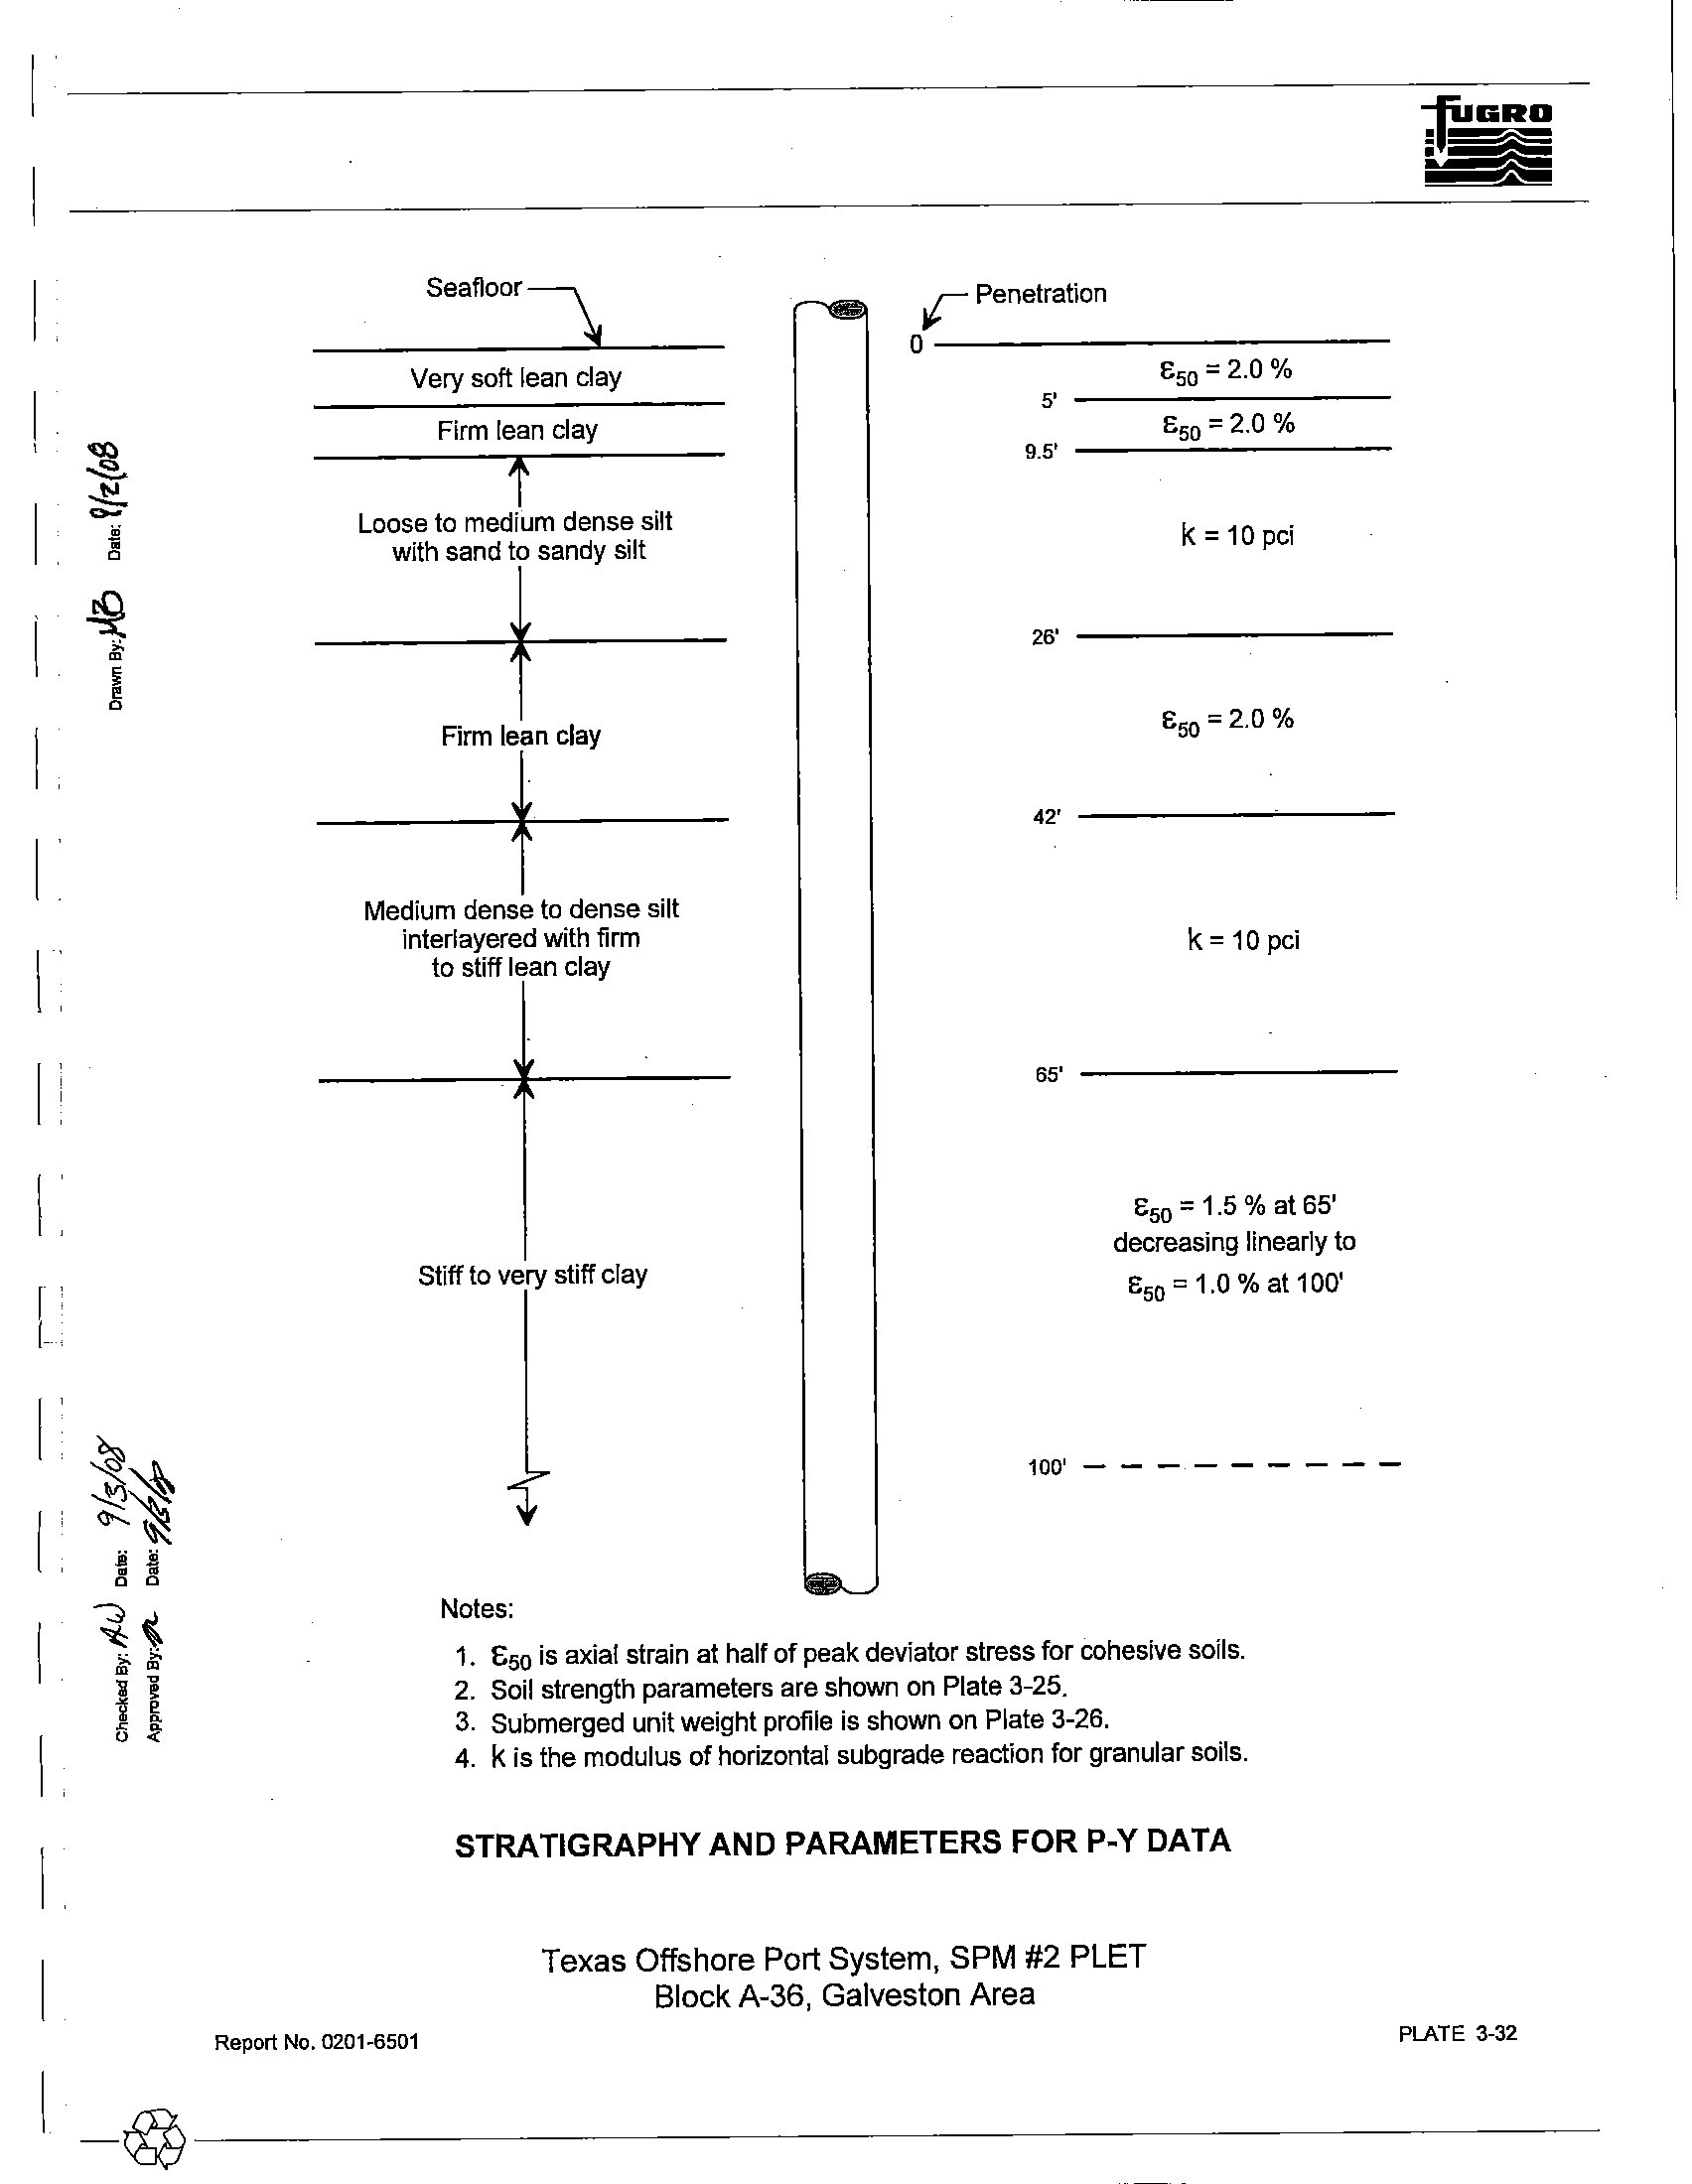
The p-y data for cyclic loading were developed to 1DO-It
penetration using procedures that have been outlined in API RP 2A and briefly explained in Appendix B.
The stratigraphy and parameters used to develop the p-y data are presented on Plate 3-32. The p-y data
for 24-in.-diameter driven pipe piles are presented
on Plate 3-33. P-y values presented at 100-1t penetration
may be used for lateral load analyses at greater depths.
3.3.4
Seafloor Bearing Capacity
Ultimate bearing capacity equations for the near-surface soils were taken from a design method
developed by Skempton (1951) based
on undisturbed shear strength. The following equations can be used
to determine the ultimate bearing capacity for horizontal tubular members and mud mats resting
on the
seafloor:
qu
=
750
for tubular members and
qu
=
(750)(1 + 0.2 B/L)
for mud mats for B <; 50 It
where:
qu
=
ultimate bearing capacity, psf;
B
=
width of mud mat, It; and
L
=
length of mud mat, It.
For horizontal tubular members penetrating less than one radius, the projected area at the mudline
should be used to calculate the ultimate bearing capacity of the members. For members penetrating one
radius
or more, the diameter should be used. For triangular-shaped mud mats, B should be taken as 75
percent
of the least altitude and L shoUld be taken as the longest side.
API
RP 2A recommends that appropriate factors of safety be applied to the capacity values. These
factors are discussed
in Section 2.6.1 of this report.
I __
~
____
R_e_p_ort__
N_O._O_20_1_'6_5_0_1___________________________________________________________
3_-8______
I
@
I
;u
~
"
0
"-
z
0
?
a
'"
~
6,
~
'"
10
20
30
40
50
60
70
80
~
Q)
i!::.
~-
90
0
0
'iii
Q)
UJ
:;:
0
100
Qi
OJ
c
0
~
110
~
Qi
c
Q)
[L
120
130
140
150
160
170
180
190
200
"
~
~
w
Checked By: I"\b
Approved By:
~~
Date,l('Z(OO
Date'9.tf,..{
x
=
3,283,617'
Y=269,11B'
BLOW
COUNT
Texas South Central Zone Coordinates
SEAFLOOR
AT EL. - 112'
~
VERY SOFT OLIVE GRAY LEAN CLAY
WOH
I
(5.0')
5
-
II
•
FIRM GRAY LEAN CLAY
5
~O.O'
5
LOOSE TO MEDIUM DENSE GRAY SILT
WITH SAND TO SANDY SILT
5
10
III
-
15
15
~6.0'L
-
~.
FIRM GRAY LEAN CLAY
PUSH
•
I
Note,
See PLATE
3-23.
for delaHed 50H
I
PUSH
IV
stratIgraphy to 40-ft penetration
•
20
r-~
142.0'
PUSH
..
~
MEDIUM DENSE TO DENSE OLIVE GRAY
SILT INTERLAYERED WITH FIRM TO STIFF
30
OLIVE GRAY LEAN CLAY
PUSH
-with mica and a few pockets of organic matter
r-
to
44'
-
-sandy at 42'
30
V
-silty fine sand layer, with clay seams
at
43'
~
-w.,h ,and
0145'
~
-fat, WIth sand pockets and partings and Sill pockets
PUSH
at 46'
-
-Wllh a few clay pockets, mica and partings and
pockets of organrc matter
at
47'
20
-wi1h poekel' of orgame matier
01 57'
I
r
-with a few gray bands a156'
_II-With clay pockets, partings, and seams and
PUSH
_
sand seams al62'
-
STIFF TO VERY STIFF GRAY CLAY
PUSH
-lean, wllh sand seams al 67'
-with a silt layer, with clay pockets and partings
al69'
-wilh gas blisters and silt pockets, partings, and
r-
•
seams at 71'
-with sill pockets, partings, and seams and a few
PUSH
light gray bands, 79' to 101'
~
-platy at 80'
r-
•
-with gas blisters, 89' to 101'
PUSH
~
VI
~
-platy, with ,a few pockets of organic matter,
-
99' to 111'
PUSH
~
-
•
-olive gray, with a few calcareous nodules,
PUSH
109' to 121'
-slickensided,
with a few silt pockets a1110'
-
•
-blocky, with a few shell fragments, 119' to 131'
PUSH
-lean and expansive, with gas blisters and a few
sand pockets a1120'
=-~
•
-brown, with a few sill pockets and partings
r-and pockets of
org~tter
at
~30~13..1.:.Ql
PUSH
-
-
-
r-
-
-
SAMPLING TECHNIQUES
Number
of
blows
of
a 175-lb weight (hammer) dropped approximately 5 ft
to
produce a
maximum of 24
m. of penetration of a 2.25-in.-OD, 2.125-m.-ID thin..walled tube
sempler. "PUSH" denotes a 3.00-in.-OD,
2.B3-in.-1D thin-walled tube sampler was
advanced
24 in. with the weight oflhe drill sIring 'WOH" denoles ill 2.50-in.-OD,
2.125-in.-ID
ITner sampler was advanced 24 in. with the weight of the hammer.
IDENTIFICATION TESTS, [%)
20
40
60
80
SUBMERGED UNIT WEIGHT, [kef]
0.03
0.04
0,05
0.06
+
---.~
.-+
0
]
•
r
n
+-
-----1
••
~
0
0
•
0
•
•
0
•
~
•
[]I
+
--#c-
D
+
-..
DOD
+
--_.
-.
0
•
u_
•
•
•
[.
+
-----
•
_B-+
•
++ ••
:J
+
i==-"~
-+
o 0
•
o.
+
1--••
[
'"
-u
+
-
..
f----'+
"-J
uu
+
-
-'"
~.-
-'-"-+
._
U
+
-e- -e
u
-
-
r-~
CLASSIFICATION TESTS
'f' SOLUBILITY IN HCL,
[%]
•
PERCENT PASSING -200 SIEVE, l%]
•
WATER CONTENT
0N),
[%)
0
SUBMERGED UNIT WEIGIfT (SUW)
PLASTIC
LIMIT (PL)
LIQUID LIMIT (LL)
+--------------~-------+
LOG OF BORING AND TEST RESULTS
Texas Offshore Port System, SPM #2 PLET
Block A-36, Galveston Area
Drawn By'
,If<'J
Date:
'I
~.?(OJY
UNDRAINED SHEAR STRENGTH
[ksf]
0.5
1.0
1.5
2.0
~
o
~.
<>
•
10
20
0
",$ $
~
30
A
•
#
0
#$
•
40
0
..
50
0
$
"'"
60
$
~
"'.
70
=
&
•
80
'<A
•
$
•
90
~
&g$
•
100
=
$'"
1&
110
$
•
120
.-
~~
-<
---
.~
130
140
150
160
170
180
190
STRENGTH TESTS
200
®
POCKET PENETROMETER (PP)
'*' TORVANE
(TV)
<:I>
REMOTE VANE (RY)
•
MINIATURE VANE (MV)
(~
RESIDUAL (MVres) VALUE)
.. UNCONSOLIDATED UNDRAINED TRIAXIAL (UU)
(Open symbols indIcate remolded (r) tesls)
I
@
;u
ro
"C
a
"-
Z
?
0
'"
S!
in
S!
'"
"
~
:G
g!
0
5
10
'af
:!::.
..:
'"
0
15
0
q::
en
'"
;;:
0
20
Cii
aJ
c:
.
rn
Q
25
~
Q5
c
'"
[l.
30
35
40
__
Checke9-6L-"\.~
__.
Da~/CB-
••pprov£._
~J'
//1.
Del_.
vfN,4
0
-
X
=
3,283,617'
IDENTIFICATION lESTS,
[%1
Y=269,11B'
BLOW
20
40
BO
80
COUNT
Texas South Central Zone Coordinates
SUBMERGED UNIT WEIGHT, [kef]
SEAFLOOR AT EL. - 112'
0.03
0,04
0.05
0.06
~
VERY SOFT OLIVE GRAY LEAN CLAY
WOH
D
-mottled with brownish yellow, with sand pockets
+
---...
I
+
?
and a few shell fragments
_
-wIth silt pockets and partlngs to.'
•
...gray, WIth sand partings and calcareous
~
0')
5
D
-
nodules below 4'
5.0'
FIRM GRAY LEAN CLAY
-with a silty fine sand layer, with clay pockets.
5
••
D
II
partings and seams, and many shell fragments
+
-----f
•
D
at
6'
-with sand pockets and partings
below
7'
®.Q1.
r-
-with a few pockets of organic matter and
5
shell fragments at S'
•
D
-with sand seams and many shell fragments
belew9'
LOOSE TO MEDIUM DENSE GRAY SILT
5
WITH SAND TO SANDY SILT
•
•
D
I-
~wi1h
mica and a few shell fragments
~wi1h
sand and clay partings and seams and a few
10
pieces of wood
at
10'
•
IIJ
III
15
'-
-with Clay pockets at
22'
15
•
[J
I-
(26.0')
r-
FIRM GRAY LEAN CLAY
-with a few shell fragments to 33'
PUSH
--~
D
+
I-
~
-with a
few
pockets of organic matter below 3"
-with a few sand pockets at 32'
PUSH
! ••
DOD
IV
+
I-
J
20
•
D
+
-«-
SAMPLING TECHNIQUES
CLASSIFICATION TESTS
Number of blows of a 175-1b weight (hammer) dropped approximately 5 'It to produce e
T
SOLUBILITY IN HCL,
[%]
maximum of 24 in. of penetration of a 225-in.-QD, 2.125-1n.-l0 thin-walled tube
•
PERCENT PASSING -200 SiEVE,
[%]
sampler.
"PUSH~
denotes a 3.0Q...ln.-QO, 263-in.-10 thin-walled tube sampler was
•
WATE~
CONTENT
(w). i%]
advanced 24 in.
witI'1
the weight of the drill string. "WaH" denotes a 2.5Q-.inAm,
[J
SUBMERGED UNIT WEIGHT (SUW)
2.125-in.-ID liner sampler was advanced 24 in. with the weight afUle hammer.
PLASTIC LIMIT (Pl)
LIQUID liMIT (ll)
+----------------------+
LOG OF BORING AND TEST RESULTS
Texas Offshore Port System, SPM
#2
PLET
Block A-36, Galveston Area
.D.rav.nBy:
..ILtAL
JJa1O'-')S
1
0
ULU
D --
00
UNDRAINED SHEAR STRENGTH
Ik,n
0.2
A.'
O.B
O.B
o
~
•
.
~
<>
1.
"
1,4.5)"'~
(1. 2. 5.0)...-"
5
•
10
,.,.
~
'"
15
..:
0
q::
0
en
'"
20
Qi
~
aJ
c
.Q
-
25
~
..
-
'"
$
•
c
'"
[l.
I
30
1:>.
~
$
... $
35
<>
$'"
$
(1.1
• 38.0)"':;>
STRENGTH TESTS
40
8
POCKET PENETROMETER (PP)
•
"T:ORVANE (lV)
¢o
REMOTE VANE (RV)
•
MINIATURE VANE (MV)
(~
RESIDUAL (MVres) VALUE)
A. UNCONSOLIDATED UNDRAINED TRIAXIAL (UU)
(Open symbols Indicate remolded (r) tests)
-~
w
125 METERS
41
PlASTICUWTtptj
J...IQUOliM;'jU1
+---------------------~+
.....
_.
.............
-....,...
-
..,~~nprtvo
..
~
_1111_
••
.....
p!DIII, ......... ""
_"7~
.........
,........_""'...
~1"'!'-."illl71'
....
~
....
_p:dIIIrt~_.
lIII'illl1'
..... p',..".tor __...
,.,,'Z\'
~"'"I''''.''''II.IUI'
oIidi!\ ............,..'lfill21'
.................,.-.....l1li'
001 ....01..
1.\211'
-
GEOPHYSICAL AND GEOTECHNICAL INTEGRATION
Texas Offshore Port System, SPM #2 PLET
Block A36, Galveston Area
Portion of SUbbottom Profiler
Line 2208
E
Report No. 0201-6501
__
~--------------------------------------------------------------------------------------------------------
____________________________________________
~
________________________________P_LA
__
T_E_3-_2_4_________
Il
I
1-
lil
I **
c
"
I ,S$!
~
'"
>-
<D
<D
I
~
~
B
~
0
e
•
~
~
~
0
«
:;::'
CD
~
..:
0
0
'iii
CD
U)
~
0
Qi
OJ
c
0
:;::;
ItI
....
1il
c
a.
CD
Shear Strength Profile, [ksf]
o
0.0
1-'
0.5
1.0
1.5
2.0
2.5
20
40
60
80
100
,
120
140
I
--
--'---
--_.-
---
II
1---,-
i- --
---,------
---
$=20'.8=
5°, N
q
=
8.0, f
ma
= 1.0 ksl. qmax =
o
ksl
III
f----'-
--'\-
-----
--_.-
---
IV
f----.-
----\-
----
-----
---
\
\
$=20'.8= 5'. Imax = 1.0 k:l!
- clay profile (se note
2)
V
\
t-----
----,
~\-
------
---
\
\
VI
Notes:
1. Roman numerals refer to the stratigraphy as
described in the text and on the boring log.
2. Clay profile in this layer is used for end
bearing Computation.
------------------
---_\
-----
DESIGN STRENGTH PARAMETERS
Texas Offshore Port System, SPM #2
PLET
Block A-36, Galveston Area
I __
~-R-e-po-rt-N-O-.O-20-1--6-50-1----------------------------------------------
________
PLA
__
T_E_3-_25____
p
Q)
~
...:-
0
0
'iii
Q)
(J)
;:
0
Q)
OJ
c
0
1a
-
...
Q)
c
1-.
a.
Q)
I
~'*
'~~
I
'~
0
0
~
I~
,..
~
;;
;;
m
m
.
~
~
I
•
•
~
Ii
•
0
~
~
~
'U
«
Submerged Unit Weight, [kef]
o
0.00
0.02
0.04
0.06
0.08
0.10
20
40
60
80
100
120
140
I
--_.-
f------,-
-
/
-_.-
---
II
i----.-
f-----
-
--'-
--_
..
III
---.-
'----
------
--)
IV
-
.-
-
-f-
-
l.Note: Roman-numerals re_fer to the stratigraphy as
described in the text and on the boring log,
I
V
--_.-
-.-----r--
L.. ___
---
VI
------------
----
.-
------
-----
DESIGN SUBMERGED UNIT WEIGHT
Texas Offshore Port System, SPM #2
PLET
Block A-36 , Galveston Area
I
Report No. 0201.6501
-@----------------------
PLATE 3-26
I
~
I
~
~
I
1-'t1
~~
I
o
~
0
~
I~~
..
~
iii
on
I
u
u
•
•
[
~
~
u
•
~
0
«
I
Unit Skin Friction, [ksf]
o
0.0
'\
_.-
0.5
1.0
1.5
2.0
2.5
"'"
Q)
~
..:-
o
20
40
1ij
60
Q)
en
~
Q)
CD
§
80
~
a;
c
Q)
0..
100
120
140
----
---..
-
---.-.-
\
.-
----
-_
.. _.-
r---.-
-_\
.
---
--_.-
r---.-
-
\
.-
r-
-
--_.-
--
\
\_.-
'--_.-
Notes:
1. Roman numerals refer to the stratigraphy as
described in the text and on the boring log.
2.
Tension and compression curves coincide.
.
-----~
------ ------
--~~-
UNIT SKIN FRICTION
API
RP
2A (2000) Method
I
--_.-
II
---
III
--_.-
IV
-c
V
---
VI
------
Texas Offshore Port System, SPM #2 PLET
Block A-36, Galveston Area
I __
~_R_e_po_rt_N_O._02_0_1-_65_0_1
__________________________________________________
P_~_T_E_3_~_7
___
I~
I
I,~
I
~~
" "
ltD
~
.~
.,
;,;
.,
;,;
I
~
~
•
i
•
~
•
u
~
~
"
«
"'"
Q)
.J!!
..:
0
0
""
(II
Q)
en
3:
0
Q)
!Xl
c
:p
0
.....
(II
-
Q)
c
a.
Q)
Unit End Bearing, [ksf]
o
o
5
10
15
20
25
20
40
60
80
100
120
140
, I
--
--_.-
f------
......
-'
,-'-
--
--_.-
f------
,
~
~
..............
----,_.
"-
~
_.
'-
c-
.-
f----.-
\
-_.
_.--
---.--
-
--_.-
,--_.-
--
.. _.--
_._-
\
\--
--_.-
.
Notes:
1. Roman numerals refer to the stratigraphy as
-
described -in the text and on the boring log.
2. Dashed line represents equivalent unit end
\
bearing available from frictional resistance
of soil plug inside the indicated pile size.
\
3. End bearing component is neglected for
c;aissons and conductors.
------------
------
-~---
UNIT END BEARING
API
RP 2A (2000) Method
I
-_._-,
II
--_.-
III
---
IV
---
V
--_.-
.
VI
-----
Texas Offshore Port System, SPM #2 PLET
Block A-36, Galveston Area
I
I __
~_R_e_p_ort
__
NO_._O_20_1_-6_5_01____________________________________________________________P_LA
__
T_E_3_-2_8____
\
[~
!
I
I
.~
>.
'"
~
•
~
c
•
u
.U
~
>.
'"
~
•
2
~
~
""
Ultimate Axial Capacity, [kips]
o
o
...
200
400
600
800
..
1000
~
~
o
..:
o
20
40
'iij
60
Q)
en
Q)
~
[D
5
80
~
W
c
Q)
0..
100
120
140
~-.---
f----
-_._--
I
'----
---
1\-.-.. ---
II
1----
_._---
r-----
---
,
'\
III
,
~-.--
1"'"---
---.-
;------
_._---
\
.
\
..
IV
\
J-"-c---'\-
--
----
---
.. -
-----
--.-.-.-"
\
Note: Roman numerals refer to the stratigraphy as
described in the
text
and on the boring log.
\
-- 'Compression for piles
\
--
Tension for piles; or terision and compression
V
for caissons and conductors
.
\
\
f'--'-.- --"'
~-
----
-----
---
"
.
"
"~
"
~
VI
"~
"
~
.
'~
,-------
------
------
----
-"'-
~---
ULTIMATE AXIAL CAPACITY
API RP 2A (2000) Method
24-in_-Diameter Driven Pipe Piles
Texas Offshore Port System, SPM #2
PLET
Block A-36, Galveston Area
\
Report No_ 0201-6501
-~--------------------------------
PLATE 3-29
PENETRATION
BELOW
CURVE POINTS
MUDLINE
(feet)
1
2
3
4
5
6
0.0
t
0.00
0.00
0.00
0.00
0.00
0.00
z
0.00
0.04
0.07
0.14
0.19
0.24
1.0
t
0.00
0.02
0.03
0.04
0.05
0.06
z
0.00
0.04
0.07
0.14
0.19
0.24
3.0
t
0.00
0.02
0.04
0.06
0.07
0.07
z
0.00
0.04
0.07
0.14
0.19
0.24
5.0
t
0.00
0.03
0.05
0.07
0.09
0.10
z
0.00
0.04
0.07
0.14
0.19
0.24
5.0
t
0.00
0.07
0.11
0.17
0.20
0.23
z
0.00
0.04
0.07
0.14
0.19
0.24
9.5
t
0.00
0.08
0.14
0.21
0.25
0.28
z
0.00
0.04
0.07
0.14
0.19
0.24
9.5
t
0.00
0.11
0.11
z
0.00
0.10
24.00
26.0
t
0.00
0.31
0.31
z
0.00
0.10
24.00
26.0
t
0.00
0.16
0.26
0.39
0.47
0.52
z
0.00
0.04
0.07
0.14
0.19
0.24
32.0
t
0.00
0.18
0.30
0.45
0.54
0.60
z
0.00
0.04
0.07
0.14
0.19
0.24
42.0
t
0.00
0.22
0.36
0.54
0.65
0.72
z
0.00
0.04
0.07
0.14
0.19
0.24
42.0
t
0.00
0.51
0.51
z
0.00
0.10
24.00
65.0
t
0.00
0.79
0.79
z
0.00
0.10
24.00
65.0.
t
0.00
0.32
0.54
0.80
0.96
1.07
z
0.00
0.04
0.07
0.14
0.19
0.24
120.0
t
0.00
0.51
0.85
1.28
1.54
1.71
z
0.00
0.04
0.07
0.14
0.19
0.24
131.0
t
0.00
0.55
0.92
1.38
1.65
1.84
z
0.00
0.04
0.07
0.14
0.19
0.24
I
NOles: 1. "t" is mobilized soilwpile adhesion, [ksf].
2. liZ"
is
axial pile displacement, [in.].
3. Data for tension and compression coincide.
[_@
Report No. 0201-6501
AXIAL LOAD TRANSFER DATA
(T-Z DATA)
API RP
2A (2000) Method
24-in.-Diameter Driven Pipe Piles
Texas Offshore Port System, SPM #2 PLET
Block A-36, Galveston Area
7
8
0.00
0.00
0.48
24.00
0.05
0.05
0.48
24.00
0.07
0.07
0.48
24.00
0.09
0.09
0.48
24.00
0.20
0.20
0.48
24.00
0.25
0.25
0.48
24.00
0.47
0.47
0.48
24.00
0.54
0.54
0.48
24.00
0.65
0.65
0.48
24.00
0.96
0.96
0.48
24.00
1.54
1.54
0.48
24.00
1.65
1.65
0.48
24.00
PLATE 3-30
11>0
--!?
1$9
~
~
I~
I
I
I~~
1
1
PENETRATION
BELOW
CURVE POINTS
MUDLINE
(feet)
1
2
3
4
5
65.0
Q
0
7
15
22
27
z
0.00
0.05
0.31
1.01
1.75
71.0
Q
0
9
19
28
33
z
0.00
.0.05
0.31
1.01
1.75
131.0
Q
0
14
28
41
50
z
0.00
0.05
0.31
1.01
1.75
Notes: 1. "Q" is mobilized end bearing capacity, [kips].
2. "z" is axial tip displacement, [in.].
Report No. 0201-6501
AXIAL LOAD TRANSFER DATA
(Q-Z DATA)
API
RP
2A (2000) Method
24-in.-Diameter Driven Pipe Piles
Texas Offshore Port System, SPM #2
PLET
Block A-36, Galveston Area
6
7
30
30
2.40
24.00
37
37
2.40
24.00
55
55
2.40
24.00
PLATE 3-31
-@----------------------
I
I
'<Xl
~
0.-
~
:ri
0
~
&;-
0
~
seafloor~
Very soft lean clay
Firm lean clay
t
Loose to medium dense silt
with sand to sandy silt
t
Firm lean clay
,
Medium dense to dense silt
interlayered with firm
to stiff lean clay
Stiff to very stiff clay
r
Penetration
0
5'
9.5'
26'
42'
65'
"50
= 2.0
%
"50
= 2.0
%
k=10pci
"50
= 2.0
%
k=10pci
"50
= 1.5 % at 65'
decreasing linearly to
1>50
= 1.0 % at 100'
100' -
-
-
-
-
-
-
-
-
Report No.
0201~6501
Notes:
1.
6
50
is axial strain at half of peak deviator stress for cohesive soils.
2. Soil strength parameters are shown on Plate 3-25.
3. Submerged unit weight profile is shown on Plate 3-26.
4. k is the modulus
of horizontal subgrade reaction for granular soils.
STRATIGRAPHY AND PARAMETERS FOR
p.y
DATA
Texas Offshore Port System, SPM #2 PLET
Block A-36, Galveston Area
PLATE 3-32
I_@______________________
j;
I'!
i;'
c
I
I~
~
0
fi
r~
I
i;'
~
~
0
~
~
on
;;
~
.
.
PENETRATION
BELOW
CURVE POINTS
MUDLINE
(feet)
1
2
3
4
5
6
..
0.0
P
0
11
17
26
38
54
y
0.00
0.03
0.12
0.36
1.20
3.60
2.0
P
0
16
24
35
52
75
Y
0.00
0.03
0.12
0.36
1.20
3.60
5.0
P
0
22
34
50
74
107
Y
0.00
0.03
0.12
0.36
1.20
3.60
.
5.0
P
0
65
99
147
216
311
Y
0.00
0.03
0.12
0.36
1.20
3.60
7.0
P
0
76
117
173
255
367
Y
0.00
0.03
0.12
0.36
1.20
3.60
9.5
P
0
92
140
208
305
440
Y
0.00
0.03
0.12
0.36
1.20
3.60
9.5
P
0
114
190
251
316
361
Y
0.00
0.10
0.18
0.26
0.40
0.61
12.0
P
0
175
292
386
485
556
Y
0.00
0.13
0.22
.
0.32
0.48
0.74
15.0
P
0
266
443
584
735
841
Y
0.00
0.15
0.27
0.39
0.58
0.90
19.0
P
0
408
680
897
1128
1291
Y
0.00
0.18
0.33
0.47
0.7.1
1.09
26.0
P
0
568
946
1249
1570
1797
Y
0.00
0.19
0.33
0.48
0.72
1.11
26.0
P
0
169
259
383
563
810
Y
0.00
0.03
0.12
0.36
1.20
3.60
42.0
P
0
198
304
449
660
950
Y
0.00
0.03
0.12
0.36
1.20
3.60
42.0
P
0
914
1523
2011
2528
2894
Y
0.00
0.19
0.33
0.48
0.72
1.11
65.0
P
0
1421
2369
3127
3932
4501
Y
0.00
0.19
0.33
0.48
0.72
1.11
65.0
P
0
281
431
637
937
1350
Y
0.00
0.02
0.09
0.27
0.90
2.70
100.0
P
0
365
559
827
1216
1751
(and below)
y
0.00
0.02
0.06
0.18
0.60
1.80
Notes: 1. lip" is soil resistance, [Ib/in.].
2. "y" ;s lateral deflection, [in.].
P-YDATA
(CYCLIC LOADING)
API RP
2A (2000) Method
24-in.-Diameter Driven Pipe Piles
Texas Offshore Port System, SPM #2 PLET
Block A-36, Galveston Area
iii
7
8
0
0
18.00
24.00
15
15
18.00
24.00
52
52
18.00
24.00
88
88
18.00
24.00
146
146
18.00
24.00
235
235
18.00
24.00
376
380
0.88
24.00
579
585
1.07
24,00
877
885
1.30
24.00
1345
1359
1.58
24.00
1873
1892
1.60
.
24.00
810
24.00
950
24.00
3016
3046
1.60
24.00
4690
4738
1.61
24.00
1350
24.00
1751
24.00
PLATE 3-33
I
Report No. 0201-6501
'-@-----------
~
-,
~
-.-
S
J
¥-
I
~
I
~
I
J
~
I
\
Date
June
28
,
2008
Time
From
To
Descri[!tion
of Activities
"'*"'*
0030
Arrive
in Block A-36
,
Galveston Area, SPM #2
PLET location onboard the
RN Seaprobe.
0030
0115
Set 4-point anchors.
0115
0145
Rig up to drill and sample.
***.
0145
Estimate water depth of 108 ft using echo sounder
and 110ft
us
ing
wireline technique.
0145
0155
Perform scanning sonar survey.
0155
0250
Run drill
pipe
to mud
line.
****
0250
Measure water depth
of 112 ft
using
pipe
tally/bottom sensor and 110.0 ft using pressure
transducer.
0250
0950
Drill and sample. Bo
r
ing terminated
at
131-ft
penetration
.
0950
1030
Pull pipe above mud line and
repositio
n
vessel.
*.*.
1030
Measure supp
l
emental water depth
of
112 ft
using
bottom sensor/pipe tally and 110.0 ft using
pressure
transducer
.
1030
1055
Resample to 5-ft penetration
.
1055
1120
Pull drill p
i
pe to deck and secure equipment for
travel.
1120
1140
Pull
ancho
r
s.
****
1130
Conduct pre-shift safety meeting.
1140
1200
Wait
on weather. (Seas: 5-7/8 Winds:
40
mph)
.
1200
1240
Pull anchors
.
1240
."'..
Depart
location
.
SUMMARY OF FIELD OPERATIONS
Texas Offshore Port System, SPM
#2
PLET
Block A-36, Galveston Area
PLATEA-3
I
Report No
.
0201-6501
-
@
--------------------------------
@
(,'
15
"
z
?
o
~
"
in
'"
~
"U
S
m
~
~
C
h
ecked
B
y:
~b
Aooroved
..
B
.
Summary of Test Results
Date
:
qrZ(O~
Date
:
4d;';
r
,
-,
Drawn
B
y:-rt.",.f
Date
:
'r/~/o"is
Job No.:
0201
.6
501.3
02.Sep.2008 (Ver
.
#4)
B
oring:
Te
xas
Offshore
Port System,
SPM
#2
PL
ET
Block
:
A.
36
Area:
Gal
vest
on
Identification Tests
Strength Estimate
Miniature Vane Tests
Comp
r
ession
T
ests
Puslnll
(ksl)
(ksl)
L.i'luid
Plastic:
Mo
is
ture
Submerged
No. 200
M
oist
ure
.
C
o
nfining
Undisturbed
Remolded
6~
Submerged
F
"il
ul'fl
Simp18
D
epth
LiquIdity
Limit
Ll
mil
Con
ten
t
Unitw.rghl
S
i
evl!
Typ
o
Content
Pressure
Strength
Strength
51111
i
n
\JnitWe
l
gM
Strain
Type
of
"0.
("
Indax
("
(
%
)
(.,
(pdJ
(%'
P
e
netrometer
Torv
a
ne
Undisturbed
Remolded
Res
i
d
u
al
Tul
(%
'
(p$i)
(k$f)
(k
sf)
('h)
"OJ
(
.,
Failure
1
1.00
46
2
1
.50
50
0
.
09
0
.
08
3
2
.00
.
64
46
14
35
3
2.00
39
0
.
09
3
2.00
40
0
.
18
2
01
3.50
37
50
0.
1
6
202
4
.00
0
.
16
0
.
06
2
0
3
4.5
0
0
.
36
203
4
.
50
UU
12
1
1.01
8.9
59
22
AB
204
5.00
.
53
39
14
27
0.75
1
.
02
4
7.00
28
52
25
5
7
.
50
40
48
6
8
.00
1
.
13
38
13
42
0.37
7
11
.00
27
54
60
8
14
.
0
0
30
55
54
9
17
.
00
26
55
67
10
20,00
29
55
75
11
23.00
31
58
79
12
27.00
0
.
68
13
27
.50
0
.
20
13
27.50
UU
32
40
0
.5
8
1.2
54
8
A
1
4
28
.00
.
85
34
18
31
0
.
80
0
.
97
N
O
TE
S
:
TYP
E
OF TEST
TYPE
OF
FAI
L
URE
Plus Signs [+
]
denote
tests wh
ic
h e
xceed
ed the
U
-
Unconfined Compression
A
-
Bulge
capacity
of
the measuring device
.
UU- Unconsolidated-Un
dr
aine
d
T
ri
axia
l
B
- Single Shear Plane
CU
-
Consolidated-Undrained
T
riaxial
C
- Multiple Shear P
l
ane
NP
=
Non Plastic Material
0- Vertical Fracture
.
_.
@
"C
1:'
o
"
z
?
o
N
"
~
~
m
CT
~
Checke
d B
y:
,..{ B
-
-
Summ
a
ry of T
es
t R
es
ult
s
Date:'ir,,(,
<:Pc.
,,
~/
-
-,-
D
rawn By:"1I
"'/h'/
Date:
9U
(o
't
J
o
b
N
o
.:
020
1
-650
1
-3
02-Sep-2008
(V
e
r
.
#4)
B
oring: Te
x
as Offshore P
o
rt S
y
stem, SPM #2 P
LE
T
B
lo
c
k: A-36
Ar
ea:
Gal
v
eston
I
dent
i
fi
c
a
t
i
o
n Tests
S
treng
t
h Estimate
M
ini
at
u
re
V
a
n
e
T
ests
C
o
m
pression T
e
sts
Pas
s
i
n
ll
(ksl)
(ksl)
Uquld
Pl
as
tle:
Moist
u
f"C
Submuged
N
o. 200
Moisture
Con
fi
n
i
ng
Undisturbed
Remo
l
ded
6.
Submerg
e
d
FiI
,
l
ure
S
imp
l
e
Depth
Liq
u
idity
Limit
Limit
Content
Un
l
tWe
l
llht
Sieve
Type
Co
n
tent
PIlI"U"
Strength
Str
e
ngt
h
SI",l
n
Unit W
e
ight
Stra
,
n
Typ
e
of
No
.
(ft
)
Ind
u
")
'
%)
'%)
(
pet)
'%I
Pin
e
ir
o
rntttir
T
orvane
Undist
u
rbed
Rem
o
lded
R
ui
du
a.l
'
'''
'
%I
(pSi)
(ksf)
'''"
('10)
"
of)
'%I
F
il
ilure
15
32
.
0
0
0
.
88
1.
3
2
.
5
0
U
U
25
1
20
0
.
83
2
.
2
61
12
A
1.
3
2.
5
0
57
UU
25
1
20
0.30
59
1
7
33
.
00
33
0.78
0.59
17
33
.
0
0
1
.
04
28
1
6
29
18
37
.
0
0
0.92
19
3
7
.
50
0
.
15
1
9
37
.
50
U
U
37
61
0
.
76
2.2
51
1
3
A
2
0
38
.
0
0
.
96
50
16
48
0
.
72
1
.
16
21
42
.0
0
39
0
.
48
22
4
2.
5
0
27
52
68
23
44
.
50
26
60
4
5
,
2.
45
.
0
0
35
83
25
47
.
0
0
.
69
57
18
45
45
0
.
90
UU
45
6
1
0
.
90
1.4
45
6
A
2
5
4
7.00
0
.
25
2
.
48
.
0
0
3
0
50
86
2
7
51
.
50
5
1
28
51
.7
0
34
2
8
51
.7
0
2
.
61
26
23
30
2
9
57
.
0
0
.
72
49
17
4
0
1
.08
U
U
3
9
80
1
.
0
1
1
.8
49
8
A
29
5
7
.0
0
0
.
30
3
0
5
7.
50
52
0
.
72
N
OTES
:
TYP
E
OF
T
EST
TYP
E
O
F
FAILUR
E
Plus Sig
n
s
[
+] de
n
ote tests wh
i
ch ex
ce
eded
t
he
U
-
Un
confine
d
Co
m
pression
A -
B
ul
g
e
capacity of
t
he measuring device
.
UU
-
Un
co
n
soli
d
ated-Un
dr
aine
d Tr
iaxial
8
-
Si
ng
l
e S
h
ea
r Pl
ane
CU
-
Consolid
a
te
d
-Undrai
n
ed T
r
iaxial
C
-
Multiple Shea
r
P
l
ane
NP = Non Plastic Materia
l
0
-
Vertica
l
Fracture
,
@
JJ
ro
"
o
"
z
?
o
'"
~
0,
'"
~
§
m
o
~
Checked By:
~
~
Approved By: /'-
Summary of Test Results
Date:
?{~o'b
D
a
te
:
-;I'it{
Drawn
By:'1f·~
~
1
Date:'!r"I"
...
Jo
b
No.:
0201-6501:3
02-Sep
-
2008
(Ver
.
#4)
Boring: Texas Offshore Port
System
,
SPM
#2 PLET
Block:
A-36
Area:
Ga
l
veston
Ide
n
tification
T
ests
Strength
E
stima
t
e
Miniature
V
ane Tests
Compression Tests
Puslng
(ksf)
(ksf)
Uqu!d
Pluti.;
Moisture
Submergld
No. laO
Moistur
.
Confining
Undisturbed
Remolded
E.
Subme"ied
Failure
Simple
Depth
Liquidity
L
imit
Limit
Content
UnitWIlght
SilVIS
Type
CORtf!nl
Pressure
Strength
Strength
Stnlin
Un
i
t
Weight
Str.llin
Type of
N,
.
Inl
Index
1%1
1%)
1%1
1,<1)
1%)
Penetromller
Tornn,
UndIsturbed
Remolded
Reiidl.lal
T
..,
"M
(psi]
I""
1"0
I
%J
[pcf)
I%J
Filill
re
31
58
.0
0
1
.
39
31
20
36
31
58
.
00
33
32
63.00
31
55
76
33
67
.
00
0
.
60
34
67
.
50
49
3.
68
.
00
34
1.00
3.
S8
.
00
.71
34
16
29
36
70.00
45
37
70
.
50
0
.
80
UU
122
0
.
38
50
37
70
.
50
UU
36
100
1
.
50
0.8
47
6
B
38
71
.
00
38
1
.
02
0
.
91
39
80
.
00
1.50
1.40
40
8
0.
5
0
U
U
34
120
1
.
25
1.1
52
4
AB
40
80
.
50
38
48
UU
37
120
0.42
50
41
81
.
00
.42
57
18
34
1
.50
1.00
1
.
67
42
9
0.
0
0
1
.
50
1.32
43
90
.
50
UU
40
120
0
.
96
0.9
44
5
AB
43
90
.
50
0.33
UU
124
0.36
46
44
91
.
00
40
1
.
50
1.40
1
.
89
45
100
.
00
1.50
1.40
46
100
.
50
UU
36
120
0.64
50
46
100
.
50
41
46
UU
38
121
1
.
12
0.7
50
5
AC
N
O
T
ES
:
TY
PE
OF T
E
ST
TYPE OF
F
AILURE
Plus
Signs
[
+] denote
tests which
exceeded
the
U
- Unconfined Compression
A - Bulge
capacity of the measuring device.
UU- Unconsolidated-Undrained Triaxial
B
- Single Shear Plane
CU- Consolidated-Undrained Triaxial
C
-
Multiple Shear Plane
NP
=
No
n
Plastic Materia
l
D
- Vertical
Fracture
.
I
@
~
o
"
Z
~
:;J
~
m
'"
~
Ch
e
c
k
ed By
:
;(
~
Approved
By
:
~
Summary of Te
s
t Results
Identification Tests
Uquid
P
l
asllc
Moisture
Submerged
Samp
l
e
Oe
p
tli
L.lquldlty
Lim
it
Umlt
C
onl
e
nt
U
n
i
t
Weight
N•.
Iftl
In
de:.:
1%1
1%
)
I%)
I
,
,,,
47
101.00
.56
57
18
40
48
1
1
0
.
0
0
4
"
110
.
5
0
4"
1
1
0.
5
0
50
1
1
1
.00
43
5
1
120
.00
52
12
0
.
50
45
53
121
.
00
.
62
46
16
34
5
3
121
.00
46
5
4
130.00
55
130.5
0
5
5
130
.
50
56
131.00
31
Date~(:?lo~
Date
:
74.1:
St
r
ength
E
stimate
P
assing
(ksf)
No. 200
Sieve
1%)
Penetrom
l
t
e
r
Tarvin"
1
.
25
1
.
32
1.75
1
.
68
2
.
0
0
1
.
60
2
.
00
1
.75
1.50
1
.
75
1
.
50
1
.
55
1
.
50
12
5
_
Dr
aw
n
B
y
:
7r.:,,.,,
/
Date
:
q OJ'"
g
J
ob No.:
020
1
-S5
0
1
-3
02-Sep-2008
01
er. #4
)
Bori
n
g:
T
ex
a
s
Off
s
h
o
r
e
Port S
y
stem, SPM #2 PlET
Bl
ock:
A-
3
6
A
rea:
Ga
l
v
eston
Mi
n
iature
V
a
n
e Tests
(ksf)
Compression Tests
MOi
$t
ur
e
ConfinIng
Und
i
sturb
e
d
Remo
l
ded
E.
Submerged
f
a
llur
e
T".
Content
P
ressure
Stren
g
th
Strength
StIlIin
Un
it
Wei
g
ht
51.... ln
T
V
pc
of
Undisturbed
Remolded
Residua
l
TOM
I%)
(psI)
I""
I""
1%)
(
pe
f)
1%
)
fa
il
ure
1
.
66
UU
47
12
1
2
.
1
0
0
.
7
44
2
C
UU
120
0
.
59
47
1
.
79
2
.
17
UU
122
0.59
59
UU
27
122
2
.
14
0
.
8
55
4
C
0
.
98
-
'--
.
~
NO
T
E
S:
TYPE OF TEST
TYP
E
OF FAILURE
P
l
us Signs
[
+
]
denote tests which exceeded
t
he
-I
U
_ Unconfined Compression
A
_
Bu
lge
capacIty of the meas
u
ring device
.
~
UU
-
Unconsolida
t
ed-
Undr
aine
d Tr
iax
i
a
l
8 - Single Shear P
l
ane
~
cu
-
Conso
l
idated-Un
d
rained
T
riaxial
C - Multip
l
e Shea
r Pl
ane
D
- Vertica
l
Fract
u
re
NP = N
o
n Plastic Material
I
@
;lJ
~
"0
0
"
z
?
0
N
~
in
'"
~
S
"
In
'!:
I-
I
G
>-
~
In
G
z
«
iii
U)
a.
I-
z
L1J
0
'"
L1J
a.
100
90
80
70
60
50
40
3
0
20
10
o
100
3
Che
Cked
b
y:
,.(0
A
pp
rove
d b
y:
..Q04.-
u.s
.
STANDARD