1
EXECUTIVE SUMMARY
Fugro-McCleliand Marine Geosciences, Inc. (FMMG) performed geotechnical investigations for
proposed offshore structures across the Texas Offshore Port System (TOPS), located
in Block A-56, of the
Galveston Area
in the Gulf of Mexico. The primary purpose of the investigation was to obtain soil data to
develop foundation design recommendations for the Single Point Mooring (SPM) facility, designated
as
SPM #1 and SPM #2, of the proposed TOPS facility in Block A-56:
The field investigation was performed on June 30, July 2 and
3, 2008, from the RN
Seaprobe.
The
soil conditions were determined by performing a total
of four exploratory borings, with one boring at a
selected anchor leg location and one boring
at the proposed Pipe Line End Termination (PLET) location at
each
of the SPM locations. These borings were drilled to a penetration of 131-ft below mudline. The water
depths ranged from 117
to 121 ft at the soil boring locations across Block A-56. An exploratory boring was
also drilled at the Offshore Terminal location
in Block A-56 and is presented in FMMG's Report
No. 0201-6502.
Field and laboratory tests were conducted to determine the pertinent index
and engineering
properties of the soils encountered. Engineering analyses were then performed to develop the required
design information. For the purposes
of discussion and presentation, "driven pipe pile" is used in this report
to represent foundation piles, caissons and conductors, unless otherwise specified.
This report presents axial and lateral design data for 24-in.-diameter driven pipe piles
at the two
PLET locations and 42-in.-diameter driven pipe piles for the two anchor leg locations. This data was
developed using methods and recommendations presented
in API RP 2A (2000). Pile penetrations should
be based on allowable capacities with appropriate safety
or load resistance factors.
The ultimate seafloor bearing capacity for mud mat and tubular members bearing
on the seafloor at
the PLET locations were computed using general bearing capacity methods and recommendations
presented
in API RP 2A-WSD (2000). Seafloor bearing capacity equations are presented in the appropriate
sections
of the main text of this report to facilitate design of the PLET foundations, if required.
A review of the geotechnical data indicates that the soil stratigraphy
in the top 34-ft penetration is
variable across the block, alluding to channel features across the investigation area. The exploratory boring
revealed clay layers interbedded with silt, sandy silt, or silty fine sand layers of varying thickness within
approximately the upper 34-ft of sediments. The underlying soils to at least 131-ft penetration consists
of
firm to stiff lean clay to clay, with a shear strength profile that increases with depth. Soil variability is
demonstrated
in a comparison of the log of boring and test results presented in Section 3 with the
subbottom geophysical data at each
of the boring locations. The geophysical survey was performed by
Fugro Geoservices, Inc. (FGSI) of Lafayette,
LA and is presented in detail in FGSI Report No. 2407-1298.
The information revealed
in this investigation suggests that the piles can be driven with a properly
sized hammer to a sufficient depth
in the above stratigraphy to achieve the desired pile capacity.
Supplementary installation procedures,
if necessary, should be applied under close engineering supervision
to determine the impact of the procedures on pile capacity.
_@
Report No. 0201-6503
1-1
------------------_.---.
2
GENERAL PROJECT INFORMATION
2.1 INTRODUCTION
2.1.1
Purpose and
Scope
Fugro-McClelland Marine Geosciences, Inc. (FMMG) performed a geotechnical investigation
program to investigate soil conditions at the proposed Single Point Mooring (SPM) facility locations
in the
Texas Offshore Port System (TOPS), located
in Block A-56, of the Galveston Area in the Gulf of Mexico.
The primary purpose of the investigation was to obtain data to develop foundation design recommendations
for anchor leg and Pipe Line End Termination (PLET) locations at the facility sites designated
as SPM #1
and SPM #2. To accomplish this objective, the following tasks were performed:
(1) Four soil borings, with one boring at a selected anchor leg location and one boring
at the
proposed PLET location at each
of the SPM locations, were drilled to 131-ft penetration
below seafloor
to explore the subsurface stratigraphy and obtain soil samples for laboratory
testing;
(2) Field and laboratory tests were conducted to evaluate pertinent index and engineering
properties of the foundation materials;
(3) A comparison of the geotechnical and geophysical data was performed to investigate soil
variability
to help in selecting soil parameters; and
(4) Engineering analyses were performed
to develop pile design information, seafloor bearing
capacity, and a general pile installation assessment.
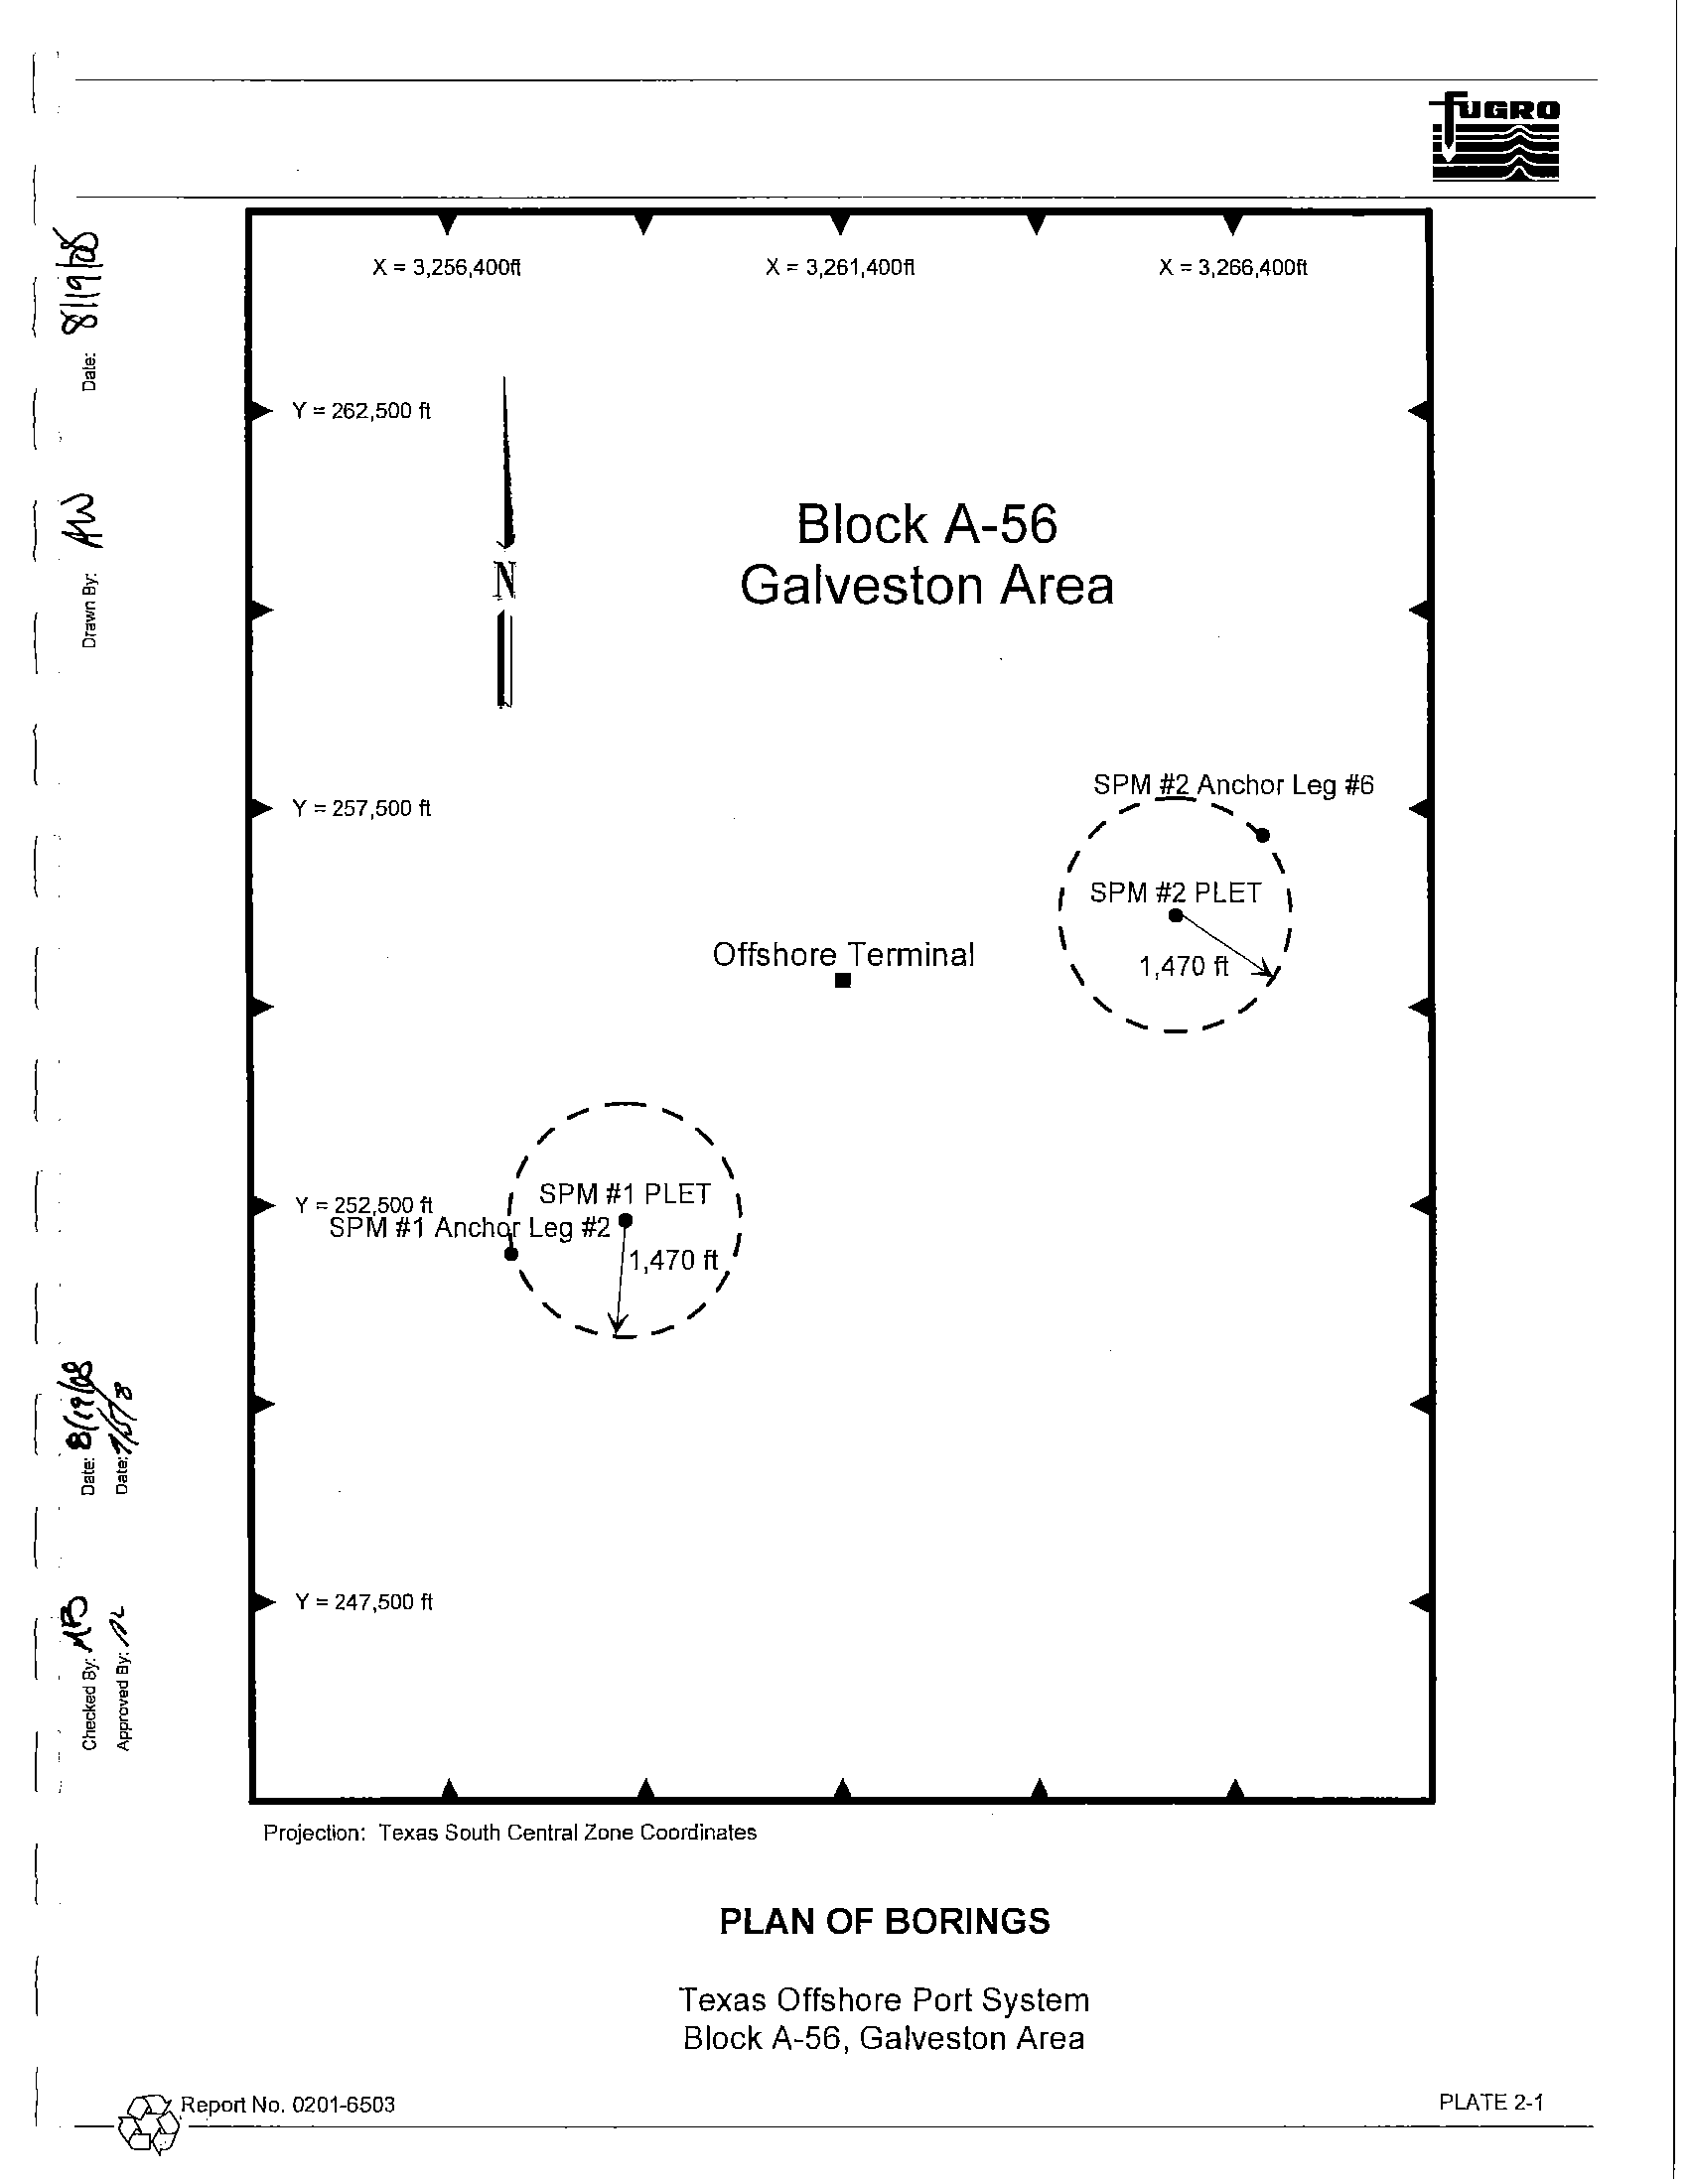
Enterprise Field Services, LLC specified the boring locations and designations. A plan
of borings
presenting the relative positions
of the four borings is presented on Plate 2-1.
2.1.2
Report Format
The results
of the geotechnical investigations completed for the TOPS campaign are presented in
the following reports:
0201-6500:
0201-6501:
0201-6502:
0201-6503:
0201-6504:
0201-6505:
Offshore Terminal Location, Block A-36, Galveston Area;
SPM
#1 and SPM #2 PLET and Anchor Leg locations, Block A-36, Galveston Area;
Offshore Terminal Location, Block A-56, Galveston Area;
SPM
#1 and SPM #2 PLET and Anchor Leg locations, Block A-56, Galveston Area
(this report);
Offshore Terminal Location, Block A-59, Galveston Area; and
SPM
#1 and SPM #2 PLET and Anchor Leg locations, Block A-59, Galveston Area.
The initial section
of this report contains brief descriptions of the field and laboratory phases of the
study, including a general description
of the soil stratigraphy and a summary of the findings of the
geophysical survey across Block A-56.
Also included
in this section is a general discussion of the
engineering methods, axial and lateral pile design, used at all the boring locations. Section 3 presents a
detailed description
of the site-specific conditions encountered at each boring location followed by brief
discussions of axial pile design, lateral pile analyses, seafloor bearing capacity, and pile installation
recommendations. Discussions
of the field and laboratory investigations are presented in Appendix A.
I
Report No. 0201-6503
2-1
-@---------------------------------
Appendix B contains discussions of analytical procedures used in our engineering analyses. Appendix C
contains a positioning report by Fugro Chance, Inc., of Lafayette, Louisiana.
For the purposes of discussion and presentation, "driven pipe pile" is used in this report to represent
foundation piles, caissons and conductors, unless otherwise specified.
2.2 FIELD AND LABORATORY INVESTIGATIONS
The field investigation was performed
on June 3D, July 2 and 3, 2008, from the RN
Seaprobe.
The
soil conditions were determined by performing four exploratory borings, two at each SPM location with one
boring at a selected anchor leg location, and one boring at the proposed PLET location. Enterprise Field
Services selected the boring locations. These borings were drilled
to a penetration of 131-ft below mudline.
The water depths
at the boring locations ranged from 117 to 121 ft. A chronological summary of field
operations
is presented in Appendix A.
2.2.1
Exploratory
Borings
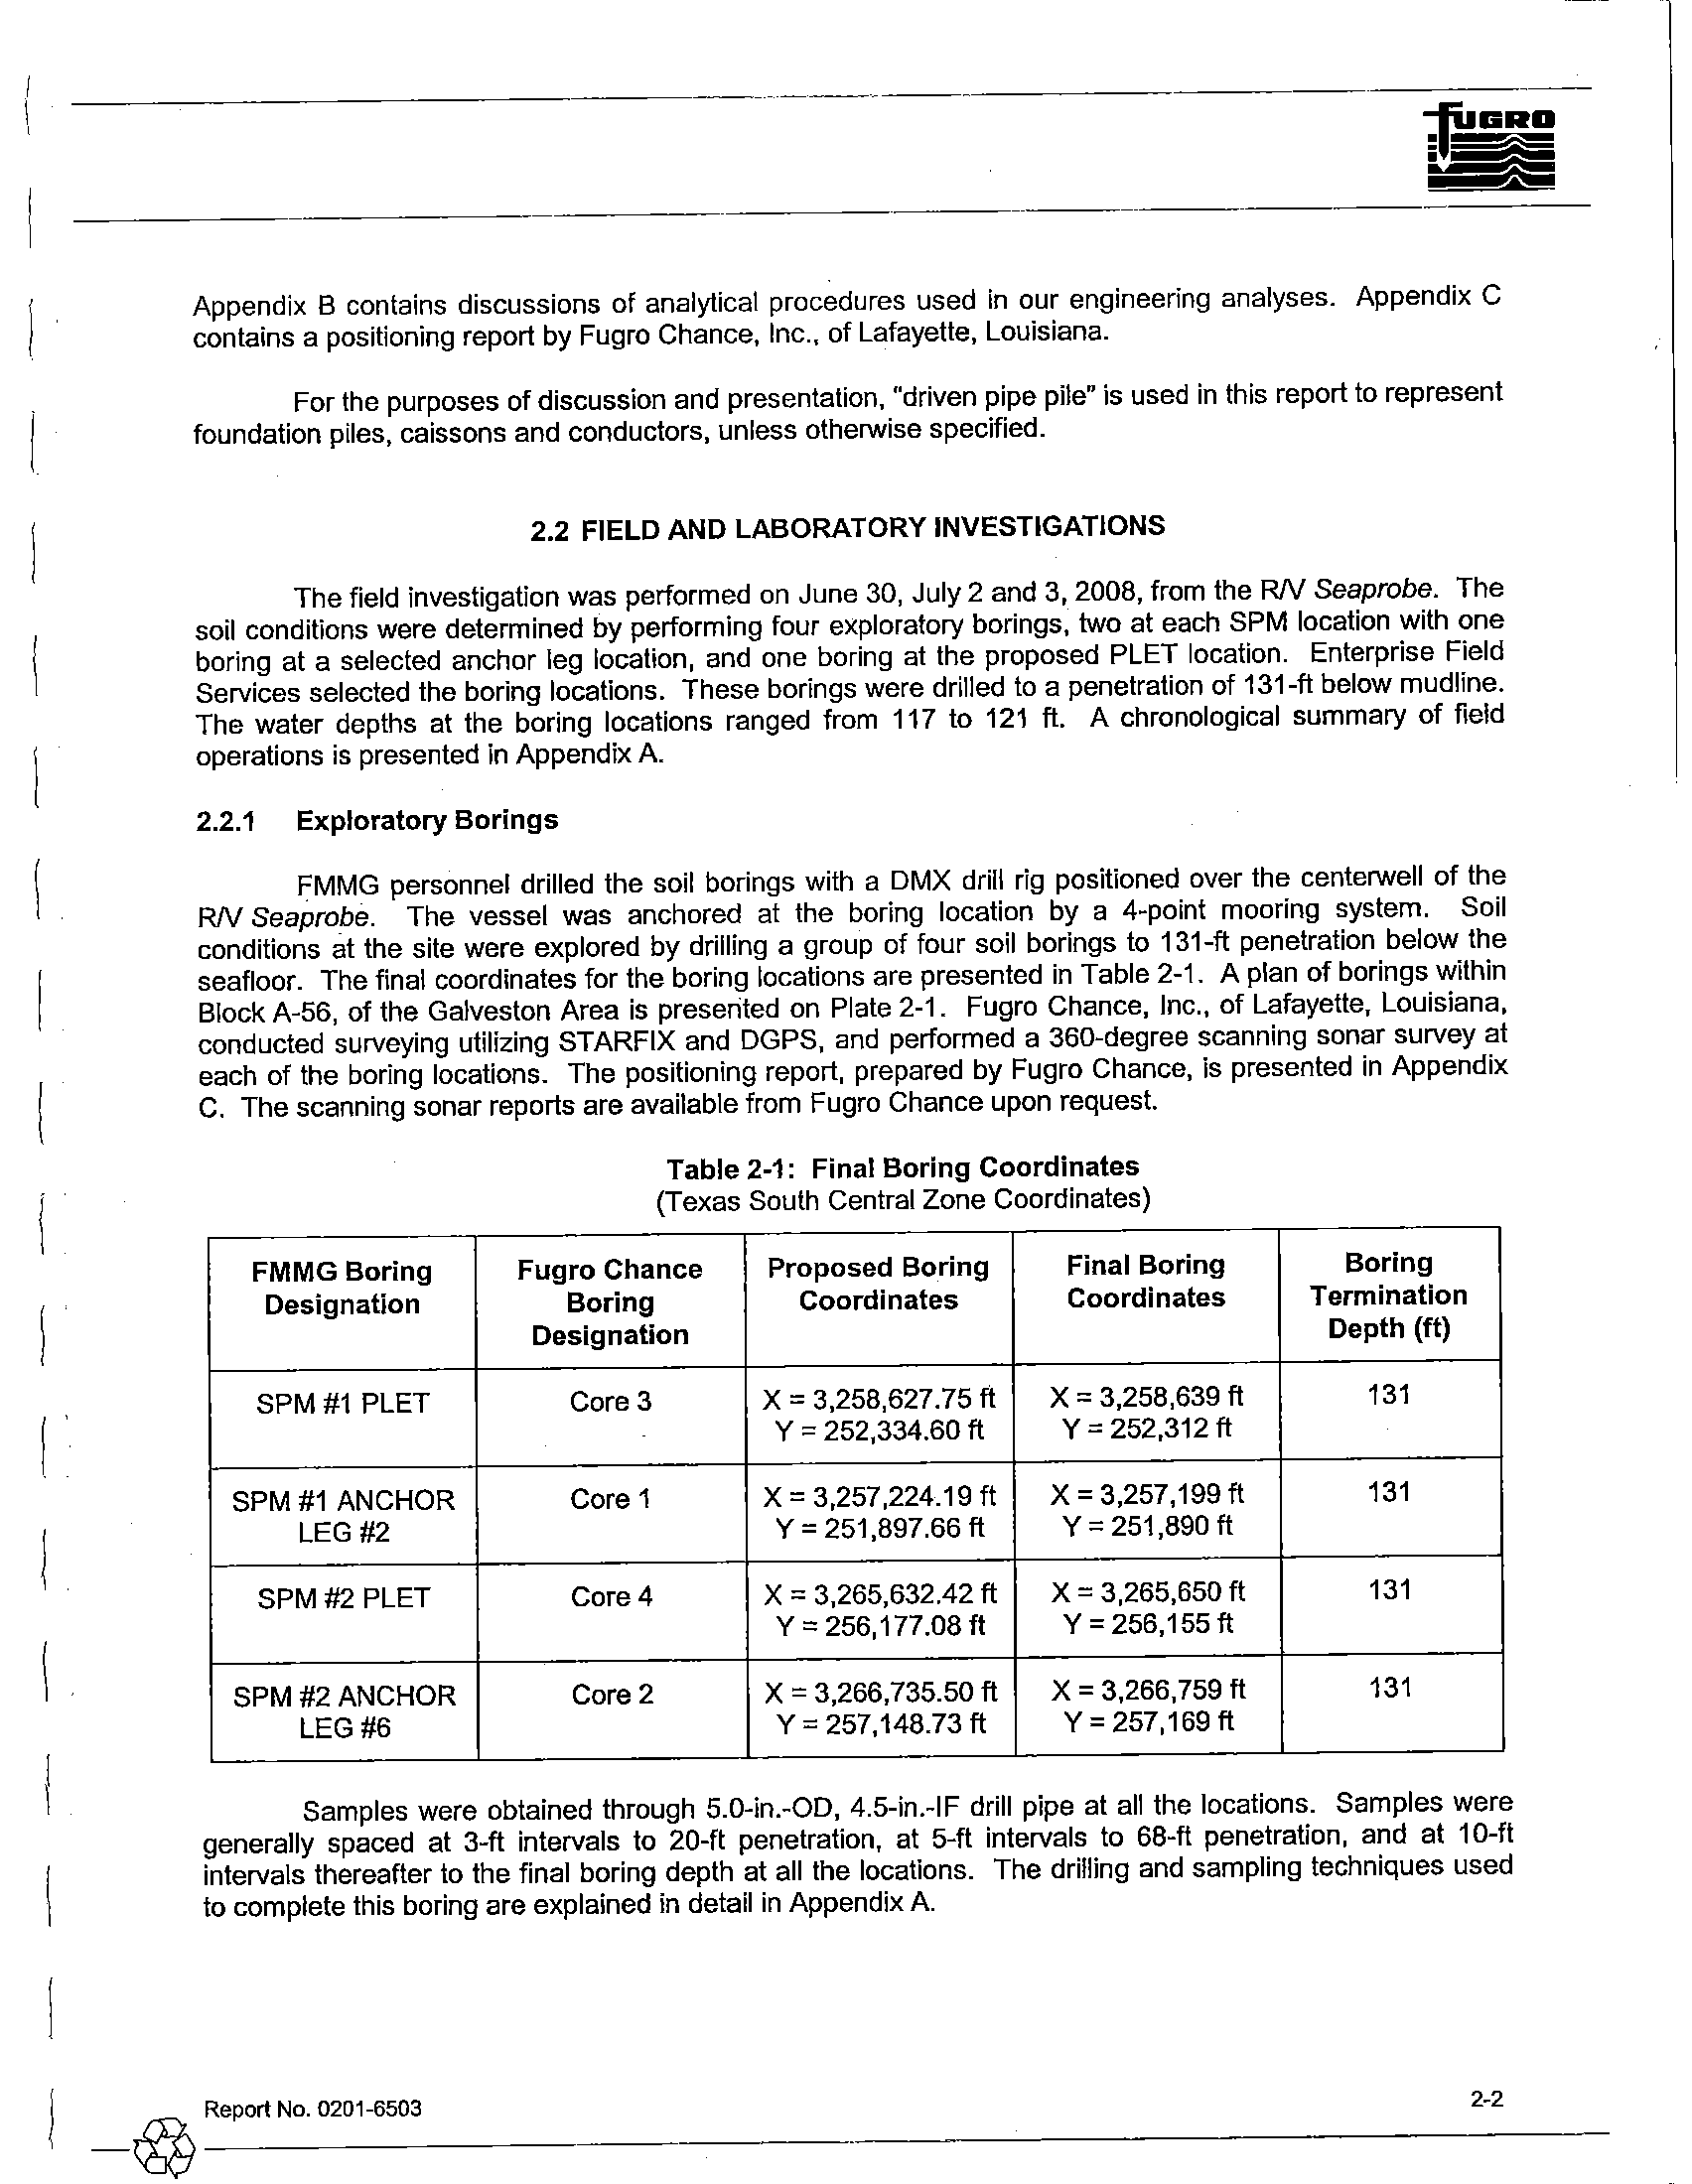
FMMG personnel drilled the soil borings with a DMX drill rig positioned over the centerwell of the
RN
Seaprobe.
The vessel was anchored at the boring location by a 4-point mooring system.
Soil
conditions at the site were explored by drilling a group of four soil borings to 131-ft penetration below the
seafloor. The final coordinates for the boring locations are presented in Table 2-1. A plan of borings within
Block A-56, of the Galveston Area
is presented on Plate 2-1. Fugro Chance, Inc., of Lafayette, Louisiana,
conducted surveying utilizing STARFIX and DGPS,
and performed a 360-degree scanning sonar survey at
each of the boring locations. The positioning report, prepared by Fugro Chance, is presented
in Appendix
C. The scanning sonar reports are available from Fugro Chance upon request.
FMMG
Boring
Designation
SPM#1 PLET
SPM
#1 ANCHOR
LEG #2
SPM#2 PLET
SPM #2 ANCHOR
LEG
#6
Table 2-1: Final Boring Coordinates
(Texas South Central Zone Coordinates)
Fugro Chance
Proposed Boring
Final Boring
Boring
Coordinates
Coordinates
Designation
Core 3
X
=
3,258,627.75 ft
X
=
3,258,639 ft
Y
=
252,334.60 ft
Y
=
252,312 ft
Core 1
X
=
3,257,224.19 ft
X
=
3,257,199 ft
Y
=
251,897.66 ft
Y
=
251,890 ft
Core 4
X
=
3,265,632.42 ft
X
=
3,265,650 ft
Y
=
256,177.08 ft
Y
=
256,155 ft
Core 2
X
=
3,266,735.50 ft
X
=
3,266,759 ft
Y
=
257,148.73 ft
Y
=
257,169 ft
Boring
Termination
Depth
(tt)
131
131
131
131
Samples were obtained through 5.0-in.-OD, 4.5-in.-IF drill pipe at all the locations. Samples were
generally spaced at 3-ft intervals to 20-ft penetration, at 5-ft intervals to 68-ft penetration, and at 10-ft
intervals thereafter to the final boring depth at all the locations. The drilling and sampling techniques used
to complete this boring are explained
in detail in Appendix A.
1
_@
Report No. 0201-6503
2-2
(
---.---------
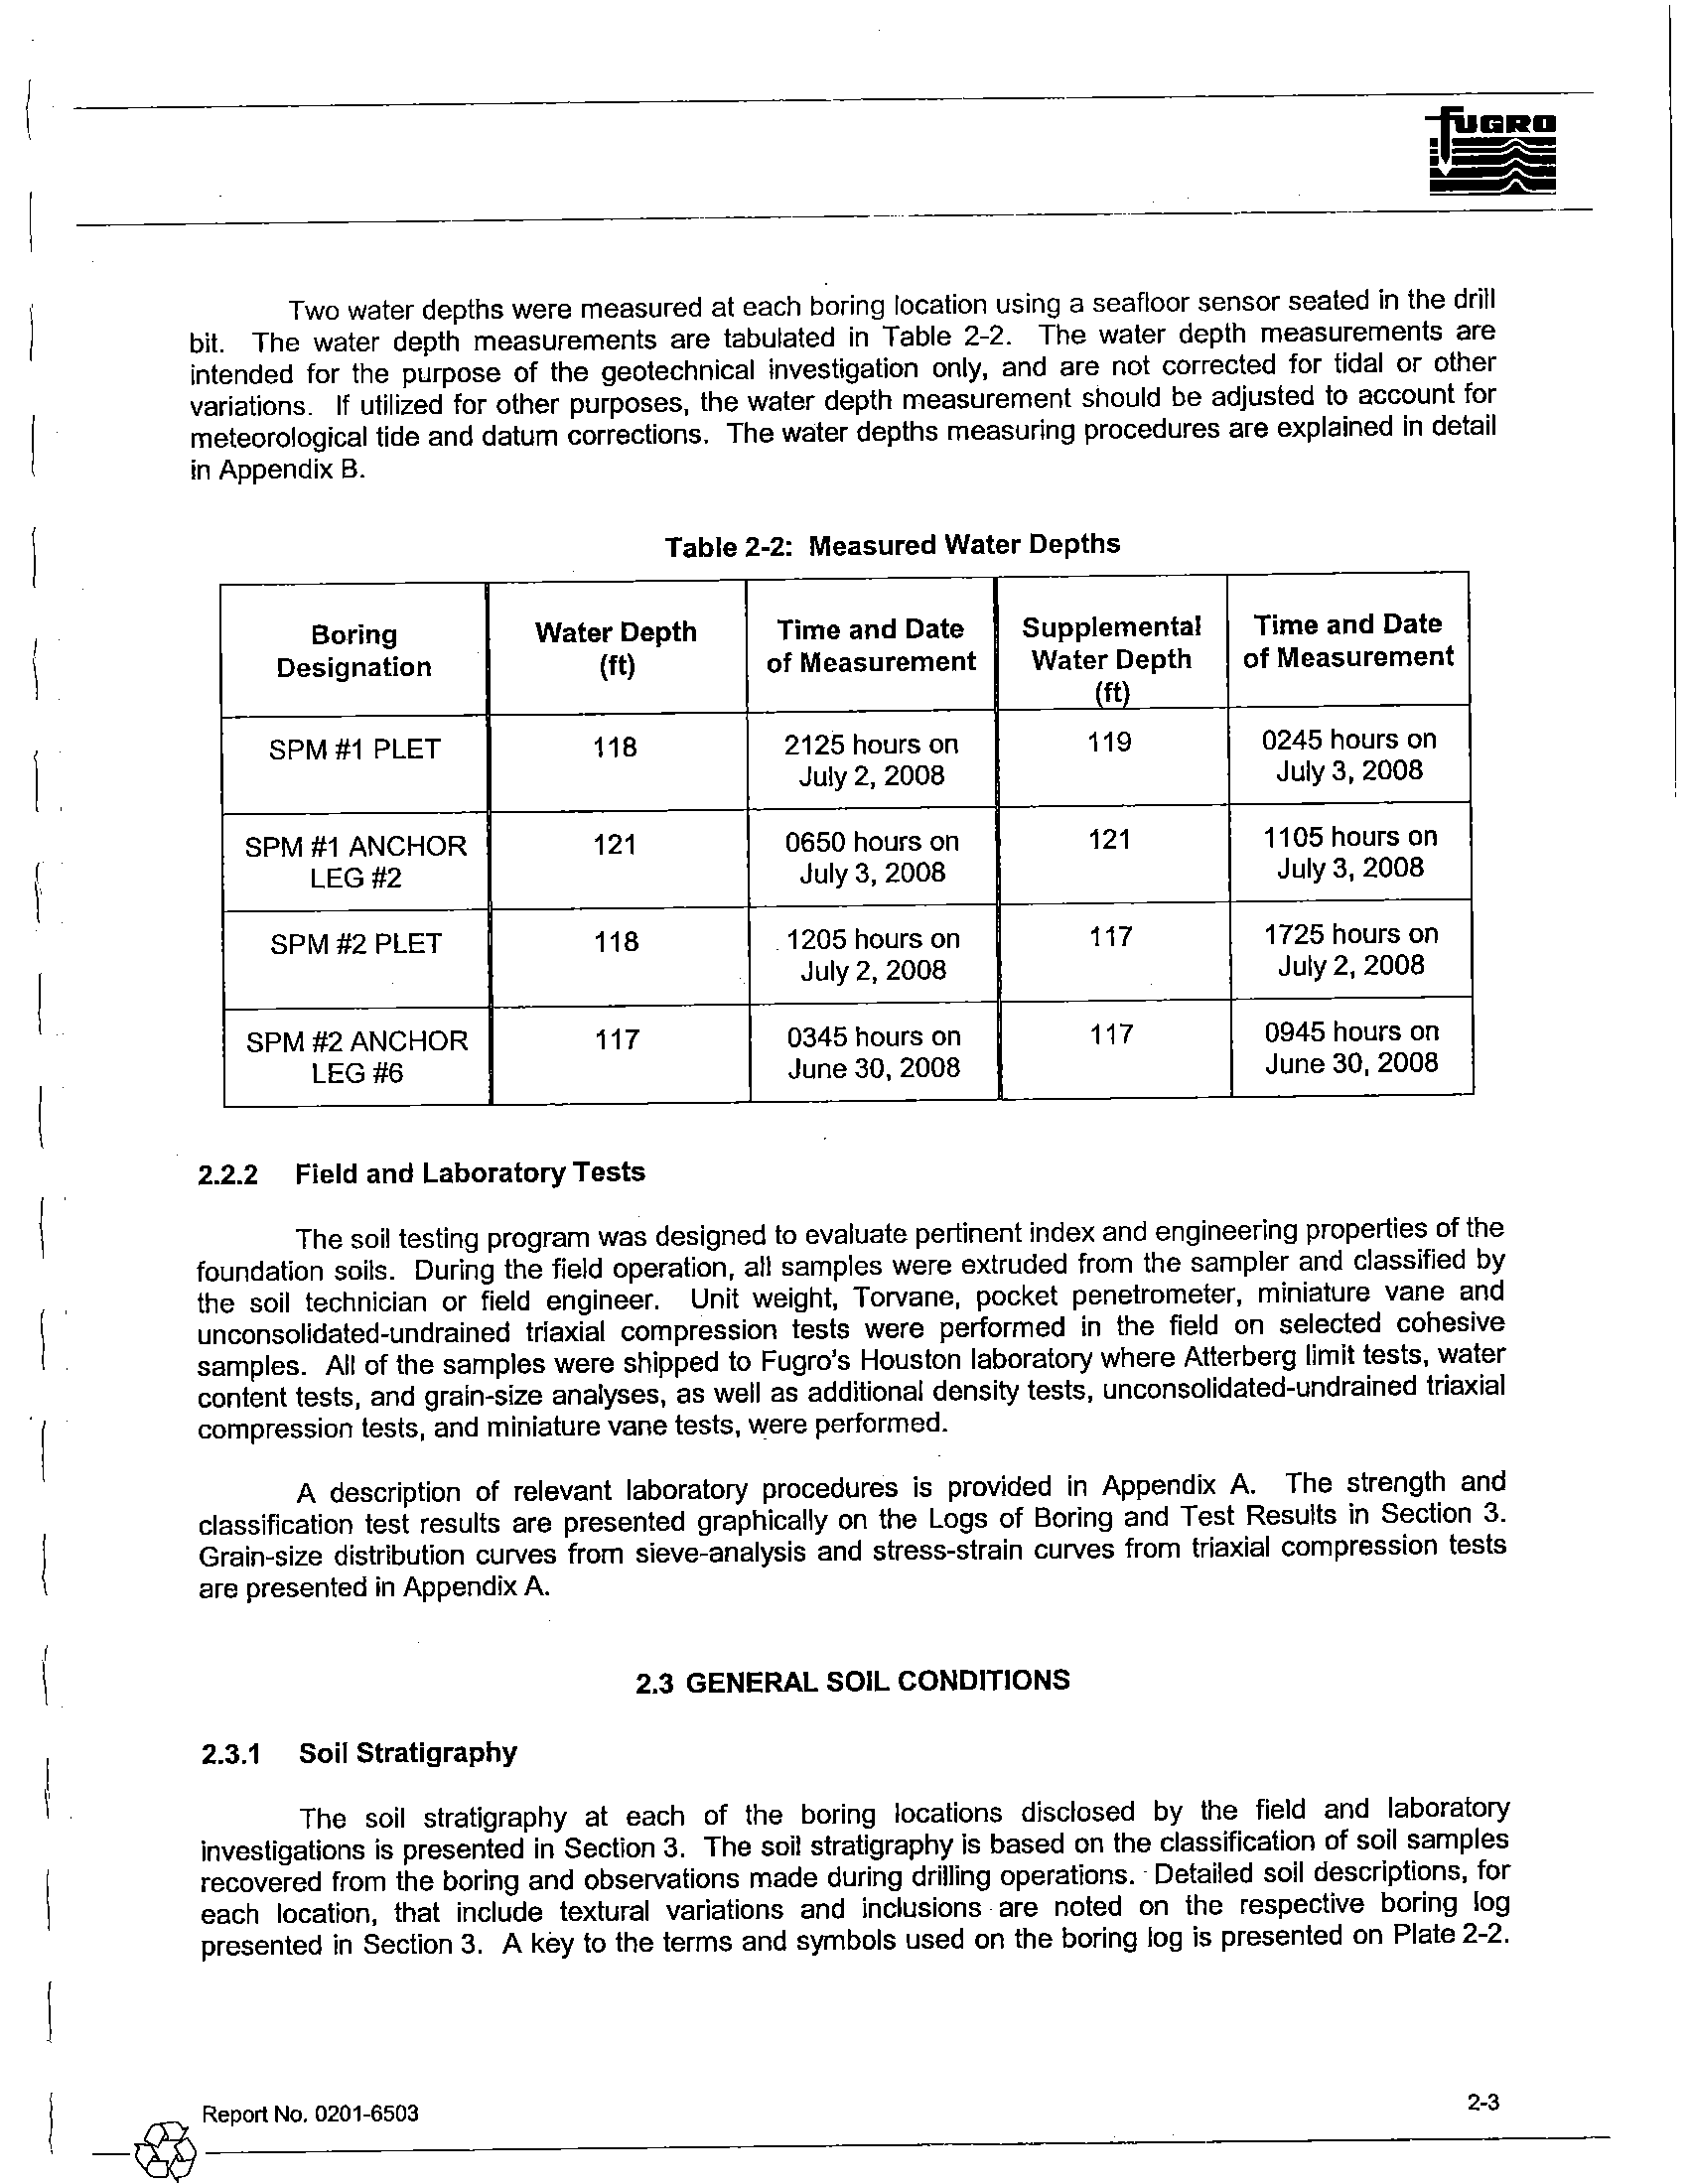
Two water depths were measured at each boring location using a seafloor sensor seated in the drill
bit. The water depth measurements are tabulated
in Table 2-2. The water depth measurements are
intended for the purpose
of the geotechnical investigation only, and are not corrected for tidal or other
variations.
If utilized for other purposes, the water depth measurement should be adjusted to account for
meteorological tide and datum corrections. The water depths measuring procedures are explained
in detail
in Appendix B.
Table 2-2: Measured Water Depths
Boring
Water Depth
Time and Date
Supplemental
Time and Date
Designation
(tt)
of Measurement
Water Depth
of Measurement
Jft)
SPM #1 PLET
118
2125 hours on
119
0245 hours on
July 2,2008
July 3,2008
SPM #1 ANCHOR
121
0650 hours on
121
1105 hours on
LEG #2
July 3,2008
July 3,2008
SPM#2 PLET
118
1205 hours on
117
1725 hours on
July
2,2008
July 2,2008
SPM #2 ANCHOR
117
0345 hours on
117
0945 hours
on
LEG #6
June 30, 2008
June
30, 2008
2.2.2
Field and
Laboratory Tests
The soil testing program was designed to evaluate pertinent index and engineering properties of the
foundation soils. During the field operation, all samples were extruded from the sampler and classified by
the soil technician or field engineer.
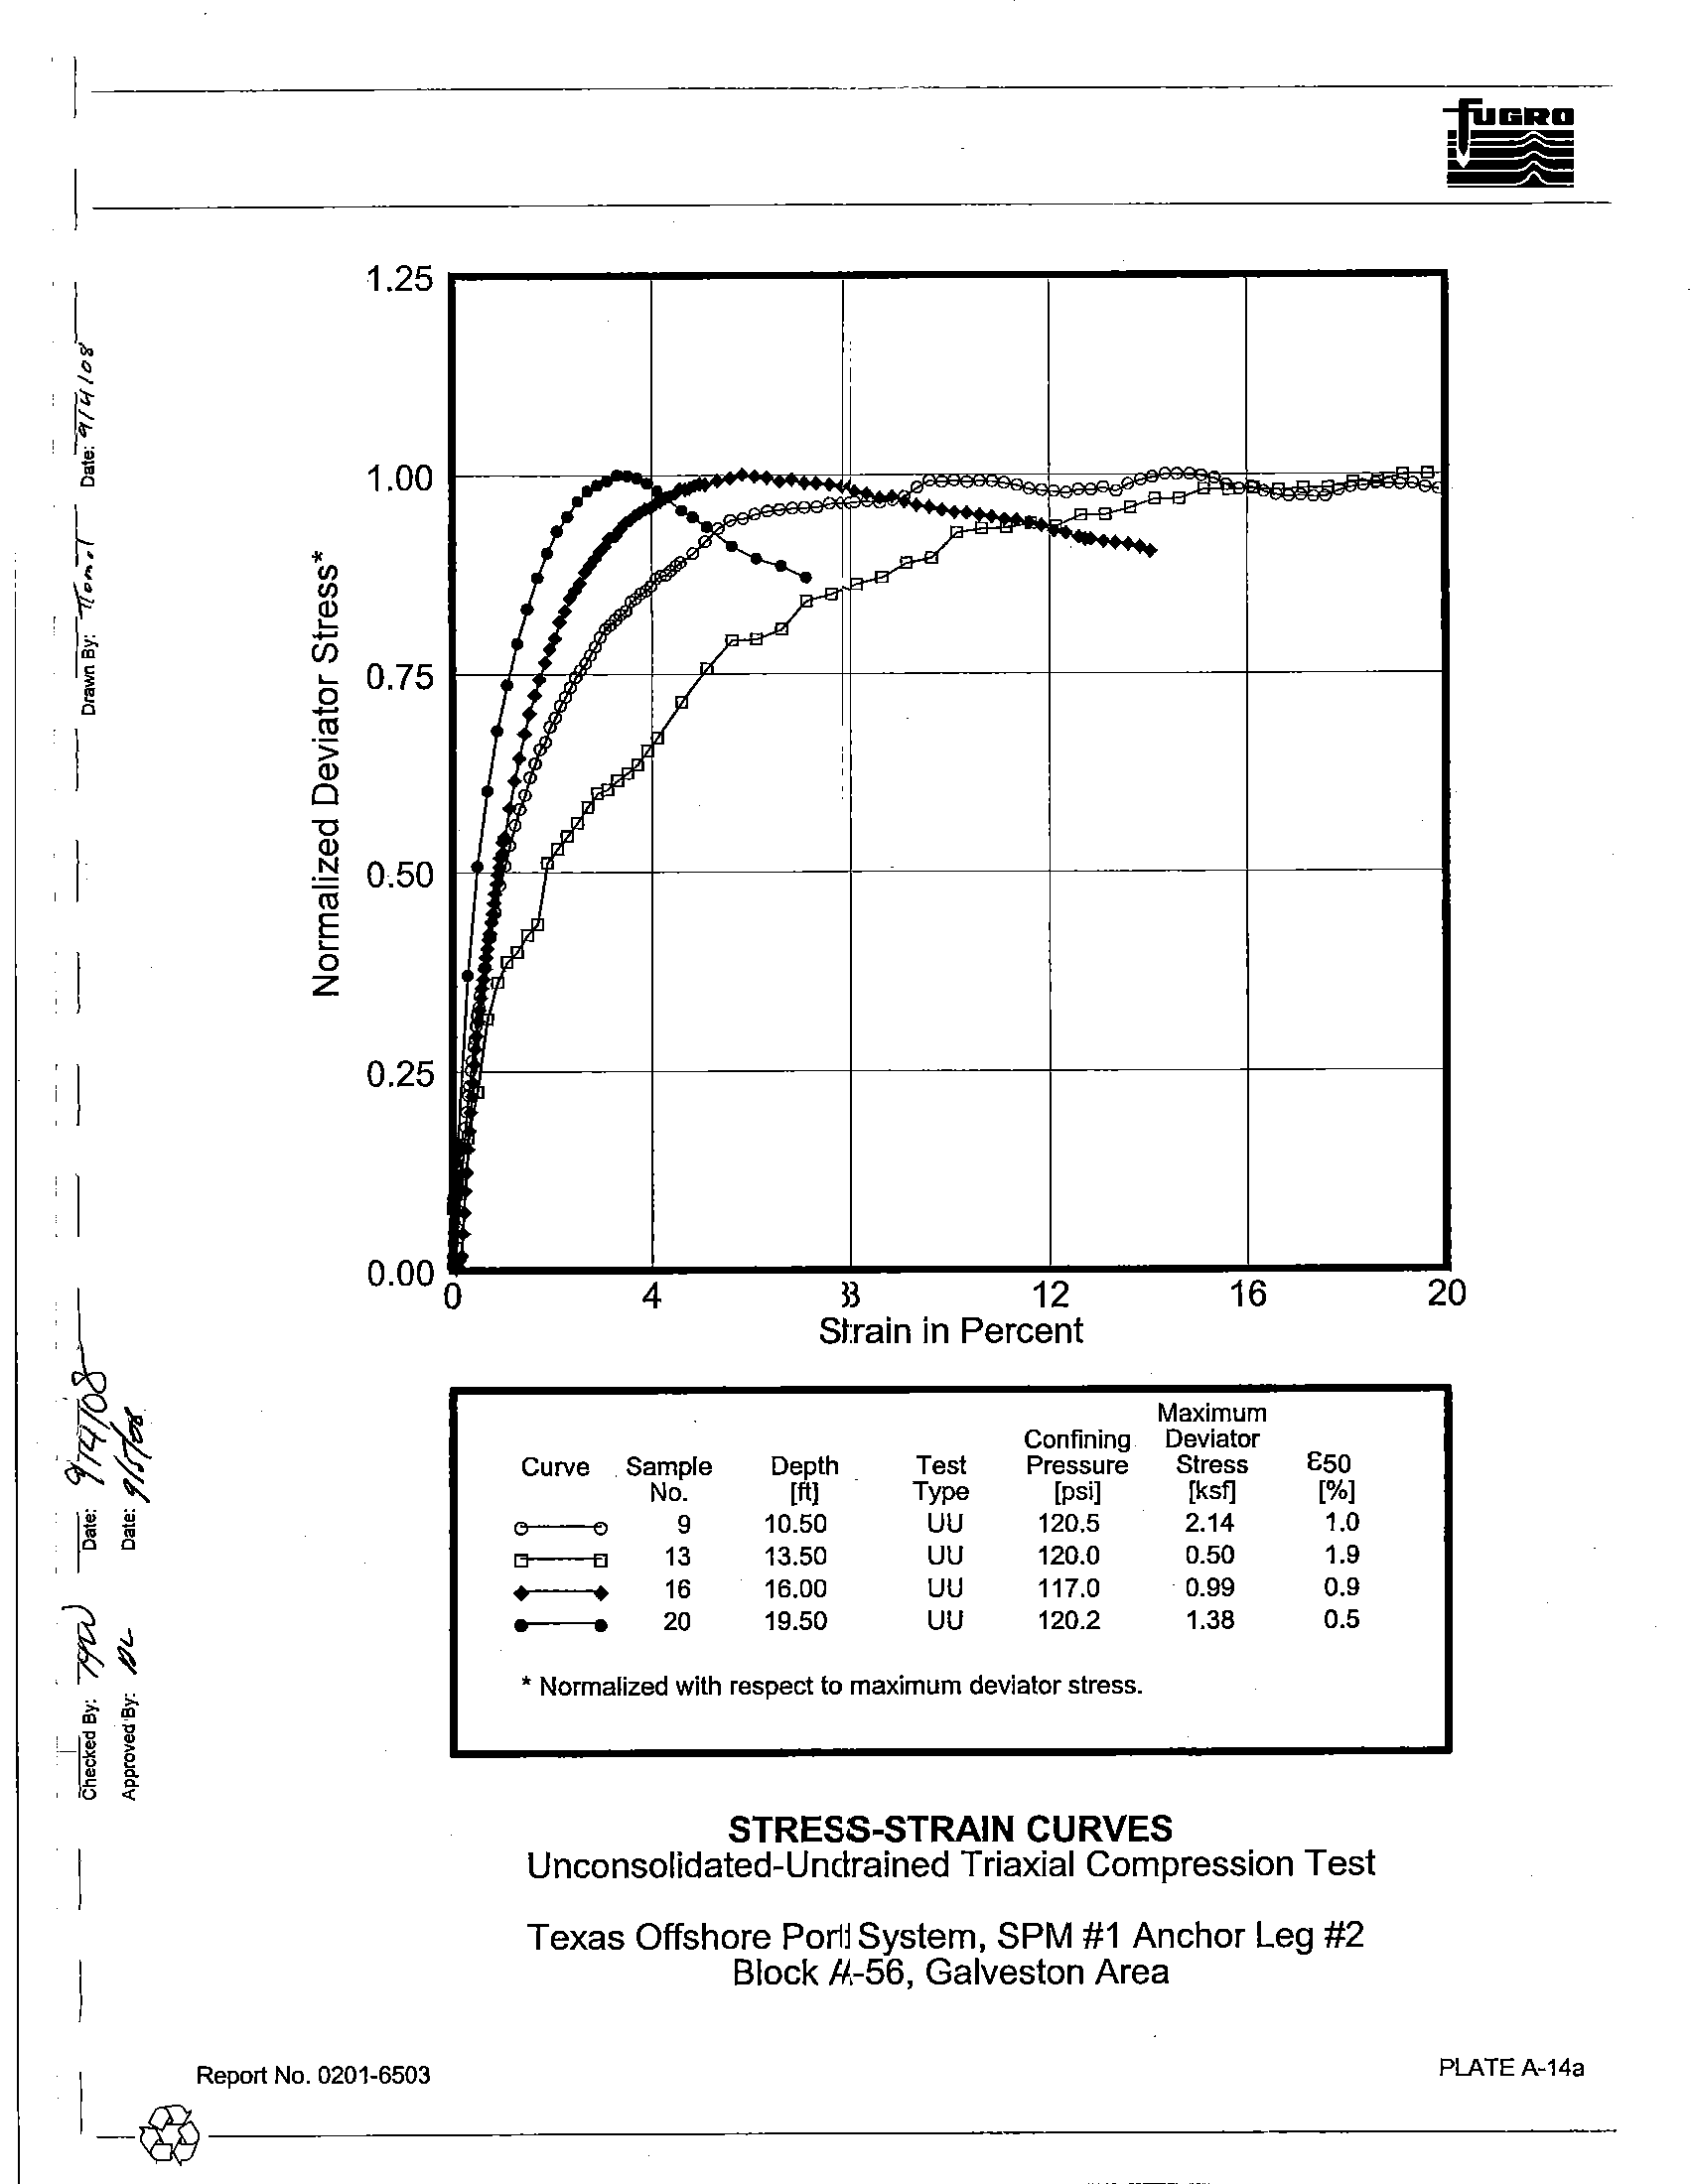
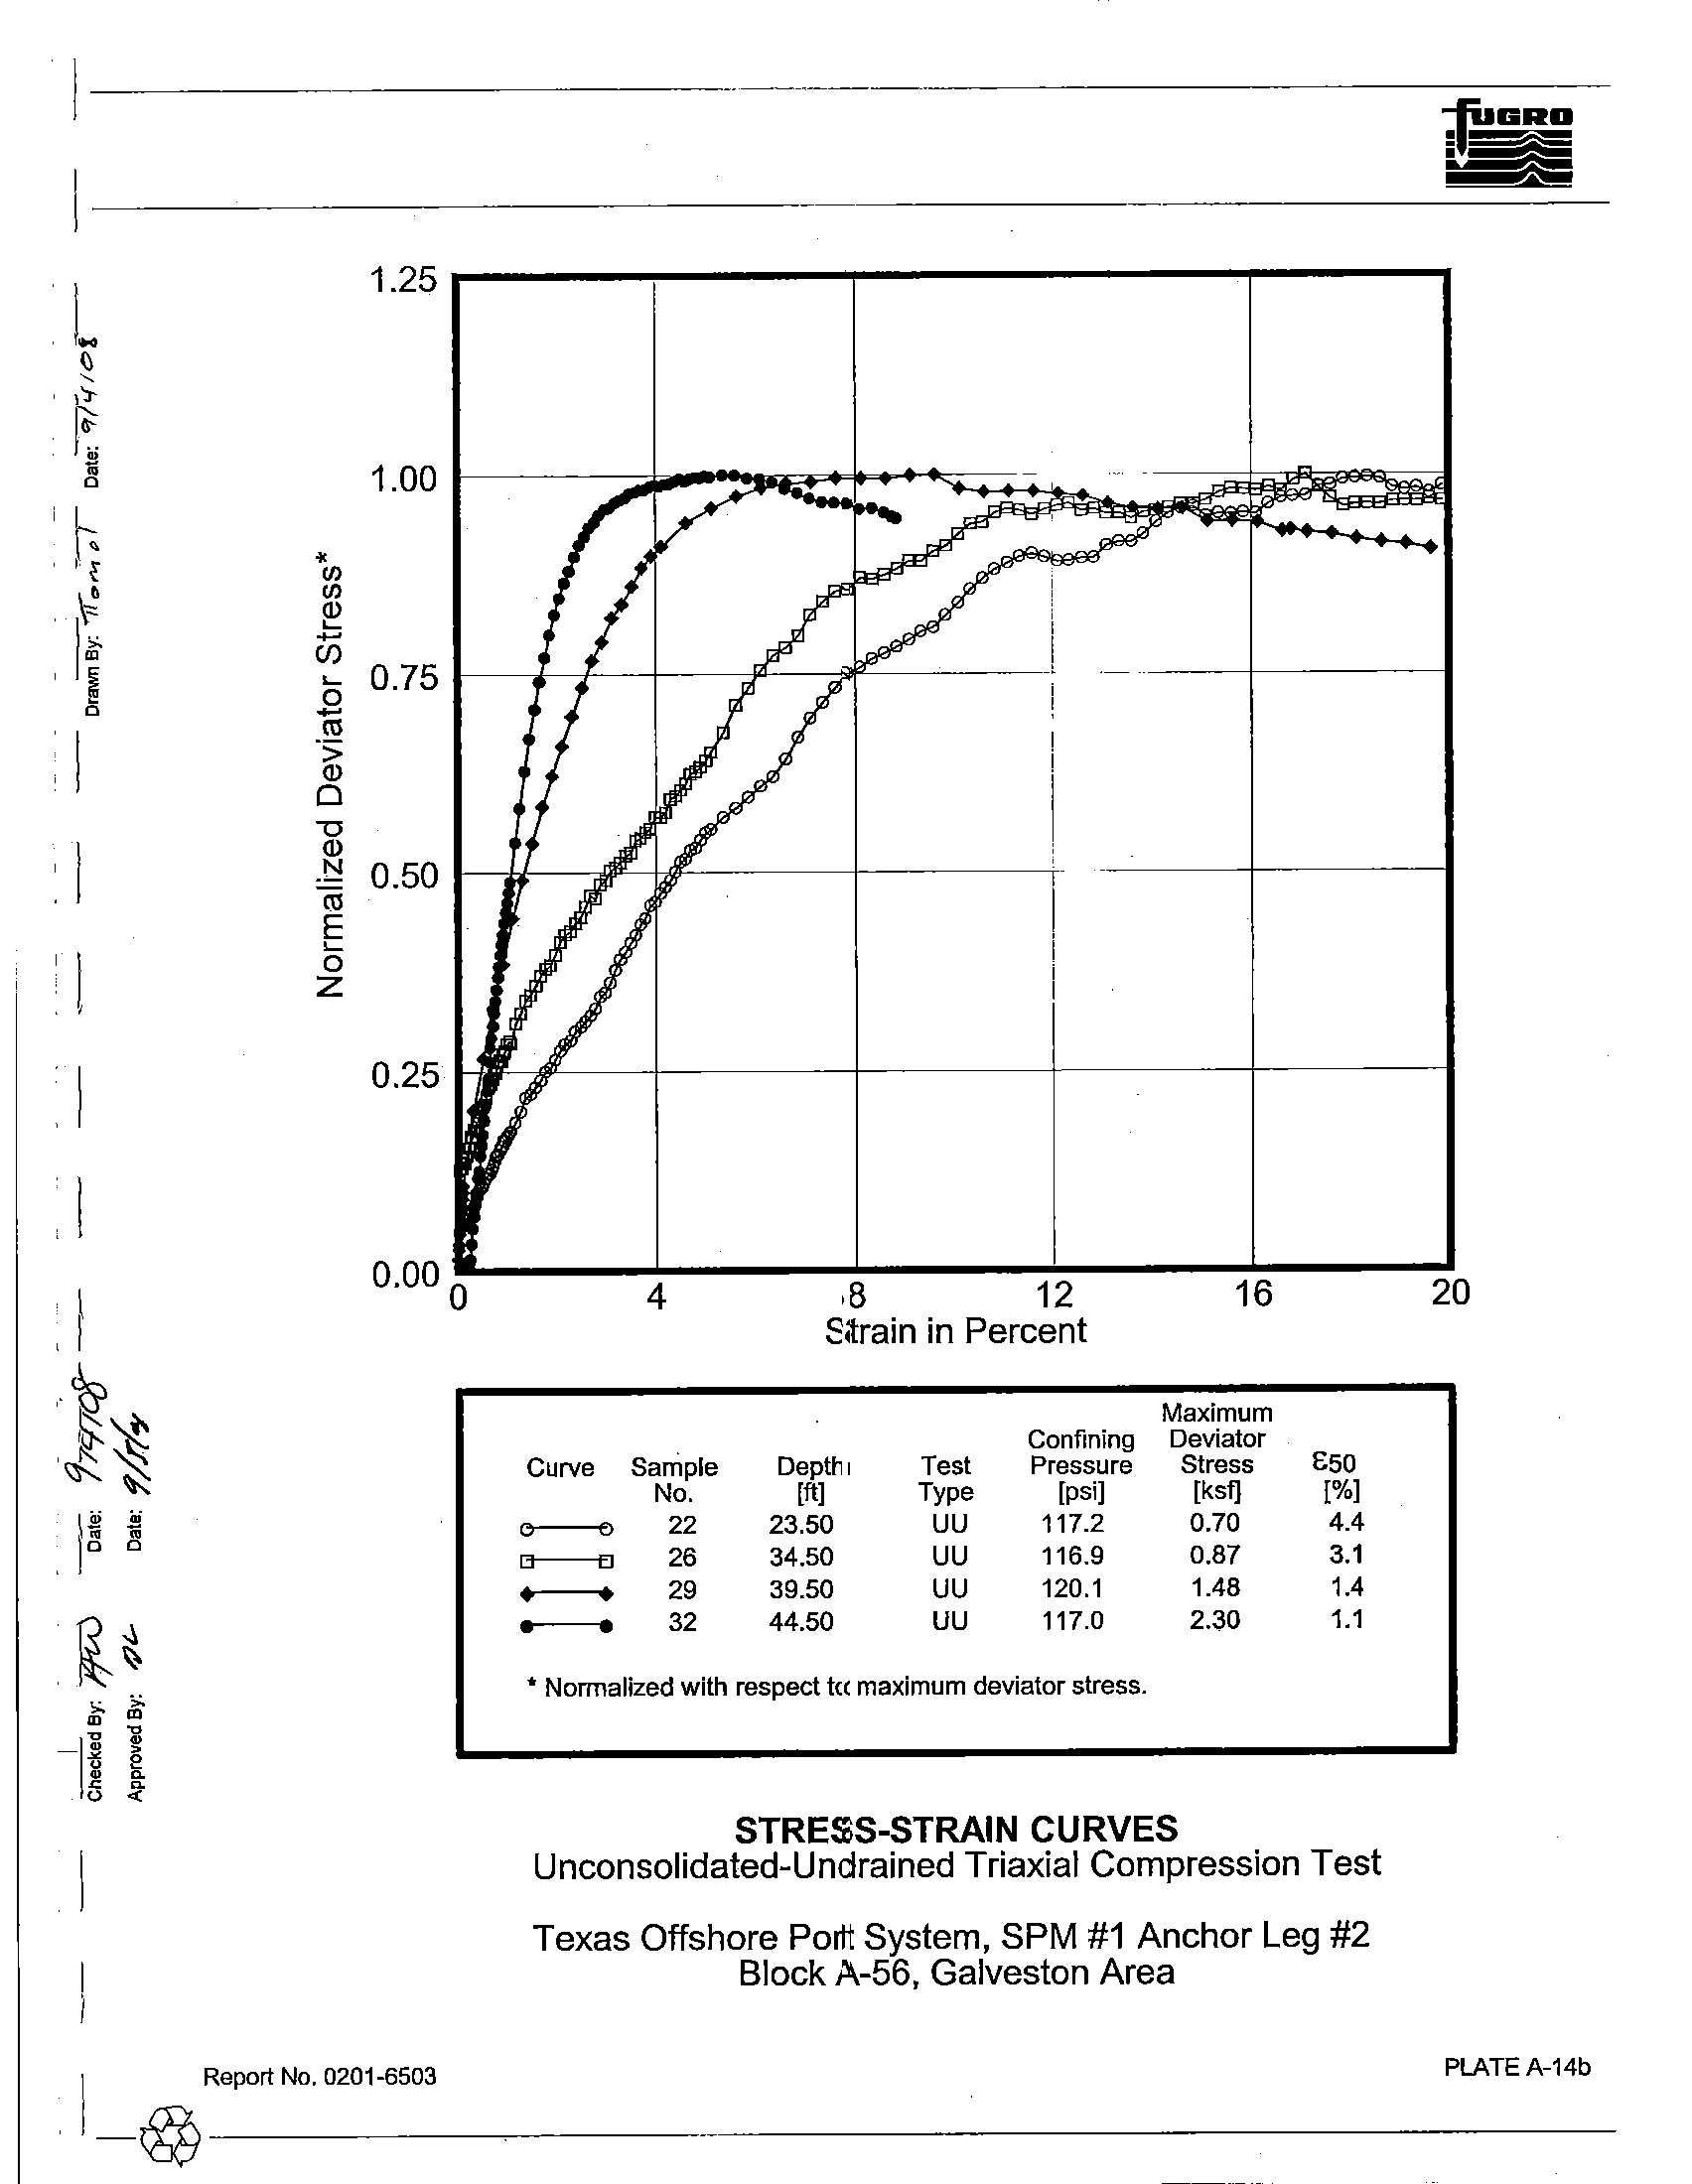
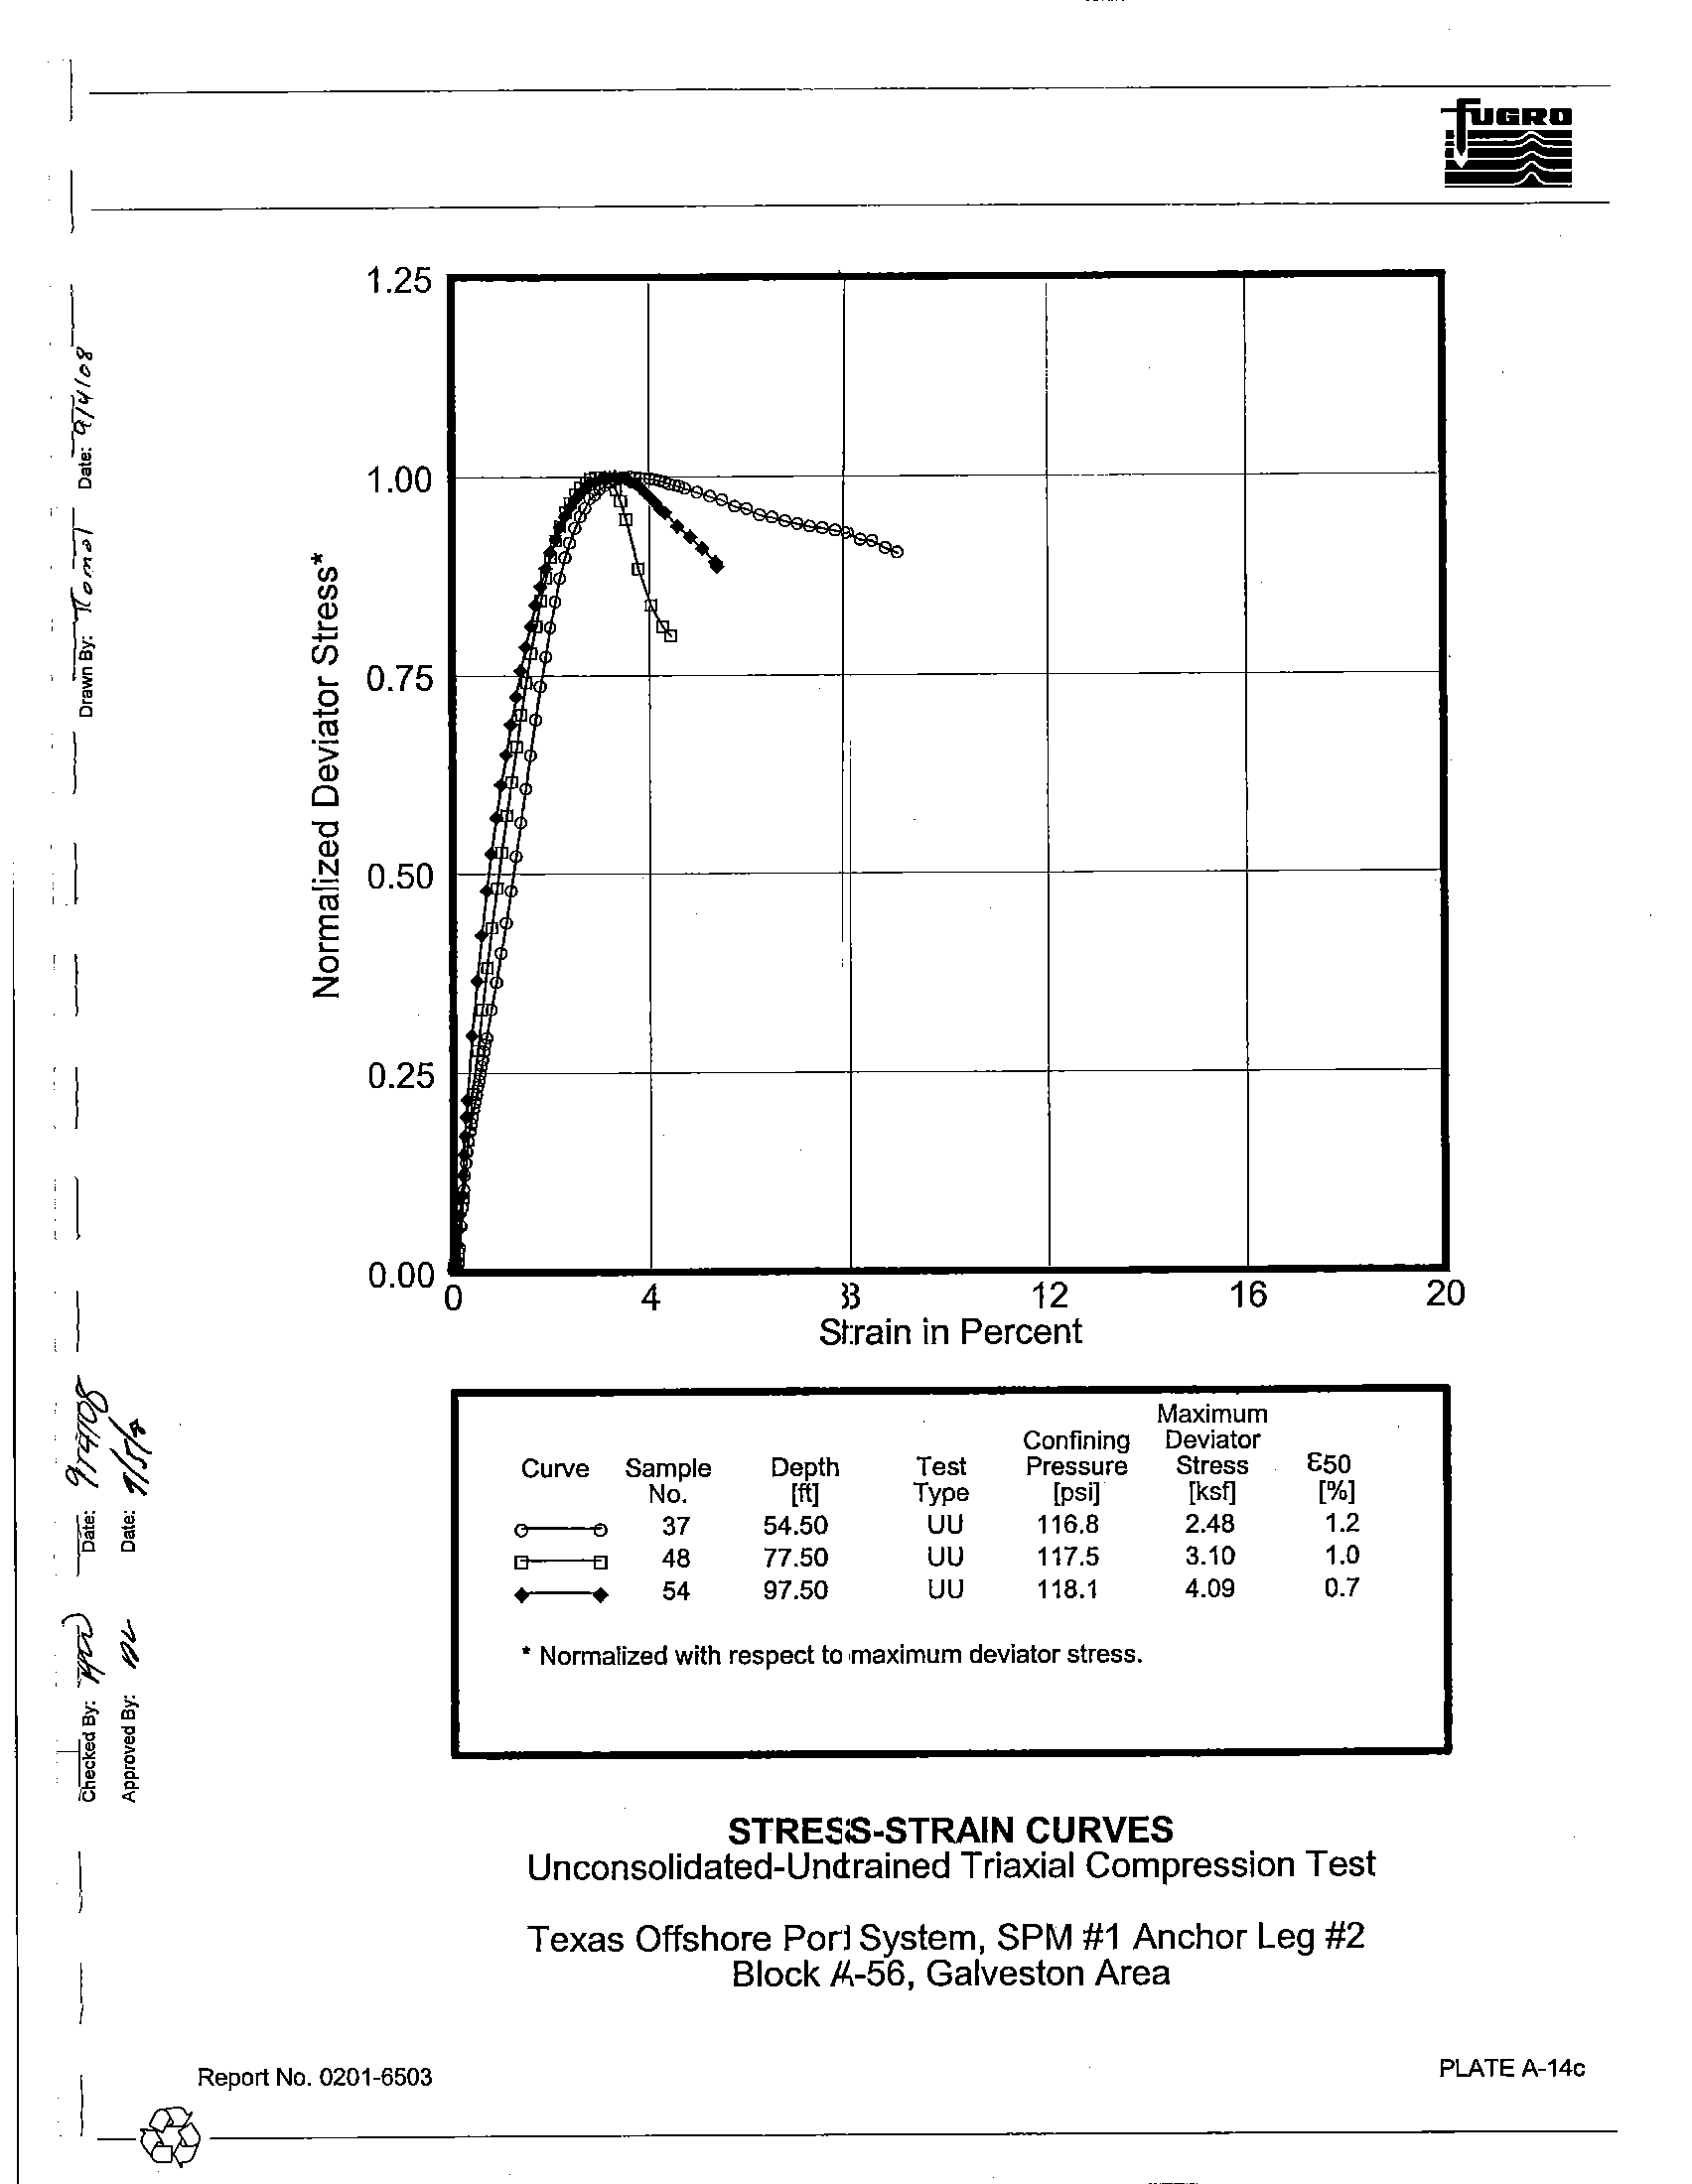
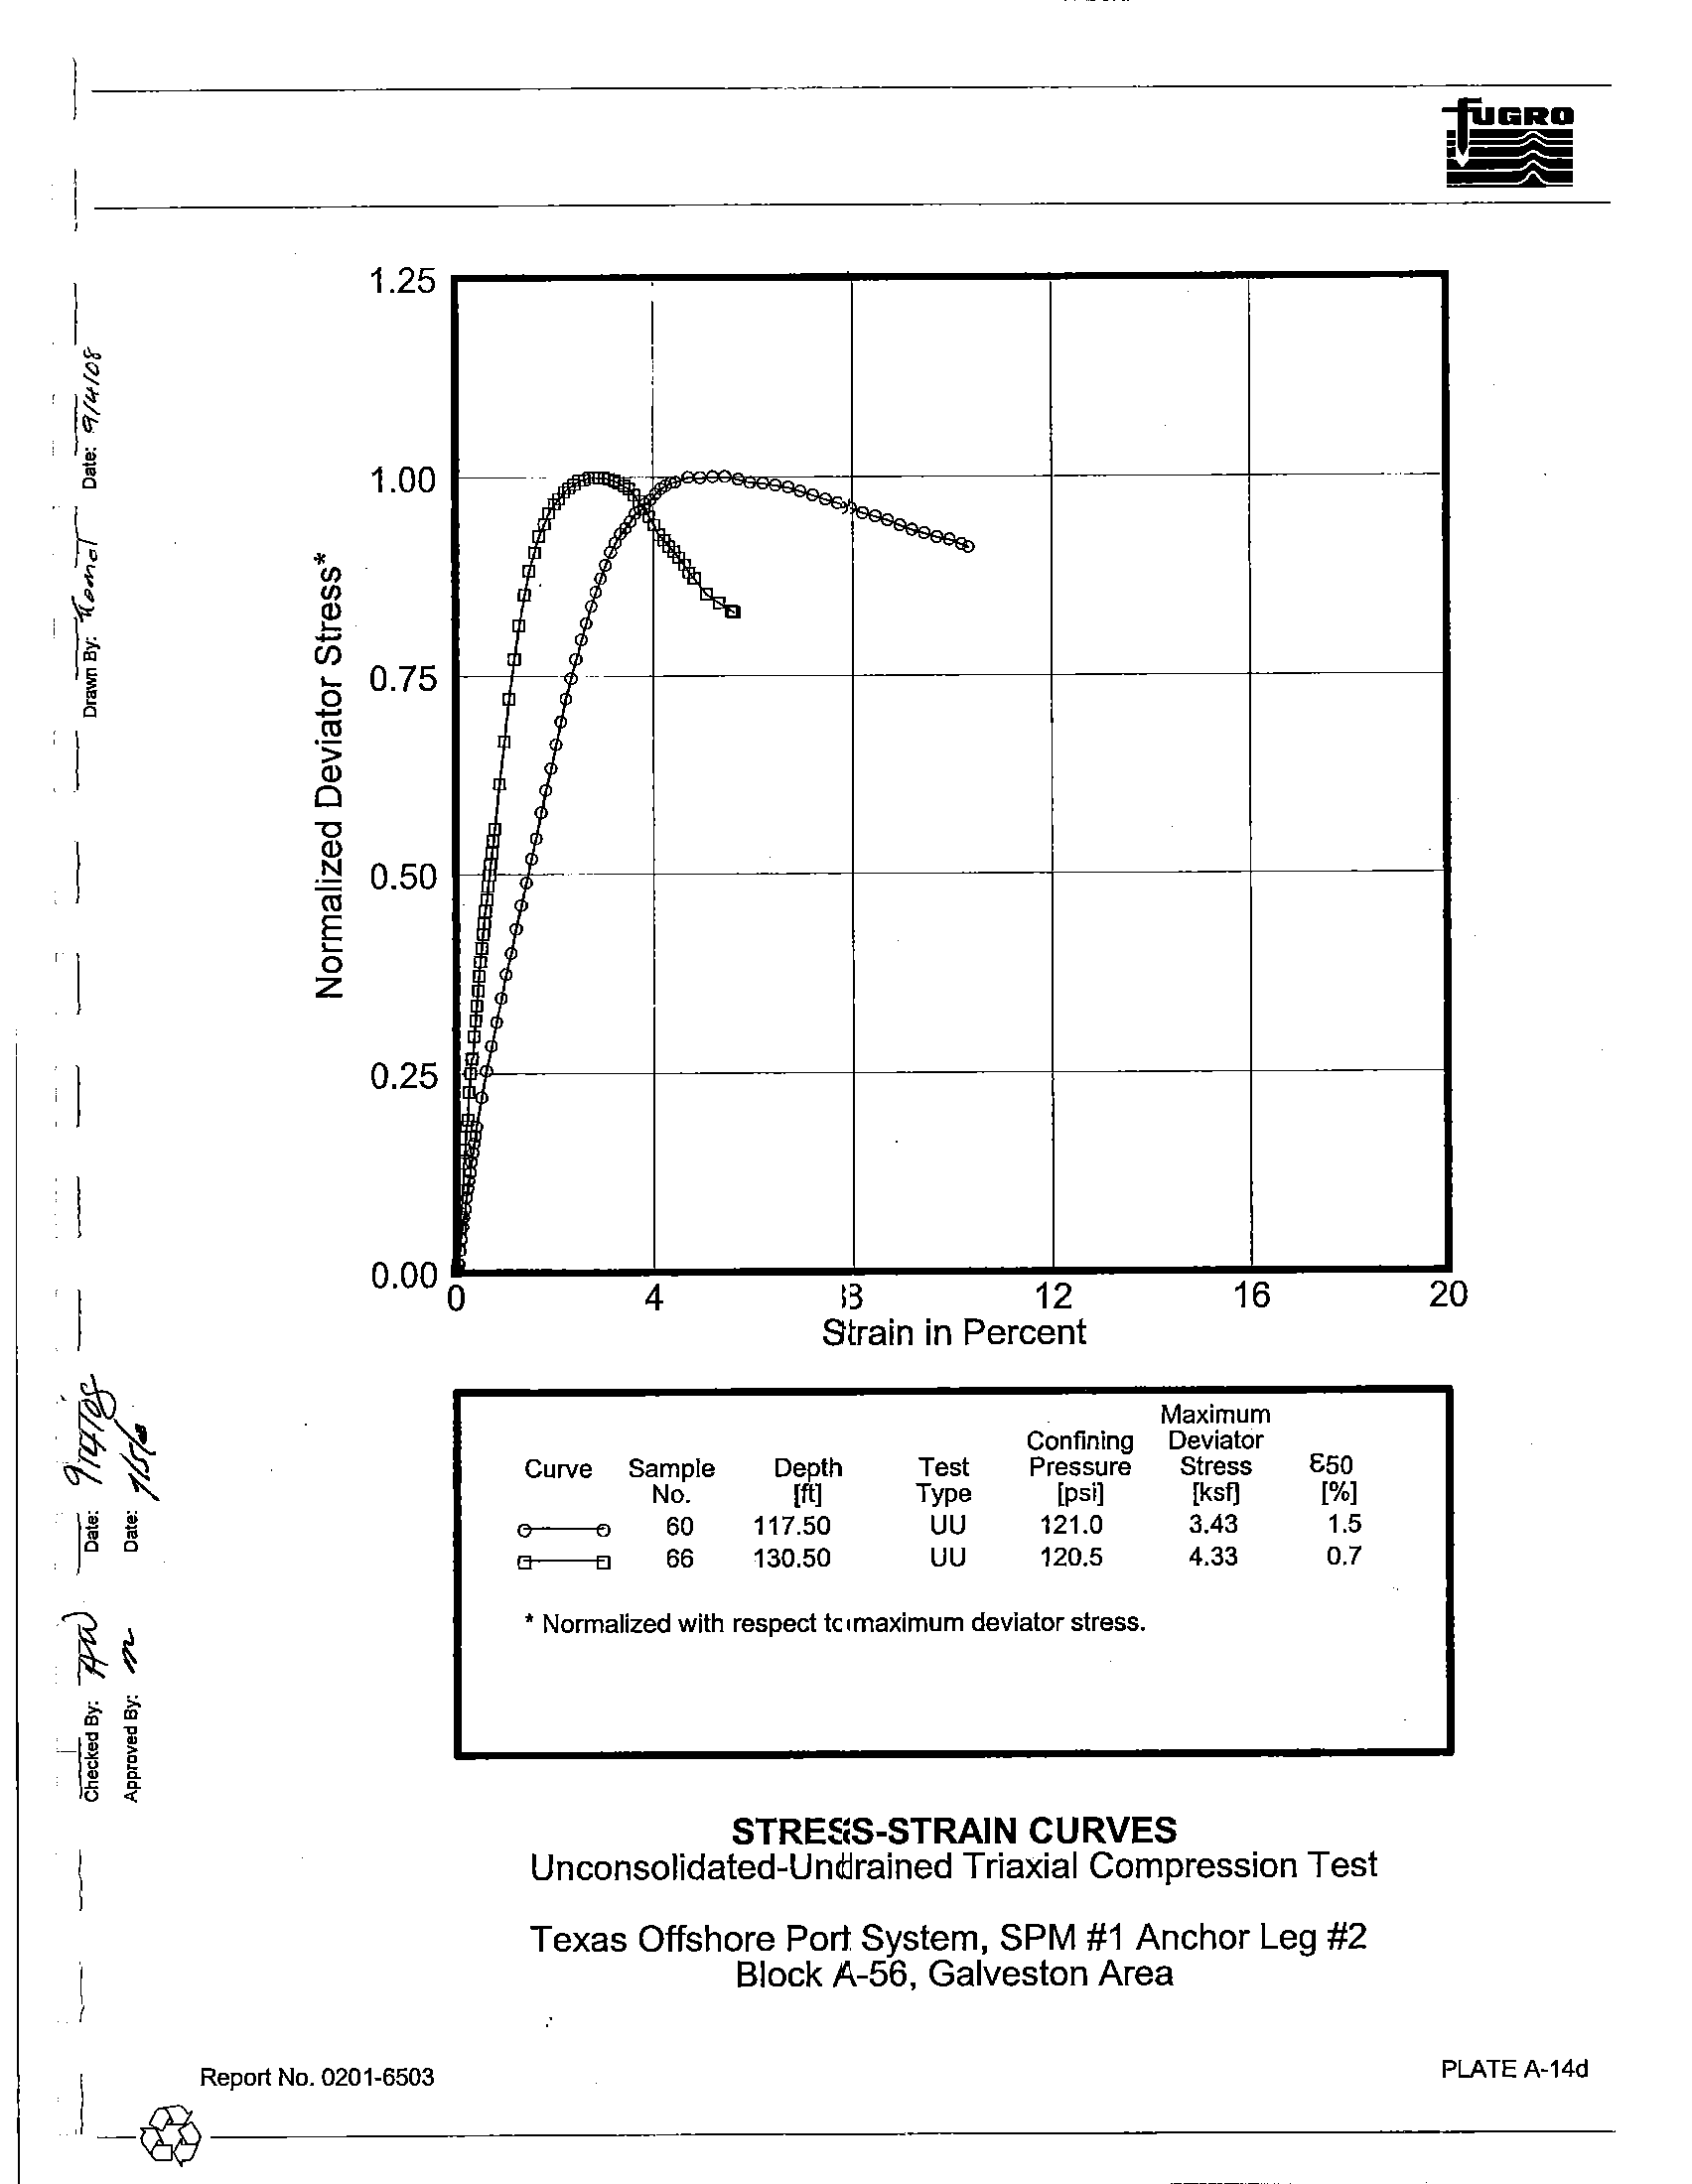
Unit weight, Torvane, pocket penetrometer, miniature vane and
unconsolidated-undrained triaxial compression tests were performed
in the field on selected cohesive
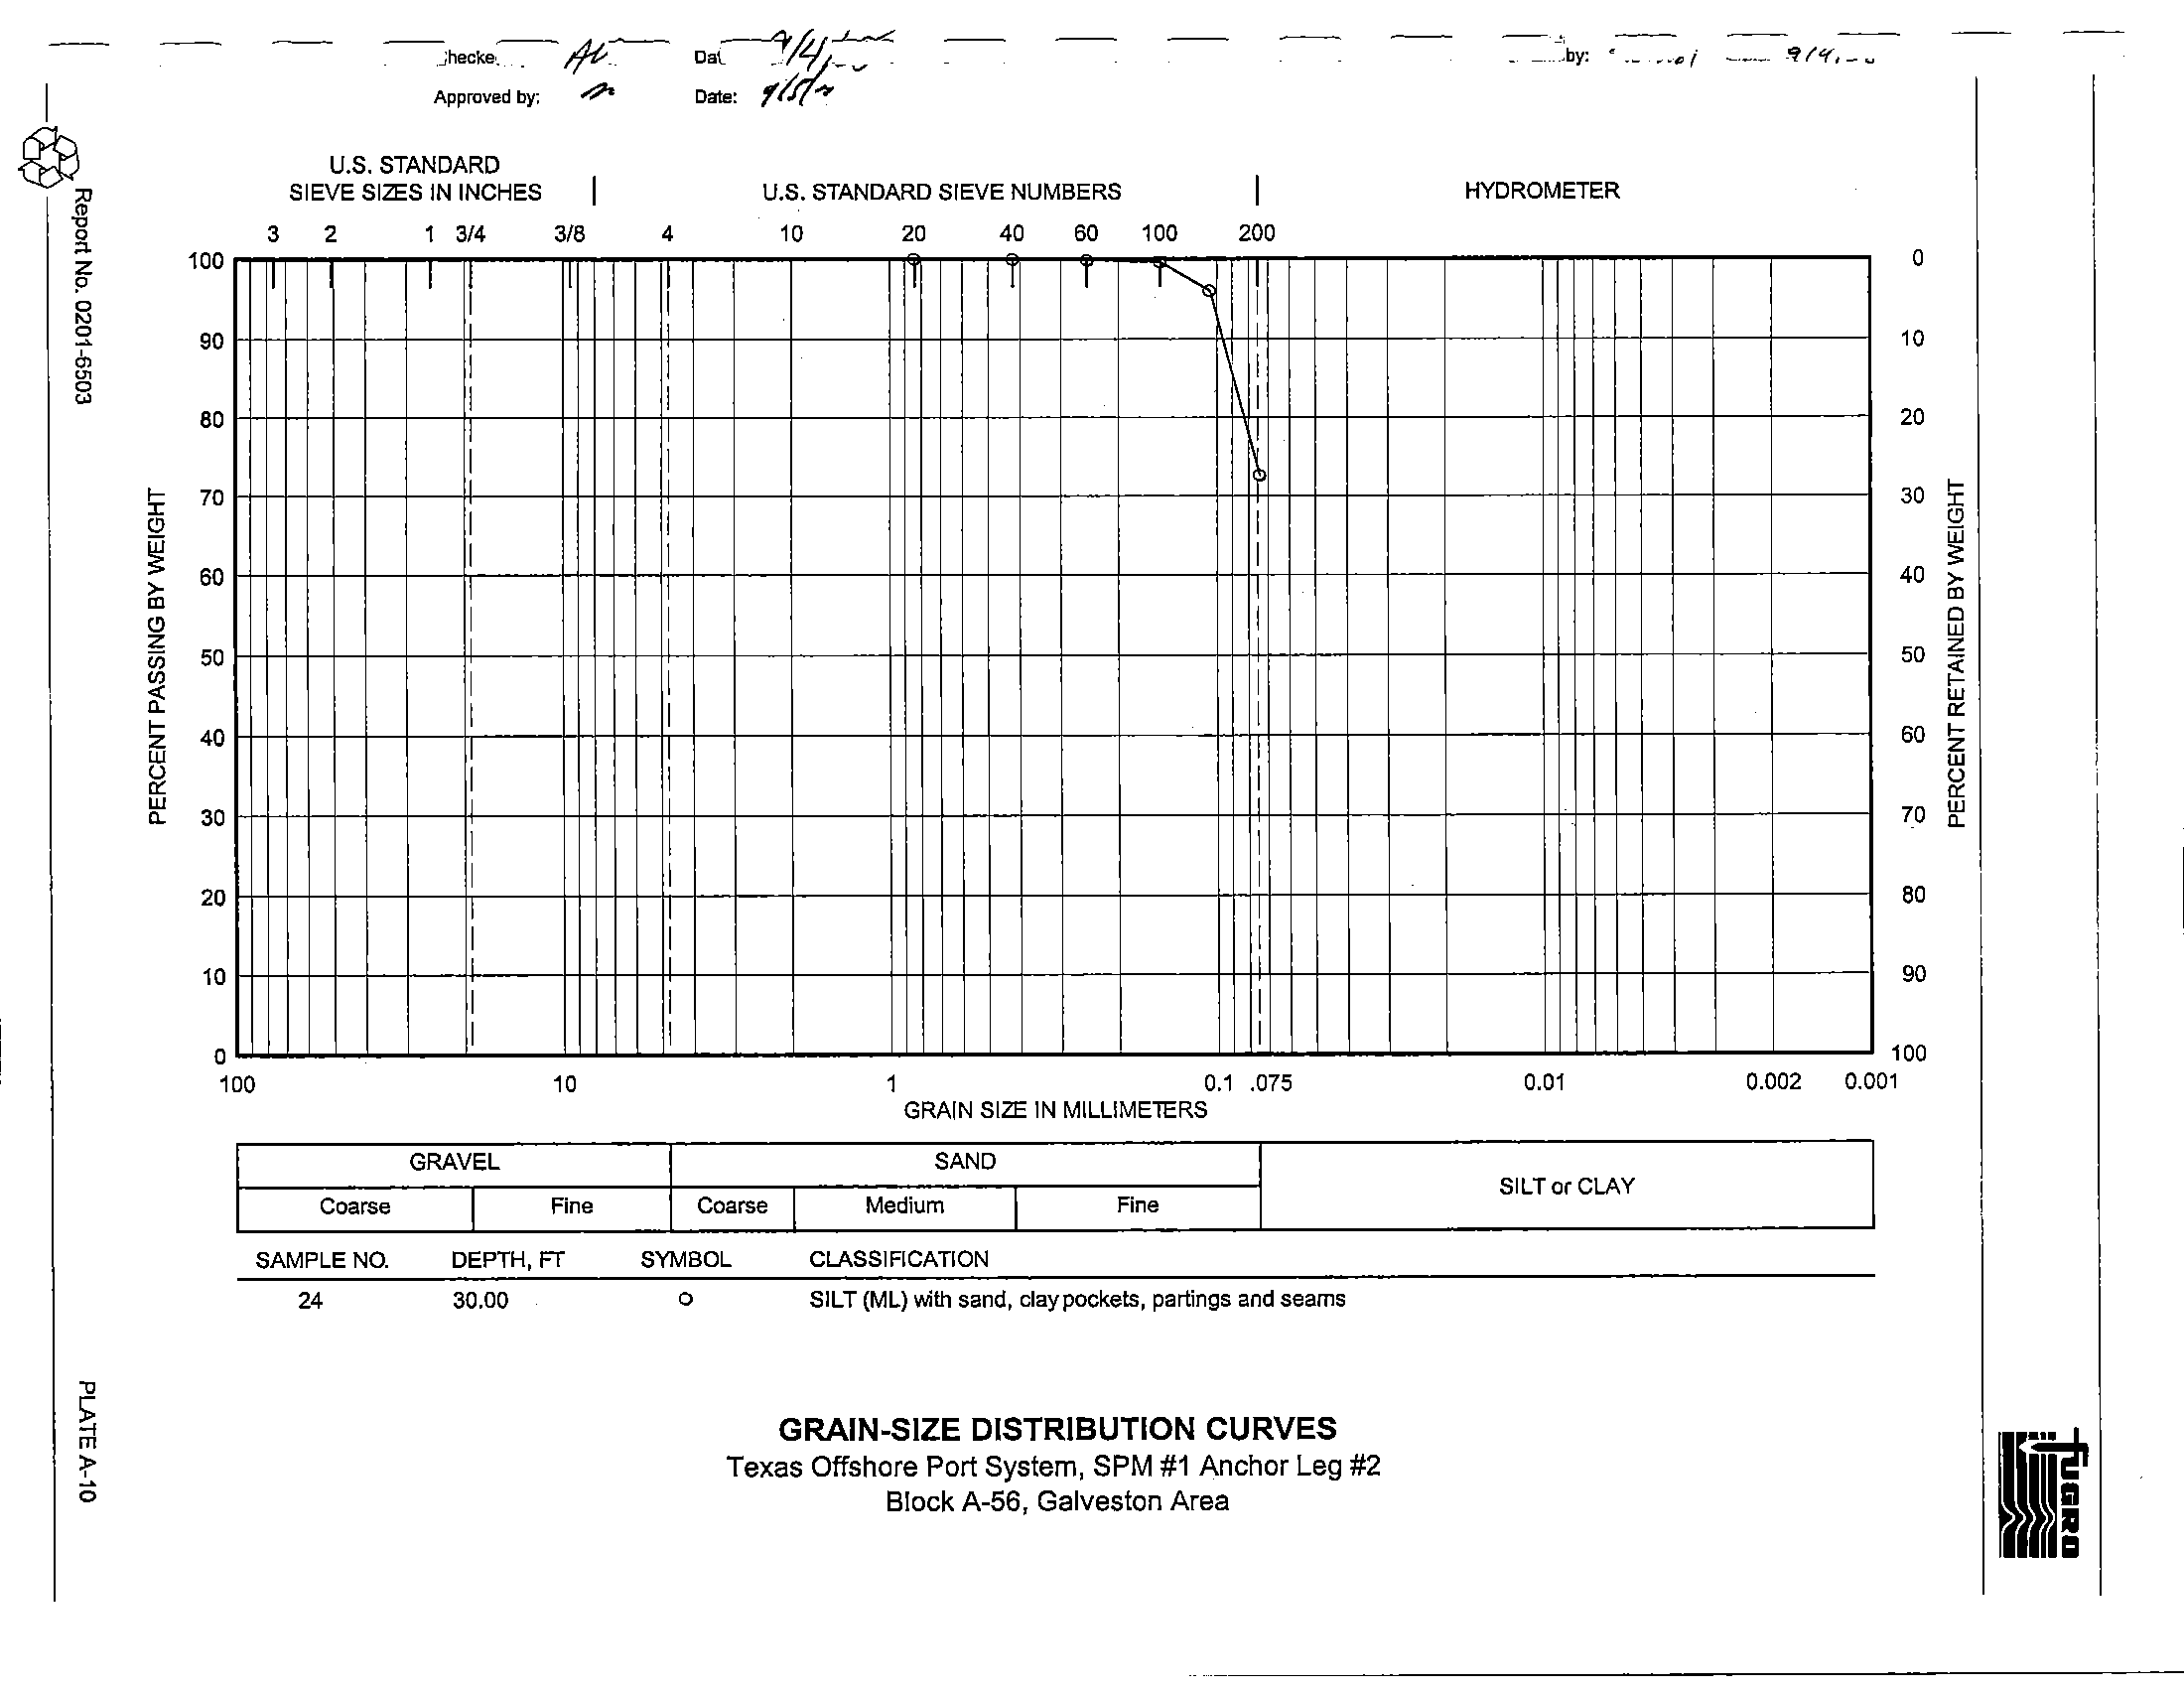
samples. All of the samples were shipped to Fugro's Houston laboratory where Atterberg limit tests, water
content tests, and grain-size analyses,
as well as additional density tests, unconsolidated-undrained triaxial
compression tests, and miniature vane tests, were performed.
A description of relevant laboratory procedures is provided
in Appendix A.
The strength and
classification test results are presented graphically
on the Logs of Boring and Test Results in Section 3.
Grain-size distribution curves from sieve-analysis and stress-strain curves from triaxial compression tests
are presented
in Appendix A.
2.3 GENERAL SOIL CONDITIONS
2.3.1
Soil Stratigraphy
The soil stratigraphy at each of the boring locations disclosed by the field and laboratory
investigations is presented
in Section 3. The soil stratigraphy is based on the classification of soil samples
recovered from the boring and observations made during drilling operations
.. Detailed soil descriptions, for
each location, that include textural variations and inclusions are noted
on the respective boring log
presented
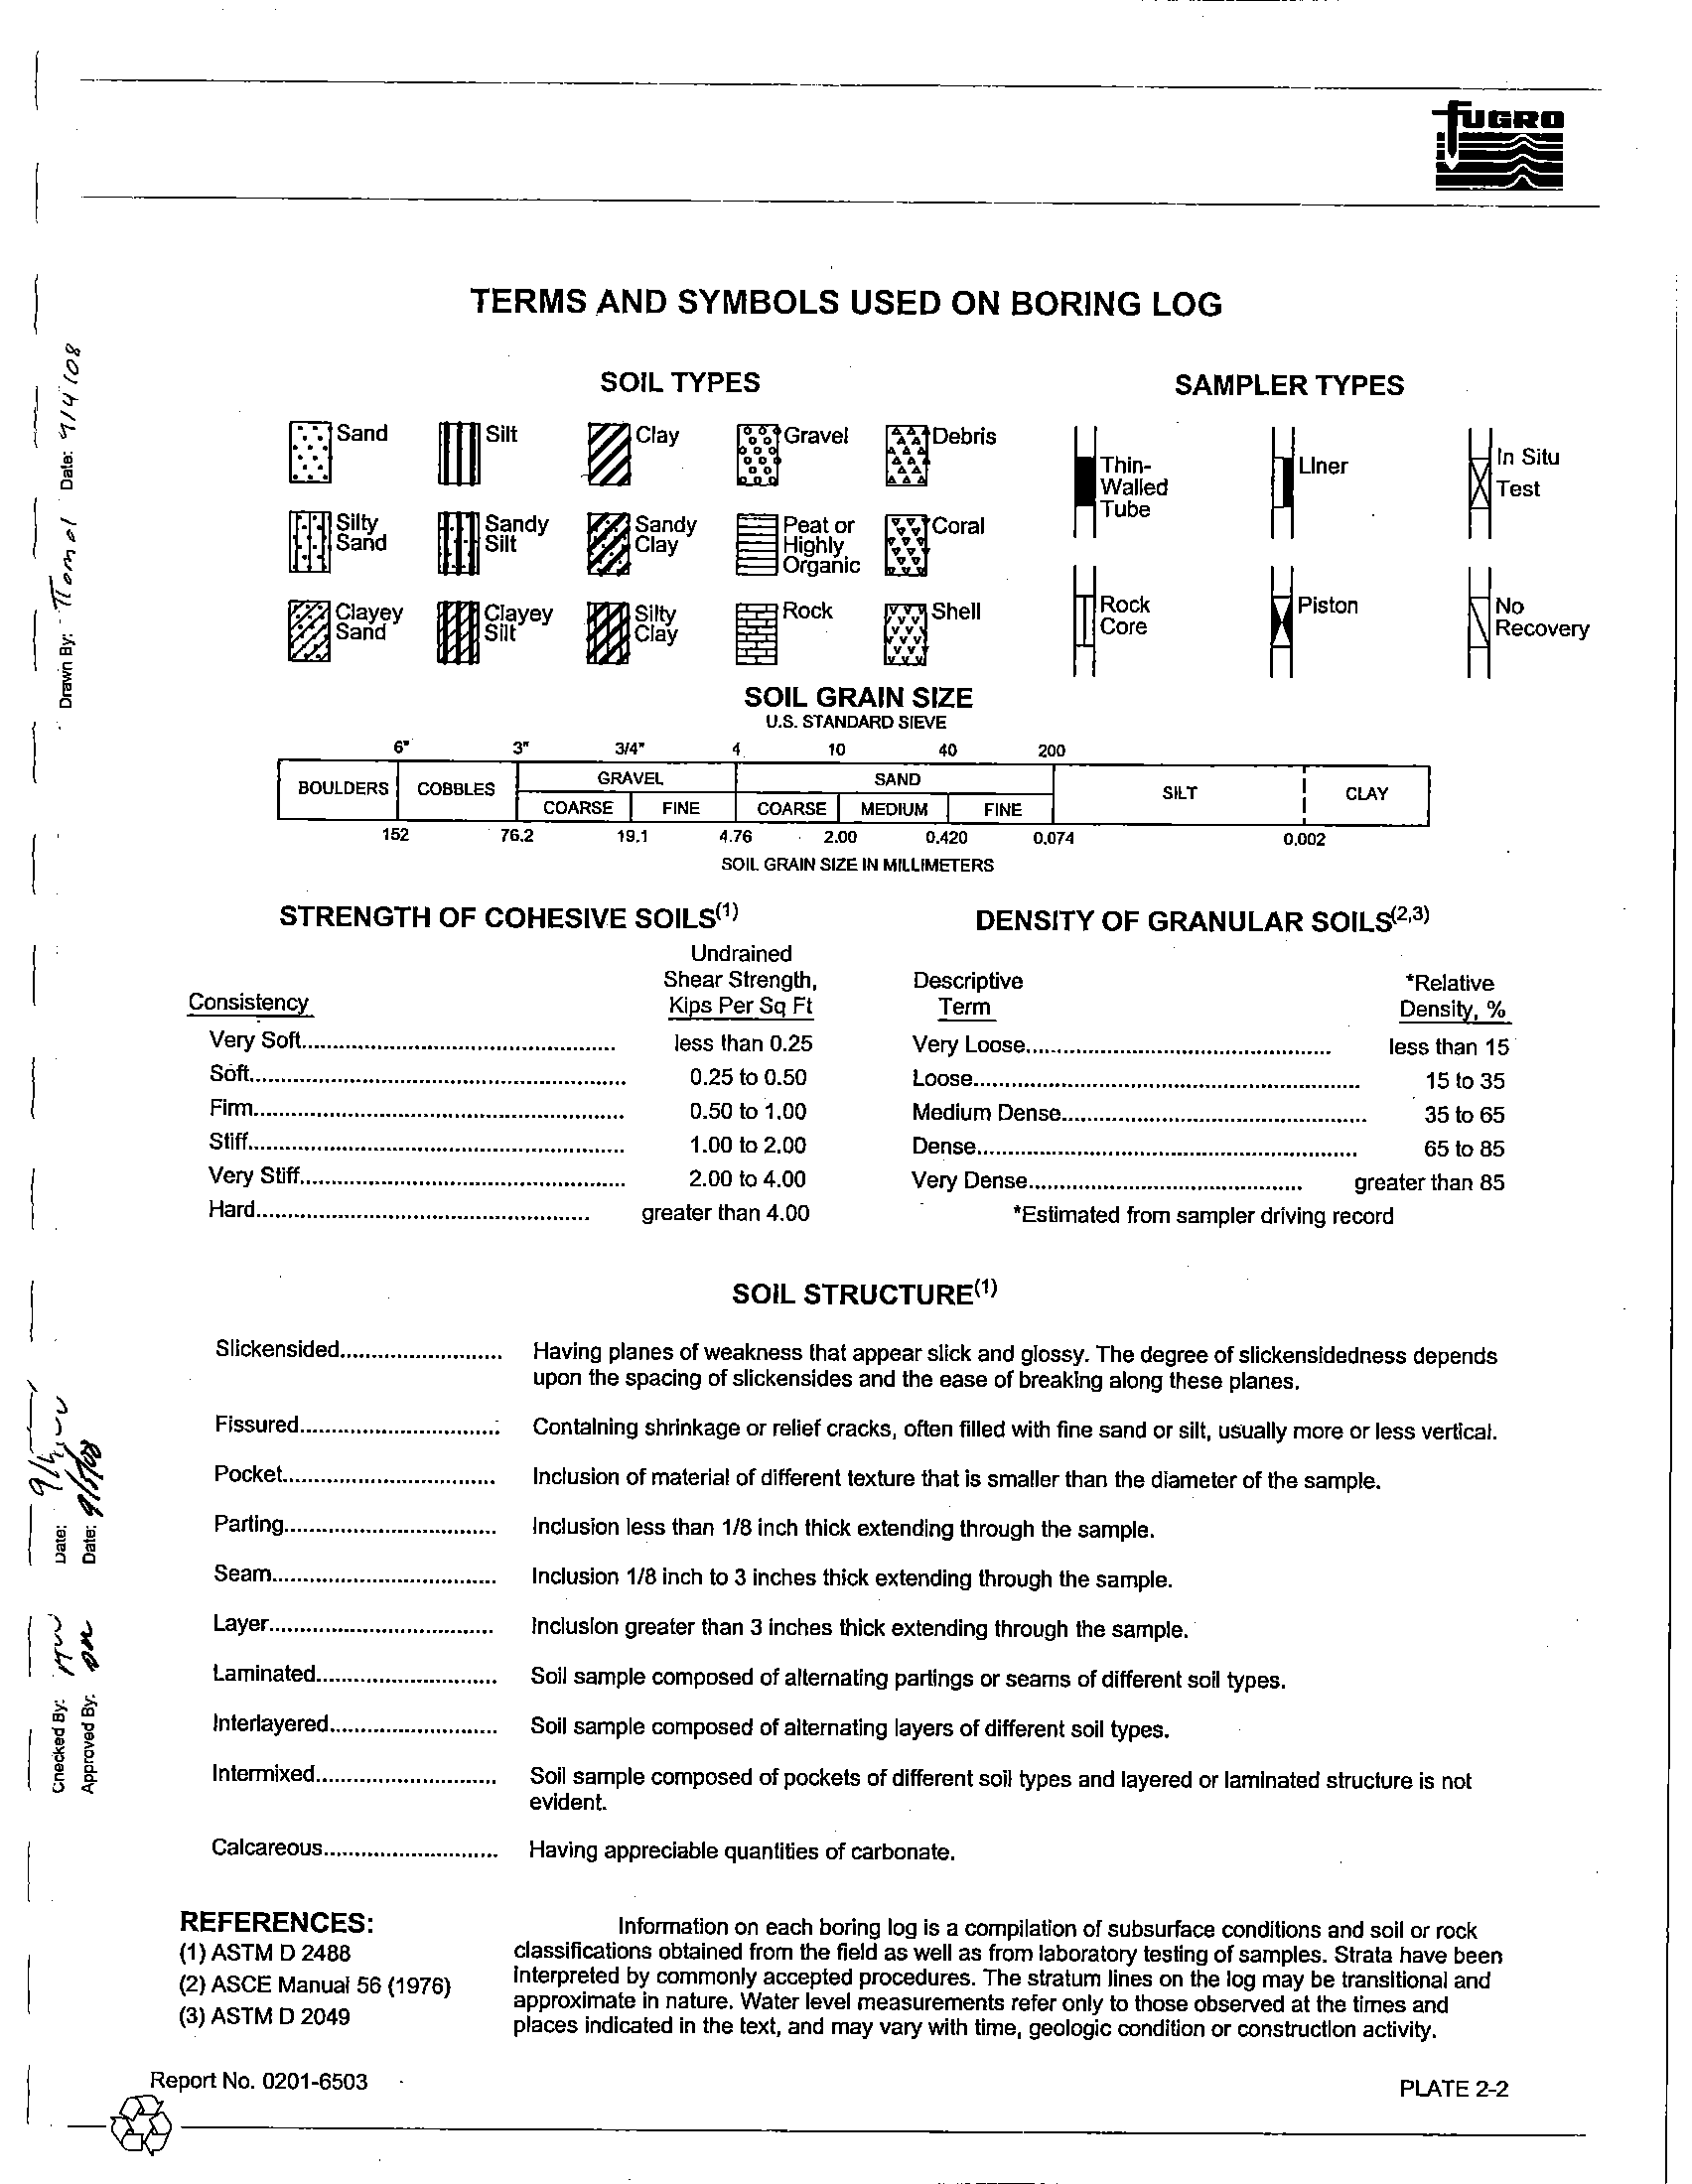
in Section 3. A key to the terms and symbols used on the boring log is presented on Plate 2-2.
I
_@
Report No. 0201.6503
2-3
--------.--~-------------------------------------
The Roman numeral representing each stratum is also shown on the respective boring log and on relevant
plates.
In general, the exploratory borings revealed stratified cohesive and granular soil profiles with clay
layers interbedded with silt, sandy silt, or silty fine sand layers
of varying thickness, within approximately the
upper 34 ft of sediments. Alternating clay and silty fine sand layers were also encountered at the Offshore
Terminal boring location
in Block A-59 (FMMG Report No. 0201-6502) to a depth of about 46-ft penetration.
The soil below the interlayered zone consists predominately of firm
to stiff clay with a shear strength profile
that increases
with increasing depth.
2.3.2 Interpretation
of Soil Properties
The shear strength and submerged unit weight profiles best represent the assembled test results
plotted
on the boring logs are shown on the respective "Design Strength Parameters" and "Design
Submerged Unit
Weighf plots in Section 3. These profiles were used in the engineering analyses.
In developing the shear strength profile for the cohesive soils, undrained shear strength test results
from miniature vane and unconsolidated-undrained triaxial compression tests were analyzed. The selection
of shear strength profiles for clay soils and the effects
of the type of sampling procedure on the profiles are
discussed by Dennis and Olson (1983) and Quiros, et
al. (1983). Strength parameters for granular soils
were selected based
on their gradation and relative density estimated from sampler blow count information.
The submerged unit weight profile was developed from actual density measurements and calculated unit
weight values based on sample moisture content and the assumption of 100 percent sample saturation.
The
recommendations for foundation design and installation were developed with the
assumption that the soil conditions revealed by the borings are continuous throughout the general
area
of the proposed foundation structure. Consideration of possible stratigraphic changes, faulting, or
geologic conditions which may influence foundation design were beyond the scope of this investigation.
Variations in soil
conditions may become evident during PLET or pile installation. If variations are
found, a re-evaluation of the recommendations
in this report may be necessary. We recommend that
additional soil borings be obtained
to determine the site-specific conditions within the immediate proximity of
the remaining proposed PLET and anchor locations.
2.4 GEOPHYSICAL SURVEY SUMMARY
2.4.1
Introduction
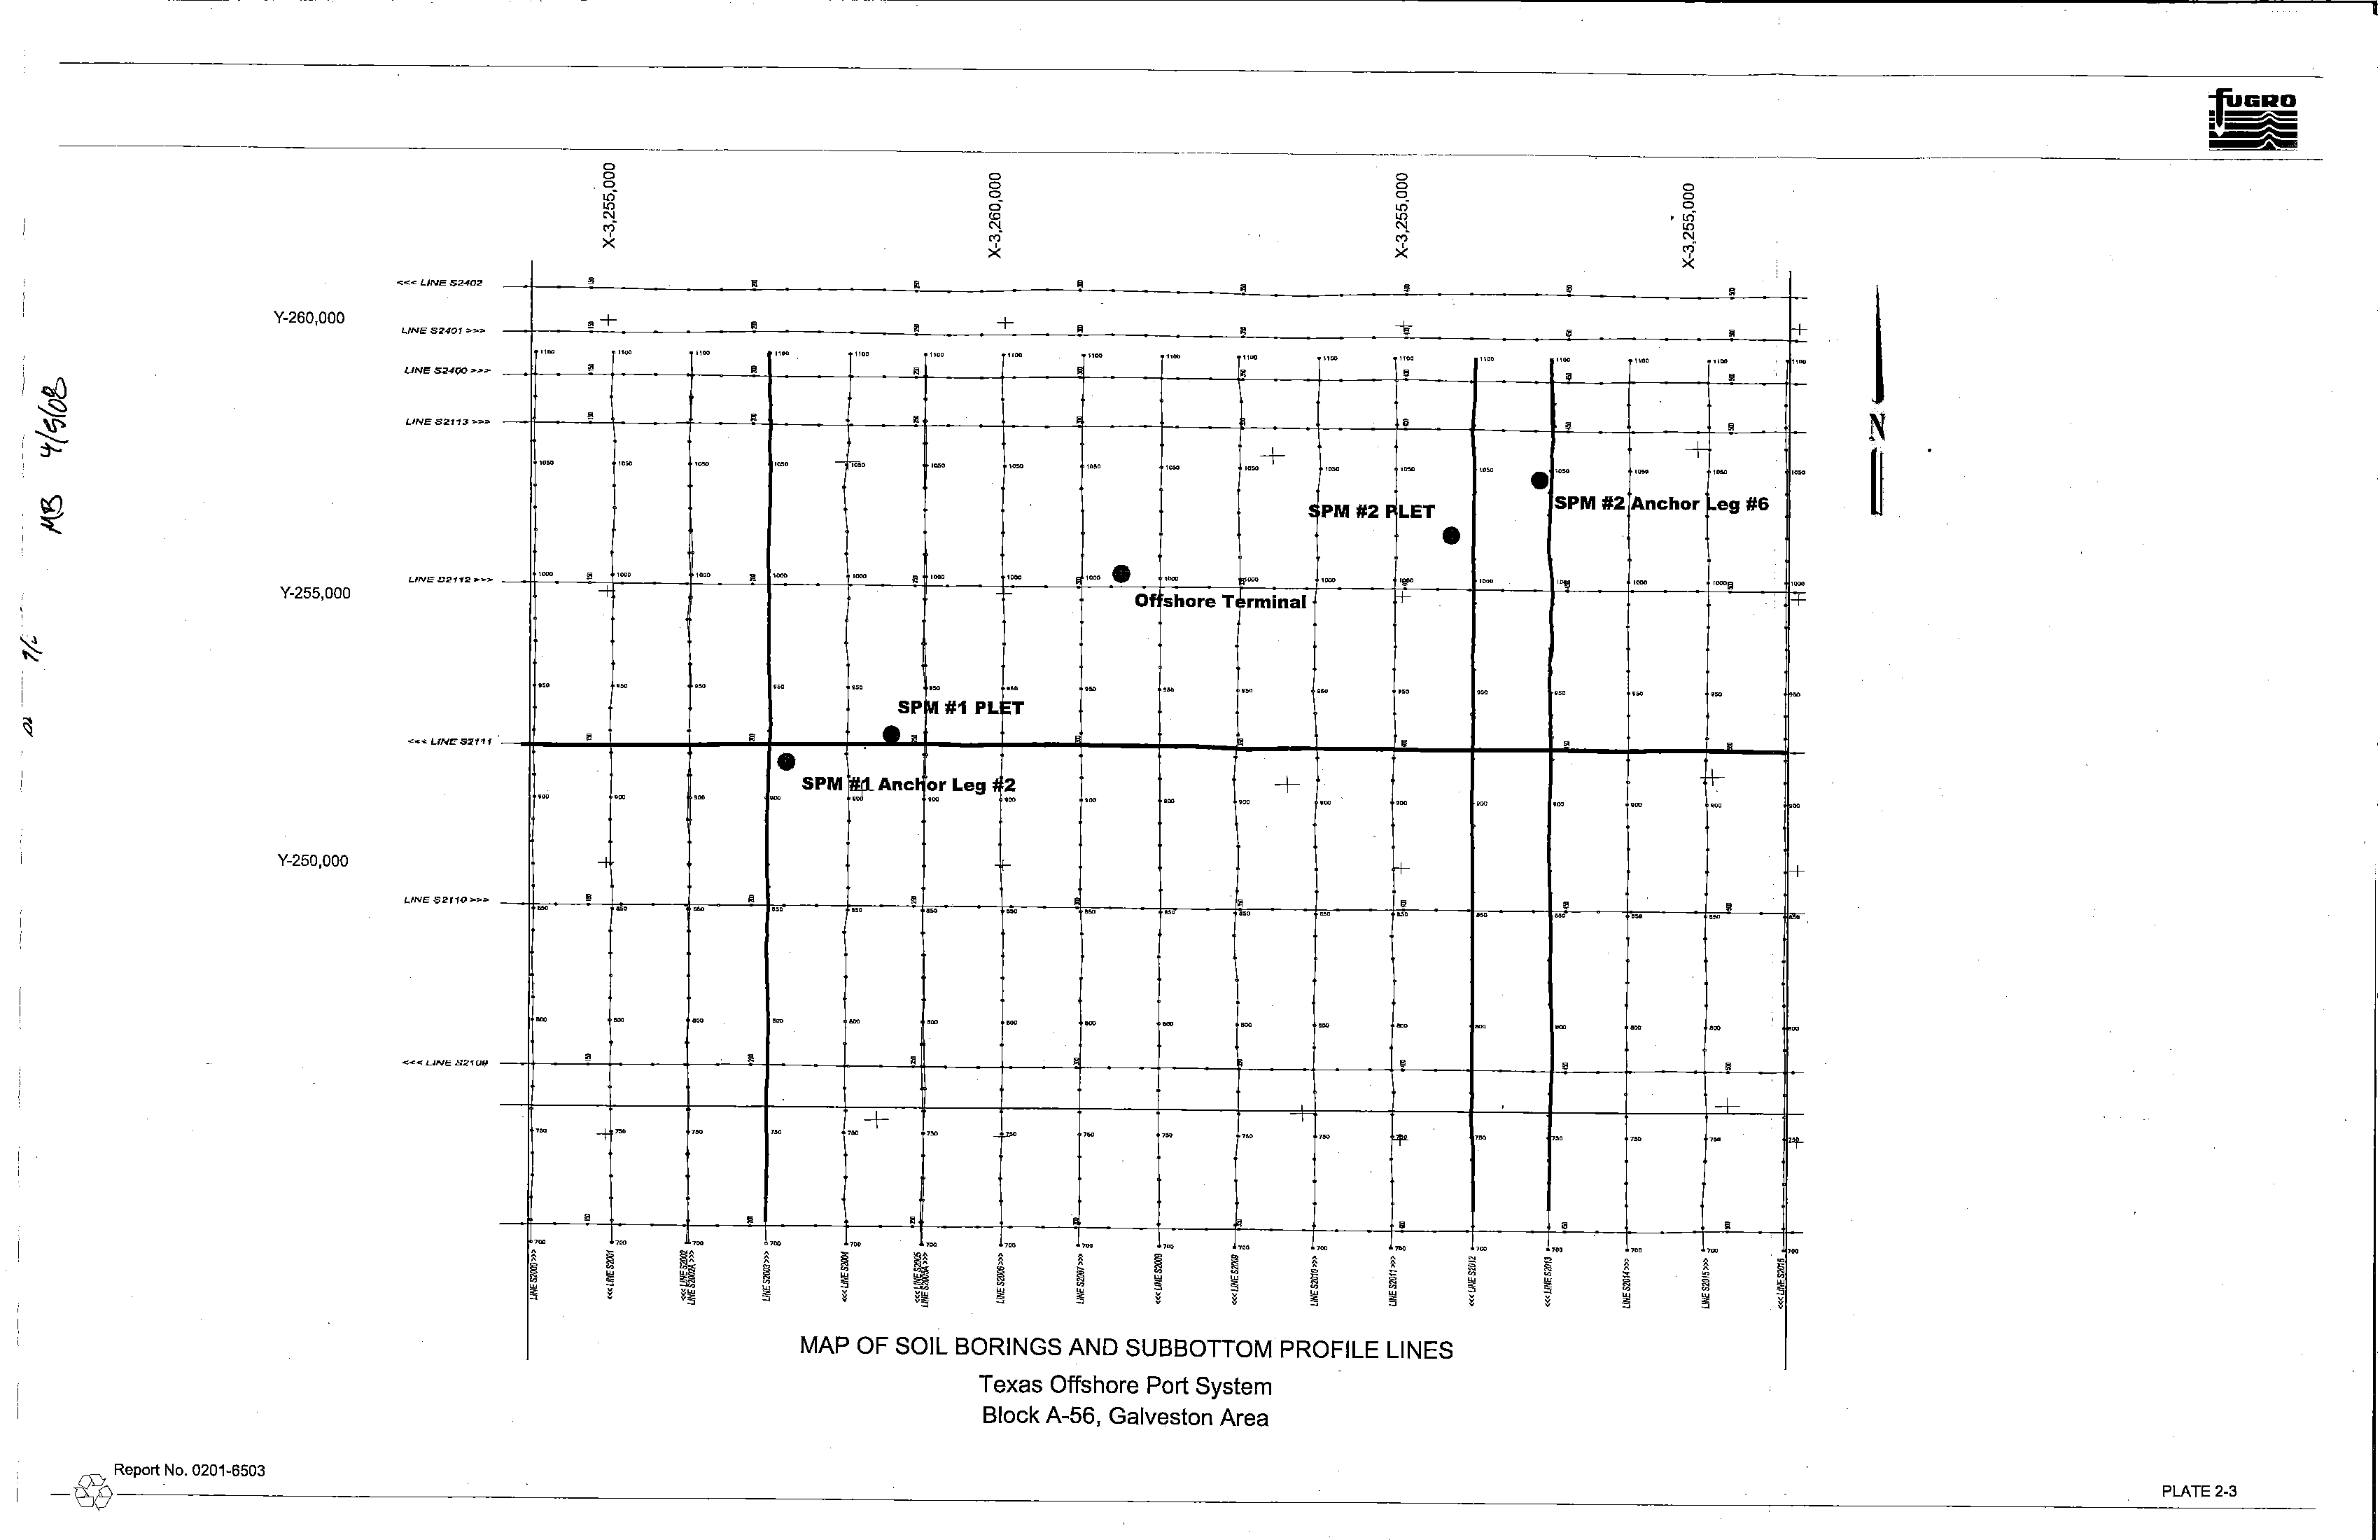
The purpose of this section is to briefly summarize the results and findings of the high-resolution
geophysical survey conducted
in the area encompassing Block A-56 in the Galveston Area as related to the
proposed
SPM locations. A map indicating the subbottom profiler data lines is presented in Plate 2-3, with
the geophysical lines used for interpretation of the highlighted soil borings. Section 3 contains cross-section
plots
of integrated data that compares the soil stratigraphy from the borings and geophysical data within the
immediate vicinity of each boring. A detailed assessment
of the seafloor and shallow geological conditions
in Block A-56 is presented in the geophysical report, FGSI Report No. 2407-1298 (Fugro Geoservices, Inc.,
2008).
2.4.2
Water Depth and Seafloor Topography
Water depths across the survey area range from -111 feet MLLW in the northwest corner to -122 feet
MLLW
in the southeast corner, with zero datum equal to Mean Lower Low Water. Bathymetric contours
within Block A-56 define a seafloor that slopes gently to the southeast at a gradient of 4 feet per mile
(0.04°).
I __
@
Report No. 0201-6503
2-4
2.4.3 Soil Conditions
Five geotechnical borings across the project field indicate an upper unit of very soft to stiff gray clay
to lean clay
to greenish gray stiff to hard clay up to 11 feet Below Mud Line (BML). Underlying these soils, a
gray lean clay to silty fine sand to silt unit extends to approximately 20 to 34 feet
BML. From 34 feet BML, a
firm to stiff lean clay
is present to approximately 131 feet BML. The borings represent the generalized soil
stratigraphy for the study area, but soil properties vary between boring locations
as revealed by the mapped
channel features
and acoustic voids indicated in the geophysical data.
2.4.4
Geological Features and Hazards
Biogenic gas accumulations "acoustic voids" attenuated the subbottom profiler records
in some
locations result
in reduced penetration and resolution within those areas. Extra caution should be exercised
in these areas.
However, the soil borings could be used as an indicator that shallow gas was not
encountered at the boring locations.
Channels buried 2 to
18 feet below the seafloor were noted throughout the survey area. Where
discernable, thalweg depths range from 18 to 113 feet BML. Areas
of channelized sediment represent
seafloor locations where geotechnical sediment properties may vary significantly. Site-specific soil borings
would be necessary
to determine the specific geotechnical properties of the sediments within the channels.
2.5 PILE DESIGN INFORMATION
The pile design information developed for this study inclUdes ultimate axial capacities, axial load-
pile movement data, and lateral soil reSistance-pile deflection (p-y) characteristics. The analytical methods
used to develop this information are presented briefly
in the following paragraphs and in more detail in
Appendix B.
2.5.1
Axial Pile Design
Method
of Analysis. The ultimate axial capacity of piles was computed using the static method of
analysis described in API RP 2A (2000). In this method, the ultimate compressive capacity of a pile for a
given penetration
is taken as the sum of the skin friction on the pile wall and the end bearing on the pile tip.
The weight
of the pile and soil plug is neglected in the computations. When computing the ultimate tensile
capacity
of piles, as well as the compressive capacity of conductors or caissons, the end bearing
component is also neglected.
Ultimate Axial Capacity. The unit skin friction and unit end bearing values are presented
in
Section 3, and were calculated using the API RP 2A methods described in Appendix B. These values were
used to calculate the ultimate axial compressive and tensile capacities for 24-in.-diameter pipe piles at the
PLET locations and 42-in.-diameter pipe piles at the anchor leg locations, driven to final penetration.
Capacity curves for driven pipe piles (conductors, caissons, anchor
and foundation piles) are also presented
in Section 3.
API RP 2A recommends that pile penetrations be selected using appropriate factors of safety or
pile resistance factors. For working stress design (WSD), API
RP 2A recommends that pile penetrations be
selected to provide factors
of safety of at least 2.0 with respect to normal operating loads and at least 1.5
with respect to maximum design storm loads. These factors
of safety should be applied to the design
compre.ssive and tensile loads. For load and resistance factor design (LRFD),
API RP 2A recommends pile
resistance factors
of 0.7 and 0.8 for operating and maximum storm loads, respectively. Also, appropriate
load factors
shOUld be used to determine operating and maximum storm loads for LRFD design.
I
Report No. 0201-6503
-@----_.
2.5
------------------------------
..
---~
Axial Load Transfer Data. Axial load-pile movement analyses are usually performed using a
computer solution based
on methods developed by Reese (1964) or Matlock, et al. (1976).
These
programs treat the pile as a series of discrete elements, represented by linear springs that are acted upon
by nonlinear springs representing the soil. The nonlinear soil springs are referred to as t-z and Q-z curves.
Input data for the program include: (1) pile dimensions and material properties, (2) load transfer
characteristics of the soil surrounding the pile, and (3) the pile tip load-tip movement relationship. The axial
load transfer curves were computed using procedures described
in API RP 2A and outlined in Appendix B.
The results of side load-side movement (t-z) and tip load-tip movement (Q-z) data for 24-in.-
diameter driven pipe piles at the PLET locations and 42-in.-diameter driven pipe piles at the anchor leg
locations are presented
in Section 3. The presented Q-z data should be used for foundation piles and
neglected for caissons and conductor design.
In developing the axial load transfer data in the cohesive
soils, a post-peak adhesion ratio of 0.90 was utilized.
2.5.2
Lateral Pile Design Data
The soil resistance-pile deflection (p-y) characteristics of the soils at the boring locations were
developed for individual 24-in.-diameter driven pipe piles at the PLET locations and 42-in.-diameter driven
pipe piles at the anchor leg locations. These data may be used
in lateral load analyses of driven piles,
conductors and caissons. The p-y data for cyclic loading were developed to 1
DO-It
penetration using the
procedures proposed by Matlock (1970) for soft clays
and O'Neill and Murchison (1983) for sands. These
procedures have been outlined
in API RP 2A and briefly explained in Appendix B. The stratigraphy and
parameters used
to develop the p-y data at the boring locations are presented in Section 3, together with
the p-y data for 24-in.-diameter driven pipe piles at the PLET locations and 42-in.-diameter driven pipe piles
at the anchor leg locations.
P-y values presented
at 100-ft penetration may be used for lateral load
analyses at greater depths.
2,5.3
Pile
Group Effects
API
RP 2A recommends that a pile spacing of less than eight pile diameters be evaluated for group
effects. This additional analysis can
be performed by FMMG when pile spacing has been selected.
2.5.4 Pile and Spud Can Interaction
When a spud can penetrates into the seafloor, a cylindrical zone of remolded and lower (degraded)
shear strength
is created. This zone of lower shear strength soil is called a spud can depression or
pockmark.
Piles located near existing,
or future, spud can depressions may have degraded axial and
lateral capacities.
This degradation
is a function of spud can and pile diameter, depth of spud can
penetration, distance between spud can depression and pile, and soil type. Consideration should also be
given to the effects
on pile performance associated with the potential use of jack-up rigs and the formation
of future spud can depressions. FMMG can perform this additional evaluation when the geometry and
layout of the piles and spud can depressions are determined.
2.6 SEAFLOOR BEARING CAPACITY
2.6.1
Bearing Capacity
Ultimate bearing capacity equations for the surface soils were taken from a design method
developed by Skempton (1951) based on undisturbed shear strength. Equations are presented
in Section 3
for each PLET boring location and can be used to determine the ultimate bearing capacity for horizontal
tubular members and mud mats resting
on the seaftoor.
I
_@
Report No. 0201-6503
2-6
The ultimate bearing capacity of the near-seafloor soils is a function of the size and configuration of
the mud mats. A more detailed analysis of soil deformation and bearing capacity can be undertaken when
the actual configuration and loading conditions are determined.
For Working Stress Design (WSD), API
RP 2A recommends that a safety factor of at least 2.0 be
used with the ultimate bearing capacity determined from the above equations. For Load and Resistance
Factor Design (LRFD), a resistance factor of 0.67
is recommended. Also, an appropriate load factor should
be used to determine the jacket load in the LRFD design procedure. The ultimate bearing (load-carrying)
capacity of a horizontal tubular member or mud mat may be calculated
as the ultimate bearing capacity of
the soil multiplied by the base area of the mat or member. The equations for ultimate bearing capacity
presented above are based on static bearing capacity conditions. Significant vertical PLET velocities at the
time of its placement could cause large or uneven foundation settlements.
2.6.2 Degraded Bearing
Capacity
When a spud can penetrates into the seafloor, a cylindrical zone of remolded and lower (degraded)
shear strength
is created.
This zone of lower shear strength soil is called a spud can depression or
pockmark.
Mud mats located in, or near, existing depressions may have reduced (degraded) bearing
capacity. This degradation is a function of spudcan diameter, depth of penetration, distance between spud
can depression and mud mat, and soil type.
FMMG can perform this additional evaluation when the
geometry and layout
of the mud mats and' spudcan depressions have been determined.
2.7 PILE INSTALLATION CONSIDERATIONS
Pile driving problems are not expected at these boring sites.
The information
in this site
investigation suggests that the piles can likely be driven with a properly sized hammer to a sufficient depth
in the stratigraphies, presented in Section 3, to achieve the desired pile capacity. A pile drivability analysis
can be used to evaluate the proper hammer-pile system. Unfavorable soil conditions
or driving eqUipment
problems may prevent piles from being driven to the desired penetration. Interruptions
in driving should be
as short as possible to reduce set-up of the soil around the piles. Supplementary installation procedures, if
necessary, should be applied under close engineering supervision to determine the impact
of the
procedures
on pile capacity.
2.B SERVICE WARRANTY
The section entitled "Service Warranty" at the end
of Appendix B outlines the limitations and
constraints
of this report in terms of a range of considerations including, but not limited to, its purpose, its
scope, the data
on which it is based, its use by third parties, possible future changes in design procedures
and possible changes
in the conditions at the site with time. This section represents a clear description of
the constraints, which apply to all reports issued by FMMG. It should
be noted that the Service Warranty
does not
in any way supersede the terms and conditions of the contract between FMMG and the Client.
I
Report No. 0201-6503
2-7
-@------~-----------------
I
I
~
1
~
00
..!!i
m
I
D
I~
, i!i
2
m
m
D
0
x =
3,256,400ft
x =
3,261,400ft
x =
3,266,400ft
Y
=
262,500 ft
N
Block A-56
Galveston Area
~
Y
=
257,500 ft
..........
Offshore
•
Terminal
I
/
"
\
Y =
252,500
ft
I SPM #1 PLET \
SPM #1
Anch~
Leg #2£
I
\
1,470 ftl
............
,/
Y =
247,500 ft
Projection: Texas South Central Zone Coordinates
PLAN OF BORINGS
SPMJRAnchof Leg #6
.,
......
I
/
...
\
I
SPM #2 PLET \
\
~
I
\
1,470ft~
....
,/
.... _ ....
Texas Offshore Port System
Block A-56, Galveston Area
_@HeportNo. 0201-6503
PLATE
2-1
TERMS AND SYMBOLS USED ON BORING LOG
SOIL TYPES
SAMPLER TYPES
[tnd
m
Siit
~Clay
~GraVel
c:lJDebriS
~Llner
~In
Situ
.....
••
6.6.'1
•
~Thin-
Walled
Test
Tube
[j]Silly
mSandY
~SandY
~peator
9,.V"
Coral
. Sand
. Silt
. Clay
Highly
•
Organic
••
~Piston
~Clayey
mClayey
m
Silly
I
Rock
~Shell
~ROCk
~NO
•
Sand
Silt
Clay
..
..
Core
Recovery
SOIL GRAIN SIZE
u.s. STANDARD SIEVE
S"
3"
314"
10
40
200
COBBLES
GRAVEL
SAND
SILT
CLAY
COARSE
FINE
COARSE
MEDIUM
FINE
152
76.2
19.1
4.76
2.00
0.420
0.074
0,002
SOil GRAIN SIZE IN MILLIMETERS
STRENGTH OF COHESIVE SOILS(1)
Undrained
DENSITY OF GRANULAR SOILS
2,3)
Consistency
Very Soft..................................................
Soft............................................................
Finn...........................................................
Shear Strength,
Kips Per Sq Ft
Descriptive
Term
Very Loose.................................................
loose..............................................................
Medium Dense.................................................
'"'Relative
Density.
%
less than 15
15 to 35
35
to 65
StilL.........................................................
Very Stiff....................................................
Hard.....................................................
less Ihan 0.25
0.25 to 0.50
0.50 to 1.00
1.00
to 2.00
2.00
to 4.00
greater than 4.00
Dense.............................................................
65 to 85
Very Dense............................................
greater than 85
*Estimated from sampler driving record
SOIL STRUCTURE(1)
Slickensided..........................
Having planes of weakness lhal appear slick and glossy. The degree of slickensided ness depends
upon the spacing
of slickensides and the ease of breaking along these planes.
Fissured...............................:
Containing shrinkage
or relief cracks, often filled with fine sand or silt, usually more or less vertical.
Pocket............ ...................... Inclusion
of material of different texture that is smaller than the diameter of the sample.
Parting..................................
inclusion less than
1/8
inch thick extending through the sample.
Seam....................................
Inclusion
1/8
inch to 3 inches thick extending through the sample.
Layer....................................
Inclusion greater than 3 inches thick extending through the sample.
Laminated.............................
Soil
sample composed of alternating partings or seams of different soil types.
Interlayered...........................
Soil sample composed
of alternating layers of different soil types.
Intermixed.............................
Soil
sample composed of pockets of different soil types and layered or laminated structure is not
evident.
Calcareous............................
REFERENCES:
(1) ASTM D 2488
(2) ASCE Manual 56 (1976)
(3) ASTM D 2049
Having appreciable quantities of carbonate.
Information on each boring log is a compilation
of subsurface conditions and soil or rock
classifications obtained from the field
as well as from laboratory testing of samples. Strata have been
Interpreted by commonly accepted procedures.
The stratum lines on the log may be transitional and
approximate in nature. Water level measurements refer
only to those observed at the times and
places indicated in the text, and
may vary with time, geologic condition or construction activity.
I
Report No. 0201-6503
PLATE 2-2
-~----------------------------------
---------------------
«., LINE
52402
•
•
Y-260,000
L/Nr= 82401
".,.,.
,+
•
".
,
".
".
•
".
LINES211~"""
,
•
""
""
,-
,..
L'NE
:;2112 ...
~,..
,-
,
,",
""
•
,-
Y-255,000
-t
...
,"
'"
'"
"'..,.
UNE
8211 f
,
•
•
,.
-
'"
-
Y-250,000
-I
,.
,
.'
,.
•
..,
-
-
-
,.
..
•
,"
-t
,.
,.
,.
,.
,
~
,"
;
,"
•
,"
~
~
~
~
!
i~
~
iJ2!
Report No. 0201-6503
-0-9
•
•
,
•
,
+
,
,
-y
11 ••
11,.
""
,
""
""
,,"
""
"'0
,
•
•
-
r...
,-
,-
""
,-
""
+
,,.
,-
PM#21 LET
,-
,
,-
,-
""
•
•
,-
-
,-
',"
Of
shore T
rminal
t+
'"
'"
,..
'"
,.
,.
,.
...
SP
j\iI#1
PL
~T
••
•
SPM
~Ancl
or Leg j
2
+
'"
'"
'"
,.
'"
'"
II-
+
..,
,
."
,.
,.
..
,
..,
..,
.,
-
'"
-
-
-
-
'"
..
,
,
+
,
Fr-
,.
,.
p.
,.
,.
".
,"
,
•
,"
~
I
,.
i
,"
,
-
~
".
~
,,,
i
,.
,
-
~
"
~
~
~
i
,~
~
~
,
,
~
~
MAP OF SOIL BORINGS AND SUBBOTTOM PROFILE LINES
Texas Offshore Port System
Block A-56, Galveston Area
,
•
"00
""
•
•
""
•
"5O
SPM#2
,-
'""
."
'"
..
000
,.
-
,
-
-
,
,"
00
,.
,.
•
~
,
iii
~
~
i
,
"..
,-
o
,,,;
"'
N
~"
+
Anchor
,-
'"
,.
'"
.
-
,"
•
iii
,
"'
~
•
•
+
""
•
""
•
N
1
,-
""
~eg
#6
~
'-.
,-
+
'"
.
H--
'"
I-
+
-
•
'"
.
•
I--f-.
,"
"f-
,
,.
"
il
,
~
,"
~
,
PLATE
2-3
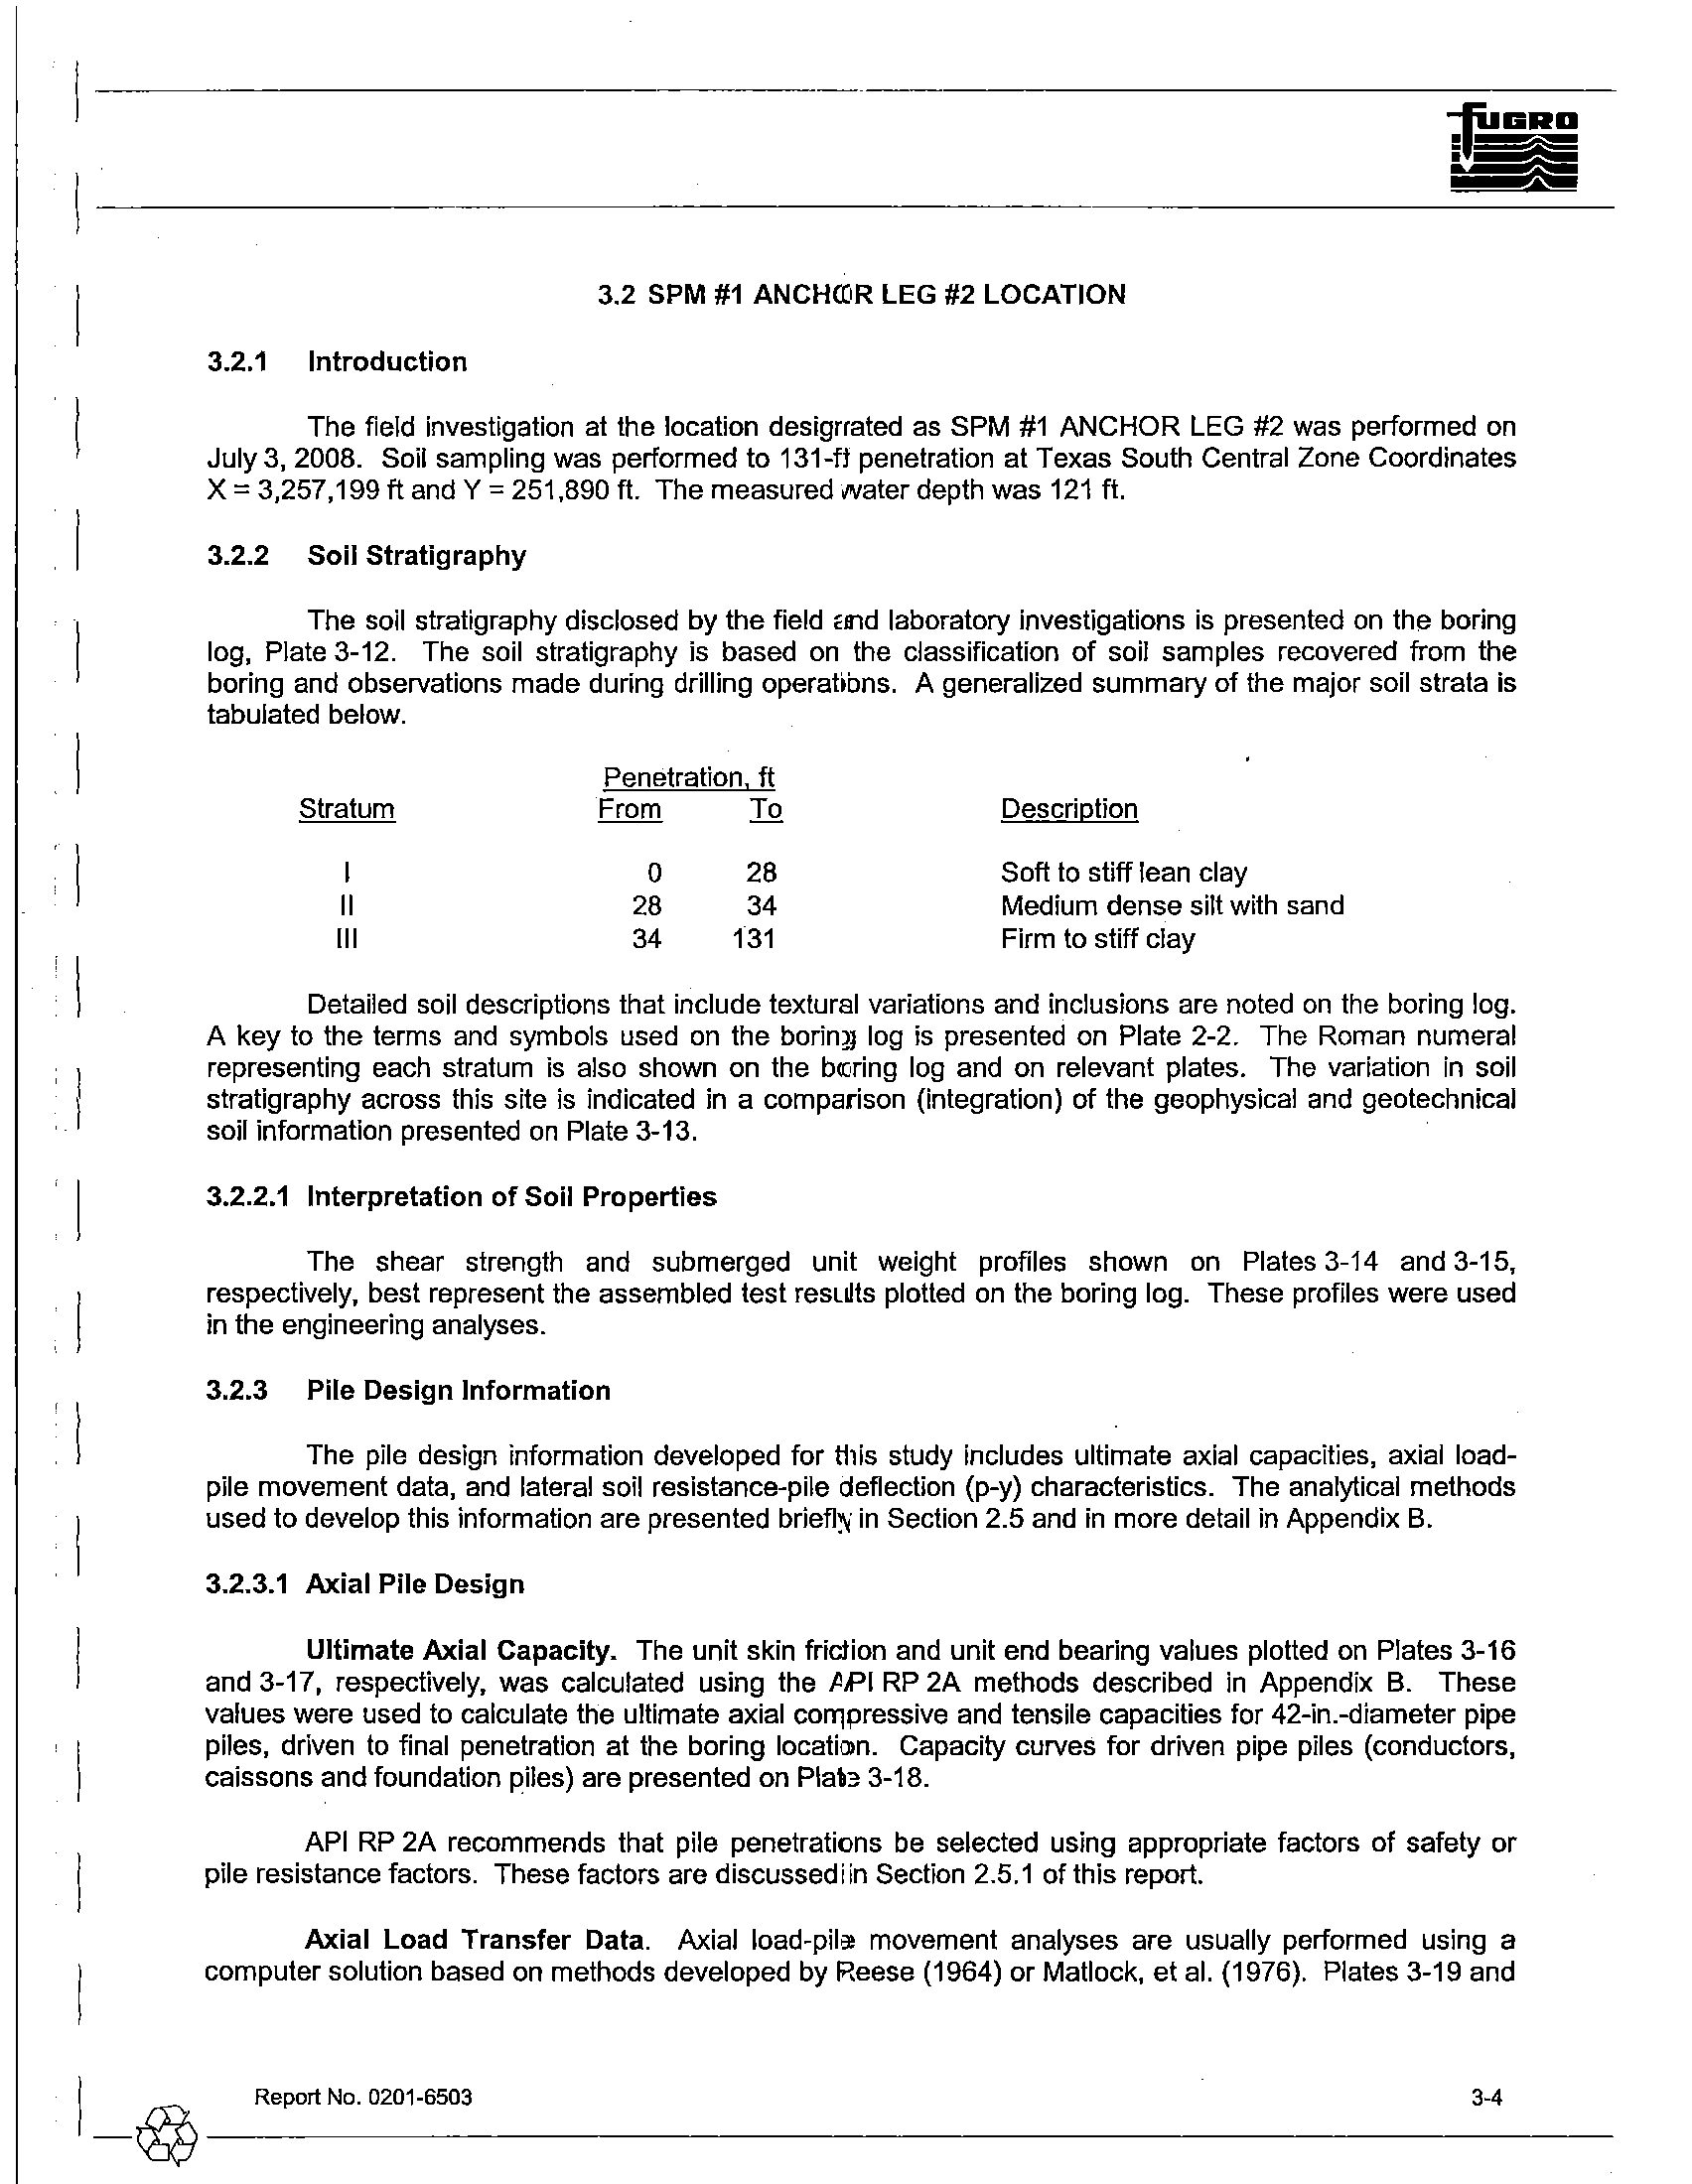
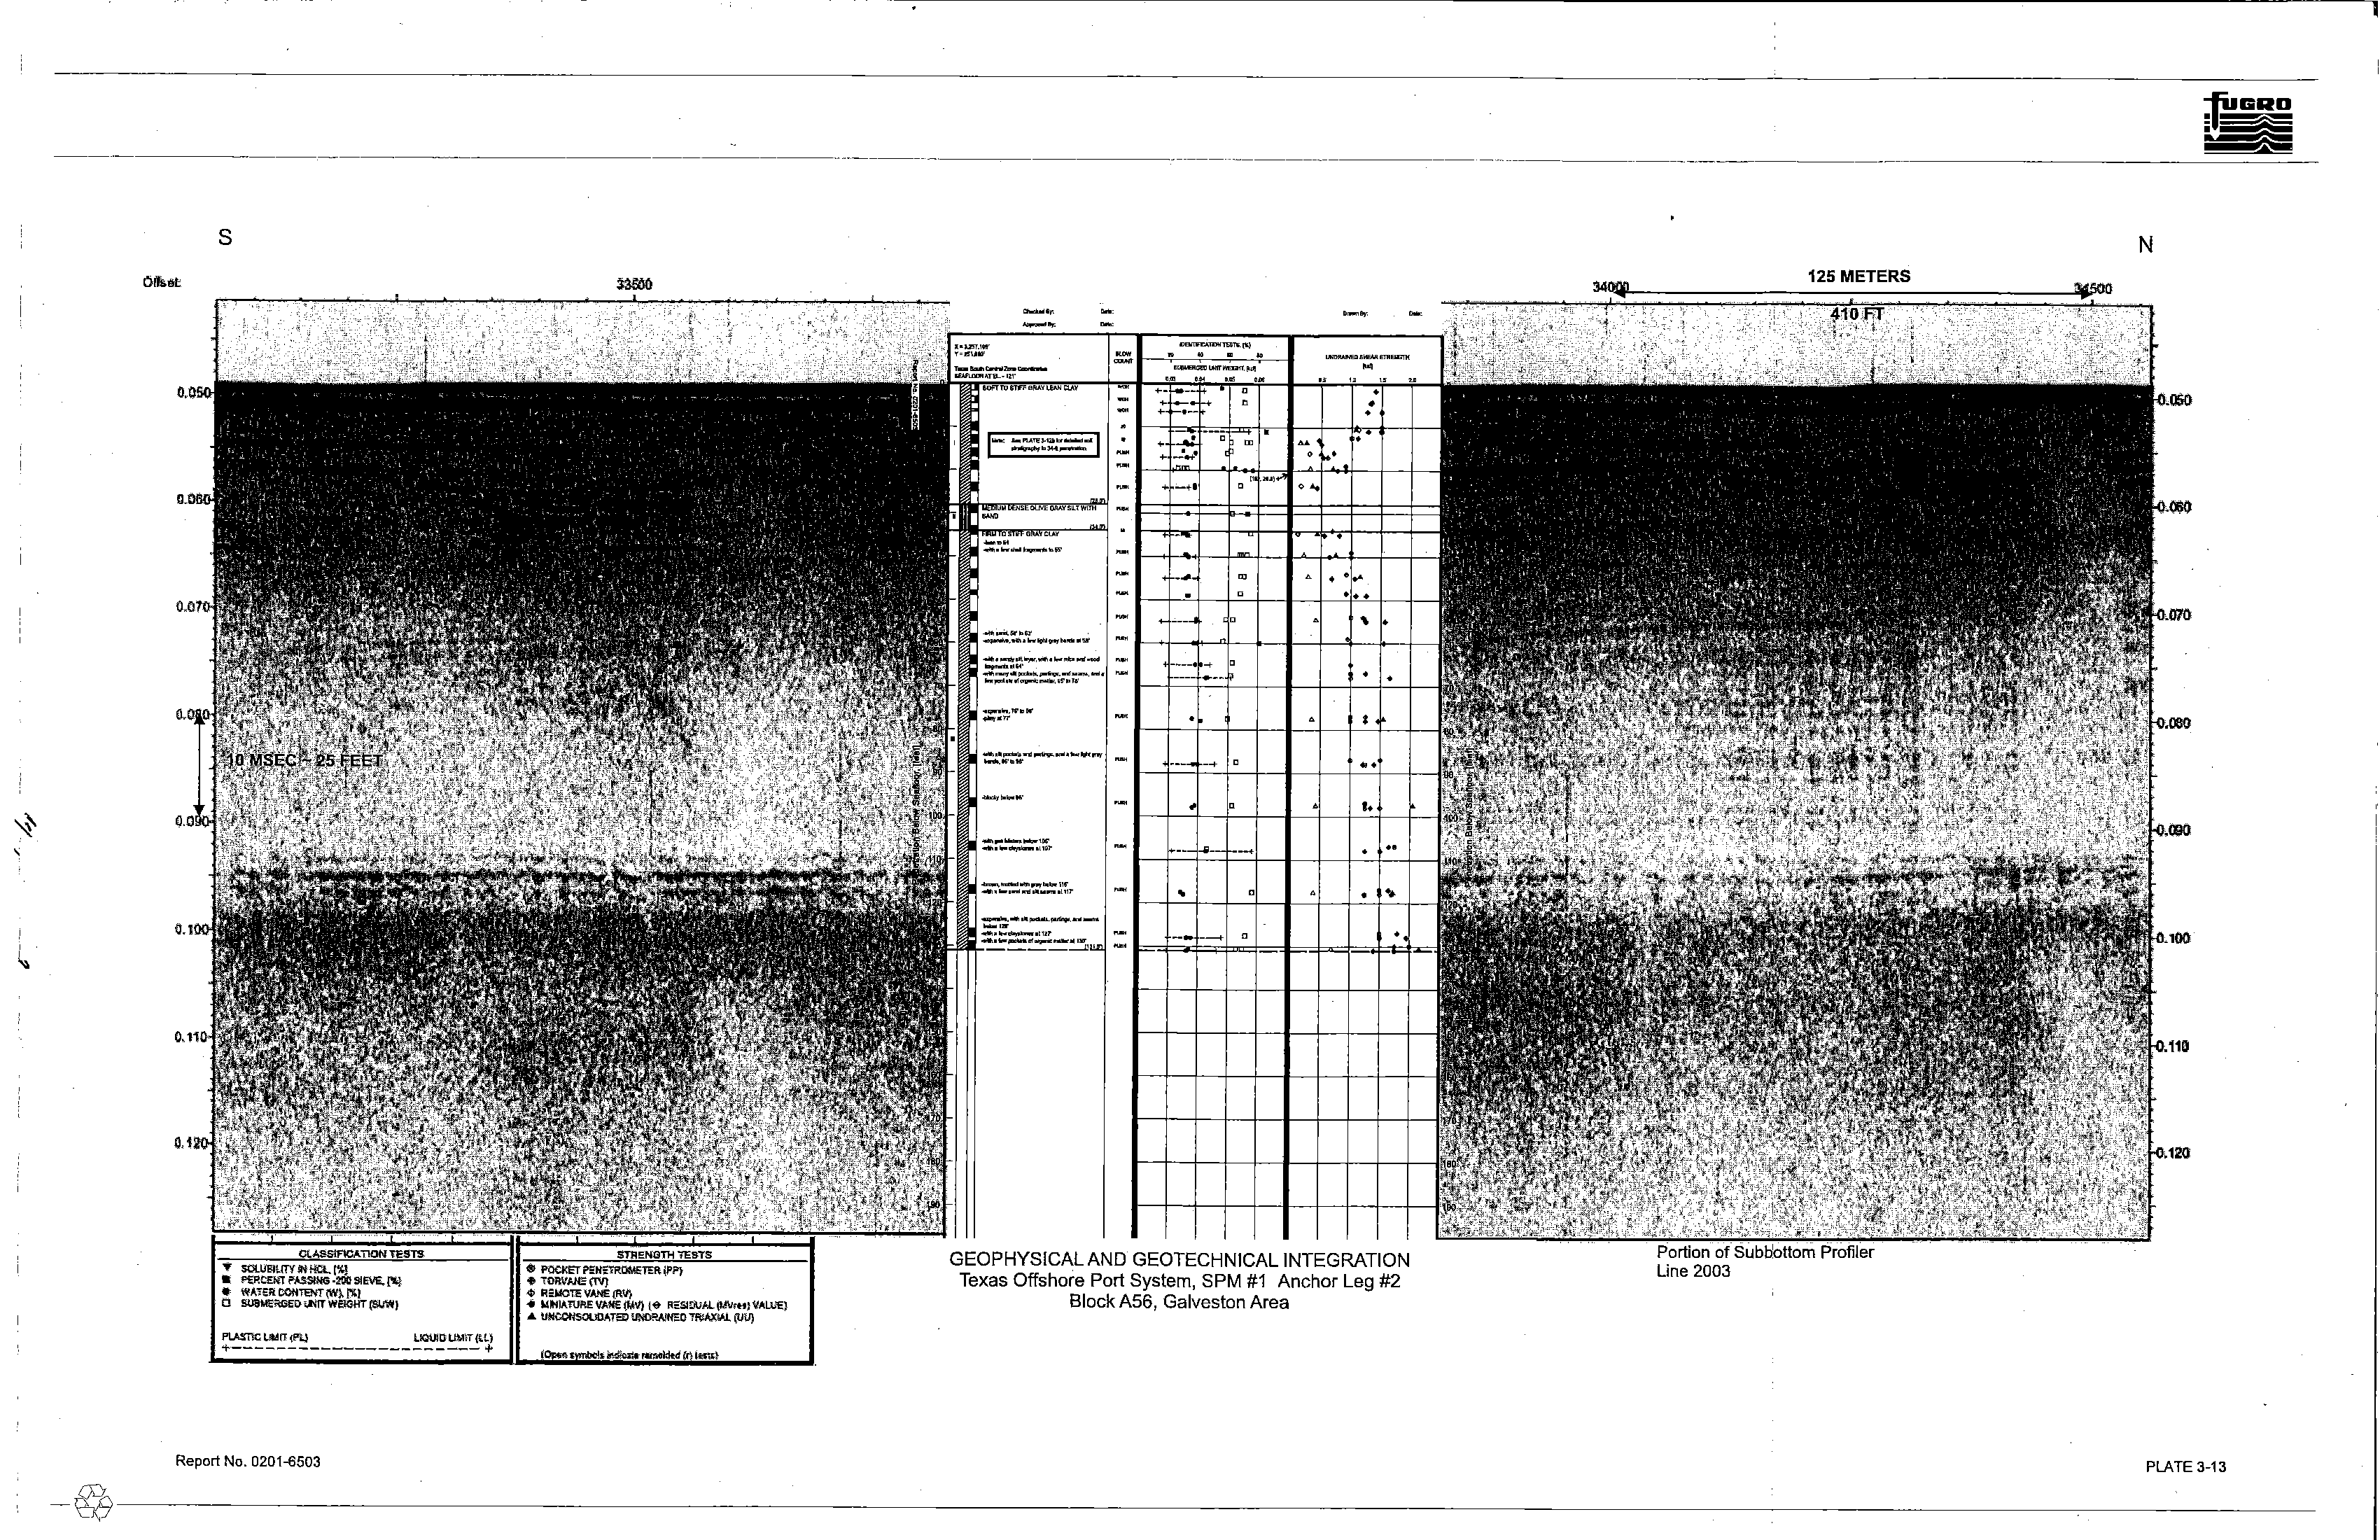
3.2 SPM #1 ANCHOR LEG #2 LOCATION
3.2.1
Introduction
The field investigation at the location designated as SPM #1 ANCHOR LEG #2 was performed on
July 3,2008. Soil sampling was performed to 131-ft penetration at Texas South Central Zone Coordinates
X
=
3,257,199 ft and Y
=
251,890 ft. The measured water depth was 121
ft.
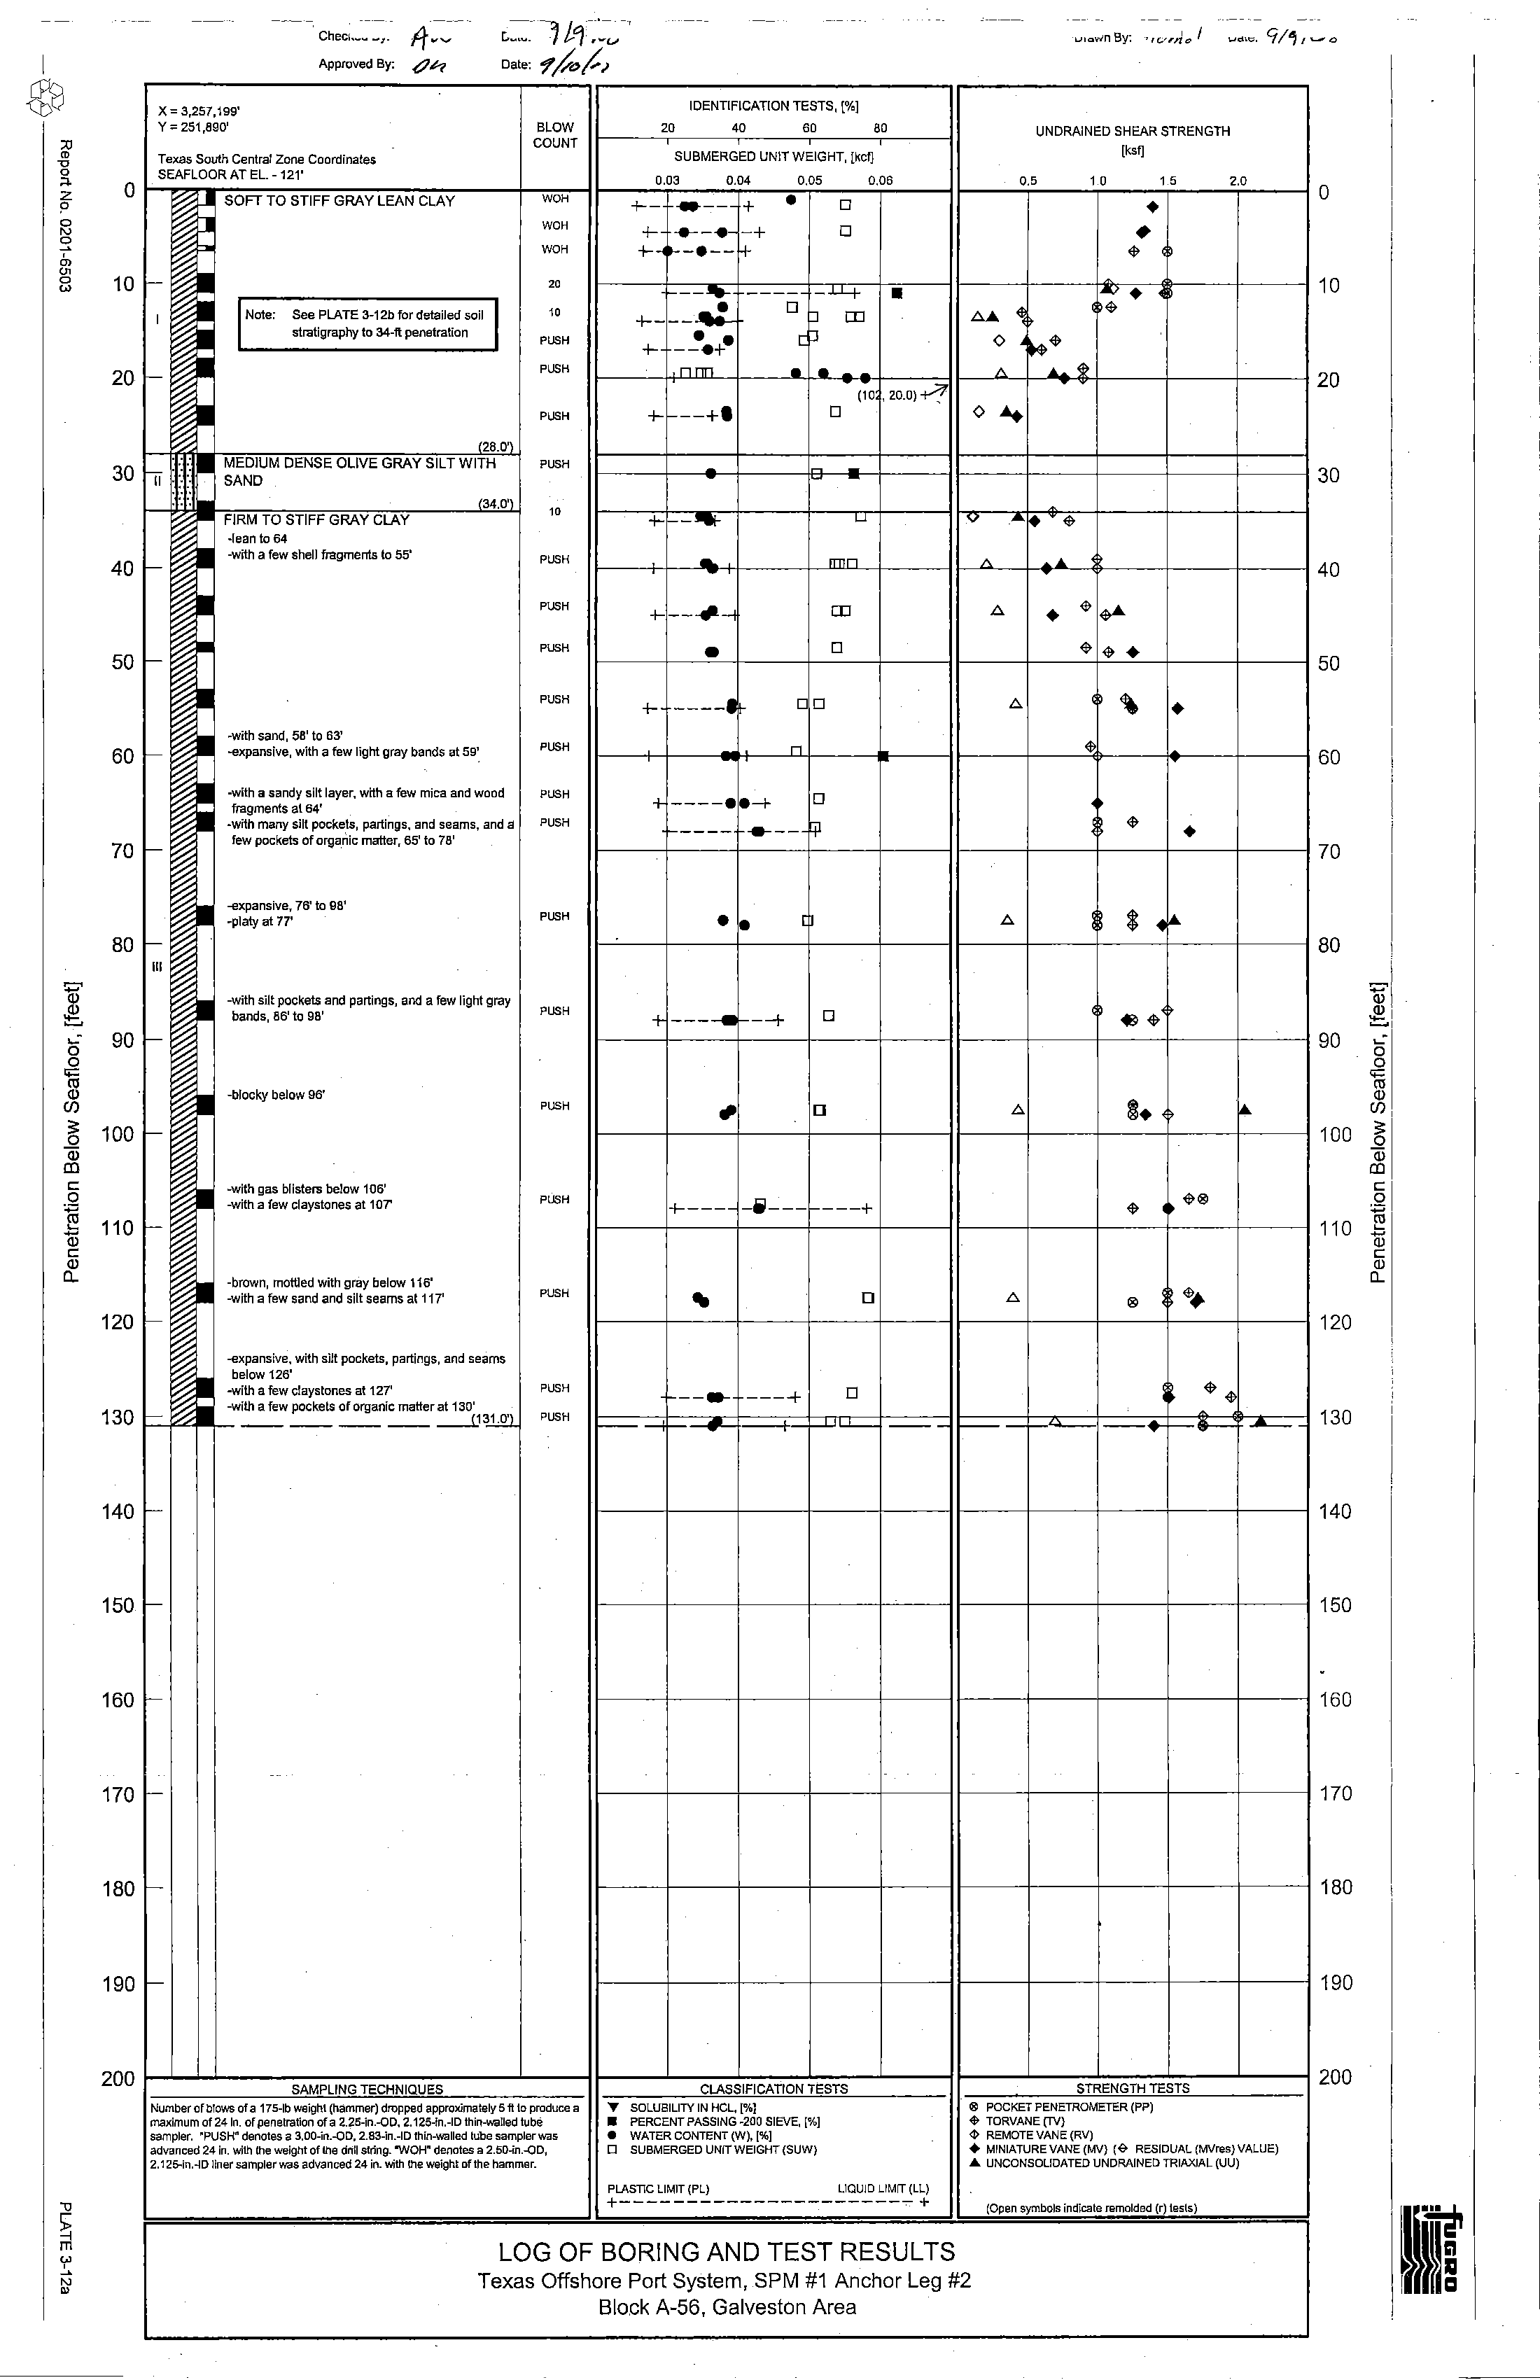
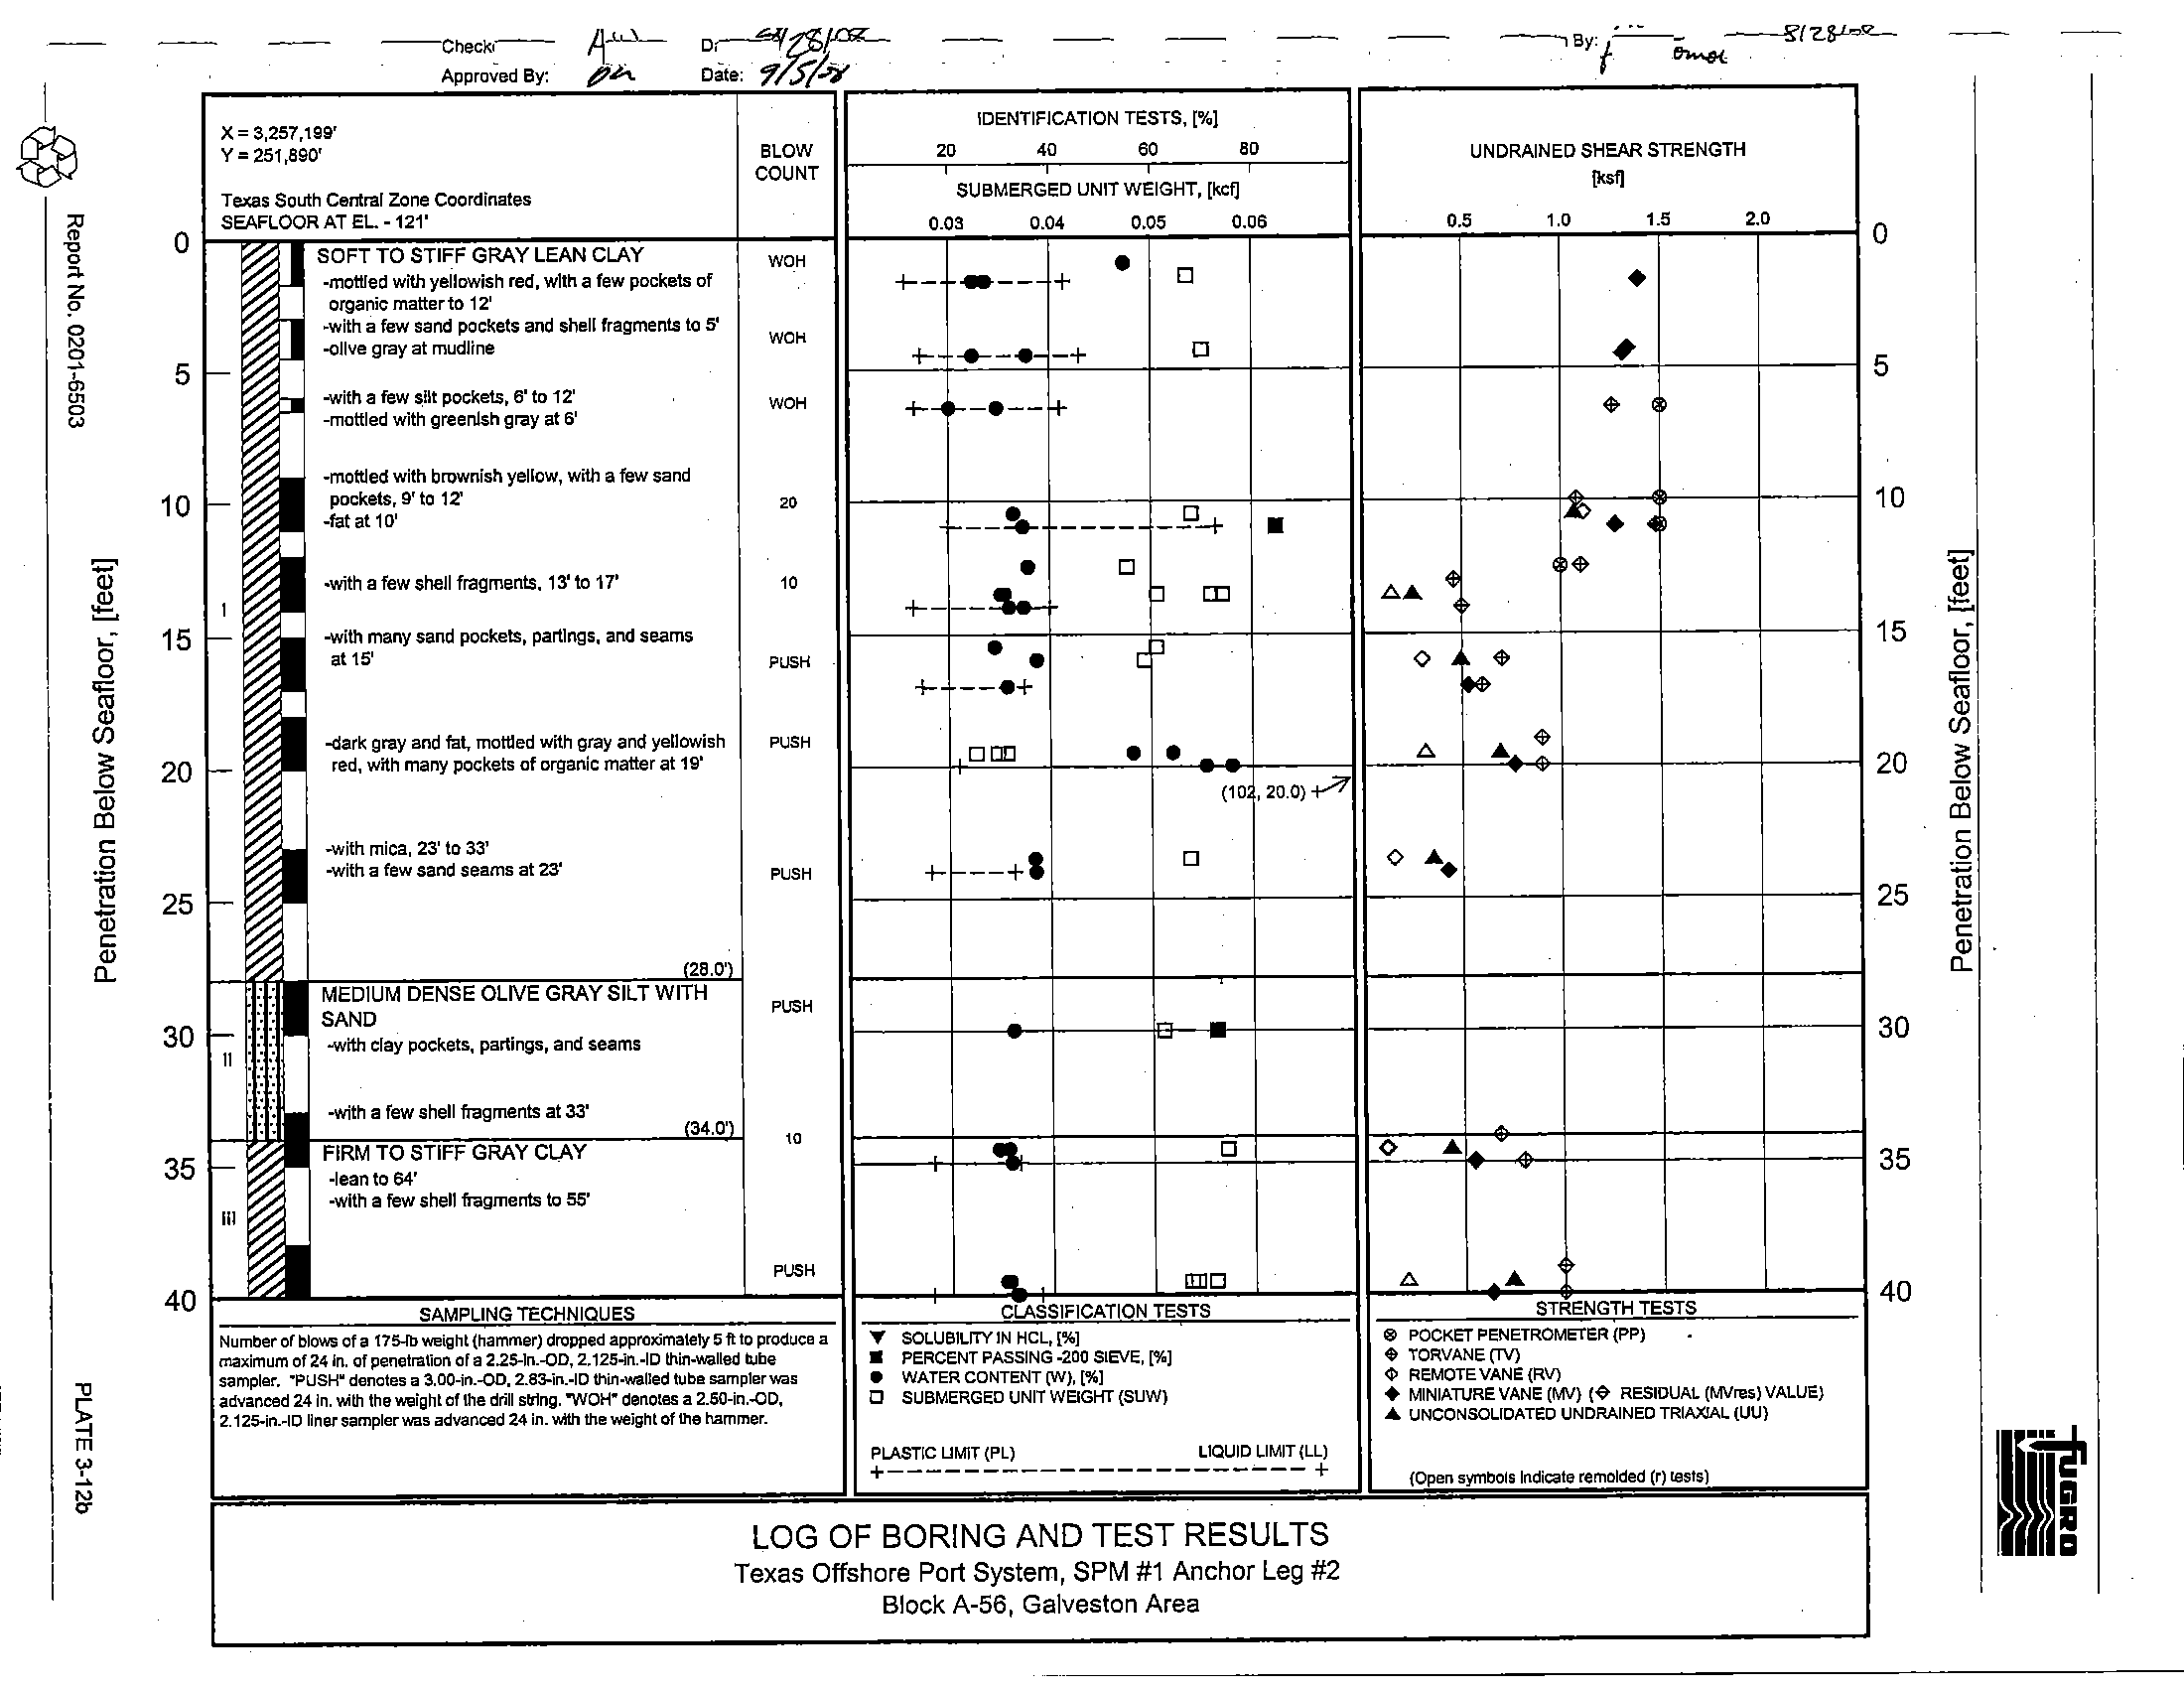
3.2.2
Soil Stratigraphy
The soil stratigraphy disclosed by the field and laboratory investigations is presented on the boring
log, Plate 3-12. The soil stratigraphy is based
on the classification of soil samples recovered from the
boring and observations made during drilling operations. A generalized summary of the major soil strata is
tabulated below.
Stratum
I
II
III
Penetration, ft
From
To
o
28
34
28
34
131
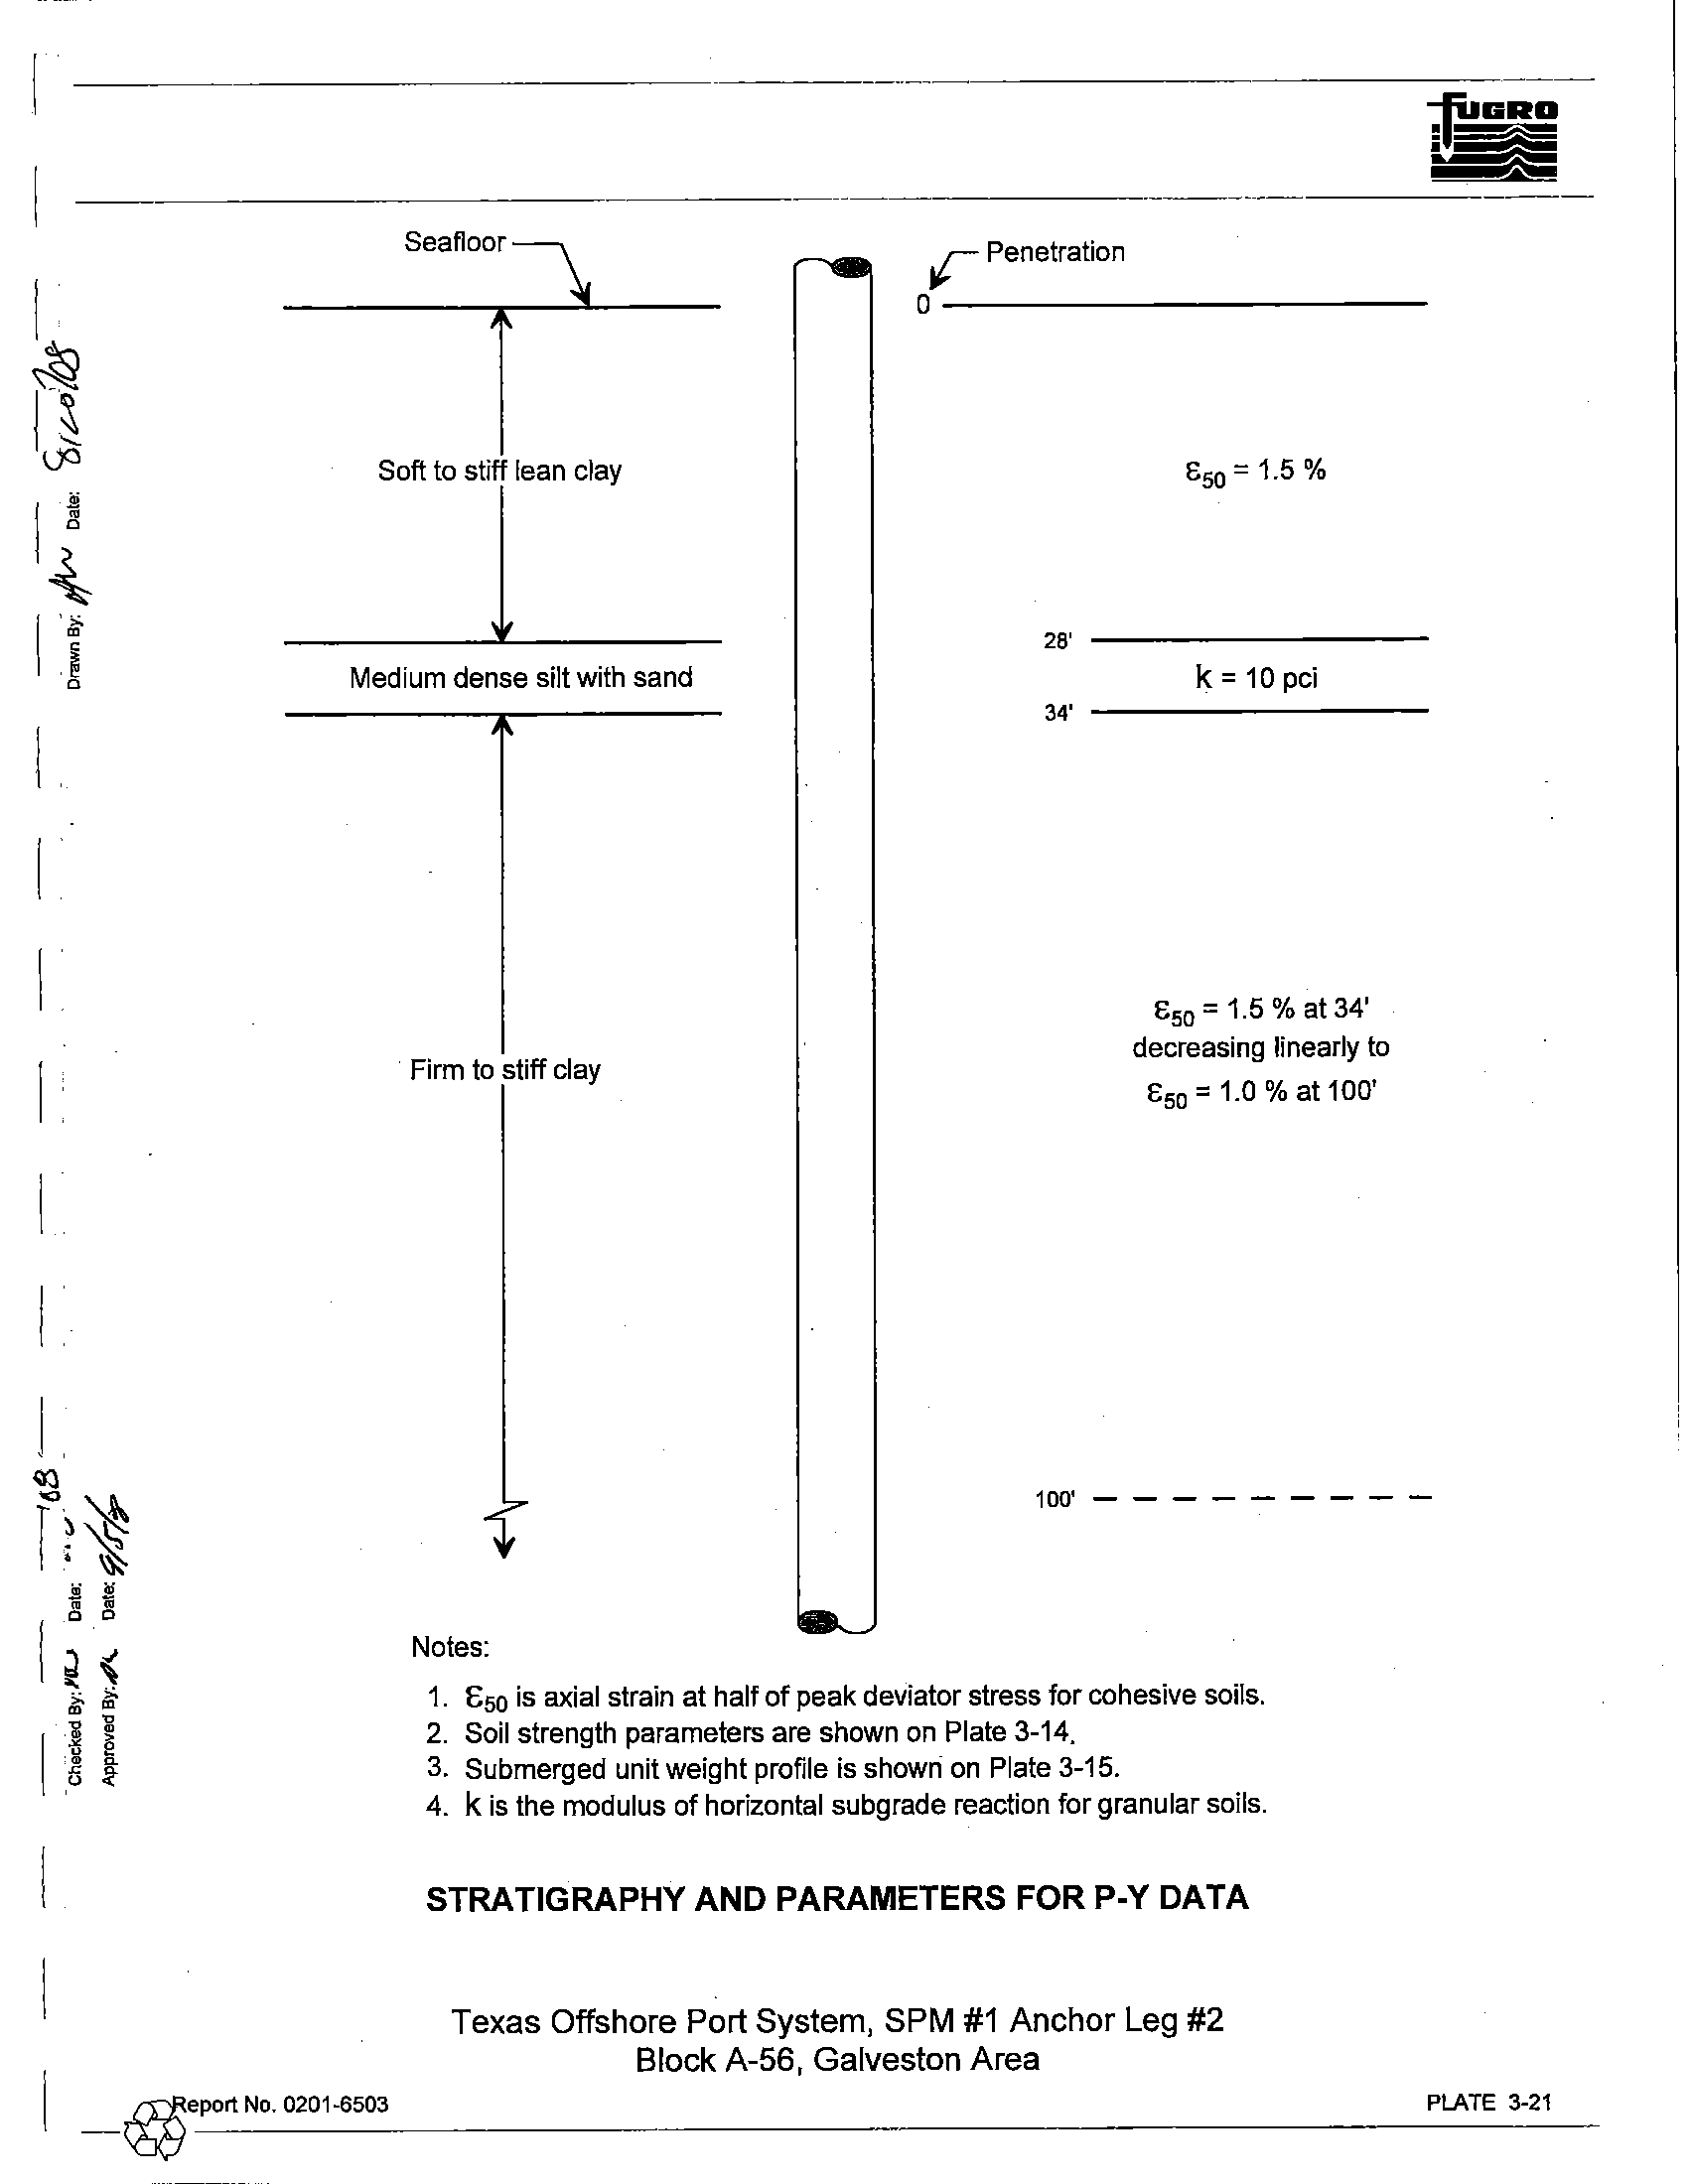
Description
Soft to stiff lean clay
Medium dense silt with sand
Firm to stiff clay
Detailed soil descriptions that include textural variations and inclusions are noted
on the boring log.
A key to the terms
and symbols used on the boring log is presented on Plate 2-2. The Roman numeral
representing each stratum
is also shown on the boring log and on relevant plates. The variation in soil
stratigraphy across this site
is indicated in a comparison (integration) of the geophysical and geotechnical
soil information presented
on Plate 3-13.
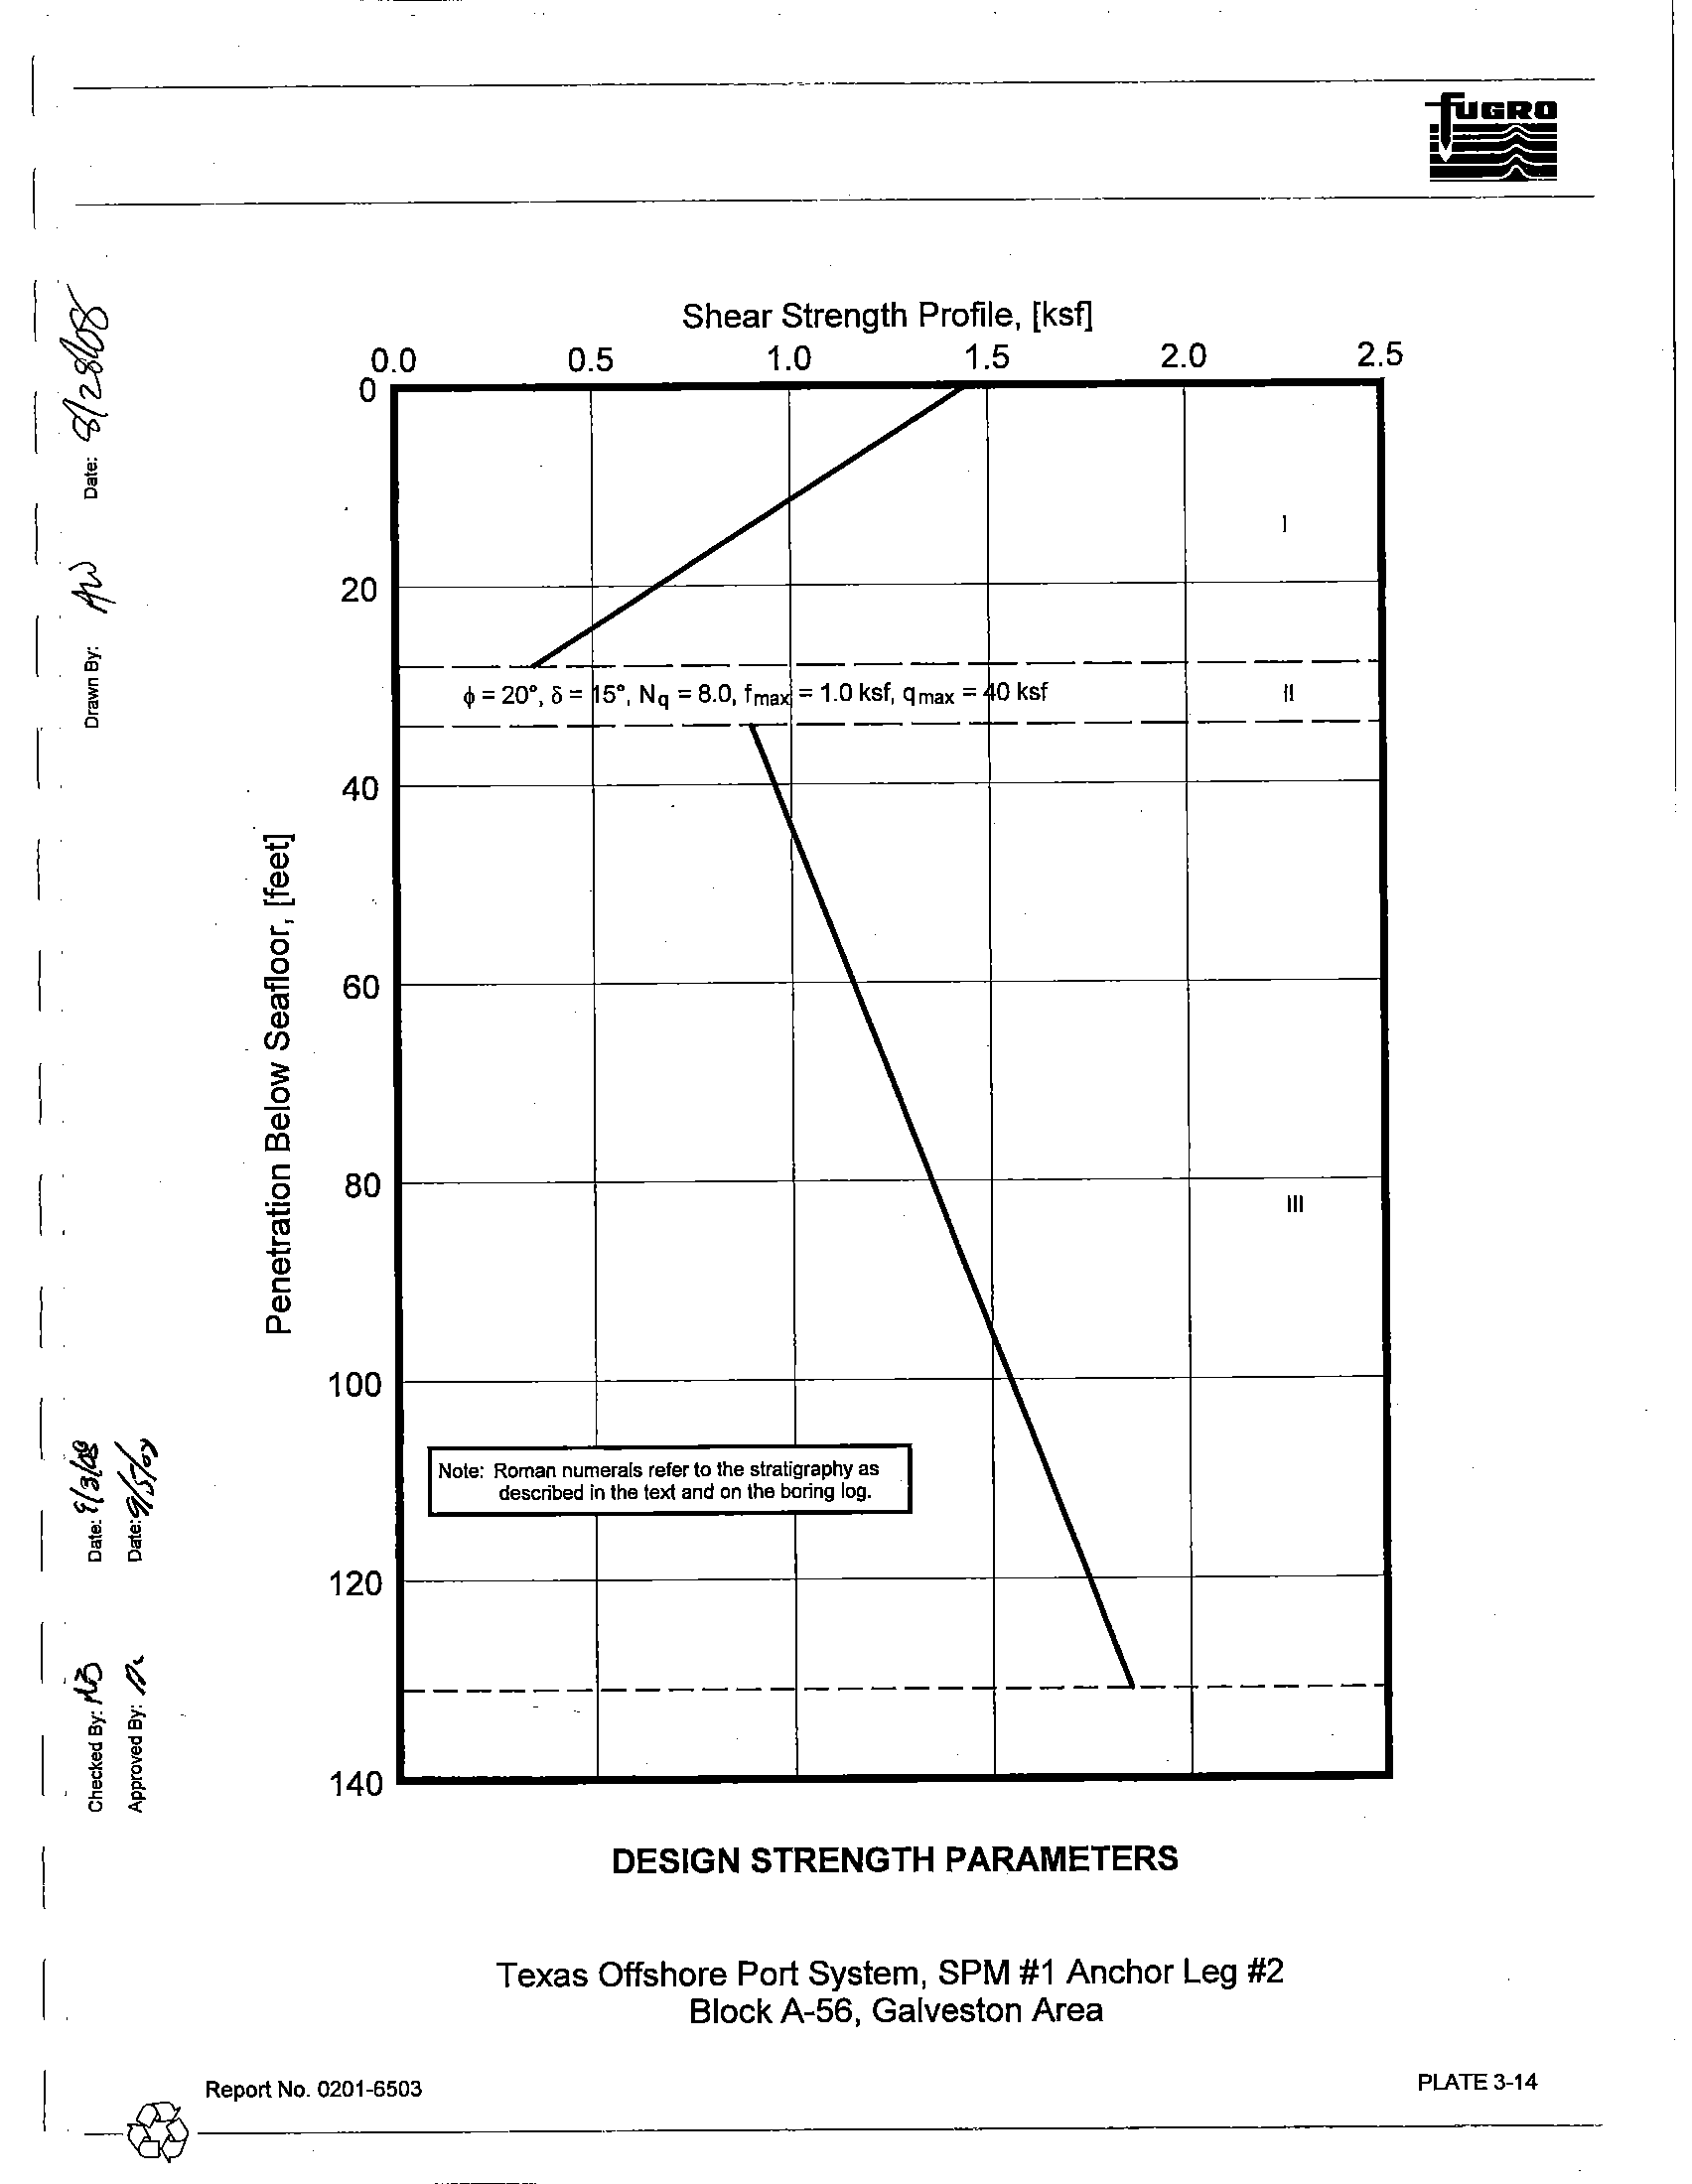
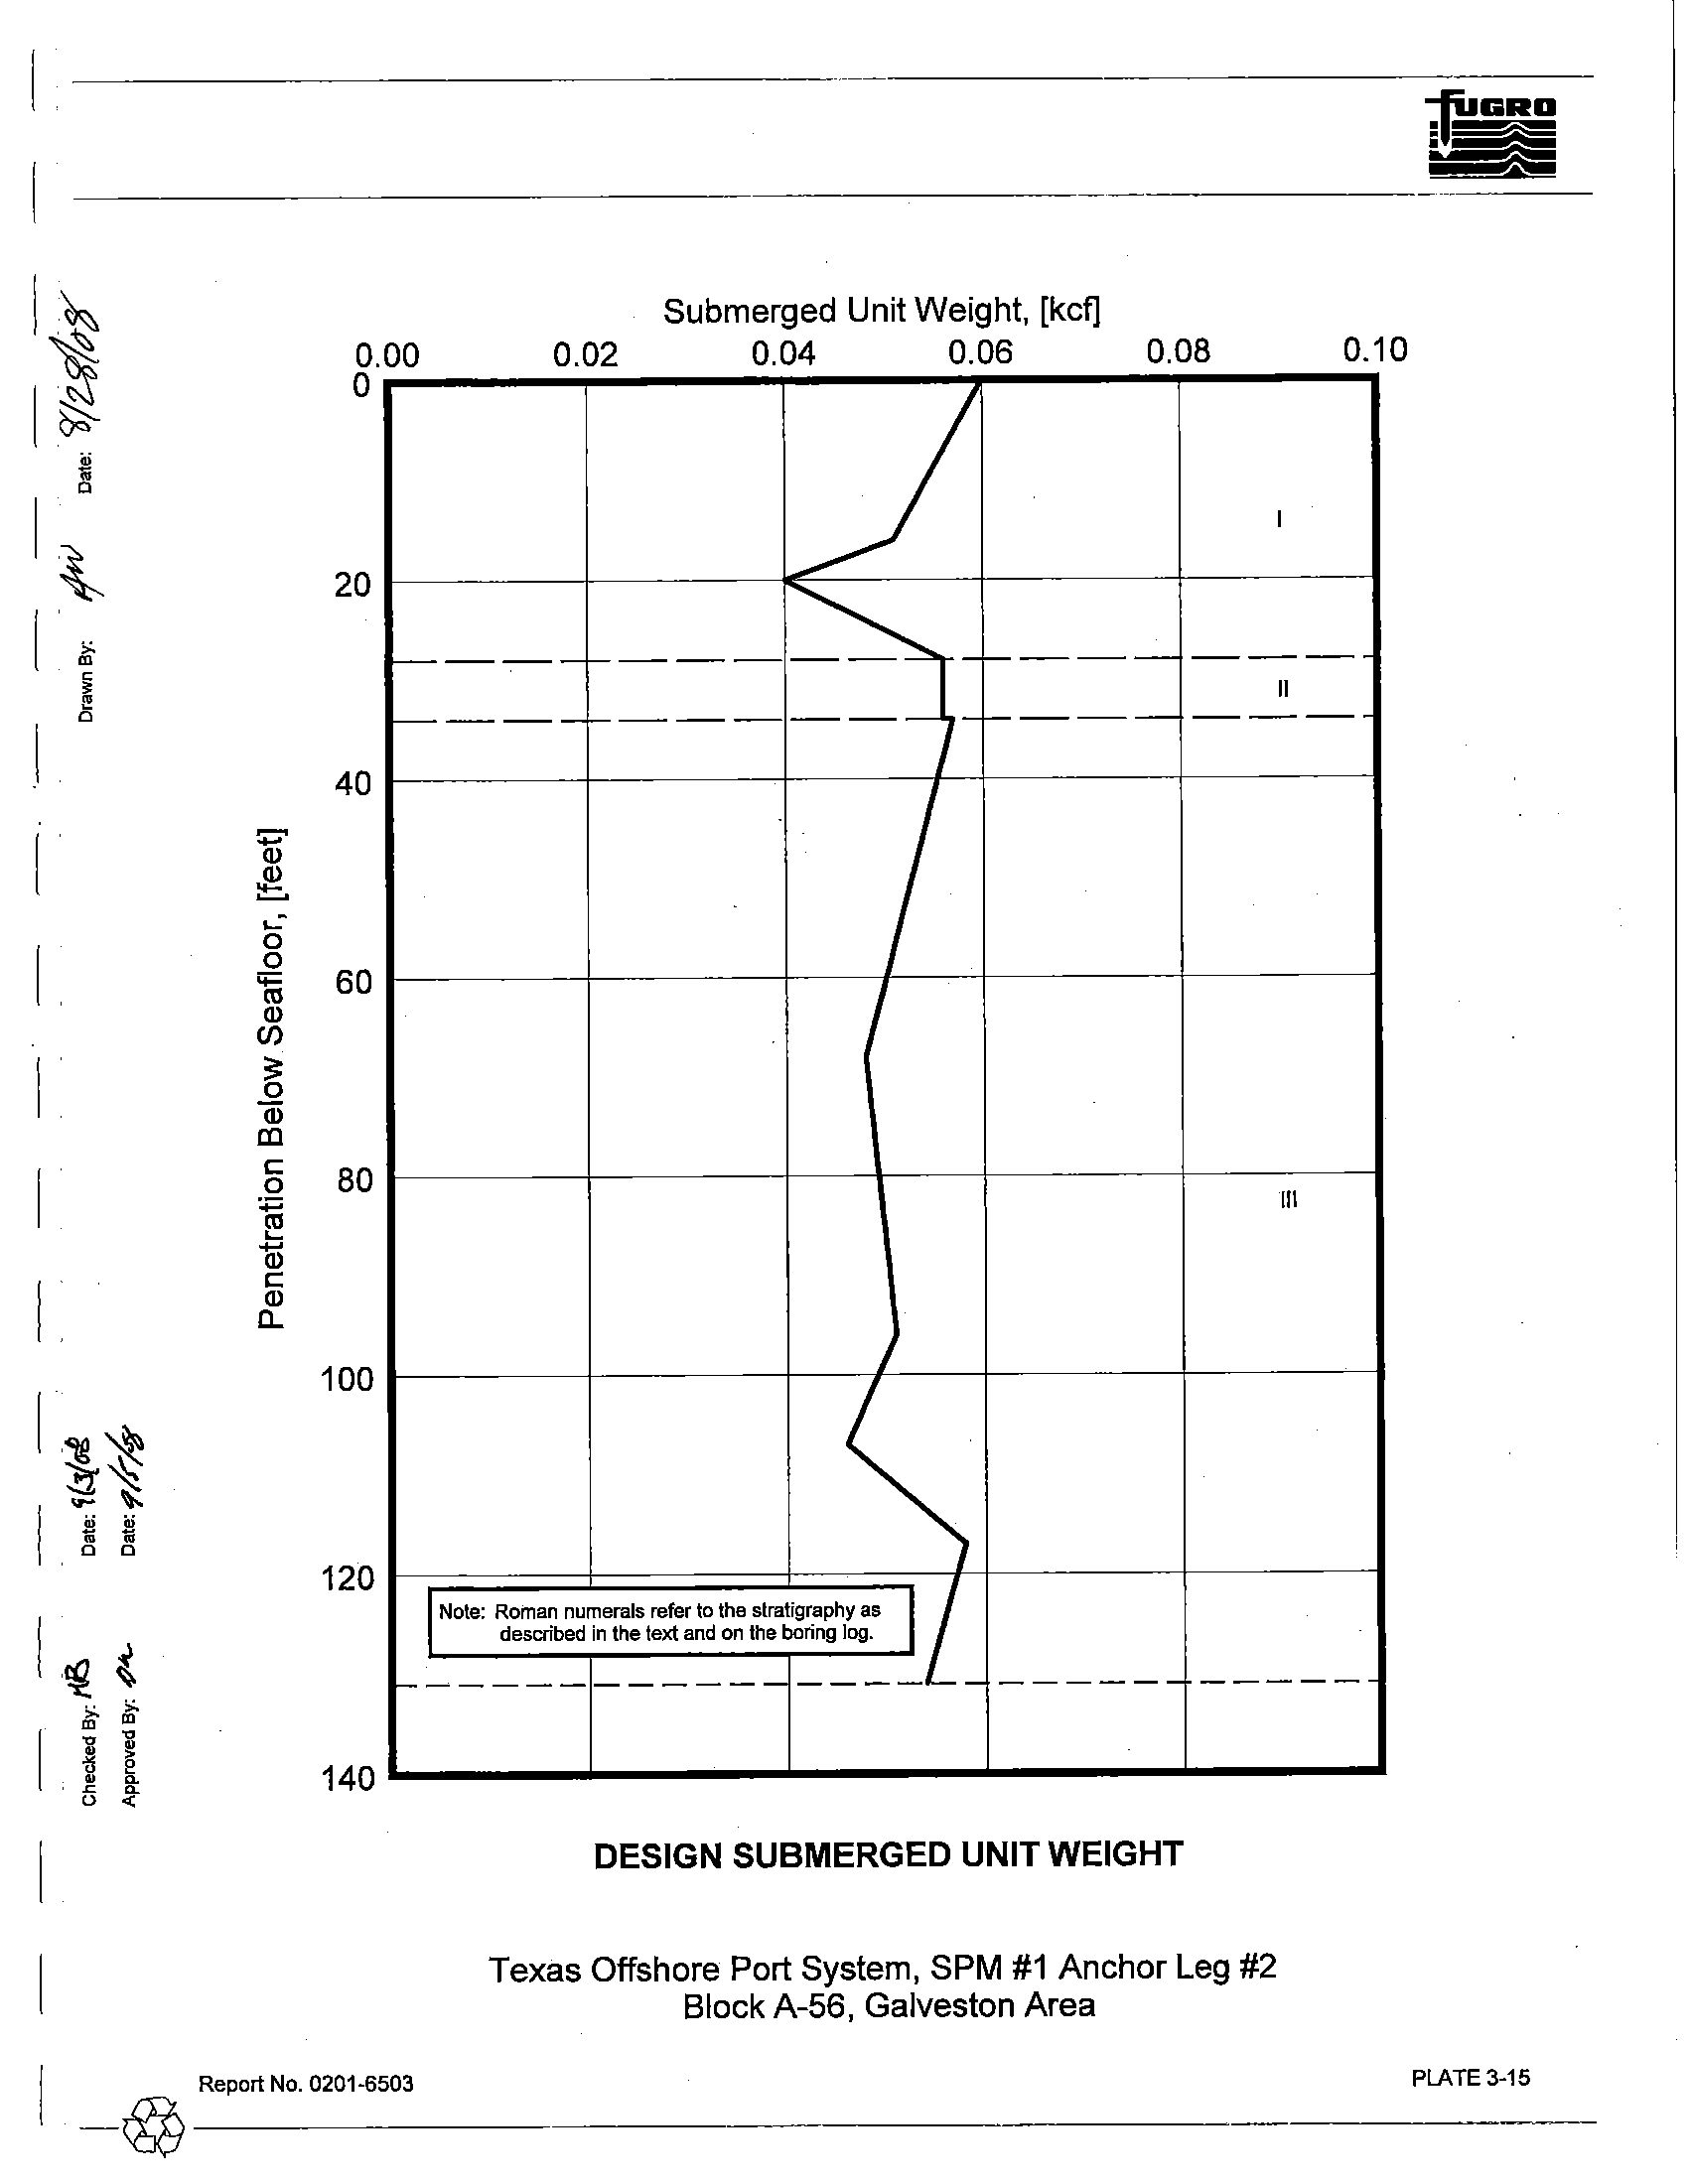
3.2.2.1 Interpretation
of Soil Properties
The shear strength and submerged unit weight profiles shown
on Plates 3-14 and 3-15,
respectively, best represent the assembled test results plotted
on the boring log. These profiles were used
in the engineering analyses.
3.2.3
Pile Design Information
The pile design information developed for this study includes ultimate axial capacities, axial load-
pile movement data, and lateral soil resistance-pile deflection (p-y) characteristics. The analytical methods
used to develop this information are presented briefly
in Section 2.5 and in more detail in Appendix B.
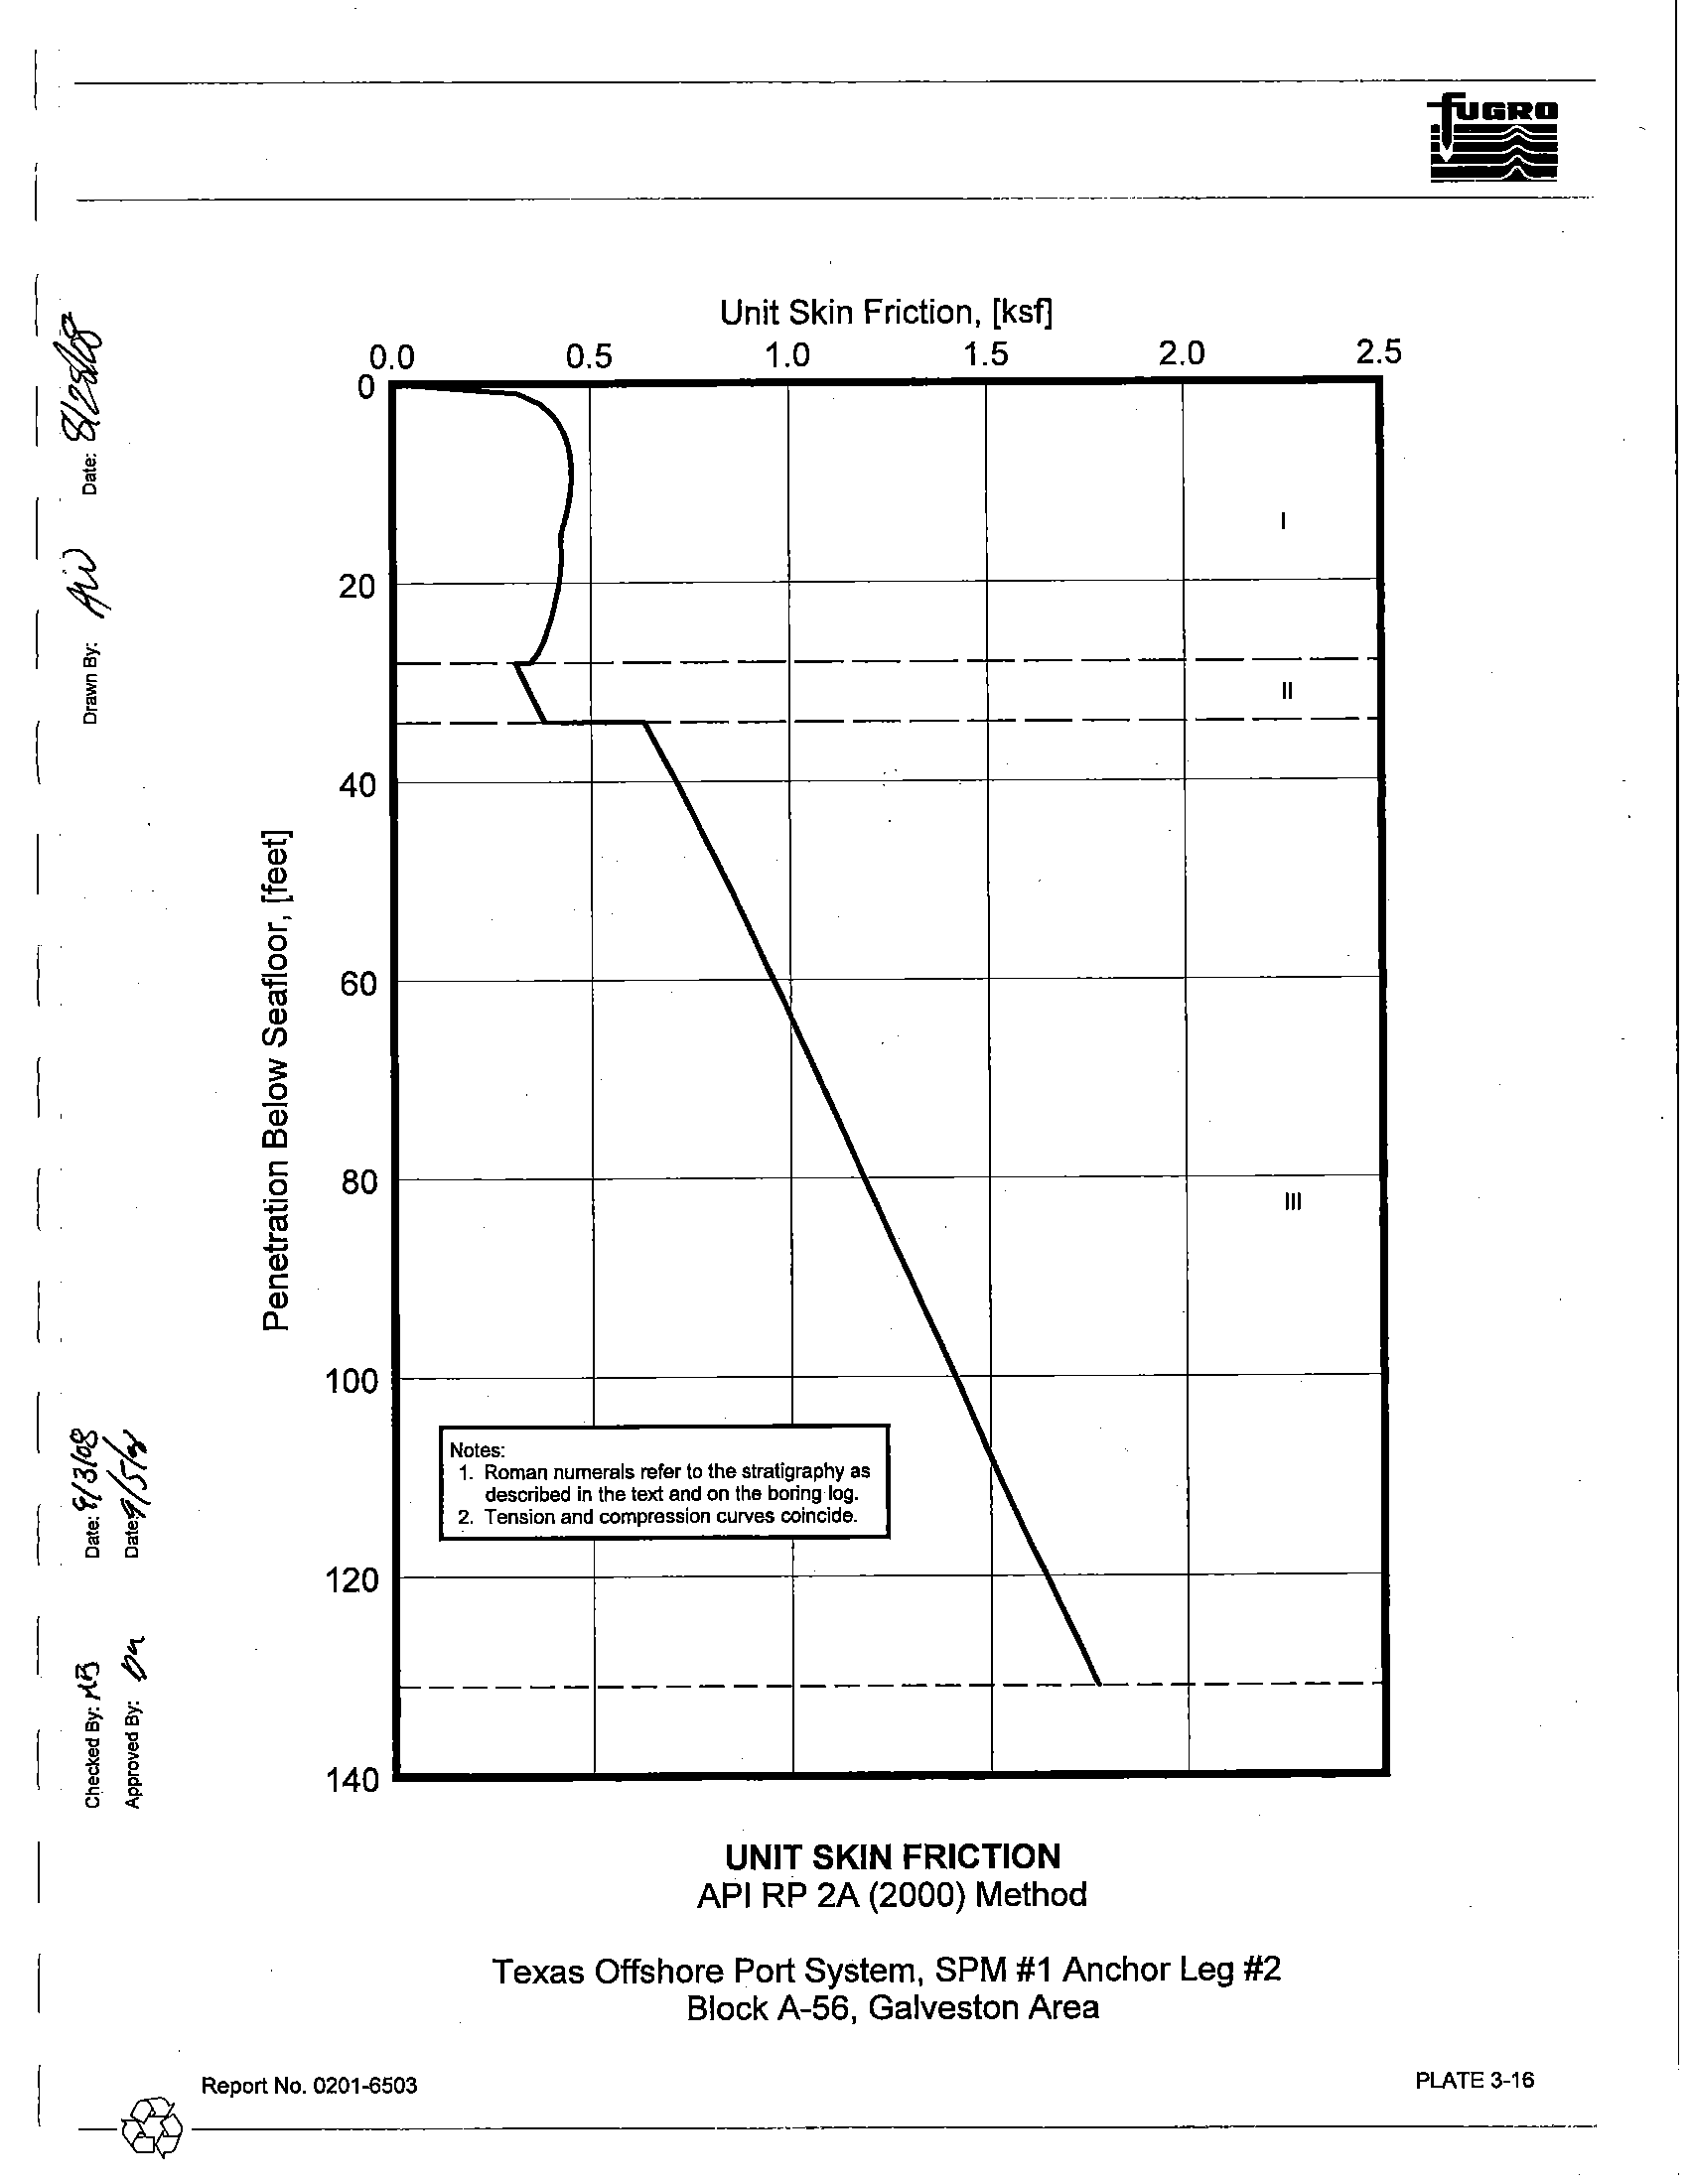
3.2.3.1 Axial Pile Design
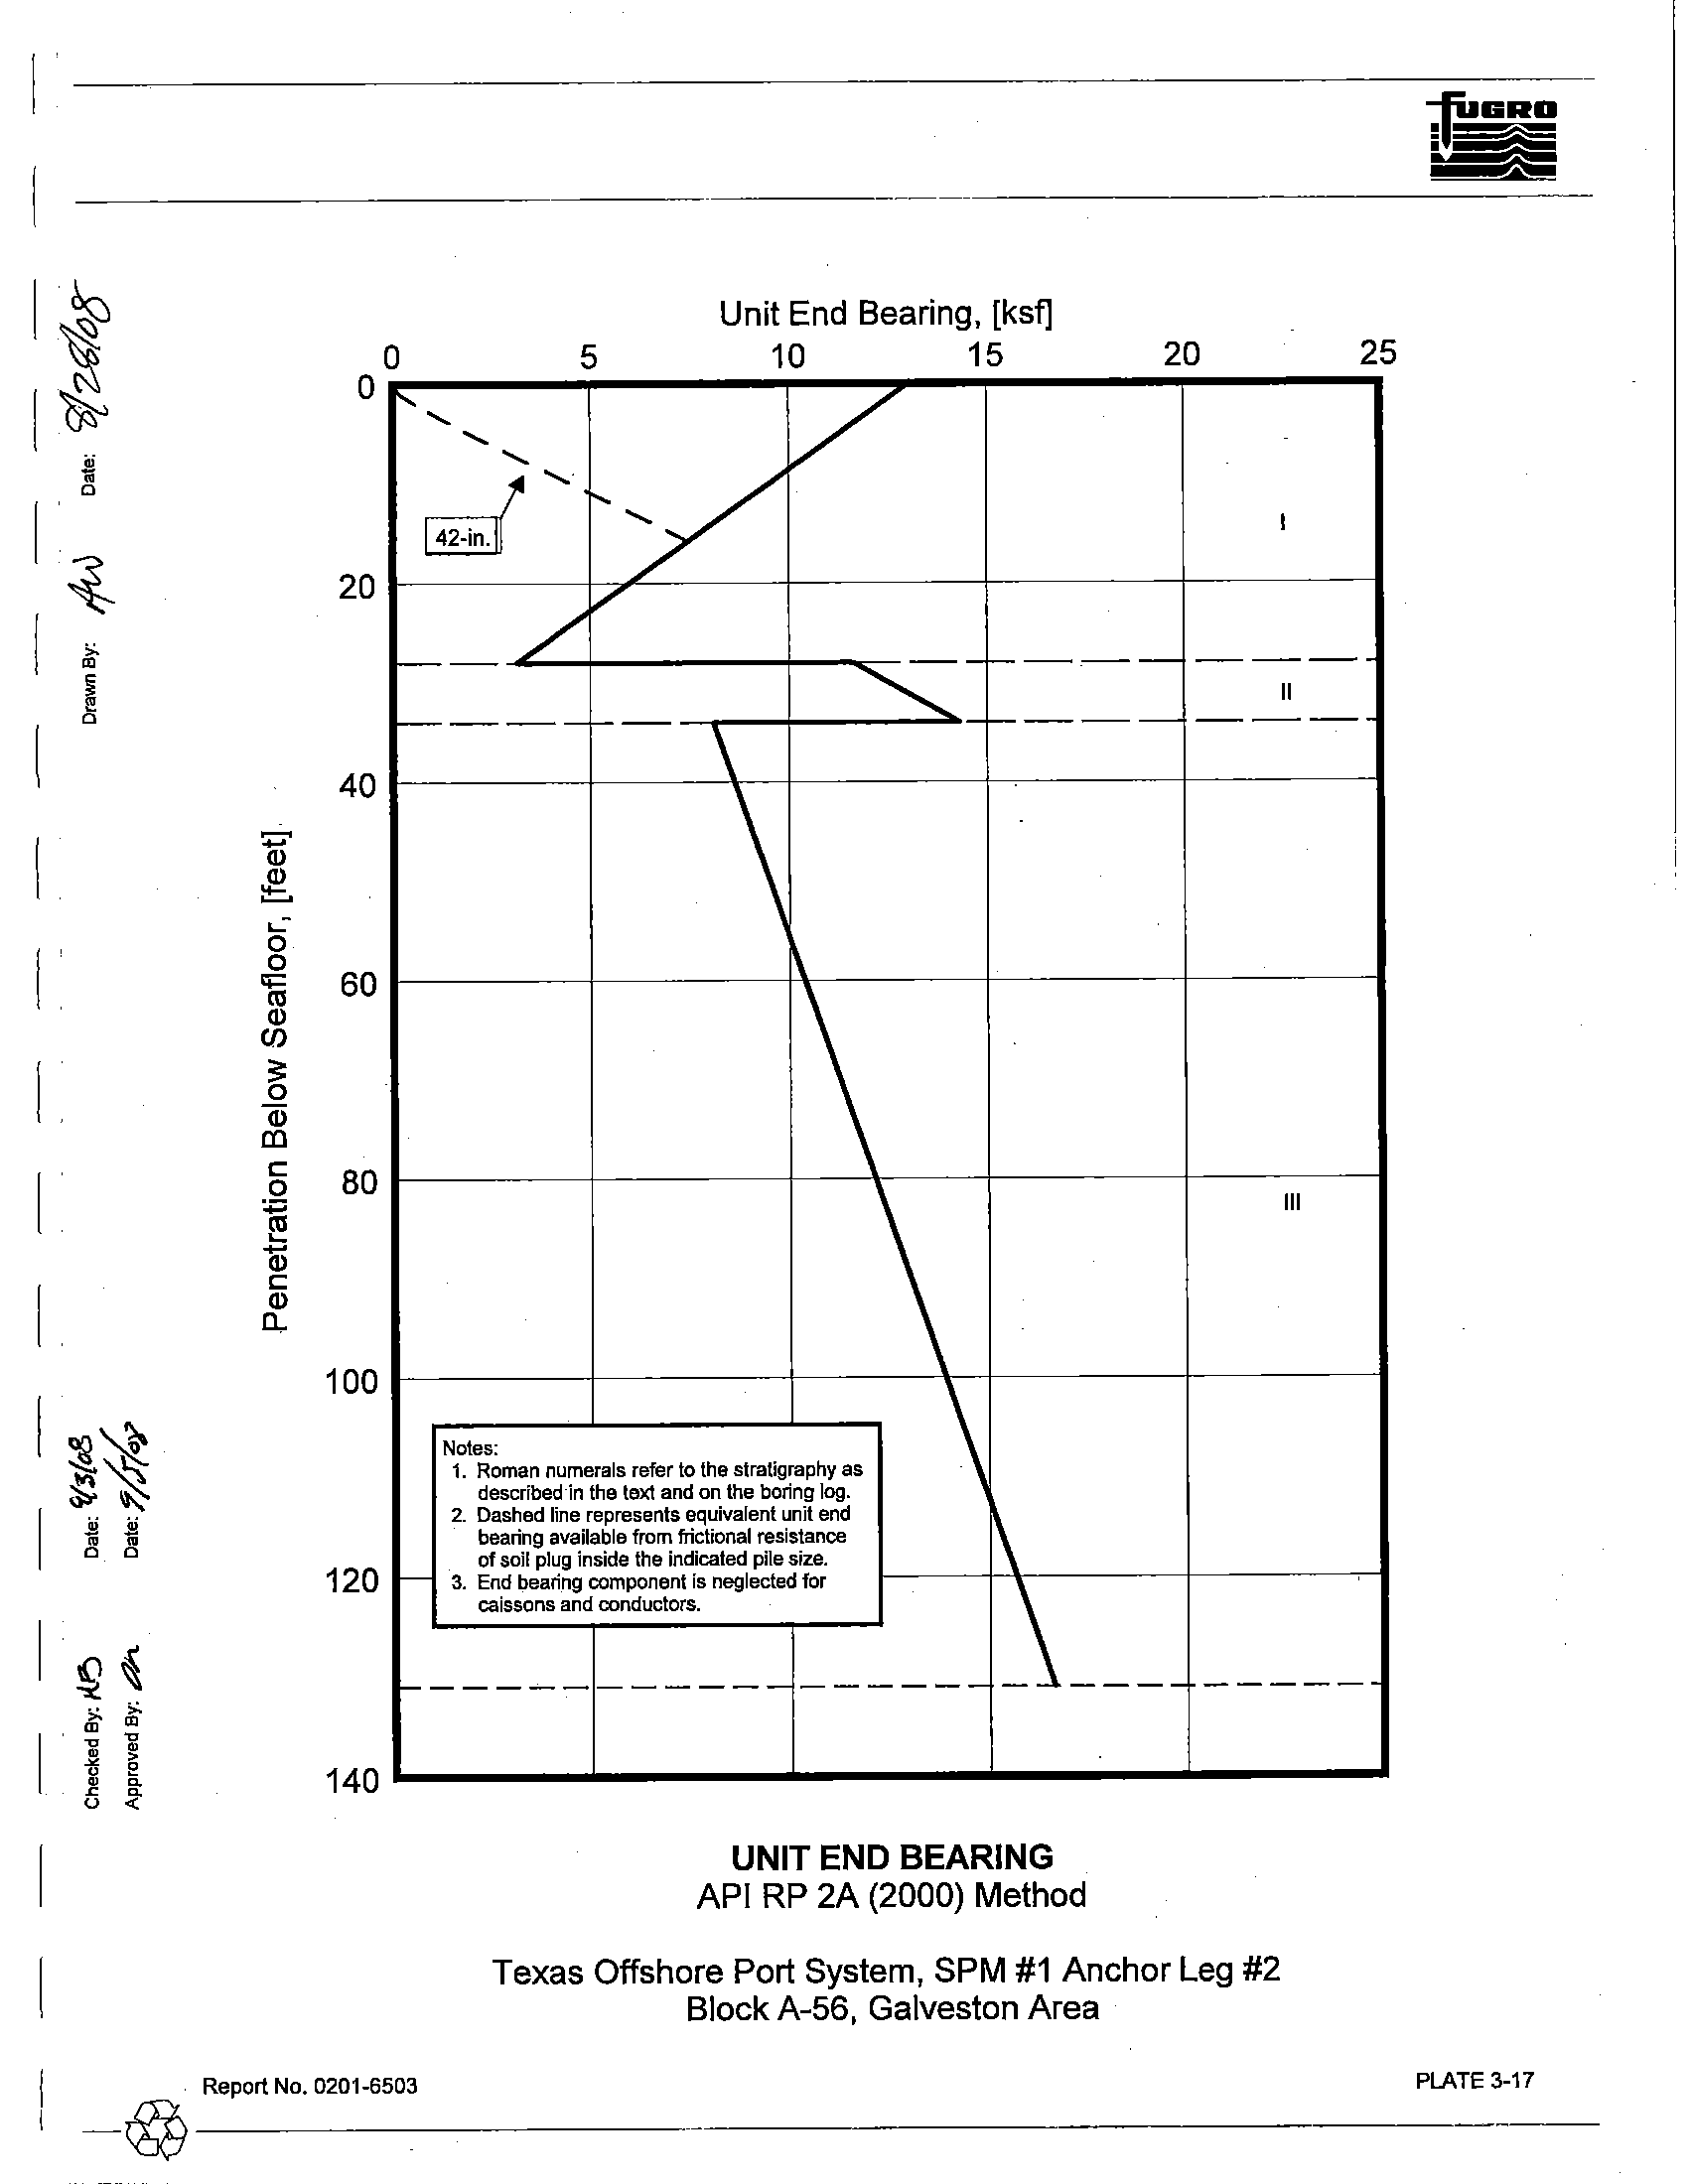
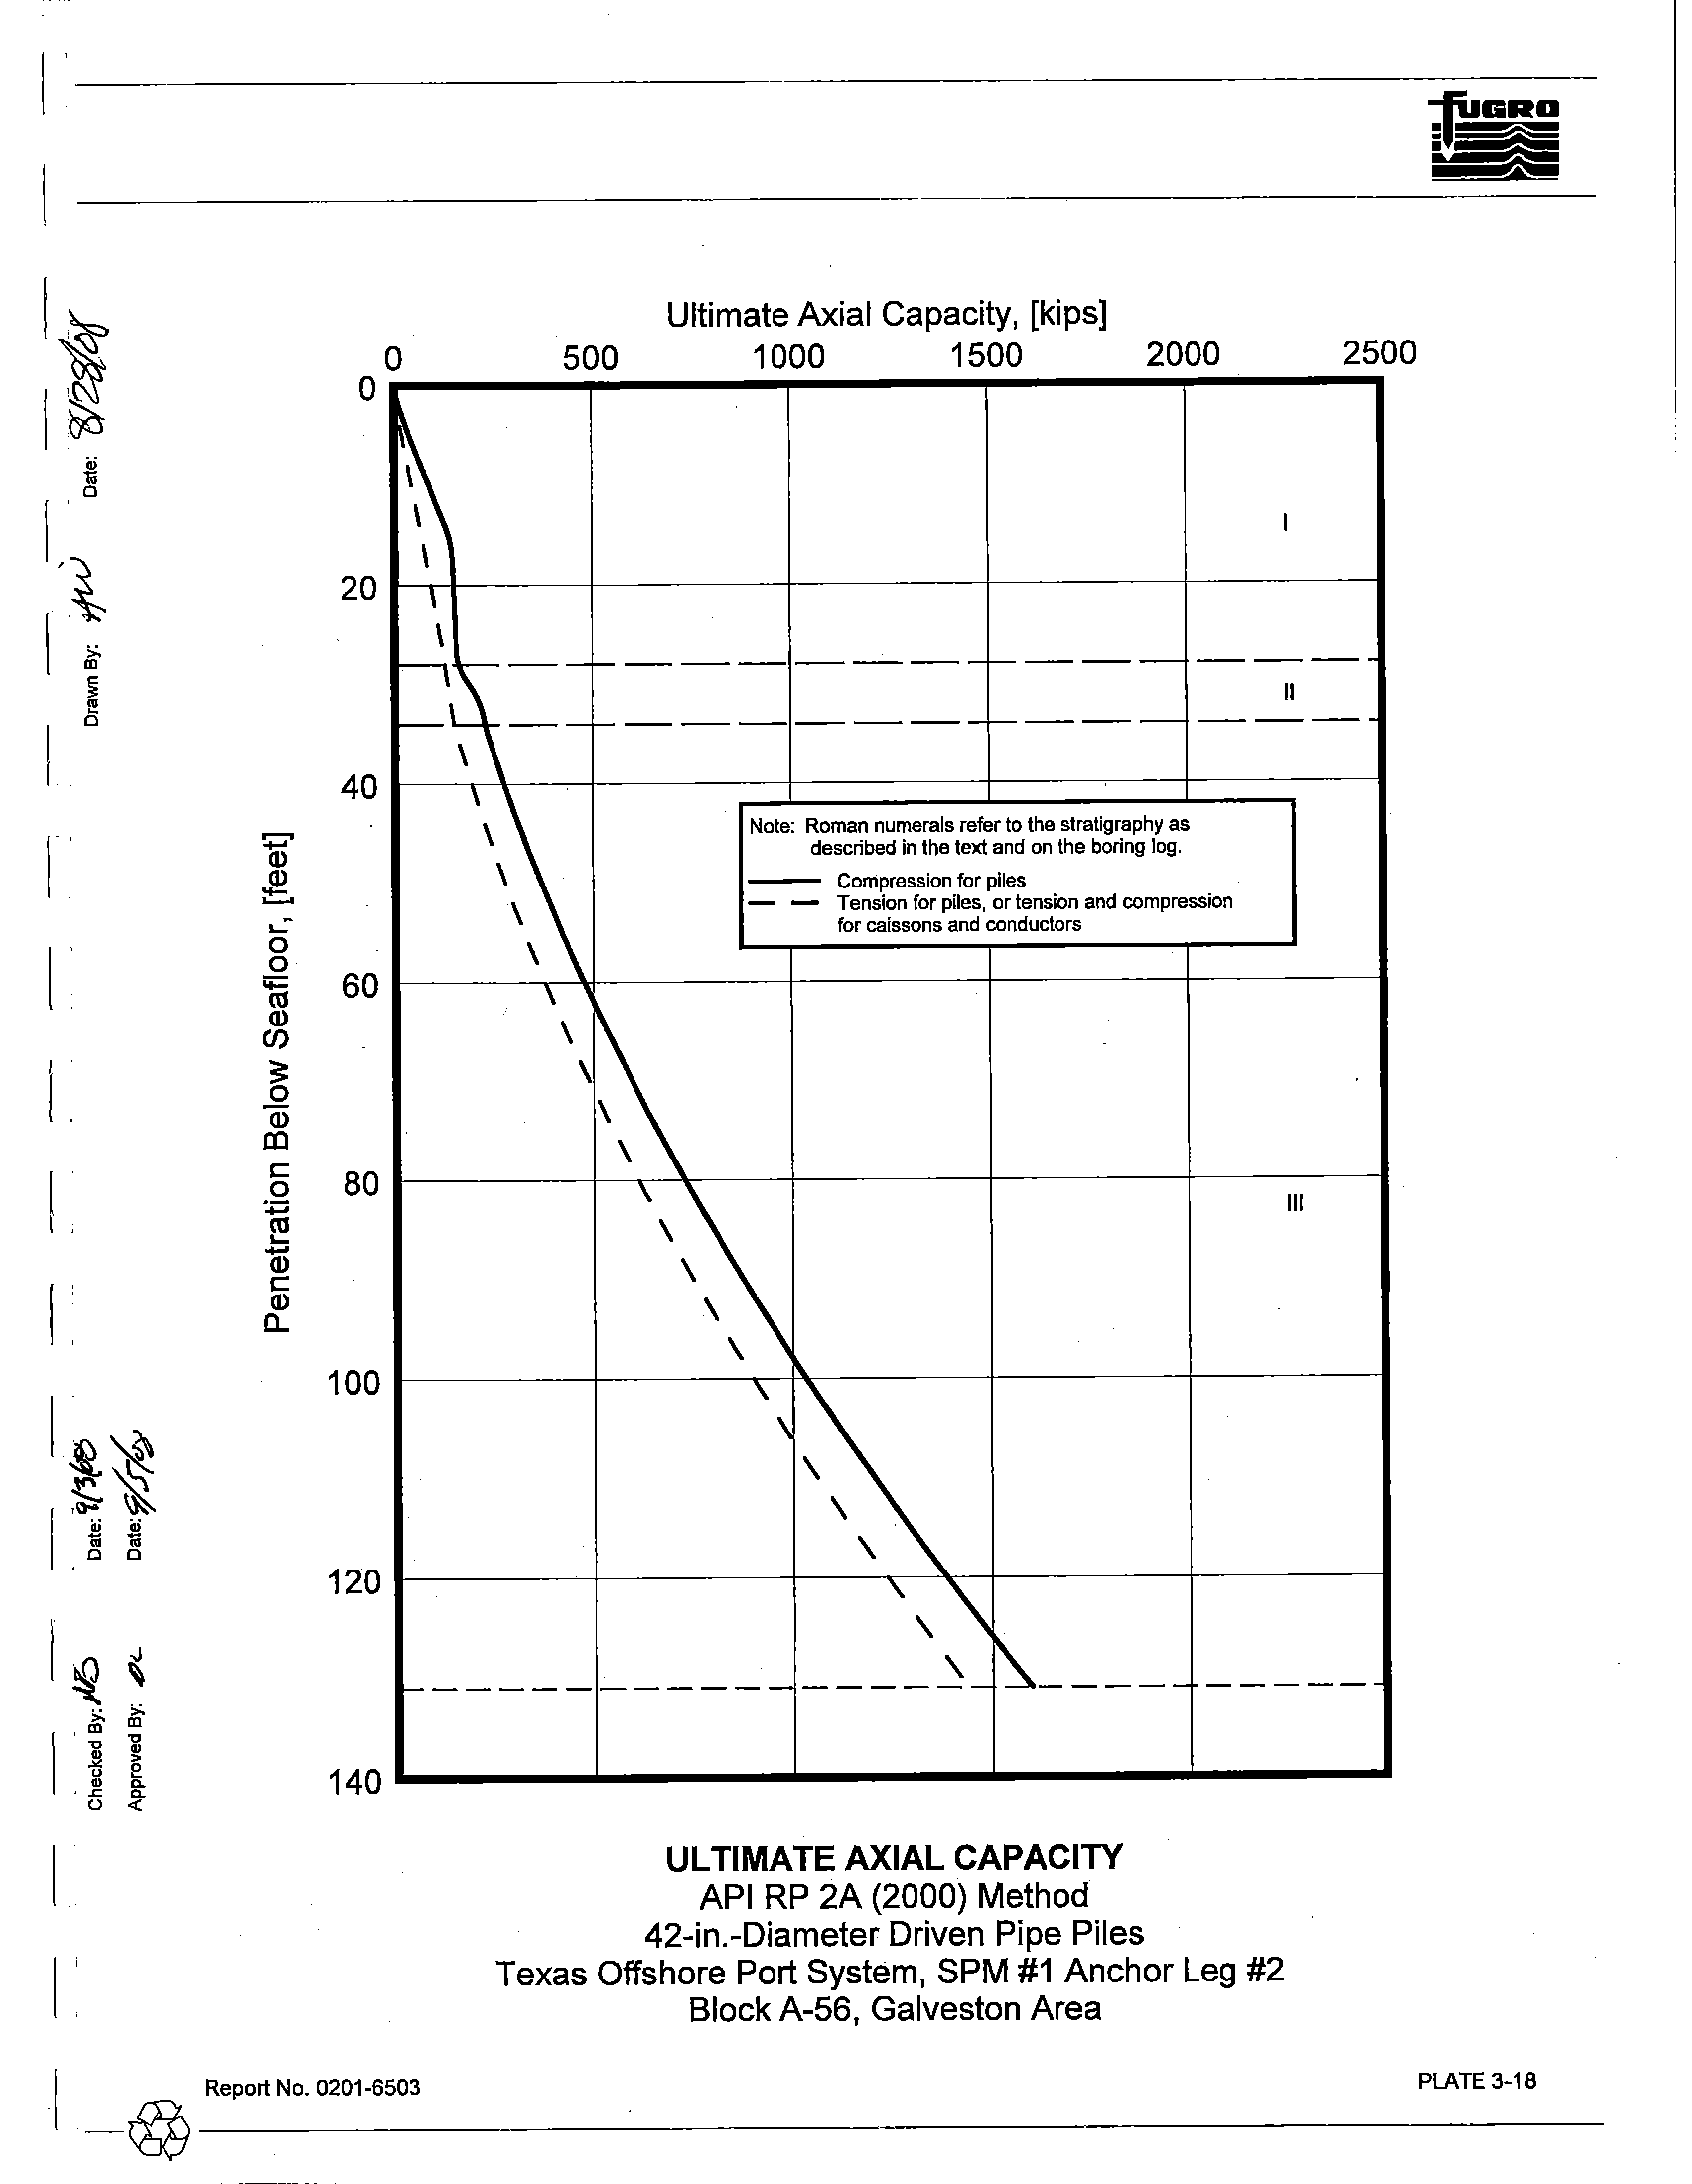
Ultimate Axial Capacity. The unit skin friction and unit end bearing values plotted
on Plates 3-16
and 3-17, respectively, was calculated using the API
RP 2A methods described in Appendix B. These
values were used to calculate the ultimate axial compressive and tensile capacities for 42-in.-diameter pipe
piles, driven
to final penetration at the boring location. Capacity curves for driven pipe piles (conductors,
caissons and foundation piles) are presented on Plate 3-18.
API
RP 2A recommends that pile penetrations be selected using appropriate factors of safety or
pile resistance factors. These factors are discussed in Section 2.5.1 of this report.
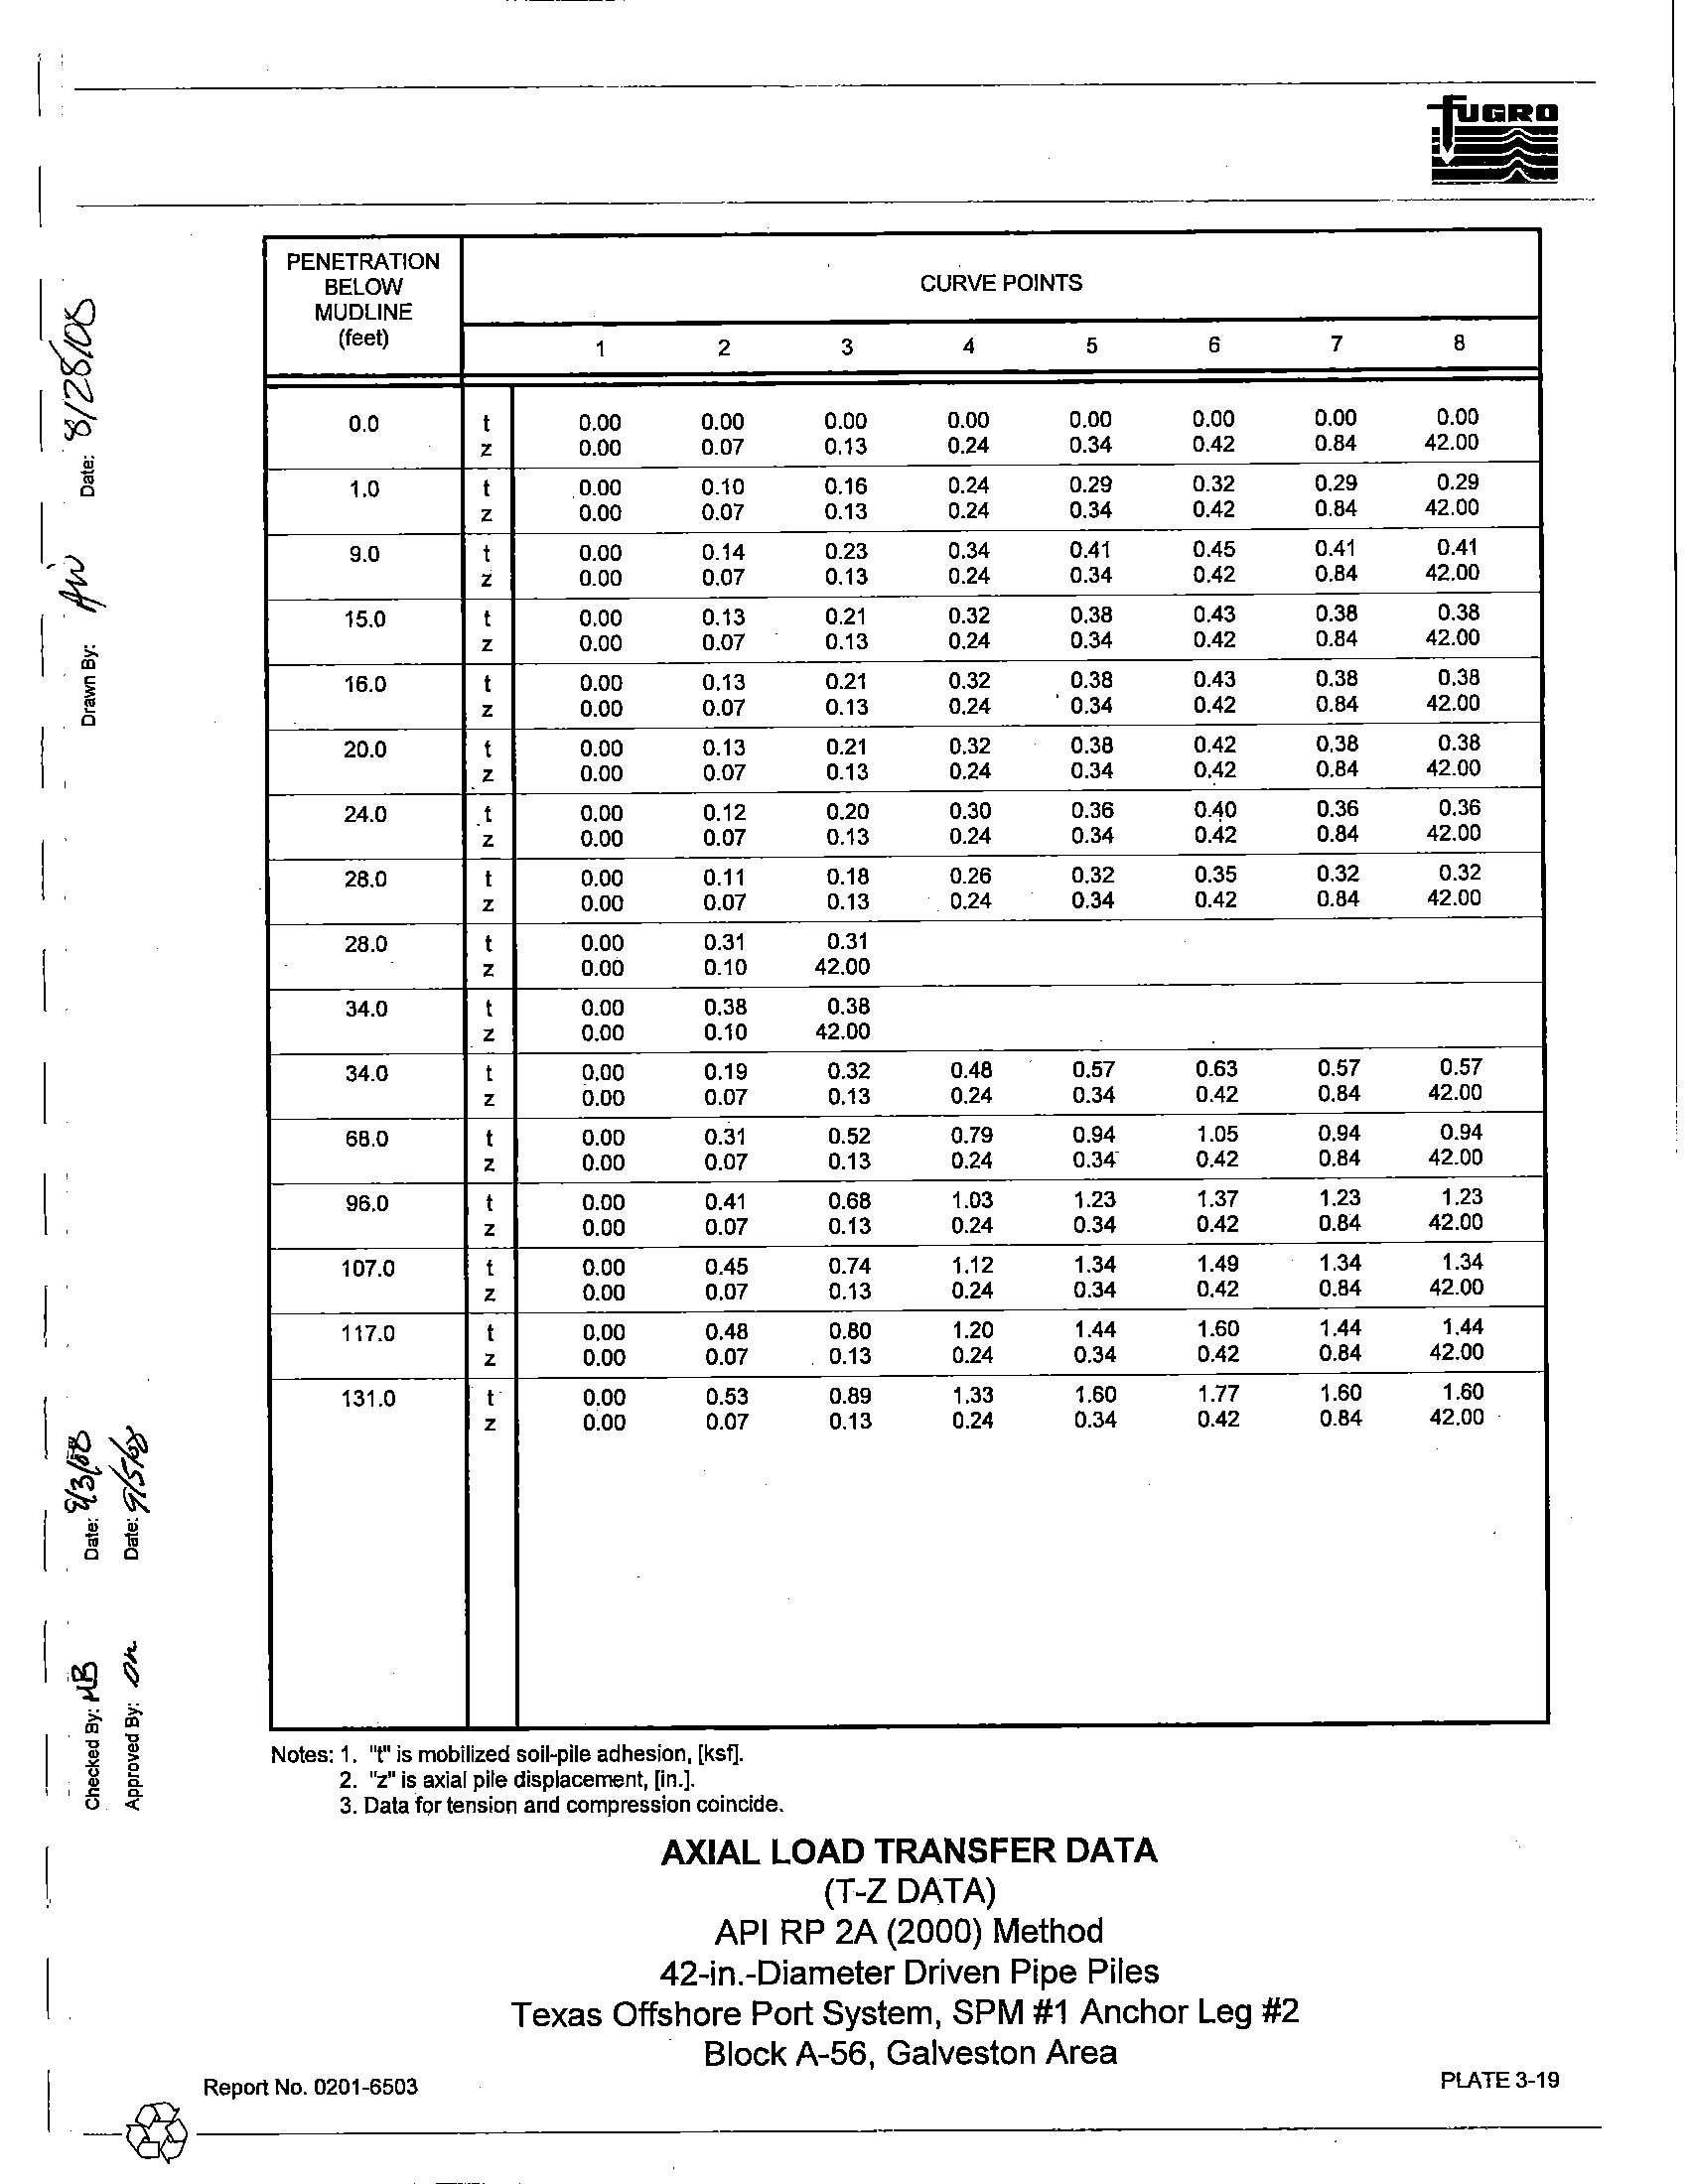
Axial Load Transfer Data. Axial load-pile movement analyses are usually performed using a
computer solution based on methods developed by Reese (1964) or Matlock, et
al. (1976). Plates 3-19 and
I
Report No. 0201.6503
3.4
-~---------------------------------
I
I
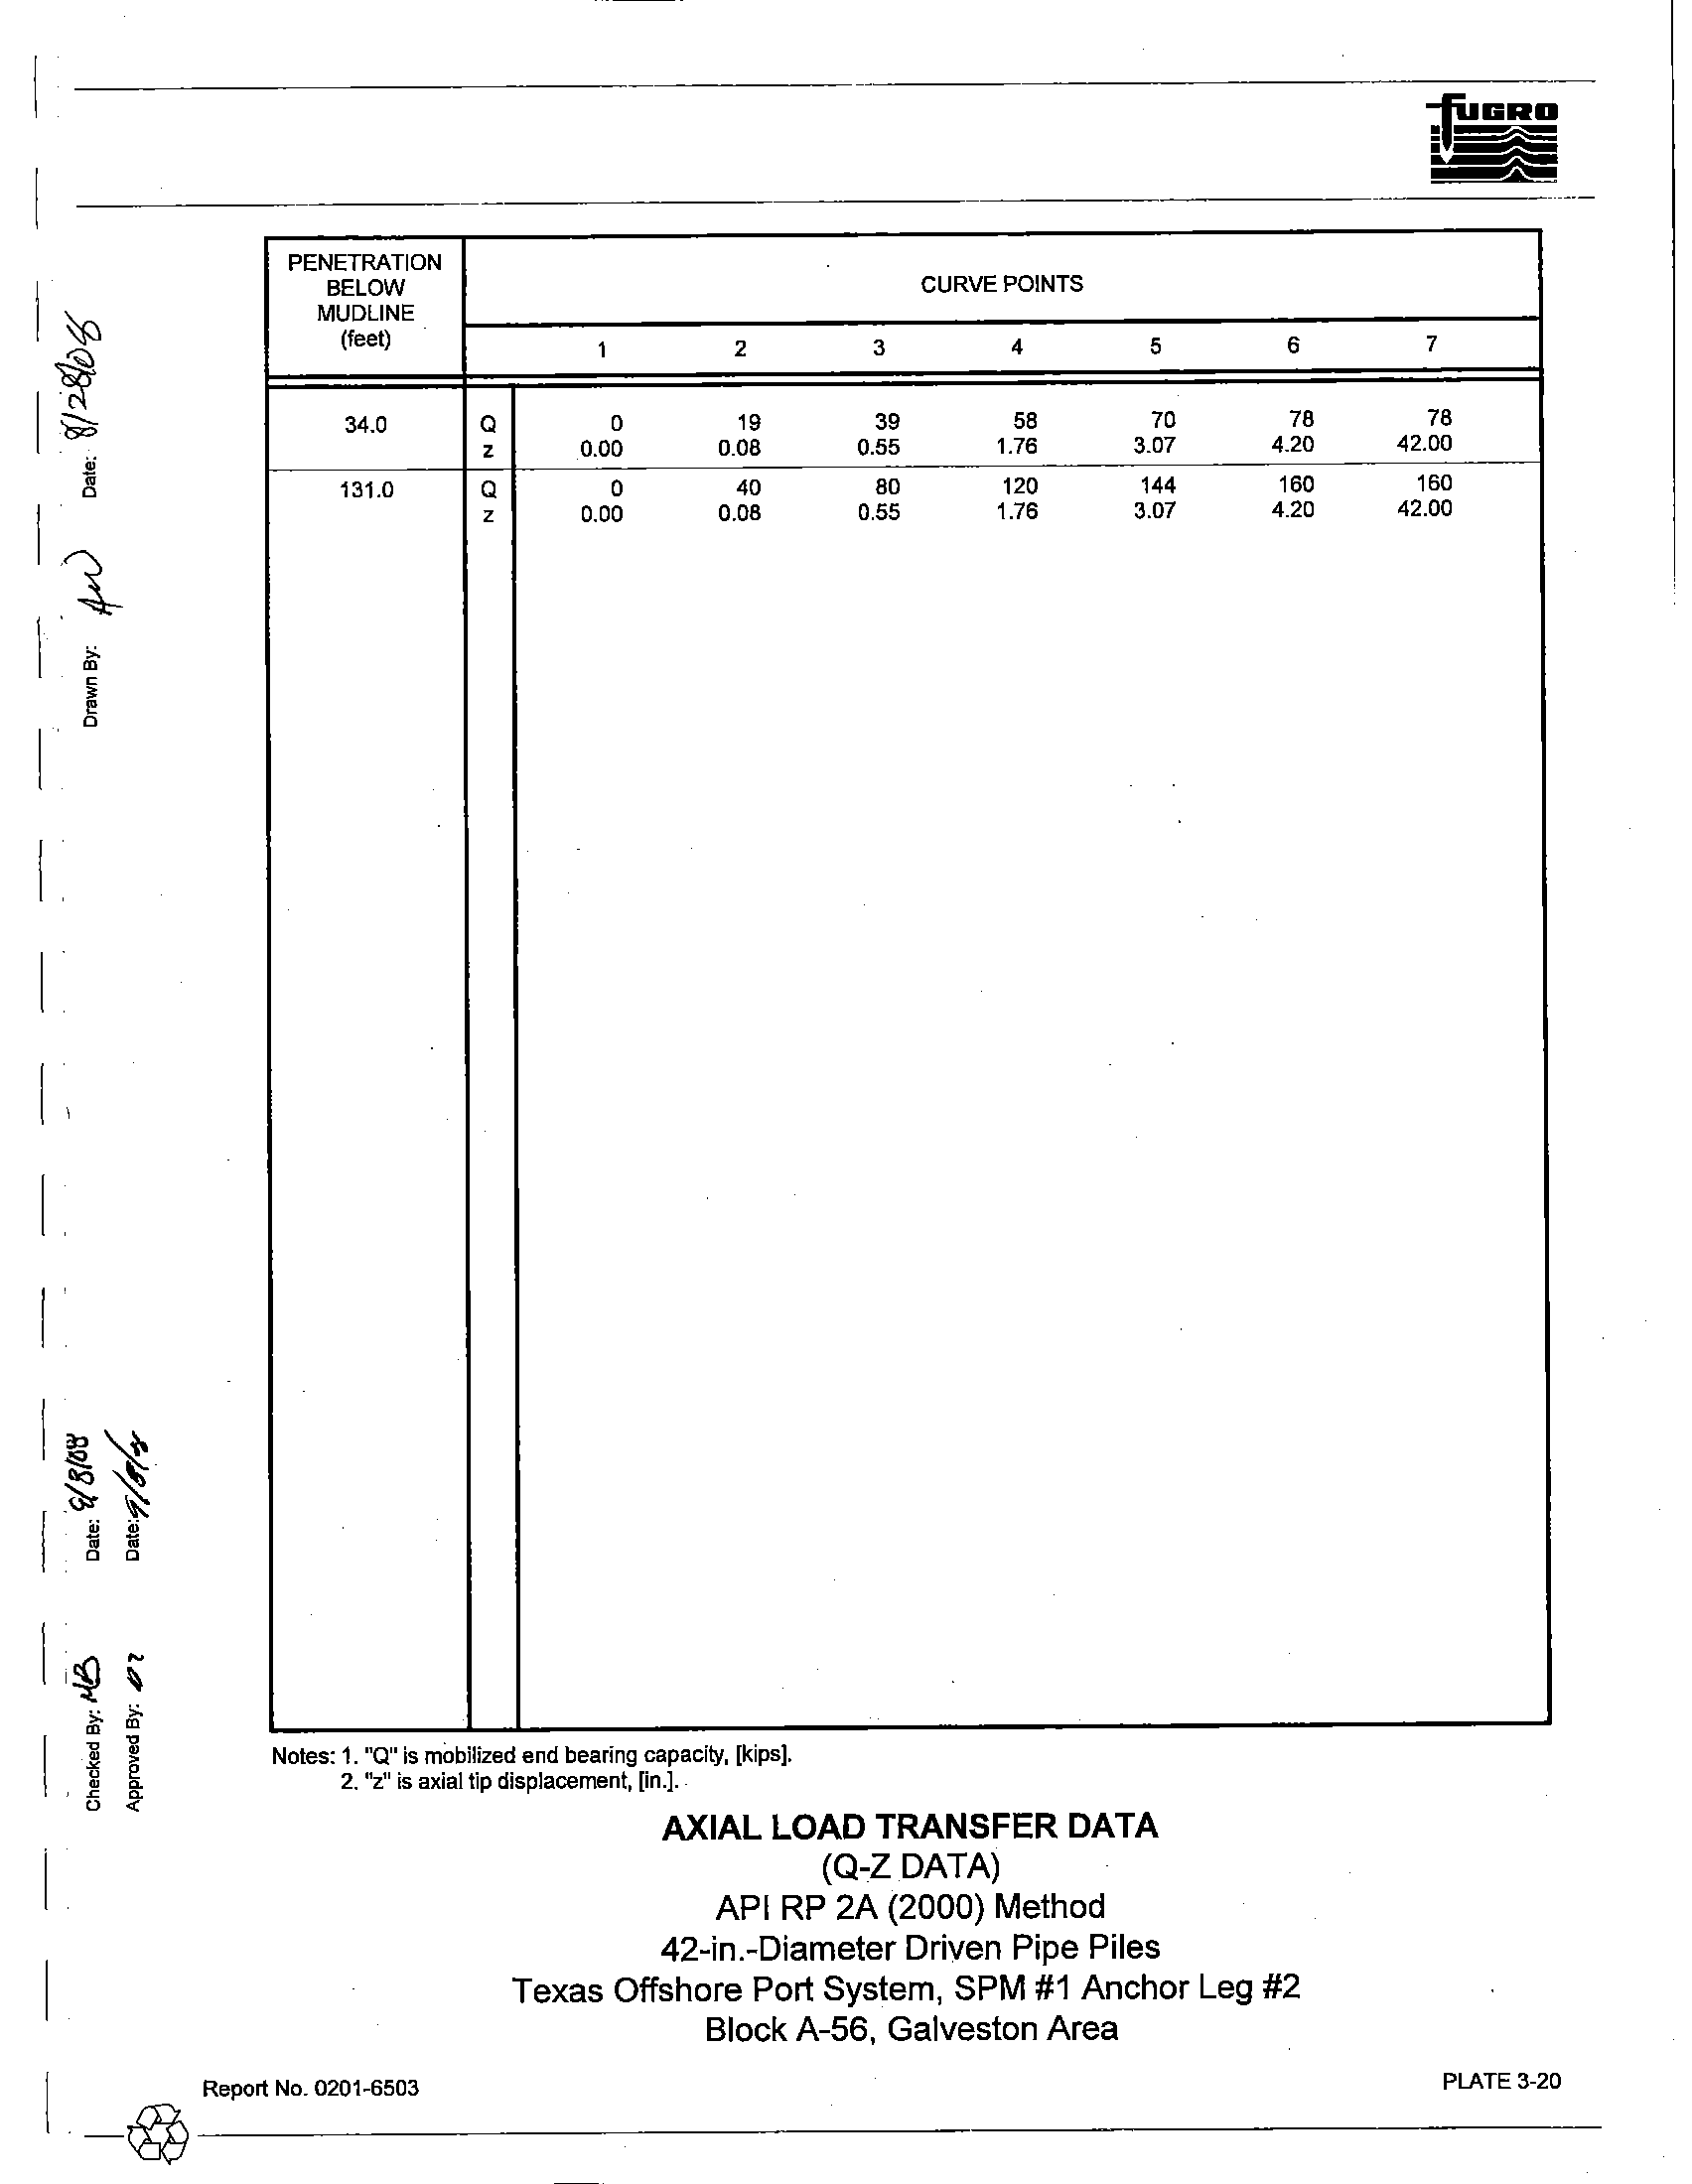
3-20 present the results as side load-side movement (t-z) and tip load-tip movement (Q-z) data for 42-in.-
diameter driven pipe piles, respectively. The Q-z data should be used for foundation piles and neglected for
caissons and conductor design.
In developing the axial load transfer data in the cohesive soils, a post-peak
adhesion ratio of 0.90 was utilized.
3.2.3.2
Lateral Pile Design Data
The soil resistance-pile defiection (p-y) characteristics of the soils at the boring location were
developed for individual 42-in.-diameter driven pipe piles. These data
may be used in lateral load analyses
of driven piles, conductors and caissons.
The p-y data for cyclic loading were developed to WO-f!
penetration using procedures that have been outlined
in API RP 2A and briefiy explained in Appendix B.
The stratigraphy and parameters used to develop the p-y data are presented on Plate 3-21. The p-y data
for 42-in.-diameter driven pipe piles are presented on Plate 3-22. P-y values presented at 100-fI penetration
may
be used for lateral load analyses at greater depths.
I_@
Report No. 0201-6503
3-5
9-£
SNOI.lV~:IlSnlll
en:
N0I1::l3S
@-I
r
1
I
!
1 ,
I
I.
I
r '
r
I
@
;0
m
"0
o
"-
Z
p
~
:a
cr,
'"
a
w
~
~
..:
o
o
(f)
m
Qi
~
tIl
c
i
c:
a..
QJ
"U
m
~
~
N
~
Checl,_~
-I'
It... ",
Approved By:
.tJ~
"-,- 1 ['i.:",'
.,~;,.)
u,awnBy:
"v,~cl
..... d".,.9/"'/ ....... o
X=3,257,199'
Y
=
251,a90'
Texas South Central Zone Coordinates
SEAFLOOR AT
EL. -121'
Date:
IDENTIFICATION TESTS,
[%J
UNDRAINED SHEAR STRENGTH
SUBMERGED UNIT WEIGHT,
[Kef]
[ksf]
BLOW
II
20
40
60
80
II
COUNT
0.03
0.04
0,05
0,06
0.5
1 0
1 5
t::.U
o
SOFT TO STIFF GRAY LEAN CLAY
WOH
+-- --- +
-
0
I
+1
WOH
+- ______ ..
_+
0
•
WOH
+-
_.__
<$
10
I-
20
o
10
20
I-
Note:
See PLATE 3-12b for detailed soil
stratigraphy to 34-ft penetration
10
PUSH
PUSH
PUSH
~
-. ---, -
.
1
.~.
,~""
...
~J:*I
111
20
H---+I
+-
(28.0')
30t
IMEDIUM DENSE OLIVE GRAY SILT WITH
SAND
PUSH
- 1
10. 1
II
I
30
(34.0')
40
I-
FIRM TO STIFF GRAY CLAY
.[ean to 64
-with a few shell fragments
to
55'
10
PUSH
+r--
LJ
I
II
~
II
I [TIn I
r
D
'"[:.<I>!
I
I
140
•
PUSH
...
CD
50 I-
PUSH
.'
0
PUSH
+-+______
01 0
.D
.D
+
<I> 1<j>.A
<1><1>+
~
50
1+
-with sand, 58' to 63'
60 J----
-expansive, with a few light gray bands at 59'.
PUSH
I I
..!
I
0 I
j.
II
$$
I.
I
60
-with a sandy silt layer.
WITh
a few mica and wood
fragments al64'
-with many silt pockets, partings. and seams, and .Ii
PUSH
PUSH
t~~~t:--t
<I>
+
70
I-
few pockets of organic matter, 65' to 78'
~--+---~---+---4--~11
170
80
_
-expansive,
76' to 98'
~
-platy at 77'
~~
t--~
PUSH
.D
$
Jt.
I.
I
-I-
t
II
I80
90
100
I-
110
I-
120
I-
130 t=-
140
I-
150 I-
160
I-
170
I-
180
t--
190
t--
-with silt pockets and partings, and a few light gray
bands, 86' to 98'
_
-blocky below 96'
~
~
~
~
-with gas blisters below 106'
-with a few claystones at 101'
-brown, mottled
with gray below 116'
-with a
few sand and silt seams at 117'
--expansive.
with silt pockets, partings, and seams
[
below 126'
-with a few claystones at 127'
-with a few pockets of organic matter at 130'
________ --1)31.0')
PUSH
+1---___ --+
PUSH
"
PUSH
J:J
PUSH
,
PUSH
+--e_+---+
PUSH
f--
o
~
<1>'
10
.D
~+
[.t.
I
<I>
<I>®
o
.D
®
<1>.
o
<1><1>
: .A.--
I
I
I
I
I
I
I
I
I
I
200
SAMPLING TECHNIQUES
CLASSIFICATION TESTS
STRENGTH TESTS
~
Number ofb!ows of a 175-lb weight (hammer) dropped approximately 5 fllo produce a
... SOLUBILITY IN HCl,
[%}
®
POCKET PENETROMETER (PP)
maximum of 24
In. of penelration of a 2.25-in...QD. 2.125-1n.-ID thin..walted tube
•
PERCENT PASSING -200 SIEVE, [%}
•
TORVANE
(TV)
sampler. 'PUSH" denotes a 3.00-in...QD, 2.B3-in.-ID thin-waited tube sampler was
•
WATER CONTENT (W). [%}
$
REMOTE VANE (RV)
.
~4
in. with the weight of the dnll siring. "WOH" denotes a 2.50..jn.-OD,
D
SUBMERGED UNIT WEIGHT (SUW)
+ MINIATURE VANE (MV)
(~
RESIDUAL (MVres) VALUE)
liner sampler was advanced 24
in. with the weight of the hammer.
... UNCONSOLIDATED UNDRAINED TRIAXIAL (UU)
PLASTIC LIMIT (PL)
+
LIQUID LlMrT (LL)
+
LOG OF BORING AND TEST RESULTS
Texas Offshore Port System, SPM #1 Anchor Leg #2
Blo.ck A-56, Galveston Area
(Open symbols i
90
100
110
120
130
140
150
160
170
180
190
200
~I
~I
~!
..:
o
a
m
(f),
~
~
gl
~
a..
OJ
c:
QJ
I
@
"0
il'
o
"
z
?
~
~
a
In
on
'"
S
"
m
~
~
I
..:
o
~
(f)
Qj
m
~
o
c:
~
a;
c:
0..
'"
--Ch.,,_--
A~ D~f5,t:=-
Approved By:
j?A
Date:
r7ff4
---0 By' '-'-'---
-("'-~
f
"'-
X=3,257,199'
Y
=
251,890'
Texas South Central Zone Coordinates
'r'-----------------------------------,
IDENTIFICATION TESTS,
[%1
BLOW /I
20
40
60
80
COUNT
SUBMERGED UNIT WEIGHT,
[kef]
0.05
0.06
UNDRAINED SHEAR STRENGTH
[i<sf)
~I
•
....... I SEAFLOOR AT
EL
-121'
0.03
0.04
I'------..:r'-----'T'------'i'-----=r-----;
SOFT TO STIFF GRAY LEAN CLAY
1-
U
-mottled with yellowish red, with a few pockets of
II
+_+___ - _-1-4-
If
51-
10
I-
organic matter to 12'
-with a few sand pockets and shell fragments to 5'
-olive gray at
mudHne
~
-with
a
few
s:!lt
pockets. 6' to 12'
;r-, -mottled with greenish gray at 6'
-
-mottled with brownish yellow,
with a
few
sand
pockets, 9' to 12'
-fat
at 10'
.with
a few sheJi fragments.
13' to 17'
15
~
-with
many sand pockets, partings. and seams
at 15'
-dark gray and fat, mottled with gray and yellowish
20
~
red, with many pockets of organic matter at 19'
-with mica, 23' to 33'
-with a few
sand seams at 23'
25
28.0'
MEDIUM DENSE OLIVE GRAY SILT WITH
SAND
-with clay pockets, partings, and seams
-with a
few shell fragments at 33'
34.0'
WOH
II
-. -+
WOH
II
..L.-~
_____
20
'~-f
.
---=-
•
10
II
_~
PUSH
II
+-
I
•
•
PUSH
II
I.L
DDD
PUSH
II
+-~--+I
PUSH
0
0
Ll.....
~
o
~~
Ll.
I
....
~
-,
o .....
~
~
1..1>.
~
~
I I "I
I -d Ilr
o
....
1.
$
I
10
35
FIRM TO STIFF GRAY eLAY
11 __, I
-lean to 64'
40
-with
a
few shell fragments
to
55'
~H
Ll.
....
--------S-A-M-P-L-'N-G-TE--C-H-N-'Q-U-E-5-------I------I
CLASSIFICATION TESTS
STRENGTH TESTS
Number of blows of a 175-1b weight (hammer) dropped approXimately 5
ft
to prodUCB a
..,
SOLUBILITY IN HCL,
[%]
@
POCKET PENETROMETER (PP)
maximum of 24 In. of penetration of a 225-ln.-OD, 2.12S-in.-ID thin-walled IIJbe
•
PERCENT PASSING -200 SIEVE, [%j
•
TORVANE
(TV)
sampler. -PUSH" denotes a 3.00-in.-OO, 2.83-in.-ID thin.walled rube sampler was
•
WATER CONTENT
(W),
[%]
<j) REMOTE VANE (RY)
advanced 24
In. with the weight of the drill slrlng.
-v-JOW
denotes a 2.50-in.-OD,
0
SUBMERGED UNIT WEIGHT (SUW)
•
MINIATURE VANE (MV) (.e- RESIDUAL (MVl'lls) VALUE)
2.125-in..ID liner sampler
was advanced 24 in.
v.ith
the weight of the hammer.
... UNCONSOLIDATED UNDRAINED TRIAXIAL {UU}
PLASTIC
UMlT
(PL)
+
LIQUID LIMIT (LL)
---- +
LOG OF BORING AND TEST RESULTS
Texas Offshore Port System, SPM #1 Anchor Leg #2
Block A-56, Galveston Area
(Open symbols I
5
10
15
20
25
30
35
40
~
g,
I
(f)
"'I
,
~.
~
g
c:
~
~
0..
'"
,
s
PI..ASnc lJl,!1l
~PiJ
LIQUIGUMiT (tt.)
+----------------------+
Report No. 0201-6503
-........
~.,.
-,..,
.....................
--
_ ................................
,,~
L"T
GEOPHYSICAL AND GEOTECHNICAL INTEGRATION
Texas Offshore Port System, SPM
#1 Anchor Leg #2
Block A56, Galveston Area
-.-.----
------------------===~
N
125 METERS
Line 2003
PLATE 3-13
-~-----------------------------------------------------------------------------------------------~-----------
[
[
[
I~
~
[~
[
;;;
o
~
Shear Strength Profile, [ksf]
o
0.0
0.5
1.0
1.5
/
2.0
2.5
0:;:;'
Q)
~
..:
o
20
40
'iii
60
Q)
.(1)
~
Q)
co
5
80
~
a;
c
Q)
0..
100
120
140
/
I
r---.
L
/'
;----
----
--_.-
---
~
=
20., 1)
=
5., N
q
=
8.0, I
ma
,
=
1.0 ksl, qma,
=
oksl
II
r----.-
---\
----
--_.-
---
,
\
\
III
,
Back to top
INote: Roman numerals refer to the stratigraphy as
I
described in the text and on the boring log.
------
------------
-_\_-
-----
DESIGN STRENGTH PARAMETERS
Texas Offshore Port System, SPM
#1 Anchor Leg #2
Block A-56, Galveston Area
I
Report No. 0201-6503
PLATE 3-14
-~-----------------------------------------
Submerged Unit Weight, [kcf)
o
0.00
O.~
O.M
0.00
0.08
0.10
~
I~
I ii
J
t~
19
•
m
"
0
0
I~ ~
>.
>.
m
m
I
~
~
~
•
~
.
~
~
~
0
'"
I
!;::'
OJ
~
.:
a
<;::::
til
OJ
(/)
:=
a
(jj
LD
a
c
:;:::;
.....
til
Q)
c
c..
OJ
20
40
60
80
100
120
140
I
1----.-
----
~-
f------
---
II
1---_.-
----
--.~
,-
f------
---
I
III
I
.
I
Note: Roman numerats refer to the stratigraphy as
~L
described in the text and on the boring log.
---------------- -- ------
-----
DESIGN SUBMERGED UNIT WEIGHT
Texas Offshore Port System, SPM
#1 Anchor Leg #2
Block A-56, Galveston Area
I
Report No. 0201-6503
-@------------------
PLATE 3-15
I
- ---- -----------
Unit Skin Friction, [ksf]
o
00
'"
05
1 0
1 5
20
25
1if
~
..:
o
20
40
'1ii
60
(J)
Cf)
Qi
~
OJ
5
80
e
(jj
c
(J)
0...
100
120
140
--~-
----
----
--_.-
--
\ -
---.-
--_.-
.
\
Notes:
'\
1. Roman numerals refer to the stratigraphy as
\
described in the text and on the boring log.
2. Tension and compression curves coincide.
1------------
------
_\_--
UNIT SKIN FRICTION
API RP
2A (2000) Method
I
---
II
---
III
-----
Texas Offshore Port System, SPM #1 Anchor Leg #2
Block A-56, Galveston Area
[
Report No. 0201-6503
-@---~-
PLATE 3-16
~~
~\I\;
ji
.s
c
•
c
•
~
~
m
'"
m
'"
~
~
~
•
•
>
0
•
•
~
U
£
~
Unit End Bearing, [ksf]
o
o
"
5
10
15
20
/
~
Q)
~
...:-
o
20
40
'iij
60
Q)
(J)
~
Q)
lD
e
Qi
§
80
r:::
Q)
D.,.
100
120
140
......
g
............
~y
/
[;7
-
~.-
1---.---
1------
1---
\
----
'\
~
'\
Noles:
1. Roman numerals refer to the stratigraphy as
described-in the text and on the boring log.
2. Dashed line represents equivalent unit end
~
bearing available from frictional resistance
I-
of soil plug inside the indicated pile size.
3. End bearing component is neglected for
~----
caissons and conductors.
1-------------------
UNIT END BEARING
API RP 2A (2000) Method
I
---
II
---
III
-----
Texas Offshore Port System, SPM #1 Anchor Leg #2
Block A-56, Galveston Area
25
Report No. 0201-6503
PLATE 3-17
-~----------------------------------
I
I
I
I~~
I
~l
c
c
I
~ ~
>.
&i-
I
,'"
I
1
o
o
~
\
20
\
\
Ultimate Axial Capacity, [kips]
500
1000
1500
2000
2500
I
:'~.=
--------
---,-
---'-
II
----
--_.-
f----
---'-
40
'af
~
..:
o
'iii
60
0)
en
Qi
~
III
5
80
""
~
a.
1il
c:
0)
100
120
140
\
\
Note: Roman numerals refer to the stratigraphy as
described in
the
text and on the
borirg
log,
\
--
Compression for piles
\
-
-
Tension for piles, or tension and compression
for caissons and conductors
\
\
\
\
\
\\
III
'\
\
\
\
------------
-----'-
\\
,
~-----
------
ULTIMATE AXIAL CAPACITY
API RP 2A (2000) Method
42-in.-Diameter Driven Pipe Piles
Texas Offshore Port System, SPM #1 Anchor Leg #2
Block A-56, Galveston Area
I
Report No, 0201-6503
-@---------------------------------
PLATE 3-18
\~~
[
o
~
0
~
[~ ~
'"
'"
~
~
~
•
•
>
0
~
•
~
~
0
«
PENETRATION
BELOW
CURVE POINTS
MUDLINE
(feel)
1
2
3
4
5
0.0
I
0.00
0.00
0.00
0.00
0.00
z
0.00
0.07
0.13
0.24
0.34
1.0
I
0.00
0.10
0.16
0.24
0.29
z
0.00
0.07
0.13
0.24
0.34
9.0
I
0.00
0.14
0.23
0.34
0.41
z
0.00
0.07
0.13
0.24
0.34
15.0
I
0.00
0.13
0.21
0.32
0.38
z
0.00
0.07
0.13
0.24
0.34
16.0
I
0.00
0.13
0.21
0.32
0.38
z
0.00
0.07
0.13
0.24
. 0.34
20.0
I
0.00
0.13
0.21
0.32
0.38
z
0.00
0.07
0.13
0.24
0.34
24.0
I
0.00
0.12
0.20
0.30
0.36
z
0.00
0.07
0.13
0.24
0.34
28.0
I
0.00
0.11
0.18
0.26
0.32
z
0.00
0.07
0.13
0.24
0.34
28.0
I
0.00
0.31
0.31
z
0.00
0.10
42.00
34.0
I
0.00
0.38
0.38
z
0.00
0.10
42.00
34.0
I
0.00
0.19
0.32
0.48
.
0.57
z
0.00
0.07
0.13
0.24
0.34
68.0
I
0.00
0.31
0.52
0.79
0.94
z
0.00
0.07
0.13
0.24
0.34'
96.0
I
0.00
0.41
0.68
1.03
1.23
z
0.00
0.07
0.13
0.24
0.34
107.0
I
0.00
0.45
0.74
1.12
1.34
z
0.00
0.07
0.13
0.24
0.34
117.0
I
0.00
0.48
0.80
1.20
1.44
z
0.00
0.07
0.13
0.24
0.34
131.0
I
0.00
0.53
0.89
1.33
1.60
z
0.00
0.07
0.13
0.24
0.34
Notes: 1. "t" is mobilized SOil-pile adhesion, [ksf].
2. "z" is axial pile displacement, [in.].
3. Data for tension and compression coincide.
AXIAL LOAD TRANSFER DATA
(T-Z DATA)
API RP
2A (2000) Method
42-in.-Diameter Driven Pipe Piles
6
0.00
0.42
0.32
0.42
0.45
0.42
0.43
0.42
0.43
0.42
0.42
0.42
0-40
0.42
0.35
0.42
0.63
0.42
1.05
0.42
1.37
0.42
1.49
0.42
1.60
0.42
1.77
0.42
Texas Offshore Port System, SPM #1 Anchor Leg #2
Block A-56, Galveston Area
7
8
0.00
0.00
0.84
42.00
0.29
0.29
0.84
42.00
0.41
0.41
0.84
42.00
0.38
0.38
0.84
42.00
0.38
0.38
0.84
42.00
0.38
0.38
0.84
42.00
0.36
0.36
0.84
42.00
0.32
0.32
0.84
42.00
0.57
0.57
0.84
42.00
0.94
0.94
0.84
42.00
1.23
1.23
0.84
42.00
1.34
1.34
0.84
42.00
1.44
1.44
0.84
42.00
1.60
1.60
0.84
42.00
[
Report
No. 0201-6503
PLATE
3-19
-@----------------------
I
I,
PENETRATION
BELOW
CURVE POINTS
MUDLINE
(feet)
1
2
3
4
5
6
34.0
a
0
19
39
58
70
78
z
0.00
0.08
0.55
1.76
3.07
4.20
131.0
a
0
40
80
120
144
160
z
0.00
0.08
0.55
1.76
3.07
4.20
Notes: 1.
"Q"
is mobilized end bearing capacity, [kips].
2. "z" is axial
tip
displacement, [in.].
AXIAL LOAD TRANSFER DATA
(Q-Z
DATA)
API RP 2A (2000) Method
42-in.-Diameter Driven Pipe Piles
Texas Offshore Port System, SPM #1 Anchor Leg #2
Block A-56, Galveston Area
I_@
Report No. 0201-6503
7
78
42.00
160
42.00
PLATE 3-20
I~
11
ua
I
~
~
I
'>.
m
c
.~
0
Seafloor
Soft
'"
T'"
cl",
Medium dense silt with sand
Firm
to stiff clay
r
Penetration
0
28'
34'
8
50
= 1.5 %
k=10pci
850 =
1.5
%
at 34'
decreasing linearly to
8
50
= 1.0 % at 100'
100' -
-
-
-
-
-
-
-
-
Notes:
1. Eso is axial strain at half of peak deviator stress for cohesive soils.
2. Soil strength parameters are shown on Plate 3-14.
3. Submerged unit weight profile is shown on Plate 3-15.
4. k is the modulus of horizontal subgrade reaction for granular soils.
STRATIGRAPHY AND PARAMETERS FOR P-Y DATA
Texas Offshore Port System, SPM
#1 Anchor Leg #2
Block A-56, Galveston Area
_@e
portNo.0201-6S03
PLATE 3-21
1,,--
~
I~
~
"
1:(
1
I
~~
,
"'-
,~~
"
•
"
•
:~
(
~
>.
>.
'"
'"
~
•
~
•
~
~
~
~
~
"
«
I
PENETRATION
BELOW
MUDLINE
(feet)
1
0.0
P
0
Y
0.00
3.0
P
0
Y
0.00
7.0
P
0
Y
0.00
10.0
P
0
Y
0.00
13.0
P
0
Y
0.00
16.0
P
0
Y
0.00
20.0
P
0
Y
0.00
25.0
P
0
Y
0.00
28.0
P
0
Y
0.00
28.0
P
0
.Y
0.00
33.0
P
0
Y
0.00
34.0
P
0
Y
0.00
34.0
P
0
Y
0.00
100.0
P
0
(and below)
Y
0.00
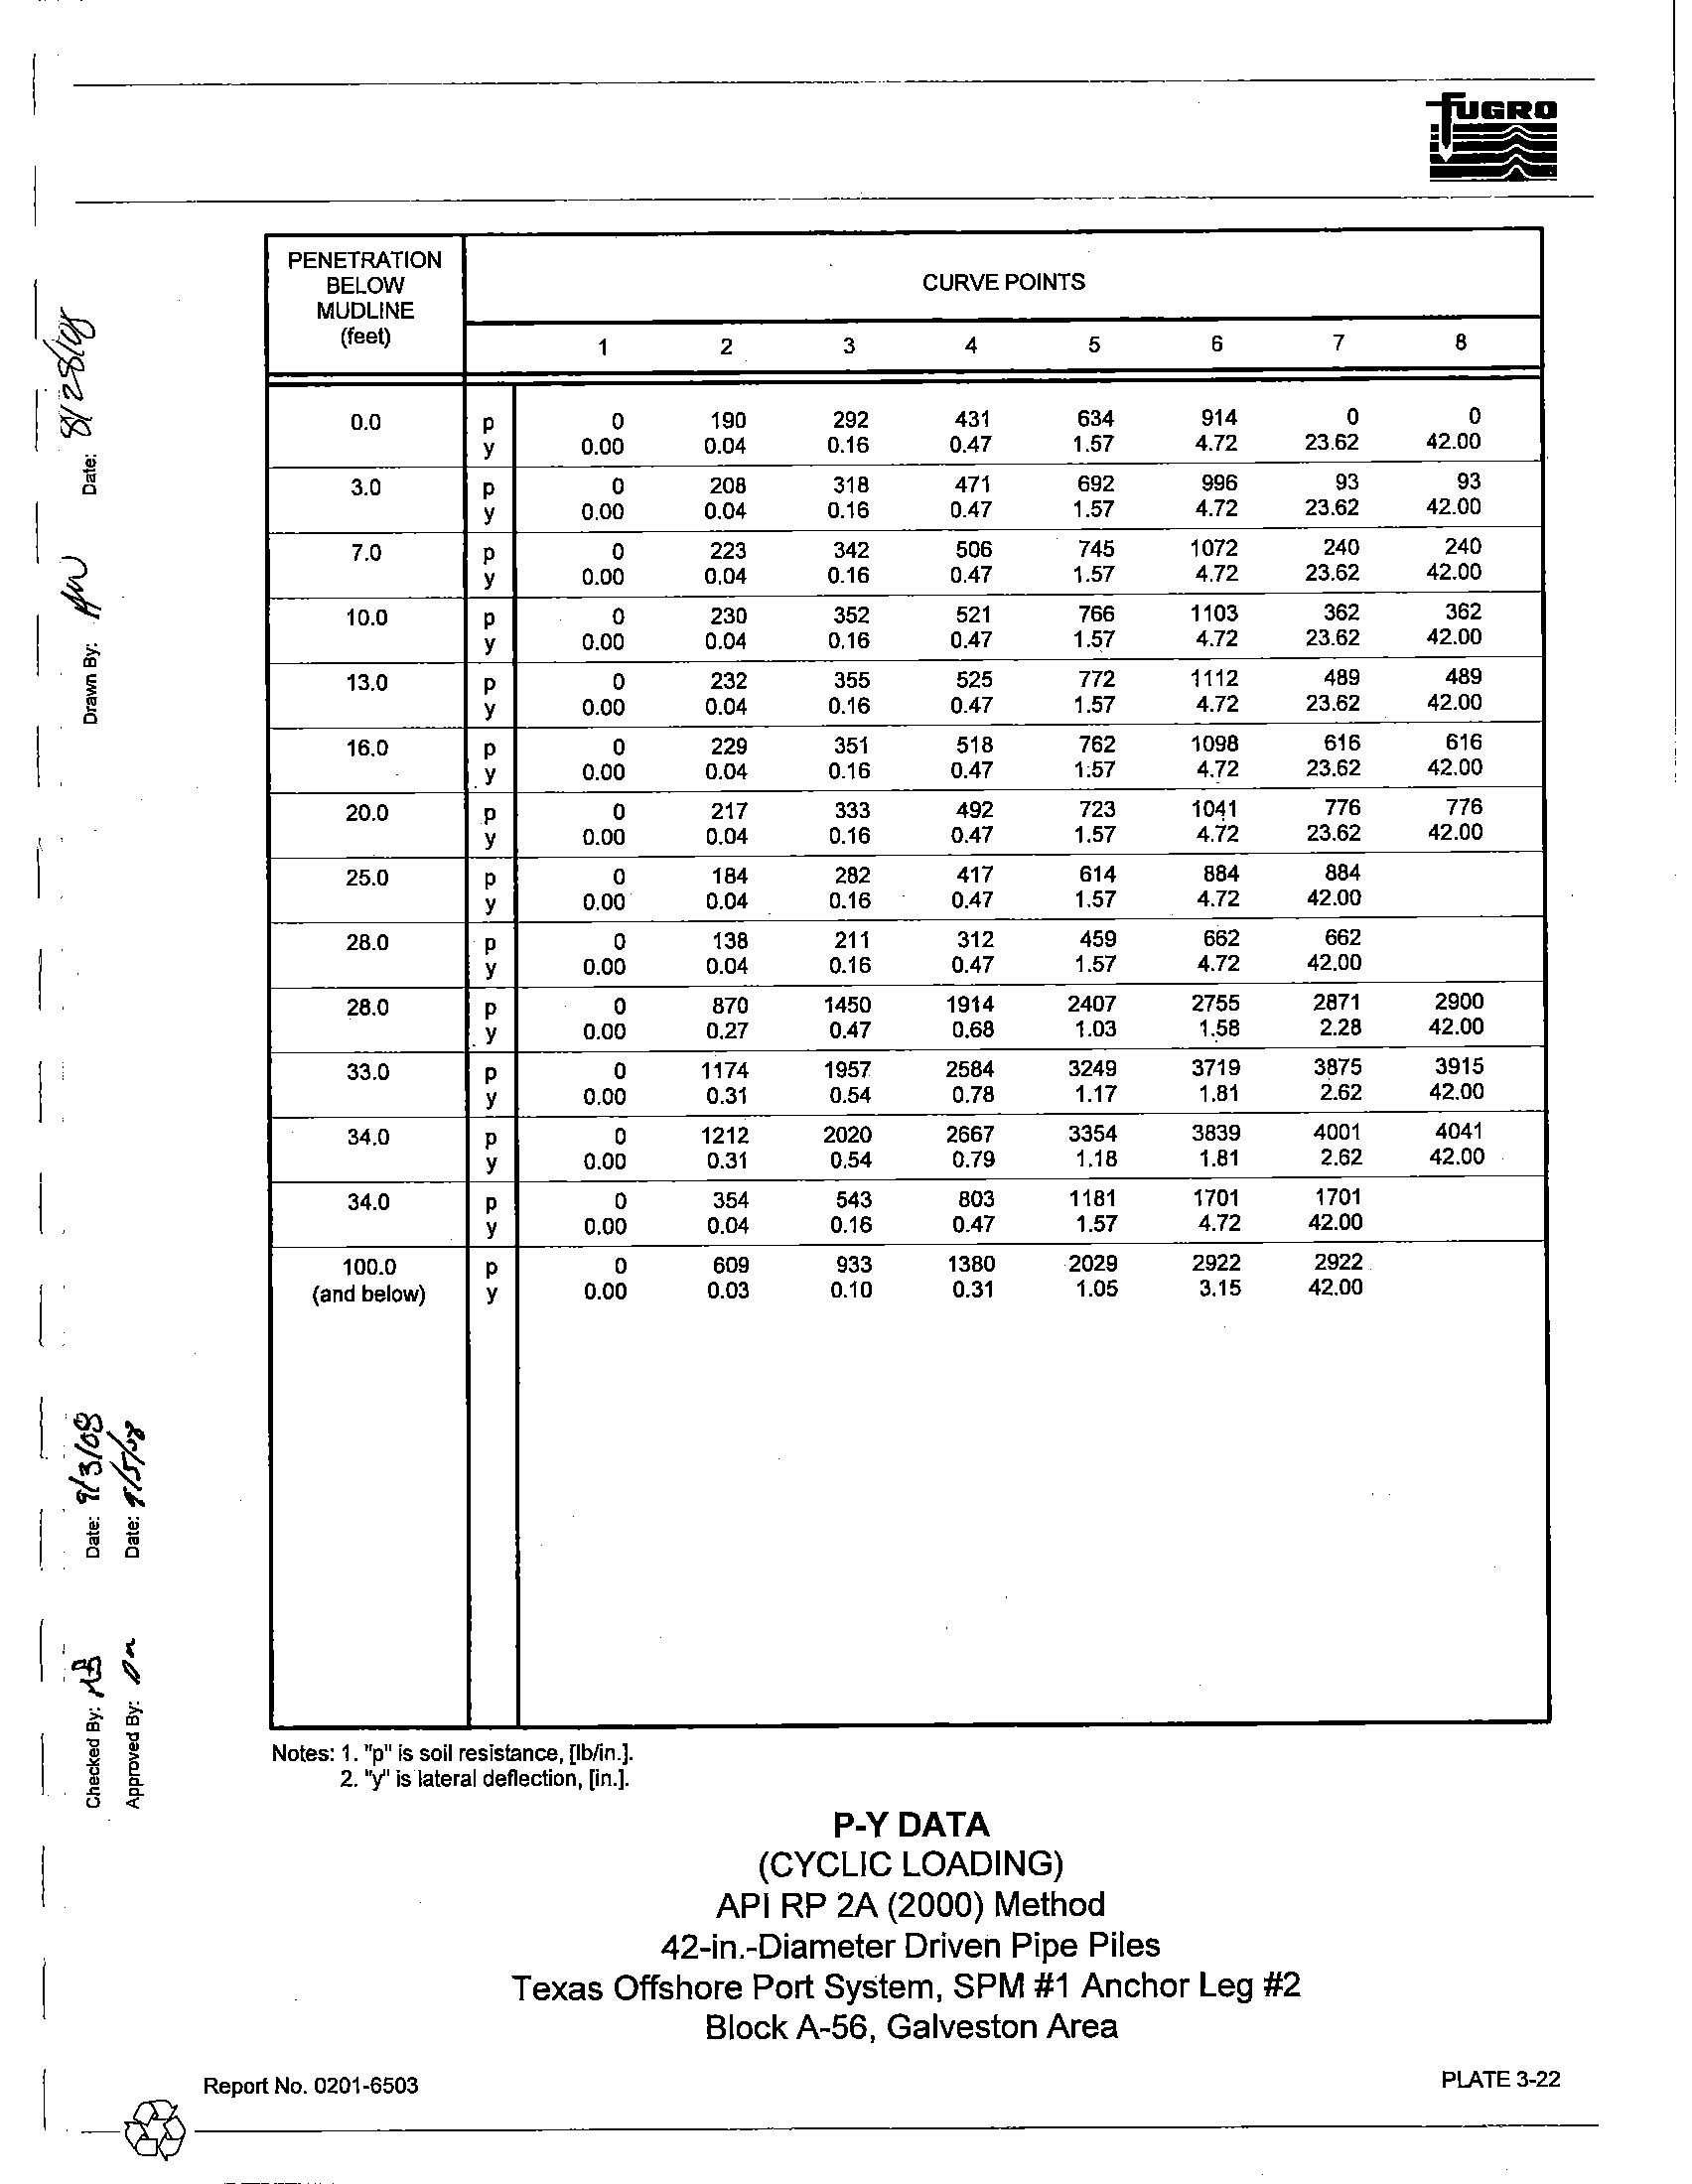
Notes: 1. "p" is soil resistance, [Iblin.].
2.
'Y'
is lateral deflection, [in.].
CURVE POINTS
2
3
4
5
190
292
431
634
0.04
0.16
0.47
1.57
208
318
471
692
0.04
0.16
0.47
1.57
223
342
506
745
0.04
0.16
0.47
1.57
230
352
521
766
0.04
0.16
0.47
1.57
232
355
525
772
0.04
0.16
0.47
1.57
229
351
518
762
0.04
0.16
0.47
1;57
217
333
492
723
0.04
0.16
0.47
1.57
184
282
417
614
0.04
0.16
0.47
1.57
138
211
312
459
0.04
0.16
0.47
1.57
870
1450
1914
2407
0.27
0.47
0.68
1.03
1174
1957
2584
3249
0.31
0.54
0.78
1.17
1212
2020
2667
3354
0.31
0.54
0.79
1.18
354
543
803
1181
0.04
0.16
0.47
1.57
609
933
1380
2029
0.03
0.10
0.31
1.05
P-YDATA
(CYCLIC LOADING)
API RP 2A (2000) Method
42-in.-Diameter Driven Pipe Piles
6
914
4.72
996
4.72
1072
4.72
1103
4.72
1112
4.72
1098
4.72
1041
4.72
884
4.72
662
4.72
2755
1.58
3719
1.81
3839
1.81
1701
4.72
2922
3.15
Texas Offshore Port System, SPM #1 Anchor Leg #2
Block A-56, Galveston Area
7
8
0
0
23.62
42.00
93
93
23.62
42.00
240
240
23.62
42.00
362
362
23.62
42.00
489
489
23.62
42.00
616
616
23.62
42.00
776
776
23.62
42.00
884
42.00
662
42.00
2871
2900
2.28
42.00
3875
3915
2.62
42.00
4001
4041
2.62
42.00
1701
42.00
2922
42.00
I __
~_R_e_po_rt_N_O_._02_0_1-_6_50_3
_____________________________________________________________P_LA
__
T_E_3_~_2
__
4
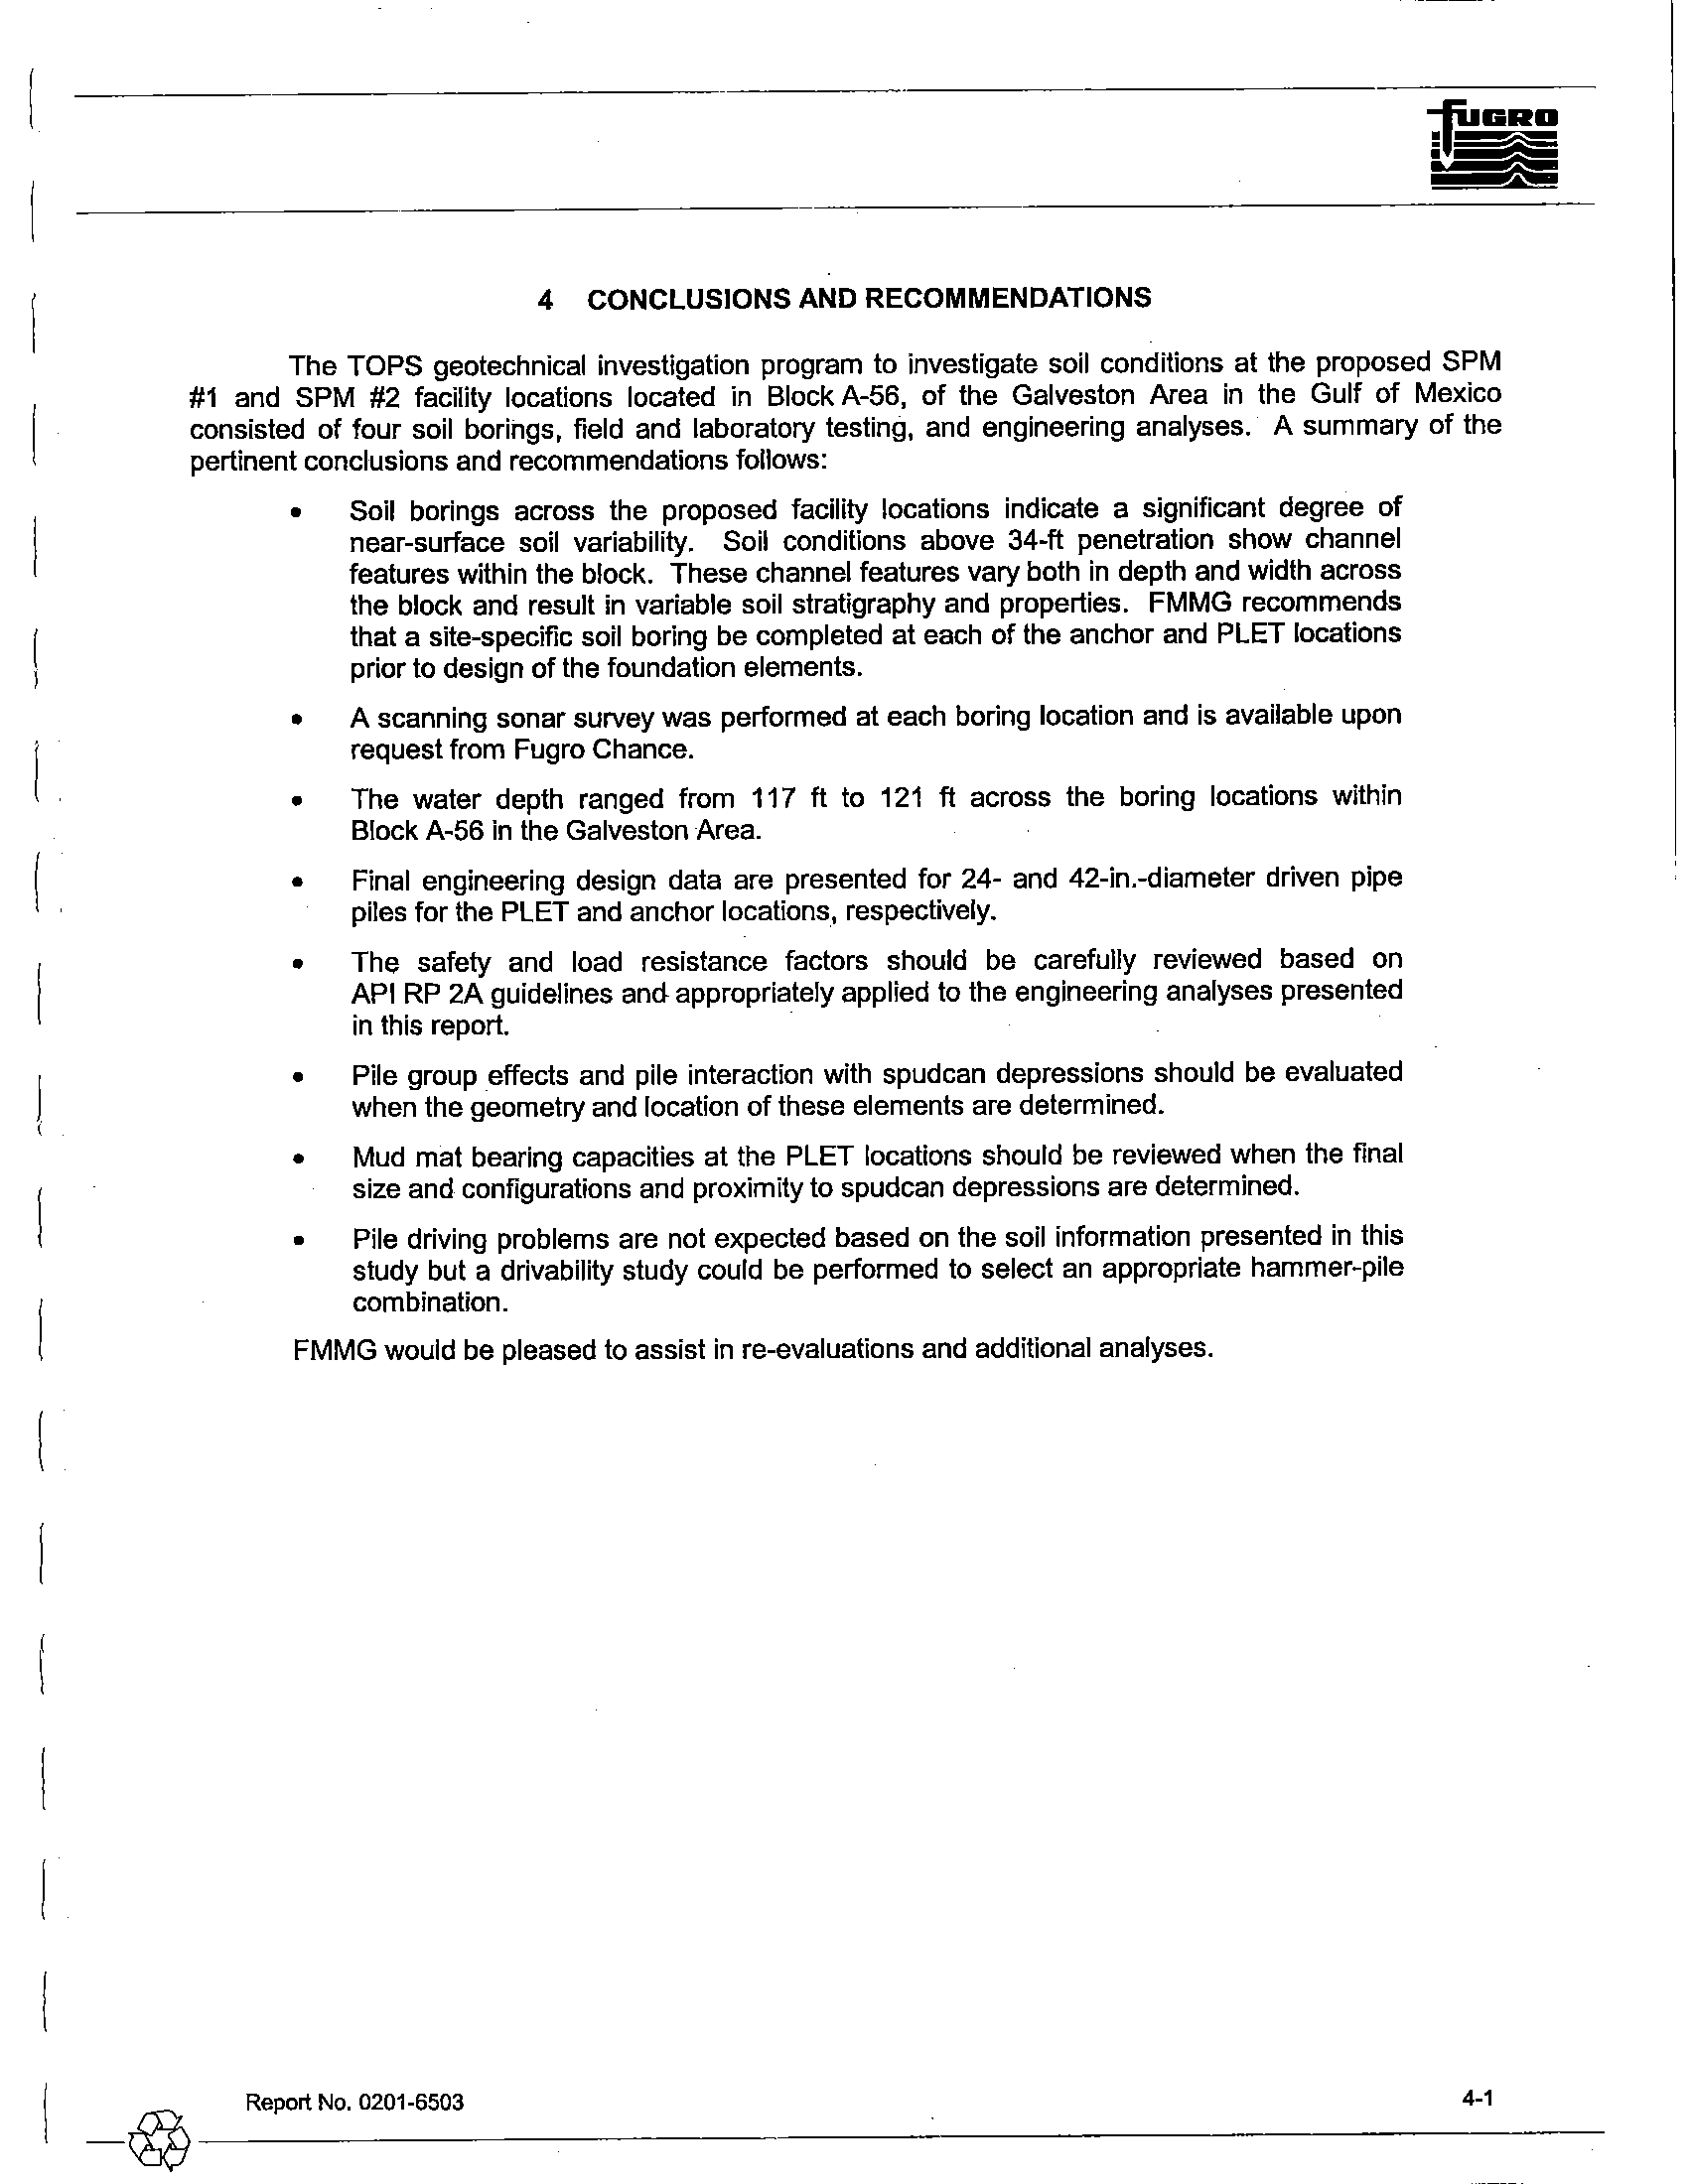
CONCLUSIONS AND RECOMMENDATIONS
The TOPS geotechnical investigation program to investigate soil conditions at the proposed SPM
#1 and SPM #2 facility locations located in Block A-56, of the Galveston Area in the Gulf of Mexico
consisted of four soil borings, field and laboratory testing,
and engineering analyses. A summary of the
pertinent conclusions and recommendations follows:
•
Soil borings across the proposed facility locations indicate a significant degree
of
near-surface soil variability.
Soil conditions above 34-ft penetration show channel
features within the block. These channel features vary both
in depth and width across
the block and result
in variable soil stratigraphy and properties. FMMG recommends
that a site-specific soil boring be completed at each
of the anchor and PLET locations
prior to design
of the foundation elements.
•
A scanning sonar survey was performed at each boring location and is available upon
request from Fugro Chance.
•
The water depth ranged from 117 ft to
121 ft across the boring locations within
Block A-56
in the Galveston Area.
•
Final engineering design data are presented for 24-
and 42-in.-diameter driven pipe
piles for the PLET and anchor locations, respectively.
•
The safety
and load resistance factors should be carefully reviewed based on
API RP 2A guidelines and appropriately applied to the engineering analyses presented
in this report.
•
Pile group effects and pile interaction with spud
can depressions should be evaluated
when the geometry and location
of these elements are determined.
•
Mud mat bearing capacities at the PLET locations should be reviewed when the final
size and configurations
and proximity to spudcan depressions are determined.
•
Pile driving problems are not expected based
on the soil information presented in this
study but a drivability study could be performed to select
an appropriate hammer-pile
combination.
FMMG would be pleased to assist
in re-evaluations and additional analyses.
I
~
."
g.
Z
P
~
:l
in
:!l
'"
"
~
(T1
~
~
l.--
log
Drawn By:
-r[""",o'
Date:
9/¥
r~
8
..
".
--
Job No.: 0201-6503-1
04-Sep-2008
(Ver. #4)
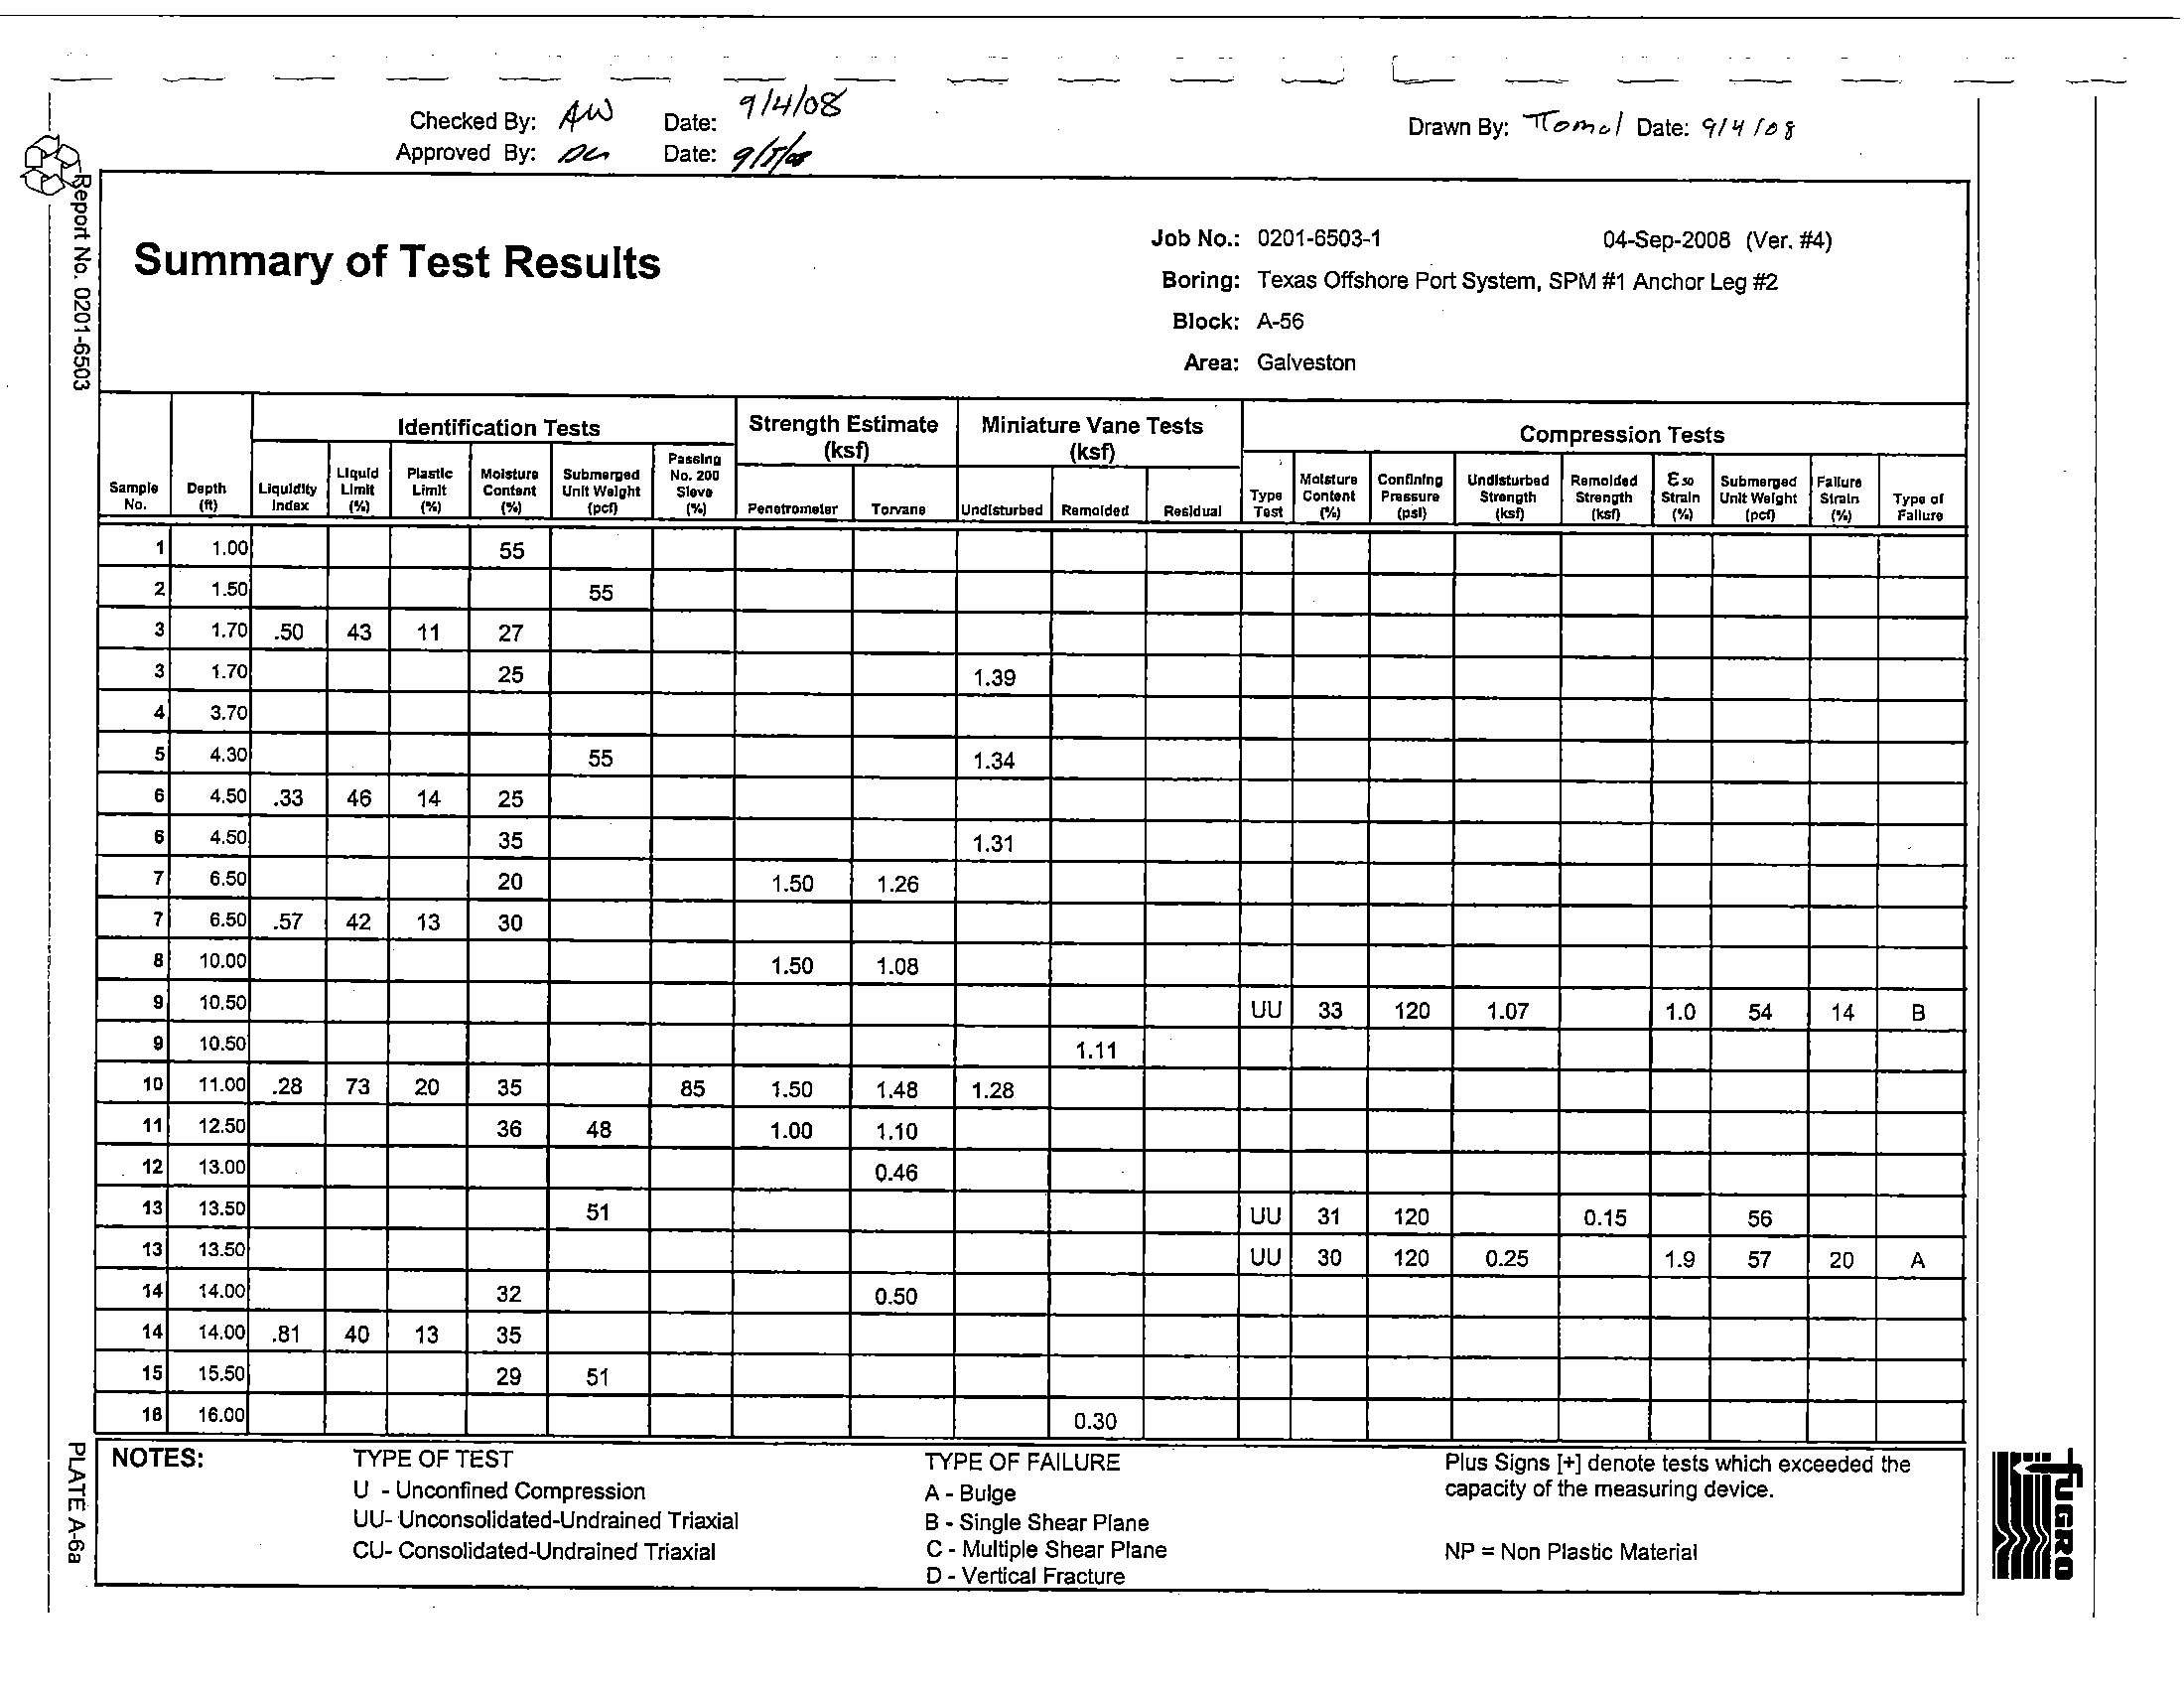
Summary of Test Results
Boring: Texas Offshore Port System, SPM #1 Anchor Leg
#2
Block: A-56
Area: Galveston
Identification Tests
Strength Estimate
Miniature Vane Tests
Compression Tests
P;sslng
(ksf)
(ksf)
Liquid
PLlIstic
Moisture
Submerged
No. 200
Moisture
Conflnlng
Undlstllrbed
Remolded
E~
Submerged
FaUure
Sample
Depth
liquIdIty
Limit
LimIt
Content
UnIt Walght
Slev.
Type
Content
Pra5&ure
Strenllth
Strength
Strain
UnltWelllht
Strain
Type
gl
No.
1ft)
Index
(%)
(')
(%)
"01)
(%)
Penetrometer
TOIVlIne
Unc!lsturbed
Remolded
Residual
T'"
(%)
(psi)
("'"
(""l
(%)
(,01)
I'M
Failure
1
1.00
55
2
1.50
55
3
1.70
.50
43
11
27
3
1.70
25
1.39
4
3.70
5
4.30
55
1.34
6
4.50
.33
46
14
25
6
4.50
35
1.31
7
6.50
20
1.50
1.26
7
6.50
.57
42
13
30
•
10.00
1.50
1.08
9
10.50
UU
33
120
1.07
1.0
54
14
B
9
10.50
1.11
10
11.00
.28
73
20
35
85
1.50
1.48
1.28
11
12.50
36
48
1.00
1.10
12
13.00
0.46
I
13
13.50
51
UU
31
120
0.15
56
I
13
13.50
UU
30
120
0.25
1.9
57
20
A
14
14.00
32
0.50
I
14
14.00
.81
40
13
35
15
15.50
29
51
1.
16.00
0.30
NOTES:
TYPE OF TEST
TYPE OF FAILURE
Plus Signs I+] denote tests which exceeded the
U
- Unconfined Compression
A - Bulge
capacity of the measuring device.
UU- Unconsolidated-Undrained Triaxial
B
- Single Shear Plane
CU- Consolidated-Undrained Triaxial
C - Multiple Shear Plane
NP = Non Plastic Material
0- Vertical Fracture
I
~
?
z
~
~
~
b
'"
o
'"
-u
m
~
~
Checked By:
~
Date:
tJ/L!/o8"
Drawn
By:
f/on-.-li'l
Date:
9/'1
(oy
Approved By:
P ..
Date:
~ffi
.
Job No.: 0201-6503-1
04-Sep-2008 IYer.
#4)
Summary of Test Results
Boring: Texas Offshore Port System. SPM #1 Anchor Leg #2
Btock: A-56
Area: Galveston
Identification Tests
Strength Estimate
Miniature Vane Tests
Compression Tests
POIlIsi"1J
(ksf)
(ksf)
Liquid
Plastic
Moisture
Submerged
No. 200
MolstLire
Confining
Undisturbed
Remolded
E.
SubmBfliIsd
Failure
Sample
Depth
LIquidity
Limit
LImit
Conlant
UnltWalllht
Sieve
Typo
Content
Pl'lIssura
Strvnlllh
Strength
Slndn
Unit Welllht
Strain
Type or
N••
(0)
Inda:.:
f%J
f%J
1%)
(pel}
I%)
Pamtlromel.r
Torvana
Undlsturbad
Remolded
Residual
Test
!'I.)
(psi)
'''''
[kaf)
,%,
',d)
('10)
Failure
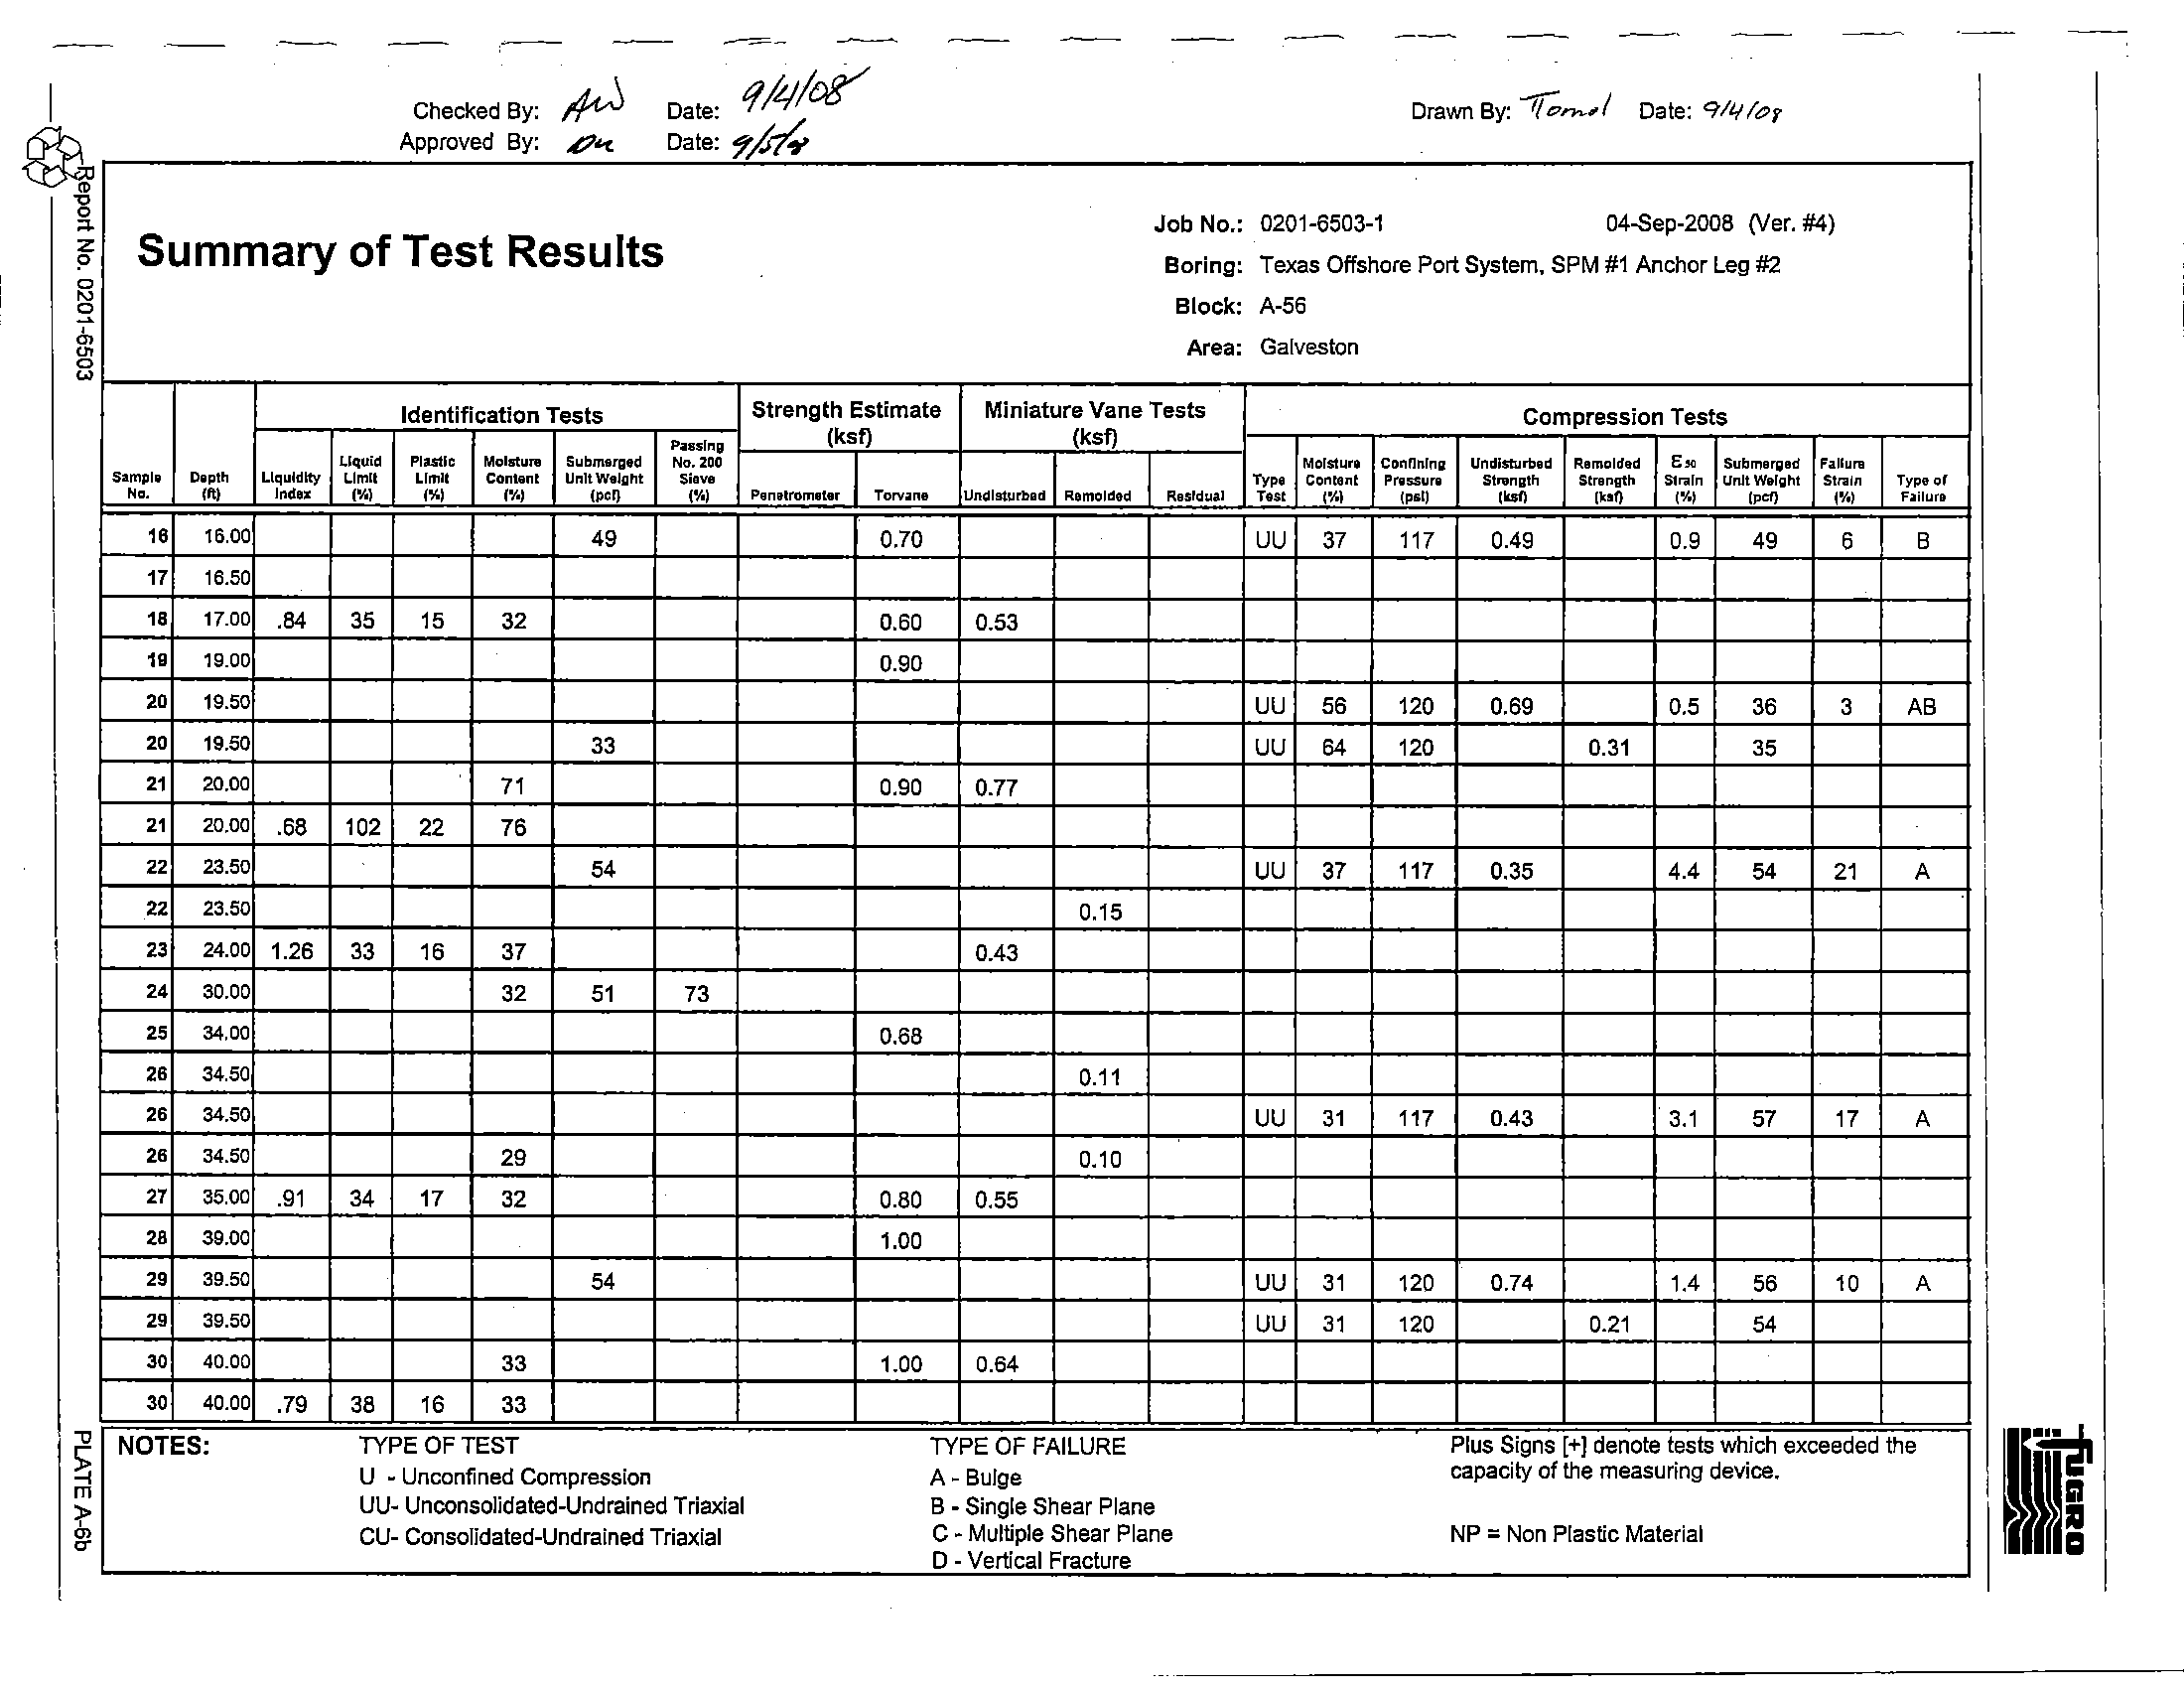
16
16.00
49
0.70
UU
37
117
0.49
0.9
49
6
B
17
16.50
16
17.00
.84
35
15
32
0.60
0.53
19
19.00
0.90
2.
19.50
UU
56
120
0.69
0.5
36
3
AB
2.
19.50
33
UU
84
120
0.31
35
21
20.00
71
0.90
0.77
21
20,00
.68
102
22
76
22
23.50
54
UU
37
117
0.35
4.4
54
21
A
!
22
23.50
0.15
23
24.00
1.26
33
16
37
0.43
24
30.00
32
51
73
25
34.00
0.68
26
34.50
0.11
I
26
34.50
UU
31
117
0.43
3.1
57
17
A
2.
34.50
29
0.10
27
35.00
.91
34
17
32
0.80
0.55
26
39.00
1.00
2.
39.50
54
UU
31
120
0.74
1.4
56
10
A
I
2'
39.50
UU
31
120
0.21
54
30
40.00
33
1.00
0.64
30
40.00
.79
38
16
33
NOTES:
TYPE OF TEST
TYPE OF FAILURE
Plus Signs
[+) denote tests which exceeded the
U
w
Unconfined Compression
A - Bulge
capacity of the measuring device.
I
UU- Unoonsolidated-Undrained Triaxial
B - Single Shear Plane
I
CU- Consolidated-Undrained Triaxial
C - Multiple Shear Plane
NP = Non Plastic Material
o-
Vertical Fracture
I
~
-g
"-
z
"
~
§
""Q
m
~
~
./t;/o!)
Drawn By:
'"1(0
hi " /
Date:
ql'ffoS
... ,. -,
-
Job No.: 0201.6503.1
04.Sep.2008 (Ver. #4)
Summary of Test Results
Boring: Texas Offshore 'Port System, SPM #1 Anchor Leg #2
Block: A.56
Area: Galveston
Identification Tests
Strength Estimate
Miniature Vane Tests
Compression Tests
Passin"
(ksf)
(ksf)
Liquid
Plastll;
Moisture
Submarvad
No. 200
.
,
Type
Molslure
Confining
Undisturbed
RemOlded
E"
Subm"I'Vad
Filnur.
SlImpl,
Dopth
Llquldlty
Limit
Limit
Content
Unit Weight
S[eve
Content
Praasura
StrengCh
Stran'ilth
Str.liln
UnltWalghf
Stlllin
Type
or
N,.
,ft)
Inde.
,%)
(%)
(%)
(pol)
(%)
penelroma!8r
Torvana
Undl8lurbud
Remolded
ResIdual
T."
(%)
(psO
,...,
('"
,%)
(PI:f)
,%)
FallllF1l
31
44.00
0.92
32
44.50
UU
122
0.29
55
32
44.50
UU
33
117
1.15
1.1
54
5
A
33
45.00
.63
39
17
31
1.06
0.68
34
48.50
54
0.92
35
49.00
32
1.08
1.25
35
49.00
33
36
54.00
1.00
1.20
37
54.50
UU
122
0.41
49
37
54.50
51
UU
38
117
1.24
1.2
51
4
A
3.
55.00
.91
41
15
38
1.25
1.25
1.57
39
59.00
0.95
40
59.50
48
41
60.00
39
81
1.00
1.55
I
41
60.00
.79
42
15
37
42
64.50
51
43
65.00
38
1.00
1.00
43
65.00
.80
48
18
42
44
67.00
1.00
1.25
45
67.50
51
46
68.00
.62
62
20
46
46
68.00
45
1.00
1.66
NOTES:
TYPE OF TEST
TYPE OF FAILURE
Plus Signs
[+1 denate tests which exceeded the
U
- Unconfined Compression
A. Bulge
capacity of the measuring device.
UU- Unconsolidated-Undrained Triaxial
B
- Single Shear Plane
CU- Consolidated-Undrained Triaxial
C. Multiple Shear Plane
NP = Non Plastic Material
D
- Vertical Fracture
I
~
!
p
z
in
~
'"
o
w
"
rn
~
~
fIeJ
Summary of Test Results
Identification Tests
Passing
LIquid
PI..stlc:
Molstu"'
Submwrged
No.2DO
Sample
OapUi
LIquidity
Limit
Limit
COl1Wnt
UnllWall1ht
SIllY'
N~
'ft)
Index
"J
,.,
,.,
"d}
'%J
47
77.00
48
77.50
48
77.50,
4"
78.00
42
50
87.00
51
87.50
53
52
88.00
37
52
88.00
.62
51
17
38
53
97.00
54
97.50
54
97.50
55
96.00
36
56
107.00
57
107.50
43
56
106.00
46
56
106.00
.43
76
22
46
59
117.00
60
117.50
60
117.50
61
118.00
31
62
127.00
63
127.50
56
NOTES:
TYPE OF TEST
U
- Unconfined Compression
UU. L,Lnconsolidated-Undrained Triaxial
CU- Consolidated-Undrained Triaxial
,/q/eK
Drawn By: -rio
no. /
Date:
'l/4/0?
Job No.: 0201-6503-1
04-Sep-2008 01er.
#4)
Boring: Texas Offshore Port System, SPM #1 Anchor Leg
#2
Block: A-56
Area: Galveston
Strength Estimate
Miniature Vane Tests
Compression Tests
(ksf)
(ksf)
Moishlro
Conlln!n"
Undisturbed
Remolded
",.
Submerged
Fillura
Typo
Contell1
Pressure
Strength
Strength
Stf"iln
UnltWellilht
Strain
Type of
Penetrometer
Torvana
Undisturbed
Ramolded
RasJdL/.illI
Test
,.,
(psi)
,...
,,.,,
,.,
"d}
,.,
Filliura
1.00
1.25
UU
121
0.36
50
UU
36
118
1.55
1.0
50
3
B
1.00
1.25
1.47
1.00
1.50
1.25
1.40
1.21
.
1.25
1.25
UU
38
118
2.05
0.7
51
3
8
I
UU
121
0.43
52
1.25
1.50
1.34
1.75
1.65
1.50
1.25
1.51
I
1.50
1.65
UU
29
121
1.72
1.5
58
5
B
UU
122
0.40
58
1.25
1.50
1.70
1.50
1.80
TYPE OF FAILURE
Plus Signs
[+]
denote lesls which exceeded the
A- Bulge
capacity of the measuring device.
B - Single Shear Plane
C
- Multiple Shear Plane
NP = Non Plastic Material
D
- Vertical Fracture
I
@
"C
i:'
0
"-
z
100
p
0
'"
2
90
""
~
0
'"
80
f-
70
r
C9
>-
OJ
~
60
en
z
C9
50
'"
rf.
f-
(J
z
w
40
'"
W
Q.
30
20
10
0
100
"tJ
~
o
~
-
-/V,-
--,heeke,..
'T
v
-
Approved by;
4a
u.s. STANDARD
SIEVE SIZES IN INCHES
3
2
1 314
I I
I
I
I
I
I
I
I
I
I
I
I
I
I
I
GRAVEL
Coarse
I
318
10
Fine
4
I
I
I
I
I
I
I
I
I
I
I
I
I
I
I
Da~~
Date:
fifr"'-
~
.
u.S. STANDARD SIEVE NUMBERS
10
20
40
60
100
200
I
~
I
I
I
I
I
I
I
I
I
I
I
I
I
I
1
0.1 .075
GRAIN SIZE IN MILLIMETERS
SAND
Coarse
I
Medium
I
Fine
SAMPLE NO.
DEPTH, Ff
SYMBOL
CLASSIFICATION
24
30.00
o
SILT (ML)";th sand, clay pockets, partings and seams
GRAIN-SIZE DISTRIBUTION CURVES
Texas Offshore Port System, SPM #1 Anchor Leg #2
Block A-56, Galveston Area
--c.
_____.by:
.- • -#) ;
_. ___.
-'?
Iq-,
_ ..
HYDROMETER
0
10
20
30
r
f-
C9
W
5:
40
>-
OJ
Cl
w
50
;;:;
"
w
60 !z
'"
UJ
(J
70 If
'"
80
90
100
0.Q1
0.002
0.001
SILTorCLAY
._---
I
t~
,
•
t~
.
'-
<t-
o
"
h
•
<n
(
<n
'
r
t~
-
CI)
~
~
-
....
0
"
.;;
rn
I
Q)
0
-0
Q)
N
rn
z
E
....
0
, J
:t
,I
E~
k
t~ ~
" "
.
1~
I
....
~
~ ~
t~
~
-{i [
,
0
~
~
1.25
.---------~--------~--------~--------r_------__,i
1.00
I
~:::::!t!I<;;;:::~i§ir ~ot&z§6 ~,
~
I
0.75 I 11
§
/
0,50
I."
rp
I
0.25 mt
I
0.000
4
8
12
16
Strain in Percent
Maximum
Confining
Deviator
Curve
Sample
Depth.
Test
Pressure
Stress
E50
No.
[It]
Type
[psi]
[ksf]
[%]
e>----tl
9
10.50
UU
120.5
2.14
1.0
'"
El
13
13.50
UU
120.0
0.50
1.9
•
•
16
16.00
UU
117.0
0.99
0.9
•
•
20
19.50
UU
120.2
1.38
0.5
• Normalized with respect to maximum deviator stress.
STRESS-STRAIN CURVES
Unconsolidated-Undrained Triaxial Compression Test
Texas Offshore Port System, SPM
#1 Anchor Leg #2
Block A-56, Galveston Area
20
PLATEA-14a
t
Report No. 0201-6503
-~---------------------------------
--------------------
I..
,
\)
,':J-
~
"
•
i~
\f-
I'"
~
"
1
, 1
I
,
,
1
f
..
~~
.~~
\ iii
iii
l~
~
1t~
>.
>.
u
'"
on
-I~
1
£
1.25
1.00
•
III
III
a>
r.::.
-
....
0.75
0
-
ro
.s;:
a>
0
""0
a>
.~
0.50
ro
E
....
0
Z
0.25
0.000
4
8
12
16
Strain in Percent
Maximum
Confining
Deviator
Curve
Sample
Depth
Test
Pressure
Stress
1:50
No.
[ft]
Type
[psi]
[ksf]
[%]
~
22
23.50
UU
117.2
0.70
4.4
[T----f]
26
34.50
UU
116.9
0.87
3.1
•
•
29
39.50
UU
120.1
1.48
1.4
•
•
32
44.50
UU
117.0
2.30
1.1
• Normalized with respect to maximum deviator stress.
STRESS-STRAIN CURVES
Unconsolidated-Undrained Triaxial Compression Test
Texas Offshore Port System, SPM
#1 Anchor Leg #2
Block A-56, Galveston Area
I
Report No. 0201-6503
-@----
20
PLATEA-14b
I..
.
~
~
h
.~
Ii
,I
,I
I
, 1
o
•
.~
'~~
I
~
~
o
0
'W
~
,
~
..
>.
~
~
----l~
-
~
I-
~
itj
!t
1.25
1.00
~
rJl
rJl
(])
.....
L-
rn
L-
0.75
.>
.....
0
(])
(1l
0
"0
(])
.~
0.50
(1l
E
L-
z
0
0.25
0.000
4
8
12
16
Strain in Percent
Maximum
Confining
Deviator
Depth
Test
Pressure
Stress
E50
[ttl
Type
[psi]
[ks!]
[%]
Curve
Sample
No.
e
"
37
54.50
UU
116.8
2.48
1.2
B----fl
48
77.50
UU
117.5
3.10
1.0
•
•
54
97.50
UU
118.1
4.09
0.7
• Normalized with respect to maximum deviator stress.
STRESS-STRAIN CURVES
Unconsolidated-Undrained Triaxial Compression Test
Texas Offshore Port System, SPM
#1 Anchor Leg #2
Block A-56, Galveston Area
20
PLATE A-14c
1
Report No. 0201-6503
-@----------------------
I
1.25
,
I~
'"
~
{l
1.00
"
h
~
~
en
it
en
-
~
rJ)
~
C5
0.75
I
"
-
.s:
rn
Cl.l
0
-a
I
Cl.l
.t::!
0.50
rn
'-
E
,I
z
0
)
0.25
0.000
'~
~~
)
iii
"
'Iii
"
" "
l~
{fi
{fi
I
:t
u
-l~
.1_@Report No.
0201-6503
4
8
12
16
Strain in Percent
Maximum
Confining
Deviator
Curve
Sample
Depth
Test
Pressure
Stress
eSO
No.
[ft]
Type
[psi]
[ksf]
[%]
<r---t>
60
117.50
UU
121.0
3.43
1.5
B----fl
66
130.50
UU
120.5
4.33
0.7
• Normalized with respect to maximum deviator stress.
STRESS-STRAIN CURVES
Unconsolidated-Undrained Triaxial Compression Test
Texas Offshore Port System, SPM
#1 Anchor Leg #2
Block A-56, Galveston Area
20
PLATE
A-14d
ANALYTICAL PROCEDURES
CONTENTS
Page
CRITERIA FOR AXIAL PILE LOAD ANALYSIS ..........................................................................................8-1
Method of Analysis ..........................................................................................................................8-1
Unit Skin Friction .............................................................................................................................
8-1
Cohesive Soils ...................................................................................................................8-1
Granular Soils ....................................................................................................................
8-2
Unit End Bearing .............................................................................................................................8-2
Cohesive Soils ...................................................................................................................
8-2
Granular Soils ....................................................................................................................8-2
Equivalent Unit End Bearing ..............................................................................................8-2
CRITERIA FOR AXIAL LOAD TRANSFER DATA ......................................................................................8-3
Side Friction Versus Pile Movement Data ......................................................................................8-3
Cohesive Soils ...................................................................................................................B-3
Granular Soils ........
~
...........................................................................................................B-3
Tip Load Versus Tip Movement Data .............................................................................................B-3
CRITERIA FOR LATERAL SOIL RESISTANCE-PILE DEFLECTION DATA ..............................................B-3
Cohesive Soils ....................................................................................................'...........................
8-3
Granular Soils .................................................................................................................................8-4
SCOUR EFFECTS .......................................................................................................................................B-5
SERVICE WARRANTY ................................................................................................................................
8-6
ILLUSTRATIONS
Plate
Summary of Recommended Design Parameters (API RP 2A, 2000) for
Cohesionless Siliceous Soils ..........................................................................................................8-1
Typical Side Load Transfer (t-z) Curves .......................................................................................................
8-2
Typical Pile Tip Load Transfer (Q-z) Curves ................................................................................................8-3
Typical Lateral Load-Pile Deflection (p-y) curves .........................................................................................8-4
I
Report No. 0201-6503
-~--------------------------------------
CRITERIA FOR AXIAL PILE LOAD ANALYSIS
In this report, the word "pile" is used as a generic term for foundation piles, caissons and
conductors. The installation
of caissons and conductors is the same as that of foundation piles, except that
the soil plug
is later removed or disturbed, thus reducing the end bearing component. For this reason, the
end bearing of caissons
and conductors is neglected in capacity computations.
Method of Analysis
The static method of computing axial pile capacity described
in API RP 2A (2000) is used to
compute ultimate compressive and tensile capacities
of pipe piles installed to a given penetration. In this
method, the ultimate compressive capacity,
Q, for a given penetration is taken as the sum of the skin
friction
on the pile wall, Q" and the end bearing on the pile tip, Qp, so that:
Q
=
Q,+ Q
p
=
fA, + qAp
where A, and Ap represent, respectively, the embedded surface area and pile end area; f and q represent,
respectively, the unit skin friction and unit end bearing. Procedures used to compute values of f and q are
discussed
in the following paragraphs. When computing ultimate tensile capacity or compressive capacity
of conductors and caissons, the end bearing term in the above equation is neglected.
Unit Skin Friction
Cohesive Soils.
Computation
of Q, for pipe piles embedded in cohesive soils is done in
accordance with the API RP 2A recommendations. According to API RP 2A-WSD (2000), Sec. 6.4.2 or
API RP 2A-LRFD (1993), Sec. G.4.2, the unit skin friction may be expressed as:
f
=
a
Su
where:
a
=
a dimensionless factor; and
S,
=
undrained shear strength of the soil at the point in question.
The factor a
is computed by:
a
=
0.5 IV
-0.5
for IV ,;; 1.0, or
a
=
0.5 IV
-0.25
for IV > 1.0
with the constraint that a
,;; 1.0,
where:
IV
=
SJcr', for the point in question, and
cr',
=
effective vertical stress at the point in question.
The undrained shear strength used
in our computations and the values of submerged unit weight used to
compute effective vertical stress are presented
in the main report along with the resulting skin friction
values.
I_@Report No. 0201-6503
B-1
Granular Soils.
The procedure recommended by API RP 2A-WSD (2000), Sec.
6A.3
or
API
RP 2A-LRFD (1993), Sec.
GA.3
is used to determine unit skin friction in granular soils.
Unit skin
friction,
f, for granular soils is computed from the expression:
f
=
Ko-',tano
where:
K
=
coefficient of lateral earth pressure,
a"
=
effective vertical stress, and
o
=
angle of friction between soil and pile.
API RP 2A recommends values for K of 0.8 for open-ended pipe piles driven unplugged, and 1.0 for
full displacement piles (plugged or close-ended).
API RP 2A presents recommended values for 0, the angle of friction acting between the soil and
pile and specifies limiting values
of skin friction. The recommended values for granular deposits composed
primarily
of silica are related to the density and composition of the granular deposits, and are presented on
Plate B-1.
Unit End Bearing
Cohesive Soils.
The procedure recommended by API
RP 2A-WSD (2000), Sec.
6A.2
or
API
RP 2A-LRFD (1993), Sec.
GA.2
is used to determine unit end bearing, q, in clays. Unit end bearing in
clays can be estimated by the following equation:
q
=
9 Su
where:
Su
=
undrained shear strength.
Granular Soils. Unit end bearing
in granular soils is computed by API RP 2A-WSD (2000),
Sec. 6.4.3 or API
RP 2A-LRFD (1993), Sec.
GA.3
using the expression:
where:
q
=
a'v
N
q
a'v
=
effective vertical stress, and
N.
=
a dimensionless bearing capacity factor that is a function of q" the angle of internal
friction of the material.
Recommended bearing capacity factors,
N., for granular soils composed primarily of silica are given in
API RP 2A and are presented on Plate B-1. Also shown on Plate B-1 are limiting unit end bearing values.
Equivalent
Unit End Bearing. For open-ended driven pipe piles, the end bearing is limited to the
frictional resistance of a soil plug developed inside the pile. The total skin friction on the inside
of the pile is
assumed equal to the total skin friction on the outside of the pile. Any influence
of the driving shoe on the
internal skin friction
is neglected. The end bearing on the steel end area of the pile is also neglected. The
assumptions made
in the analyses make no difference in the unit end bearing below the point where the
pile plugs (I.e., equivalent unit end bearing becomes equal to unit end bearing). Above this point, the unit
end bearing
is limited by the frictional resistance of the soil plug.
I
Report No. 0201-6503
~@---~
8-2
,I
CRITERIA FOR AXIAL LOAD TRANSFER DATA
An axial load-pile movement analysis requires load transfer data on the skin friction along the side
of the pile (t-z data) and the end bearing
on the pile tip (Q-z data). Recommended procedures are given in
API RP 2A-WSD (2000), Sec. 6.7 or API RP 2A-LRFD (1993), Sec. G.7.
Side
Friction Versus Pile Movement Data
Axial side load transfer curves are different for cohesive soils (clay) and granular soils (sand).
Typical axial side load transfer-displacement (t-z) curves for both material types are illustrated on Plate B-2
and discussed below.
Cohesive Soils, The side friction versus pile movement (t-z) curve for cohesive soils is given
in
API RP 2A-WSD (2000), Sec.6.7.2 or API RP 2A-LRFD (1993), Sec. G.7.2, and is the same for
compressive
and tensile loading. The maximum side friction, t
ma"
at the pile-soil interface is taken as the
ultimate skin friction,
f, as determined by API RP 2A-WSD (2000), Sec. 6.4.2 or API RP 2A-LRFD (1993),
Sec. G.4.2.
The post peak adhesion ratio for clays can range from 0.90 to 0.70 for highly plastic, normally
consolidated clays, to
as low as 0.50 for low plasticity, highly overconsolidated clays. The recommended
adhesion ratios beyond peak values for static loading conditions are given
in the report text.
Granular Soils. The side friction versus pile
movement
(t-z) curve for granular soils is presented in
API RP 2A-WSD (2000), Sec. 6.7.2 or API RP 2A-LRFD (1993), Sec. G.7.2. The maximum side friction,
t
max,
at the pile-soil interface is the ultimate unit skin friction, f, determined by API RP 2A-WSD (2000),
Sec. 6.4.3
or API RP 2A-LRFD (1993), Sec. G.4.3.
Tip Load Versus Tip Movement Data
Relatively large axial
movements
may be required to mobilize full end bearing resistance. End
bearing or tip load increases with displacement of the pile tip. The development of full end bearing occurs
at a displacement equal to 10 percent
of the pile diameter according to API RP 2A. The tip load versus tip
movement
curve is given in API RP 2A-WSD (2000), Sec. 6.7.3 or API RP 2A-LRFD (1993), Sec. G.7.3.
The end bearing component should not
be considered when tensile loads are applied to a pile. Typical pile
tip-load-displacement (Q-z) curves are presented
in Plate B-3.
CRITERIA FOR LATERAL SOIL RESISTANCE-PILE DEFLECTION DATA
API RP 2A recommends that pile foundations be designed for lateral loading conditions. The lateral
soil structure interaction is complex and the soil response
to lateral loading is generally nonlinear. To
analyze this complex interaction, a computer program based
on the finite difference or finite element
method is normally used.
The nonlinear soil response
is input into these methods with lateral soil
resistance-pile deflection (p-y) curves. The methods for constructing p-y curves follow.
Cohesive
Soils
Soil resistance-pile deflection (p-y) data for cohesive soils are developed using the procedure
outlined by Matlock (1970) for soft clays subjected to cyclic loads and adopted by API
RP 2A-WSD (2000),
Sections 6.8.2 and 6.8.3. Interpreted shear strengths, submerged unit weights, and strain
values
at one-
I_@
Report No. 0201-6503
B.3
I
I I
I
\
I
I
!
I
half the maximum deviator stress
(E50)
used in our computations are presented in the text illustrations.
These strain values were selected based on data from unconsolidated-undrained triaxial compression tests.
The ultimate lateral soil resistance
(Pus) increases from 3SuD to 9S
u
D as X increases from 0 to X
R
according to:
Pus
and
Pud
where:
Pu
Su
0
y
J
X
X
R
=
=
=
=
=
=
=
=
=
3S
u
D +
yXD + JSuX
9SuD for X
~
X
R
ultimate resistance (s
=
shallow, d
=
deep),
undrained shear strength for undisturbed clay soil samples,
pile diameter,
effective unit weight of soil,
dimensionless empirical constant with values ranging from 0.25 to 0.5
having been determined by field testing. A value of 0.5 is appropriate for
Gulf of Mexico clays,
depth below soil surface, and
depth below soil surface to bottom of reduced resistance zone.
The deflection values
(y)
are a function of the pile diameter and
E50.
Typical curve shapes are
shown
on Plate B-4.
Granular
Soils
Soil resistance-pile deflection (p-y) data for granular soils are developed using the procedure
outlined by O'Neill and Murchison (1983) for sands subjected to cyclic loading and adopted by API
RP 2A-
WSD (2000)
in Sections 6.8.6 and 6.8.7. Input parameters include submerged unit weight, angle of internal
friction,
and the initial modulus of horizontal subgrade reaction. These values are presented in the text
illustrations. Values of initial modulus of subgrade reaction are selected from the recommendations
in
API RP 2A based on our interpretation of the soil relative density from sampler driving resistance records
and grain size analyses.
I__
~R_e_p_o_rt_N_O_.O_2_0_1_-6_5_03
____________________________________________________________________B_4________
I
,
;,I
I
,
.1
At a given depth, the following equation giving the smallest
value
of Pu should be used as the
ultimate lateral bearing capacity in granular soils.
Pu,
=
(C, H + C
2
0) YH
and
Pud
=
C
3
0y H
where:
Pu
=
ultimate resistance (s
=
shallow, d
=
deep),
y
=
effective
unit weight of soil,
H
depth,
C
lo
C
2,
C
3
=
coefficients, and
o
average
pile diameter from surface to depth.
The shape
of the p-y curve in granular soil is defined by the following equation:
[
k H
]
P
= Apu tanh
--y
A Pu
where:
A
=
factor to account for cyclic or static loading condition,
Pu
=
ultimate bearing capacity at depth H,
k
=
initial modulus of subgrade reaction,
y
=
lateral deflection, and
H
=
depth.
The shape of typical granular p-y curves is illustrated on Plate 8-4.
SCOUR EFFECTS
Whenever the near-surface soils are comprised
of granular material, they may be susceptible to
scour. Scour effects are considered insignificant to axial capacity but can
have
a large influence on lateral
capacity. When scour
is considered likely, the p-y data are reduced to reflect the potential loss of lateral
support from the material scoured away near the seafloor around the pile. General scour indicates that
installation of the structure may cause a layer of material to be removed throughout the area of the platform.
Local scour indicates that scour is likely to occur only
in the near vicinity of the piles.
I___
~
R_e_p_o_rt_N_O_._02_0_'_-6_5_03______________
~
___________________________________________________B_-5_______
,I
SERVICE WARRANTY
The "Service Warranty" outlines the limitations and constraints of this report
in terms of a range of
considerations including, but not limited
to, its purpose, its scope, the data on which it is based, its use by
third parties, possible future changes
in design procedures and possible changes in the conditions at the
site with time. This section represents a clear description of the constraints which apply to all reports issued
by FMMG. It should
be noted that the Service Warranty does not in any way supersede the terms and
conditions of the contract between FMMG and the Client.
1. This report and the assessment carried out in connection with the report (together the "Services") were
compiled and carried out by Fugro-McCleliand Marine Geosciences, Inc. (FMMG) for the Client
in
accordance with the terms of the Contract. Further, and in particular, the Services were performed by
FMMG taking into account the limits
of the scope of works required by the Client, the time scale
involved, and the resources, including financial and manpower resources, agreed between FMMG and
the Client. FMMG has not performed any observations, investigations, studies
or testing not specifically
set out or required by the Contract between the Client and FMMG.
2. The Services were performed by FMMG exclusively for the purposes of the Client. Should this report or
any part of this report, or details of the Services
or any part of the Services be made known to any third
party, such third party shall not rely
on the report unless FMMG provides guidance required to interpret
the report,
Le., respond to non-operational questions. If such Ihird party does rely on the report without
obtaining FMMG's guidance, it does so wholly at its sole risk and FMMG disclaims
all liability resulting
from third party use of the report.
3. It is FMMG's understanding that this report is to be used for the purpose described in the report. That
purpose was a significant factor
in determining the scope and level of the Services. Should the purpose
for which the report
is used, and/or should the Client's proposed development or use of the site change
(including
in particular any change in any design and/or specification relating to the proposed use or
development of the site), this report may no longer be valid or appropriate and any further use of, or
reliance upon, the report
in those circumstances by the Client without FMMG's review and advice shall
be at the Client's sole and own risk. Should FMMG be requested, and FMMG agree, to review the
report after the date hereof, FMMG shall be entitled to additional payment at the then existing rates or
such other terms
as may be agreed between FMMG and Client.
4. The passage of time may result in changes (whether man-made or otherwise) in site conditions and
changes
in regulatory or other legal provisions, technology, methods of analysis, or economic
conditions, which could render the information and results presented
in the report inaccurate or
unreliable. The information, recommendations and conclusions contained
in this report should not be
relied upon if any such changes have taken place, without the written agreement of FMMG. In the
absence of such written agreement of FMMG, reliance
on the report after any such changes have
occurred shall be at the Client's own and sole risk. Should FMMG agree to review the report after such
changes have taken place, FMMG shall be entitled to additional payment at the then existing rates or
such other terms
as may be agreed between FMMG and the Client.
5. Where the Services have involved FMMG's interpretation and/or other use of any information (including
documentation or materials, analyses, recommendations and conclusions) provided by third parties
(including independent testing and/or information, services or laboratories) or the Client and upon which
FMMG was reasonably entitled to rely
or involved FMMG's observations of existing physical conditions
of any site involved
in the Services, then the Services clearly are limited by the accuracy of such
information and the observations which were reasonably possible of the said site. Unless otherwise
stated, FMMG was not authorized and did not attempt
to independently verify the accuracy or
completeness
of such information, received from the Client or third parties during the performance of
I
~~=1_
~
-~----------------------------------
;I
I
I
the Services. FMMG is not liable for any inaccuracies (including any incompleteness) in the said
information, save as otherwise provided
in the terms of the contract between the Client and FMMG.
6. The soil and ground conditions information provided in the Services are based solely on evaluations of
the
soil. and ground condition samples (and in situ tests) at determined sample test locations and
elevations. That information cannot be extrapolated to any area or elevation outside those locations
and elevations unless specifically so stated in the report.
In the light of the information available to
FMMG, the soil and ground conditions information
is considered appropriate for use in relation to the
geotechnical design and installation aspects of the structures addressed in the report, but they may not
be appropriate for the design of other structures.
I__
~
R_e_