Appendix B contains discussions of ana
l
ytical
procedures used
in
our
engineering analyses. Appendix C
contains a positioning
report
by
Fugro
Chance,
I
nc.,
of
Lafayette, Louisiana
.
•
For the purposes
of discussion and presentation, "driven pipe
pile"
is
used
in
this report
to represent
foundation piles,
caissons and conductors,
unless otherwise
specified.
2.2 FIELD AND LABORATORY
INVESTIGATIONS
The field investigation
was
performed
on Ju
l
y
4
through 6, 2008,
from the
RN
Seaprobe.
The
soil
cond
itio
ns were
determined
by performing
four exploratory borings
,
two at each
SPM location with
one
boring
at
a
selected
anchor
l
eg location, and one
boring
at
the
proposed
PLET location. Enterprise
Field
Services selected
the
boring
locations. These
borings were
drilled to
a penetration of 131-ft
below
mudline.
The water
depths
at
the boring locations ranged from 123 to 125
ft. A chronological summary
of
field
operations
is
presented
in
Appendix
A.
2.2.1
Exploratory Borings
FMMG
personnel
drilled
the
so
il
borings with a
OMX
drill
rig
positioned over
the
centerwell of
the
RN
Seaprobe.
The
vesse
l
was anchored at
the
boring
location by
a 4-point mooring system.
Soil
conditions at
the
site were
exp
lored
by
drilling
a group
of four soil borings
to 131-ft
penetration below the
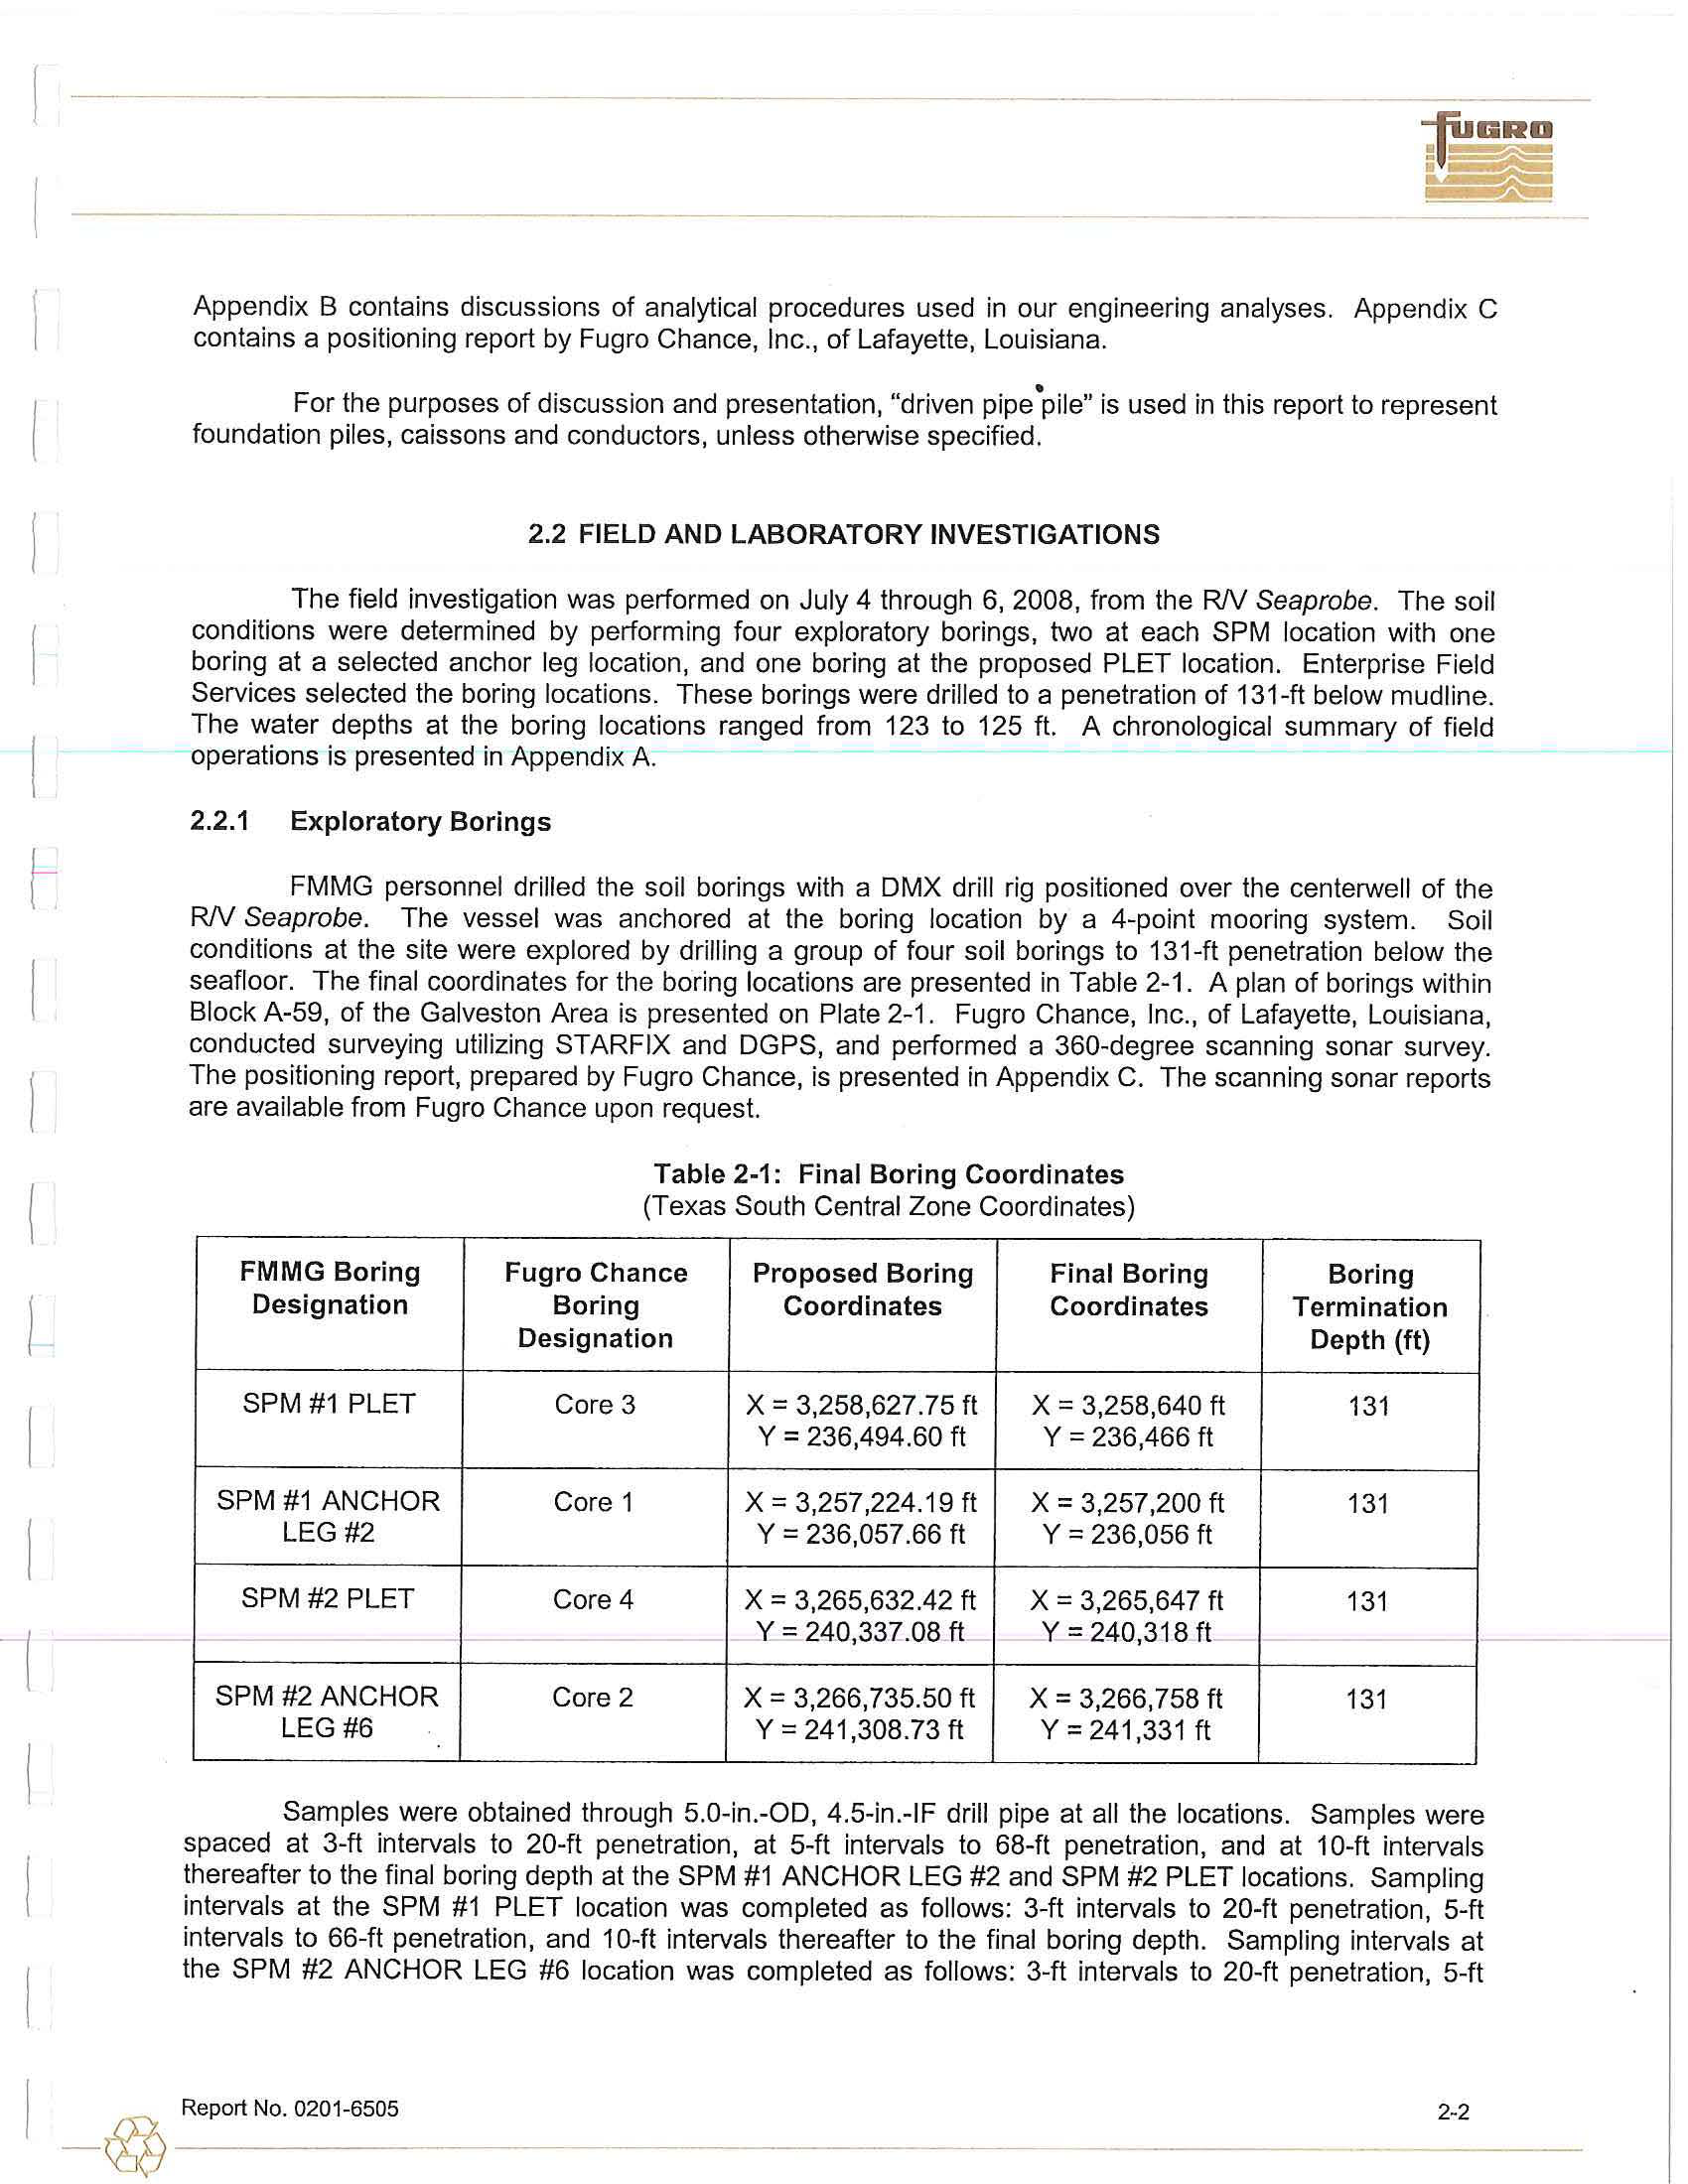
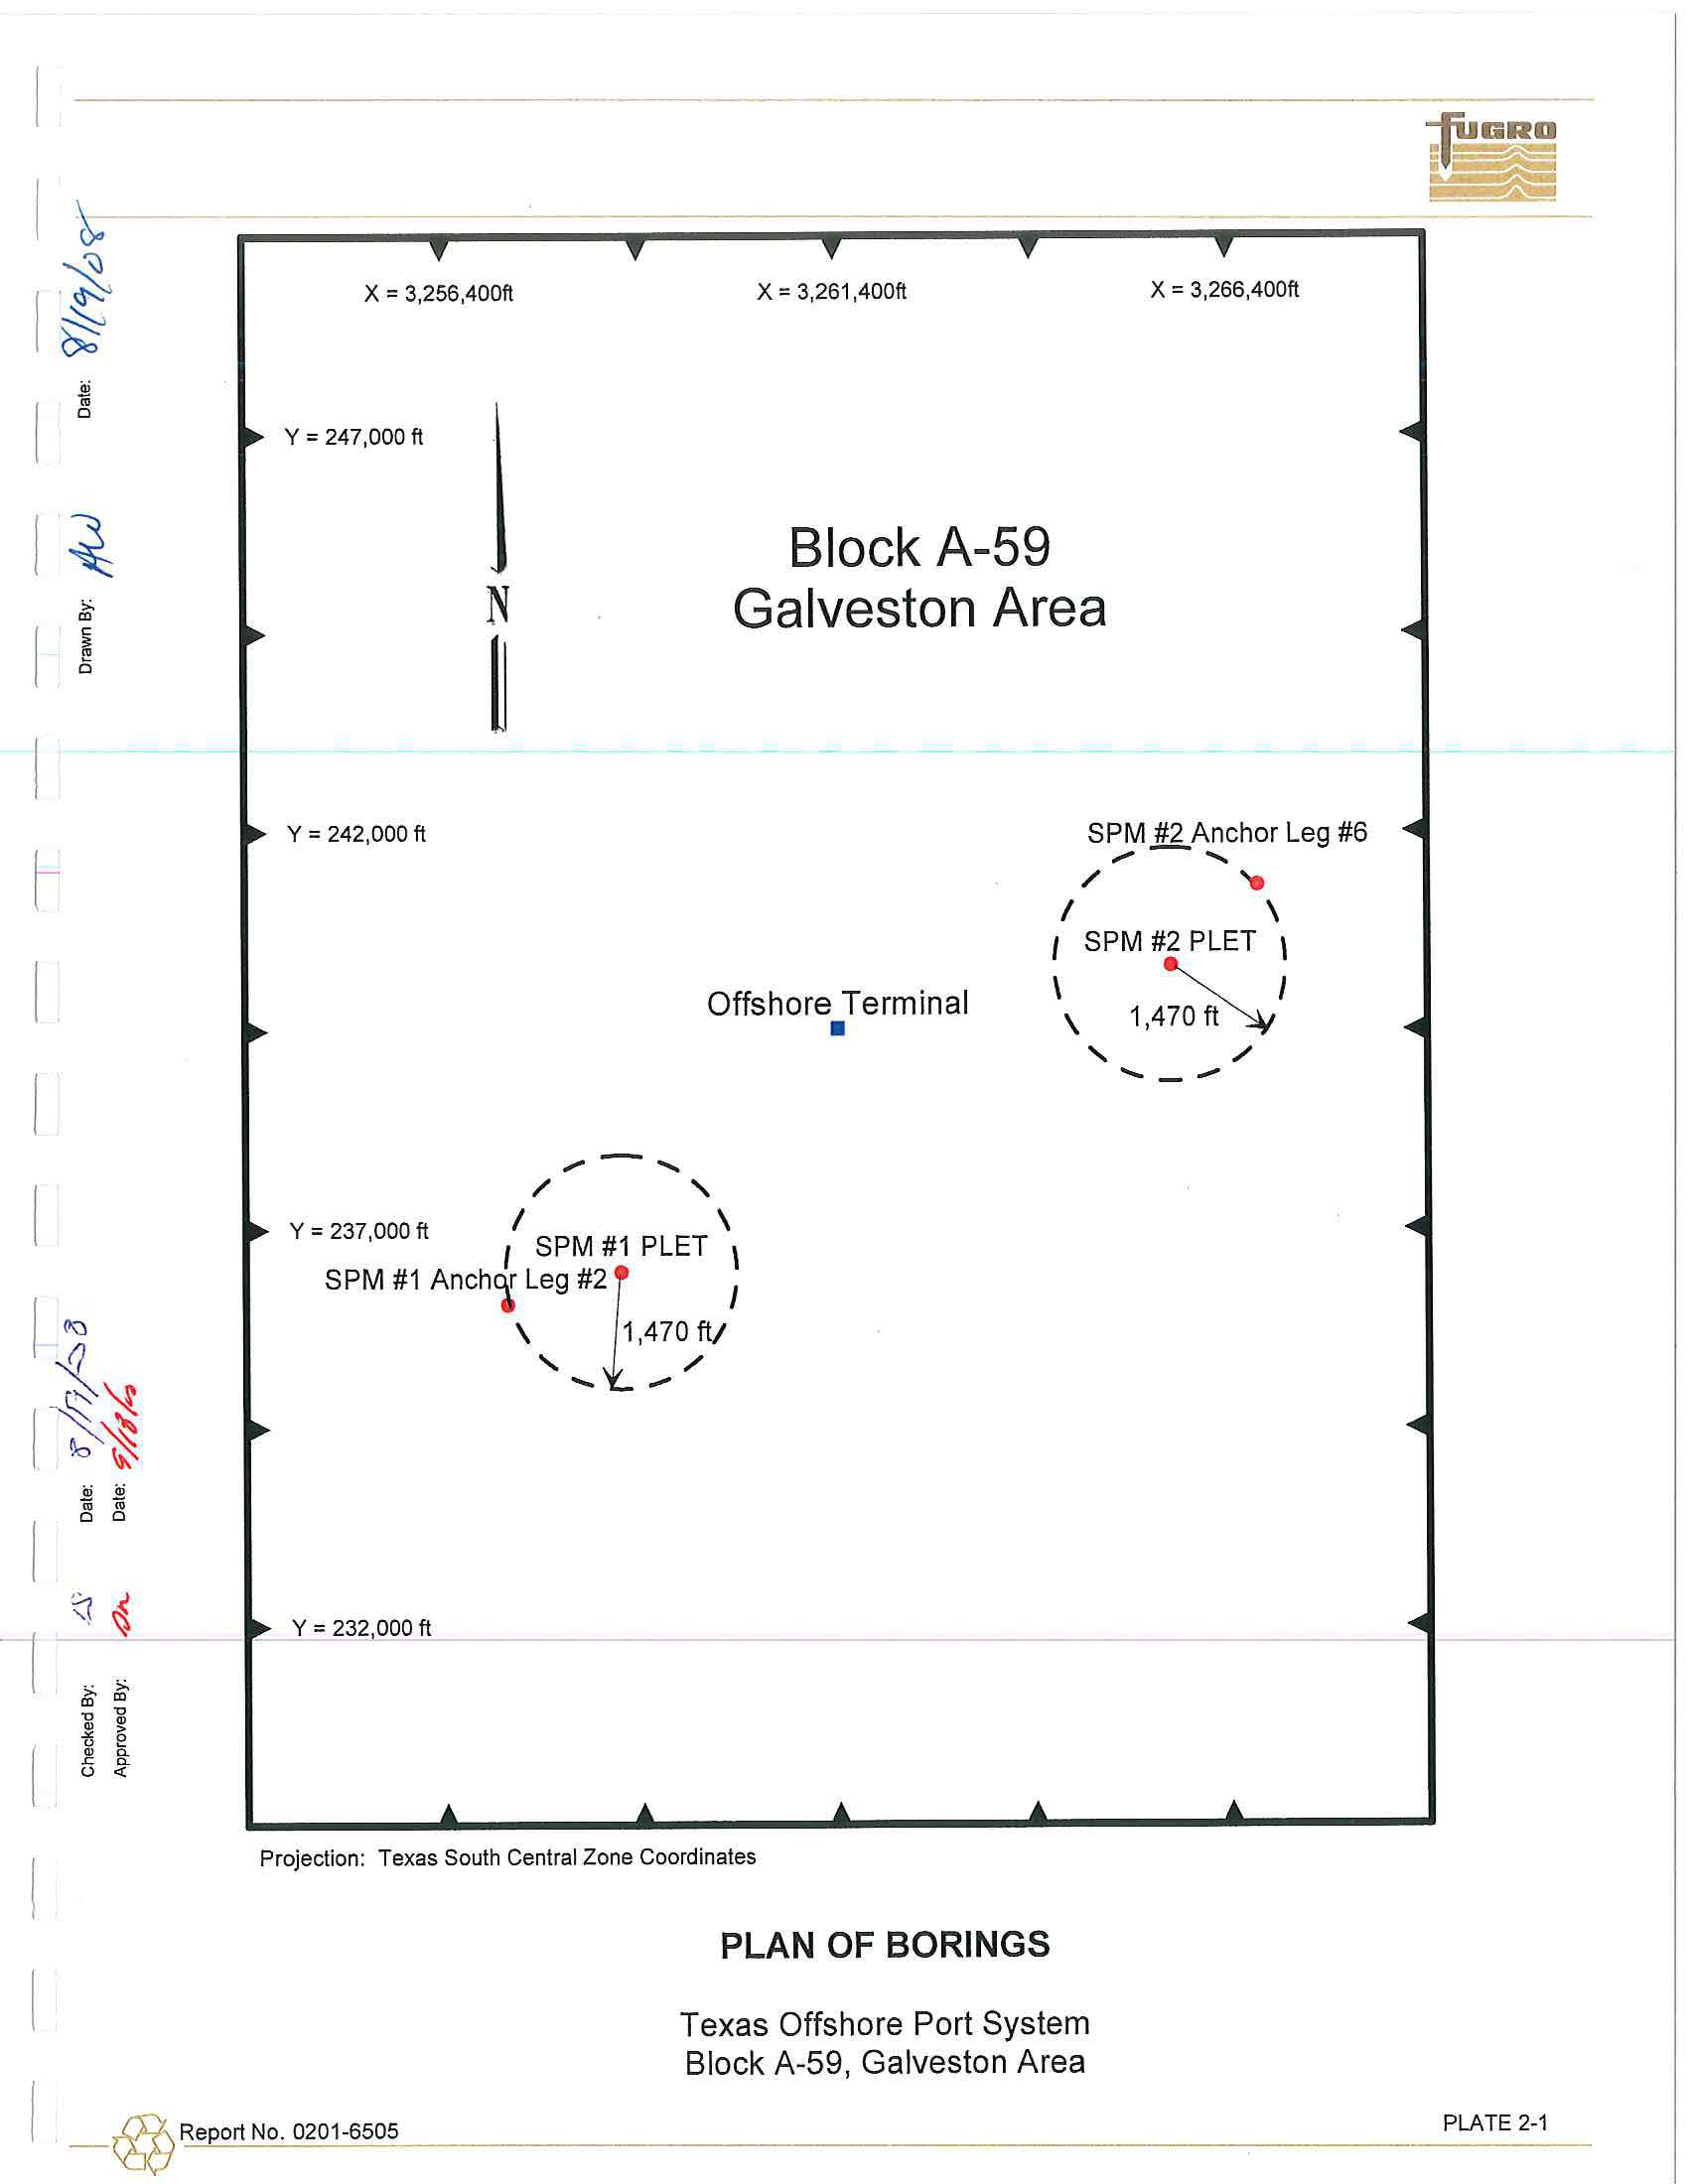
seafloor. The
final
coordinates for the boring
locations
are presented
in
Table 2-1. A plan of borings within
Block A-59,
of
the
Galveston Area is presented on
Plate
2-1.
Fugro
Chance,
Inc.,
of
Lafayette, Louisiana
,
conducted surveying utilizing STARFIX and
DGPS,
and
performed
a 360-degree scanning sonar survey.
The
positioning report, prepared by
Fugro
Chance,
is
presented
in Appendix C.
The
scanning sonar
reports
are available from
Fugro
Chance
upon
request.
FMMG
Boring
Designation
SPM
#1 PLET
SPM #1 ANCHOR
LEG#2
SPM
#2 PLET
SPM #2
ANCHOR
LEG
#6
Table 2-1:
Final
Boring Coordinates
(Texas South Central Zone Coordinates)
Fugro
Chance
Proposed
Boring
Final Boring
Boring
Coordinates
Coordinates
Designation
Core 3
X
=
3,258,627
.
75
ft
X = 3,258,640
ft
Y =
236,494.60 ft
Y = 236,466
ft
Core
1
X = 3,257,224.19 ft
X = 3,257,200
ft
Y = 236,057.66
ft
Y
=
236,056 ft
Core4
X
=
3,265,632.42
ft
X
=
3,265,647
ft
Y
=
240,337.08 ft
Y = 240,318
ft
Core
2
X = 3,266,735.50
ft
X
=
3,266,
758 ft
Y
=
241,308.73
ft
Y
=
241,331
ft
Boring
Termination
Depth (ft)
131
131
131
131
Samples were
obtained through 5.0-in.-OD, 4.5-in.-lF drill pipe at all
the locations. Samples
were
spaced at 3-ft
intervals
to 20-ft
penetration,
at 5-ft
intervals
to
68-ft
penetration,
and at 10-ft intervals
thereafter to the final boring
depth at the
SPM
#1
ANCHOR LEG #2
and SPM #2
PLET locations
.
Sampling
intervals
at
the
SPM
#1 PLET location
was completed as follows: 3-ft
intervals to
20-ft penetration, 5-ft
intervals to
66-ft
penetration,
and 10-ft
intervals thereafter to the final
boring
depth
.
Sampling intervals
at
the SPM #2 ANCHOR
LEG
#6
l
ocation
was
completed as
follows
:
3-ft intervals
to
20-ft
penetration,
5-ft
I
-
@
-
R
-
e
-
po
_
rt
_
N
_
o
_
. 02
_ _
0
_
1-
-
6
-
50
-
5
2-2
------
intervals to 65-ft penetration, and 10-ft intervals thereafter
to
the final boring depth.
The drilling and
sampling techniques used to complete this boring are
exp
lain
ed
in
detail in Appendix
A.
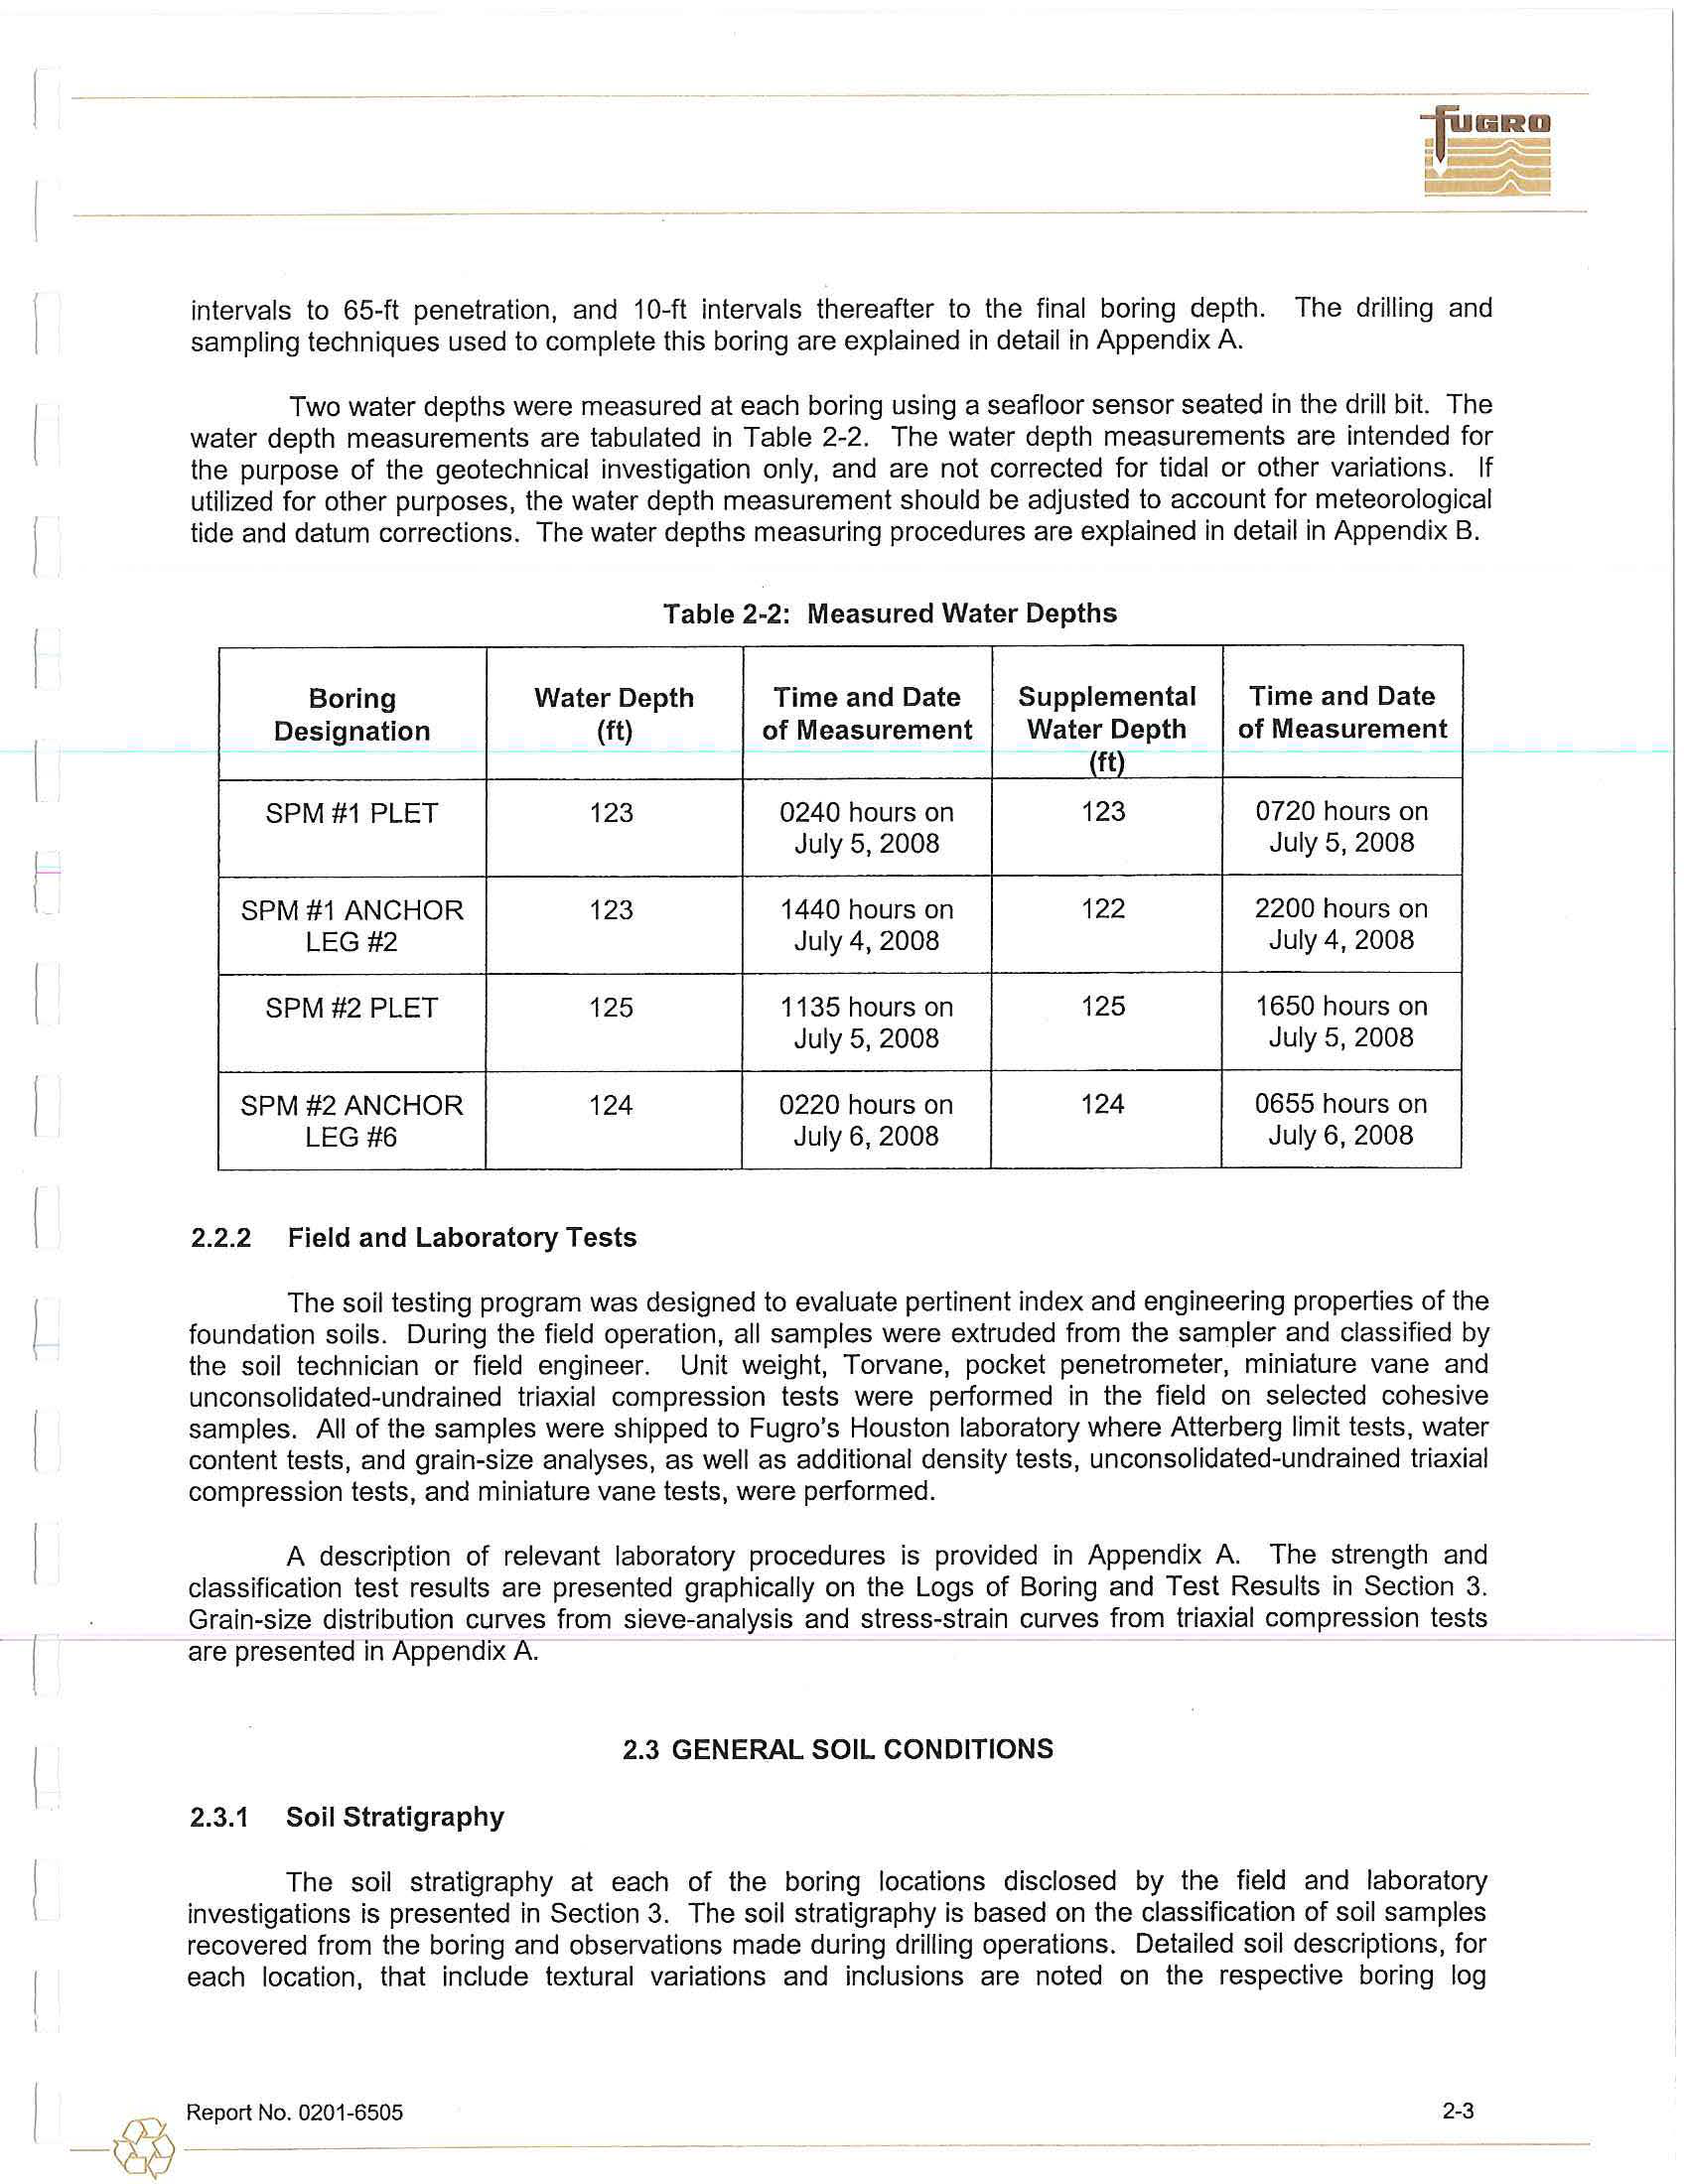
Two
wa
ter
depths were measured at each boring using a seafloor sensor seated in the drill
bit.
The
water depth measurements are
tabul
ated
in Table 2-2. The water depth measurements are intended for
the purpose of the geotechnical
in
vestigation
only, and are not corrected for tidal or other
va
riati
ons
. If
utilized for other purposes, the
water depth
measurement
should
be adjusted
to
account for meteorological
tide and datum corrections. The
water
depths measuring procedures are explained
in detail in Appendix B.
Table 2
-
2: Measured Water Depths
Boring
Water Depth
Time and Date
Supplemental
Time and Date
Designation
(ft)
of Measurement
Water Depth
of Measurement
(ft)
SPM #1 PLET
123
0240 hours
on
123
0720 hours on
July
5,
2008
July
5, 2008
SPM
#1 ANCHOR
123
1440 hours
on
122
2200
hours on
LEG #2
July
4, 2008
July 4, 2008
SPM
#2 PLET
125
1135 hours
on
125
1650 hours on
July
5,
2008
July
5, 2008
SPM #2 ANCHOR
124
0220 hours
on
124
0655 hours on
LEG
#6
July 6, 2008
July
6, 2008
2.2.2
Field and Laboratory Tests
The soil testing program was designed to evaluate pertinent index and engineering properties
of
the
foundation soils
.
During the field operation,
all samples were extruded from the sampler and classified
by
th
e soil
technician or field
eng
ineer
.
Unit weight, Torvane, pocket penetrometer, miniature vane and
unconsolidated-undrained triaxial compression tests
were
performed
in the field on selected cohesive
samples. All
of the samples were
shipped
to Fugro's Houston laboratory where Atterberg limit tests, water
content tests, and grain-size analyses, as well
as
additional density tests, unconsolidated-undrained triaxial
comp
ression
tests, and miniature
vane
tests, were performed.
A description of relevant
lab
ora
tory
procedures
i
s
provided in Appendix A.
The strength
and
classification test results are presented graphically
on the Logs of Boring and Test Results in Section
3.
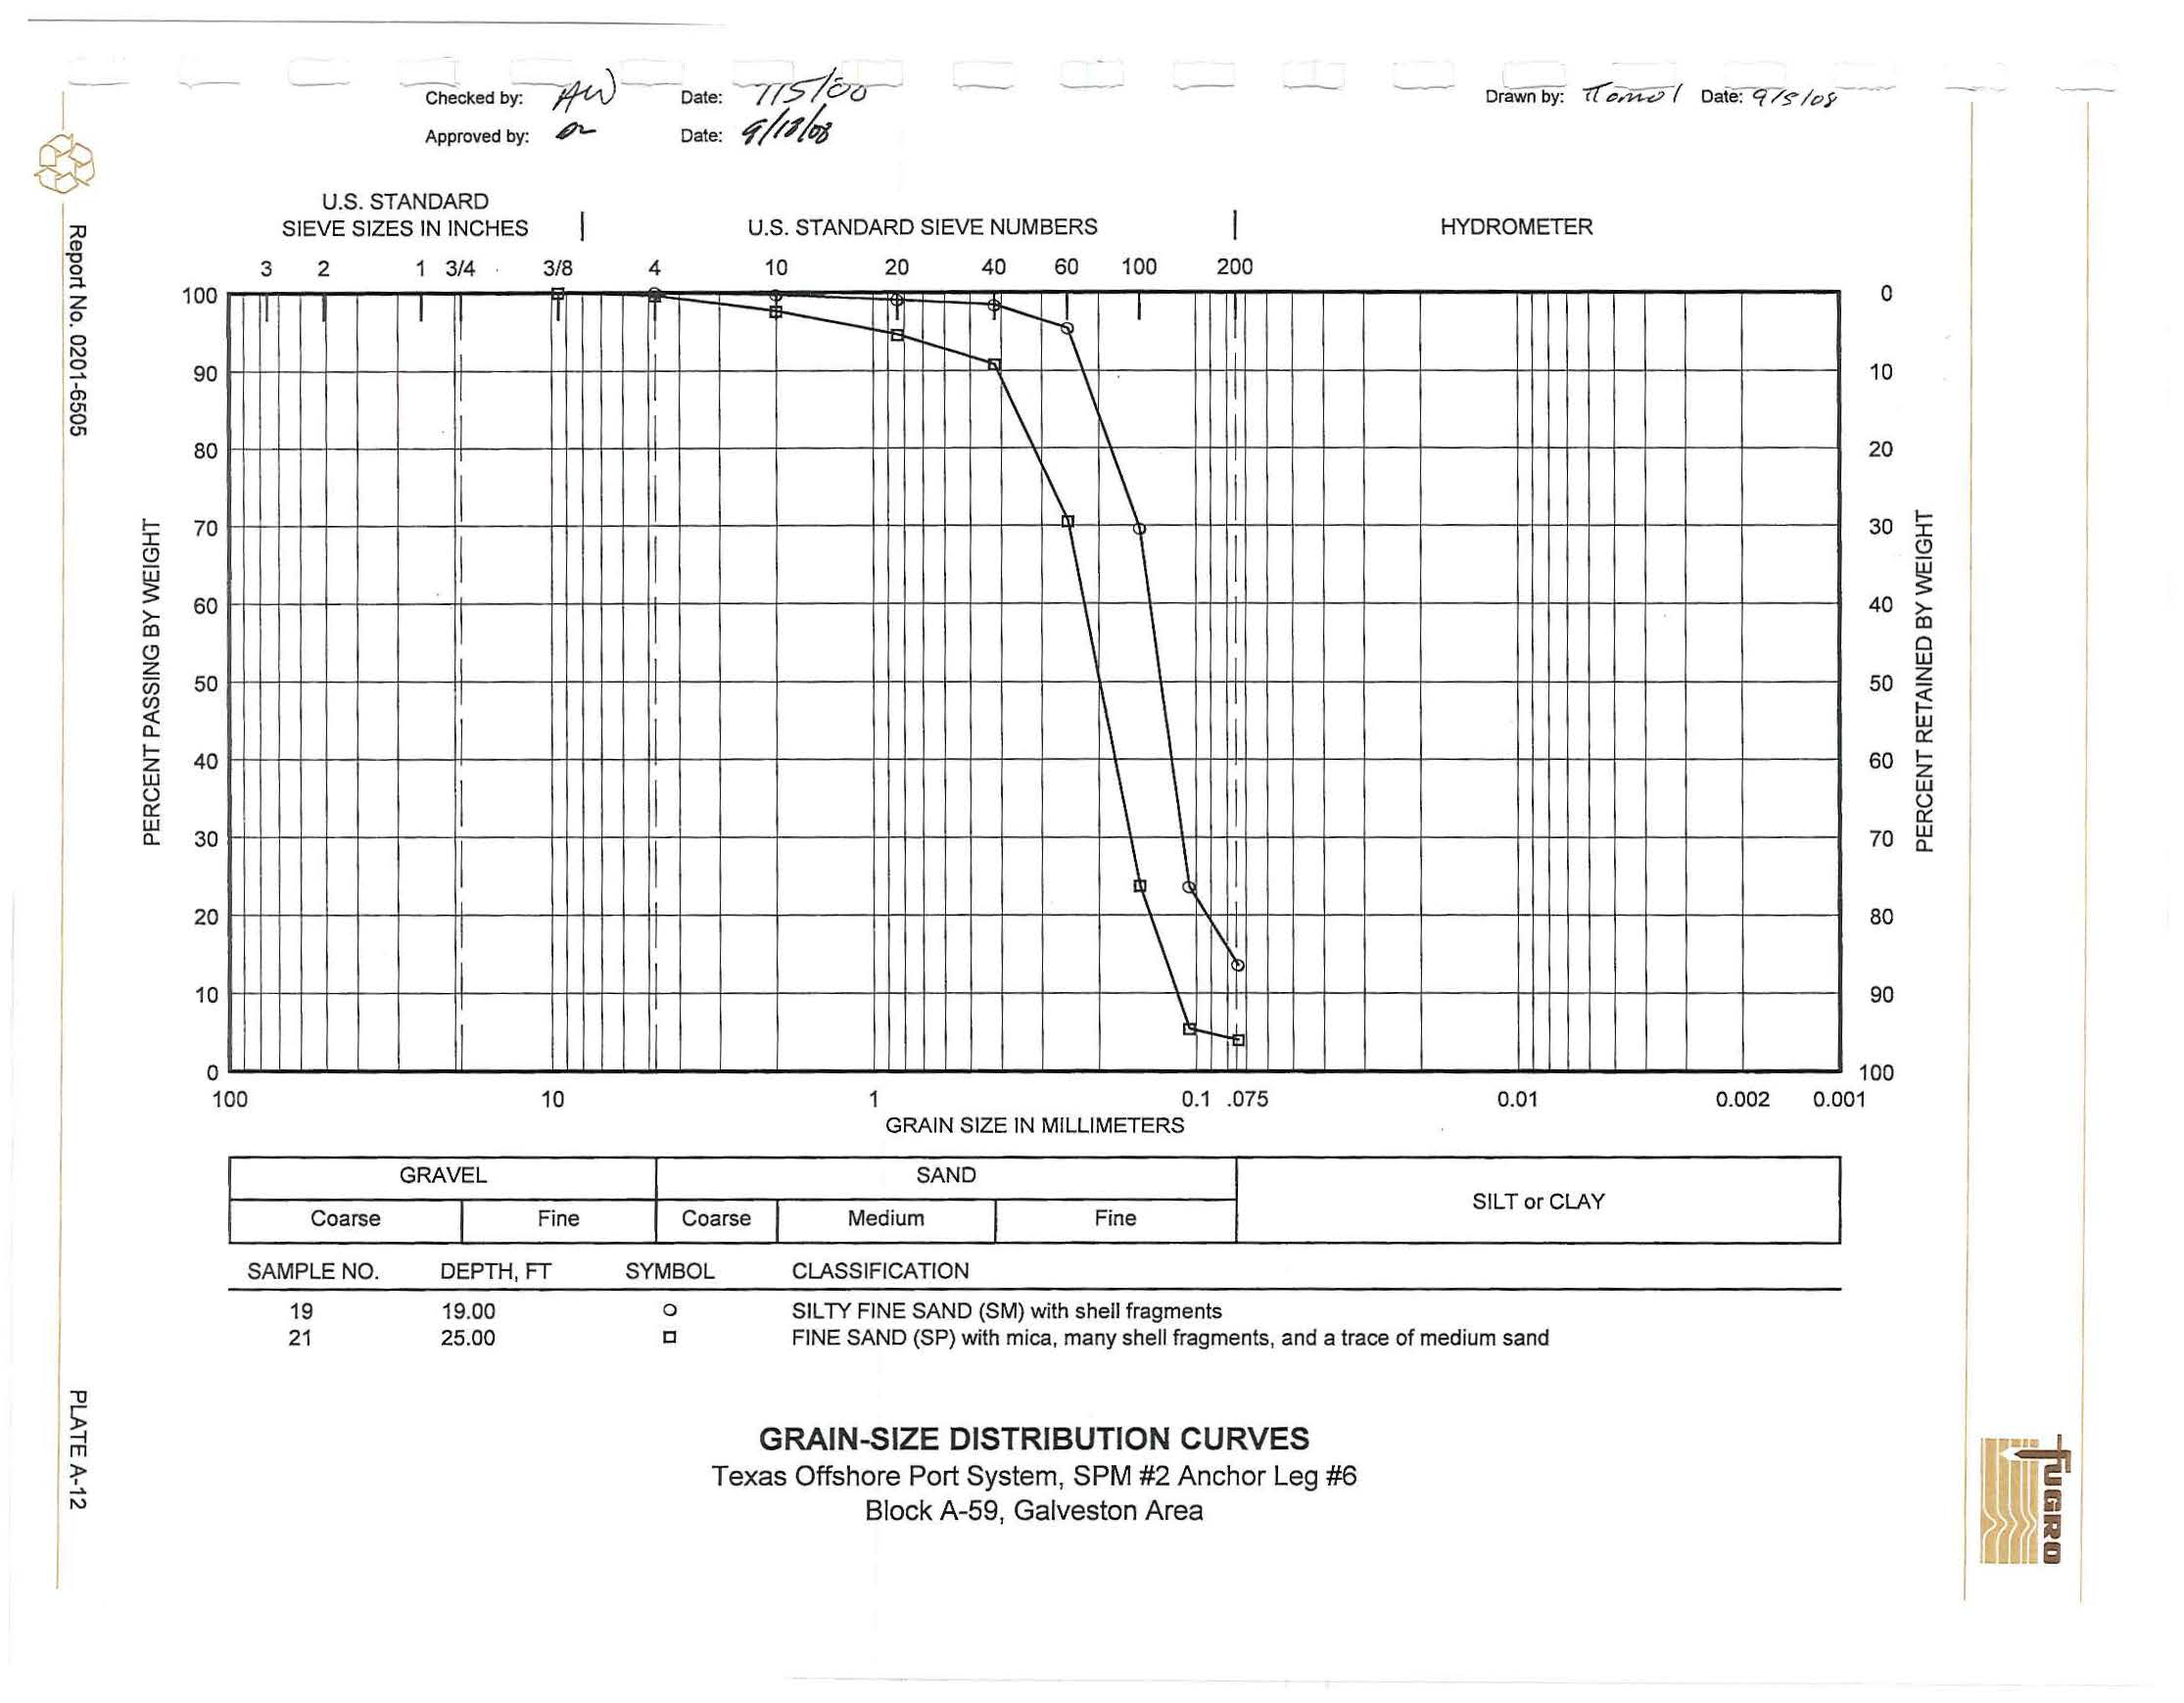
Grain-size distribution curves from sieve-analysis and stress-strain curves from triaxial compression tests
are presented
in Appendix
A.
2.3
GENERAL SOIL CONDITIONS
2.3.1
Soil Stratigraphy
The soil
strat
i
graphy
at each of the boring locations
disclosed
by the field and
laborat
ory
investigations
is
presented
in Section 3. The soil stratigraphy is based on the classification of soil
samples
recovered from
the
boring and observations
m
ade
during drilling operations. Detailed soil descriptions, for
each location, that include
t
extural
variations and inclusions are noted
on the respective
boring
log
I
-
@
Report No. 0201-6505
2-3
.s
....
~
Cl Cl
~
~
'O
'O
Q)
Q)
~
e
Q)
a.
,; a.
'-' <t
X
=
3,2
56,40
0
ft
X
=
3,261,400ft
X
=
3,266,400ft
Y
=
247,000 ft
N
Block
A
-5
9
Back to top
Galveston
Area
~
Y
=
242,000 ft
.,,.,.
........
Offshore Terminal
•
/
'
y
=
237,000
ft
I
SPM
#1
PLET \
I
\
SPM
#1
Anch
1
Leg
#2
1
I
\
1,470 ft/
'
/
.....
-
Y
=
232,000 ft
Projection:
Texas
South Central
Zone
Coordinates
PLAN OF
BORINGS
SPM~Anchor Leg #6
.,,.,.
........
/
I
\
I
SPM
#2
PLET \
\
~
I
\
1,470ft~
'
/
.....
__
Texas Offshore Port System
Block
A-59,
Galveston Area
i,i
1ii
0
-
v
\
II
\"::'
TERMS AND
SYMBOLS
USED ON
BORING
LOG
SOIL TYPES
SAMPLER TYPES
[!Sand
mSilt
~Clay
~Gravel
~Debr
i
s
~Liae,
0
..
~Th;,.
~'" su,
0
...
Walled
Test
Tube
!ill
Silty
msandy
I
Sandy
~Peat or
VI,
Coral
Sand
Silt
C
l
ay
High
l
y
"
Organic
9
v
9
v
~Clayey
mClayey
mSilty
~p;,100
I
Rock
iShell
~Rock
~No
Sand
Silt
Clay
v
Core
Recovery
v
v
SOIL GRAIN SIZE
U.S
.
STANDARD SIEVE
6"
3"
3/4"
4
10
40
200
B
OULDERS
COBBLES
GRAVEL
SAND
SILT
CLAY
COARSE
FINE
COARSE
MEDIUM
FINE
152
76.2
19
.
1
4.76
2.00
0.420
0.074
0.002
SOIL GRAIN SIZE IN
MILLIMETERS
DENSITY OF GRANULAR SOILS(
2,3
l
STRENGTH OF COHESIVE SOILS(
1
l
Undrained
Shear Strength,
Consistency
Kips Per Sg
Ft
Descriptive
*Relative
T
erm
Density,%
Very
Soft....
..............................................
less than
0.25
Very
L
oose..
...............................................
less than
15
Soft...
.........................................................
0.25
to
0.50
Loose...
...........................................................
15
to 35
Firm.
..........................................................
0.50
to
1.00
Medium Dense.
................................................
35
to
65
Stiff........
....................................................
1.00
to
2.00
Dense..
...........................................................
65
to
85
Very Stiff...
.................................................
2.00
to
4
.0
0
Very Dense
............................................
greater than
85
*Estimated from sampler driving record
Hard.
....................................................
greater than
4.00
SOIL STRUCTURE(
1
l
Slickensided..
........................
Having planes of weakness that
appear
slick and glossy. The degree
of slickensidedness
depends
upon the
spacing
of slickensides and the ease of breaking along these planes.
Fissured.............
...................
Containing shrinkage
or relief
cracks,
often filled with fine sand
or silt,
usually more or
less
vertical.
Pocket....
..............................
Inclusion of material
of
different texture
t
hat is smaller than
the
diameter of the
sample.
Parting.
.................................
Inclusion less than 1/8 inch thick extending through the sample.
Seam.......
.............................
Inclusion 1/8 inch to
3 inches
thick extending through the sample.
L
ayer.
...................................
Inclusion
g
r
eater than
3
i
n
ches thick extending through the sample.
Laminated.........
....................
Soi
l
sample composed
of alternating partings
or
seams
of
different soil types
.
l
nterlayered......
.....................
Soil sample composed of alternating layers
of
different
soil
types
.
Intermixed....
.........................
Soil
sample
composed
of
pockets of different so
i
l types and layered or laminated
structure
is not
evident.
Calcareous
............................
REFERENCES:
(1)
ASTM D
2488
(2)
ASCE
Manual
56 (1976)
(3)
ASTM D
2049
Having appreciable quantities
of
carbonate.
I
nformation
on each boring
log
is a compi
l
ation of subsurface conditions and soil or rock
classifications obtained from the field as
well
as from
laboratory
testing of samp
l
es.
Strata
have been
i
n
te
r
preted
by
commonly accepted
procedures.
The stratum lines on the log may
be t
r
ansitiona
l
and
approximate in
nature.
Water level measurements
refer
on
l
y
to those observed
at
the times and
p
l
aces indicated in
the
text, and may
vary
with time, geologic
condition
or construction activ
i
ty.
I
-
@
Report No.
0201-6505
PLATE
2-2
+
l
!
+
~
~
+
•
•
•
C.INC. Si:
1
04
§
LI
NE
S::!103
>,.,._
§
0
,,
Report
No. 0201-6505
-
\~
--
----
"'
"'
"'
no
"'
"'
'"
no
no
no
no
no
'"
+
I
,
..
-+
"'
,
..
""
,
..
"'
-eLM
,
..
"'
"
'
""
"F
,
..
~
!!
~
!
~
§
-
-
-
'
"'
'"'
=
"'
'"'
"'
"'
'
"'
-
'"'
SPM #2
Anchor Leg #6
i
1
(J)
.
.....
'
"
"
"
...
,,.
"'
...
"'
"
'
SPM#2
PLET
...
~
l!
~
'
"
~
0
-+
--
f+
+
e
-i---
=
'"'
'"'
=
.,.,
,
..
..,
-
Offshore
Terminal
=
'"'
ll
l!
~
~
~
§
""
"
"
-
'"
""
""
..
""
..
"
"
........
SPM#1 Anchor Leg #2
@
-t
""
""'
""'
~
.........
ll
...
'"'
-
+
'
"
~
""
'"
.
--
~~
@
SPM #1 PLET
-
""
'"'
...
'
"'
""'
..,
'"'
..,
l!
ij
l
I
+
+
..
"'
........
"'
"'
...
l!
~
!
~
'"'
'"'
'"'
~.
'"'
'
"'
'
"'
'
"'
--
!!
"
'--
~
"'
"'
~
""
"'
11,
,.
'"
;
~
~;
•
•
"'
•
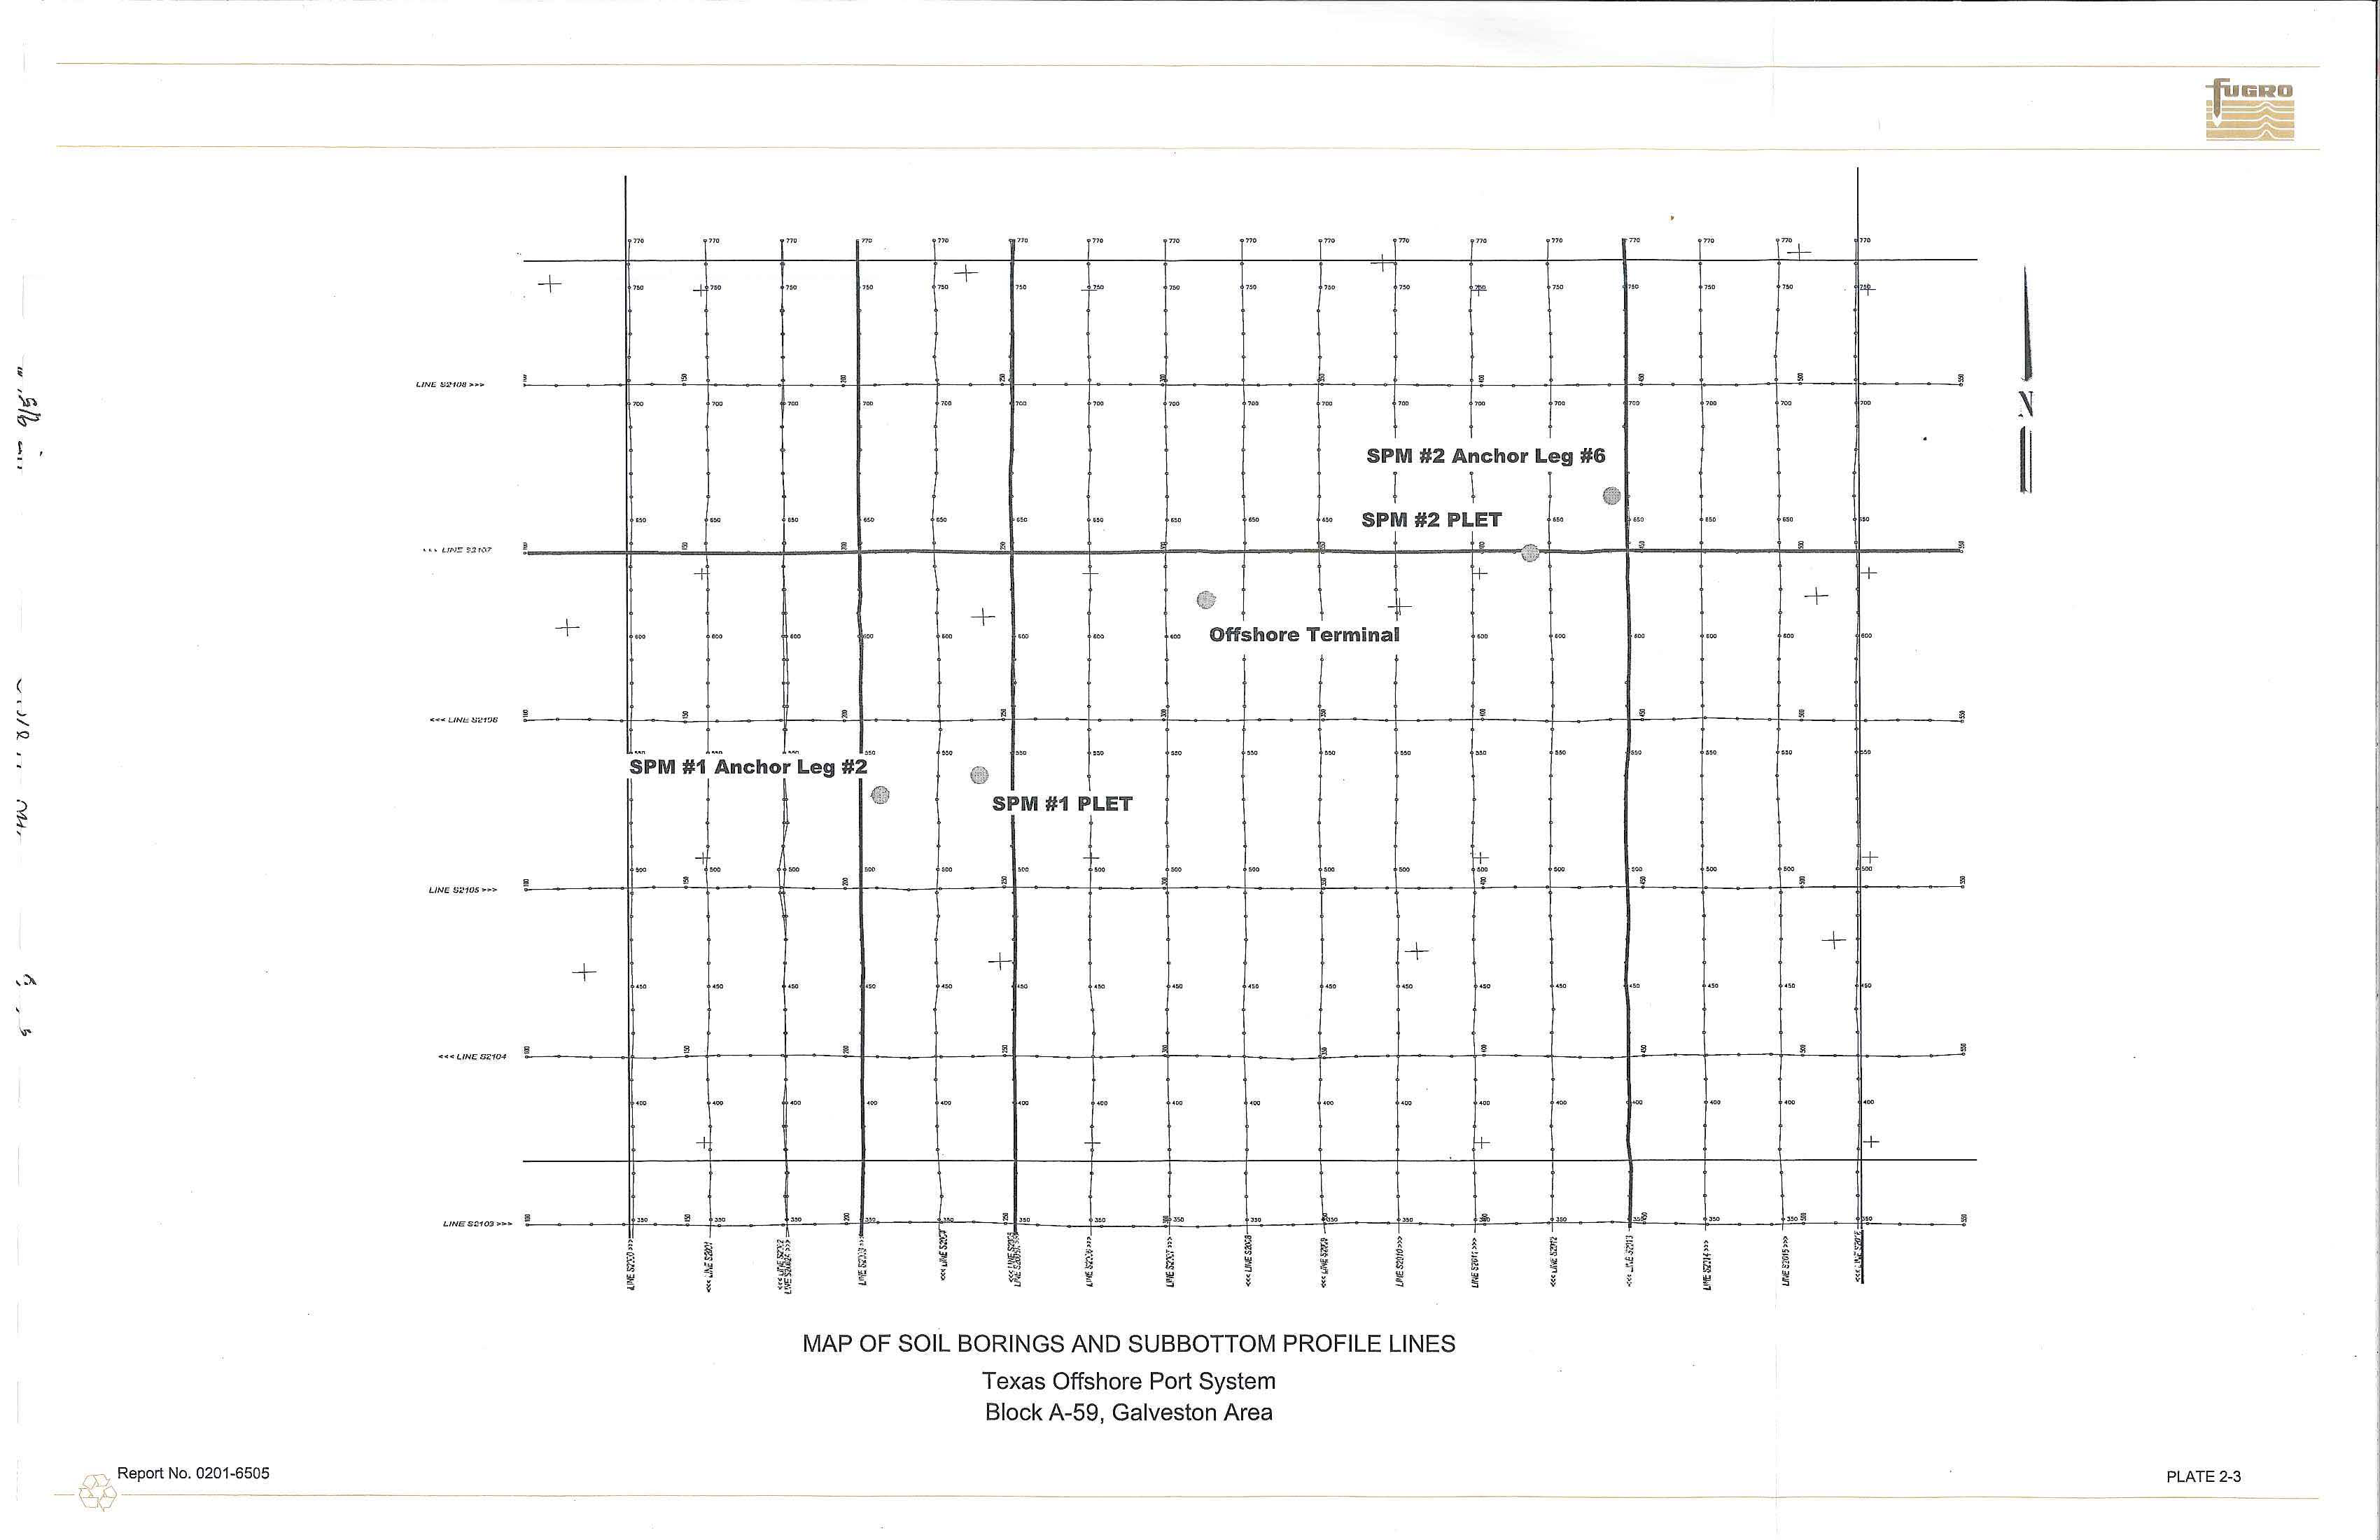
MAP OF
SOIL BORINGS
AND SUBBOTTOM
PROFILE LINES
Texas Offshore Port System
Block
A
-
59, Galveston Area
t
""'
!I
....
§
-
=
f+
A
"'
.
no
no
"'+
'"
7!
1)
'"
,
..
'+
ll
!!
~
"'
'"'
""
""
'
"
.......
~
~
~
+
+
"'
'
"'
"'
..,
ll
~
~
'
"
,
..
""
..
+
'"'
..,
..,
""'
ll
~
~
+
.........
ll
!!
~
-
-
'"'
'
"'
+
..ll
'
"
""~
..
~
•
"'
PLATE
2-3
~
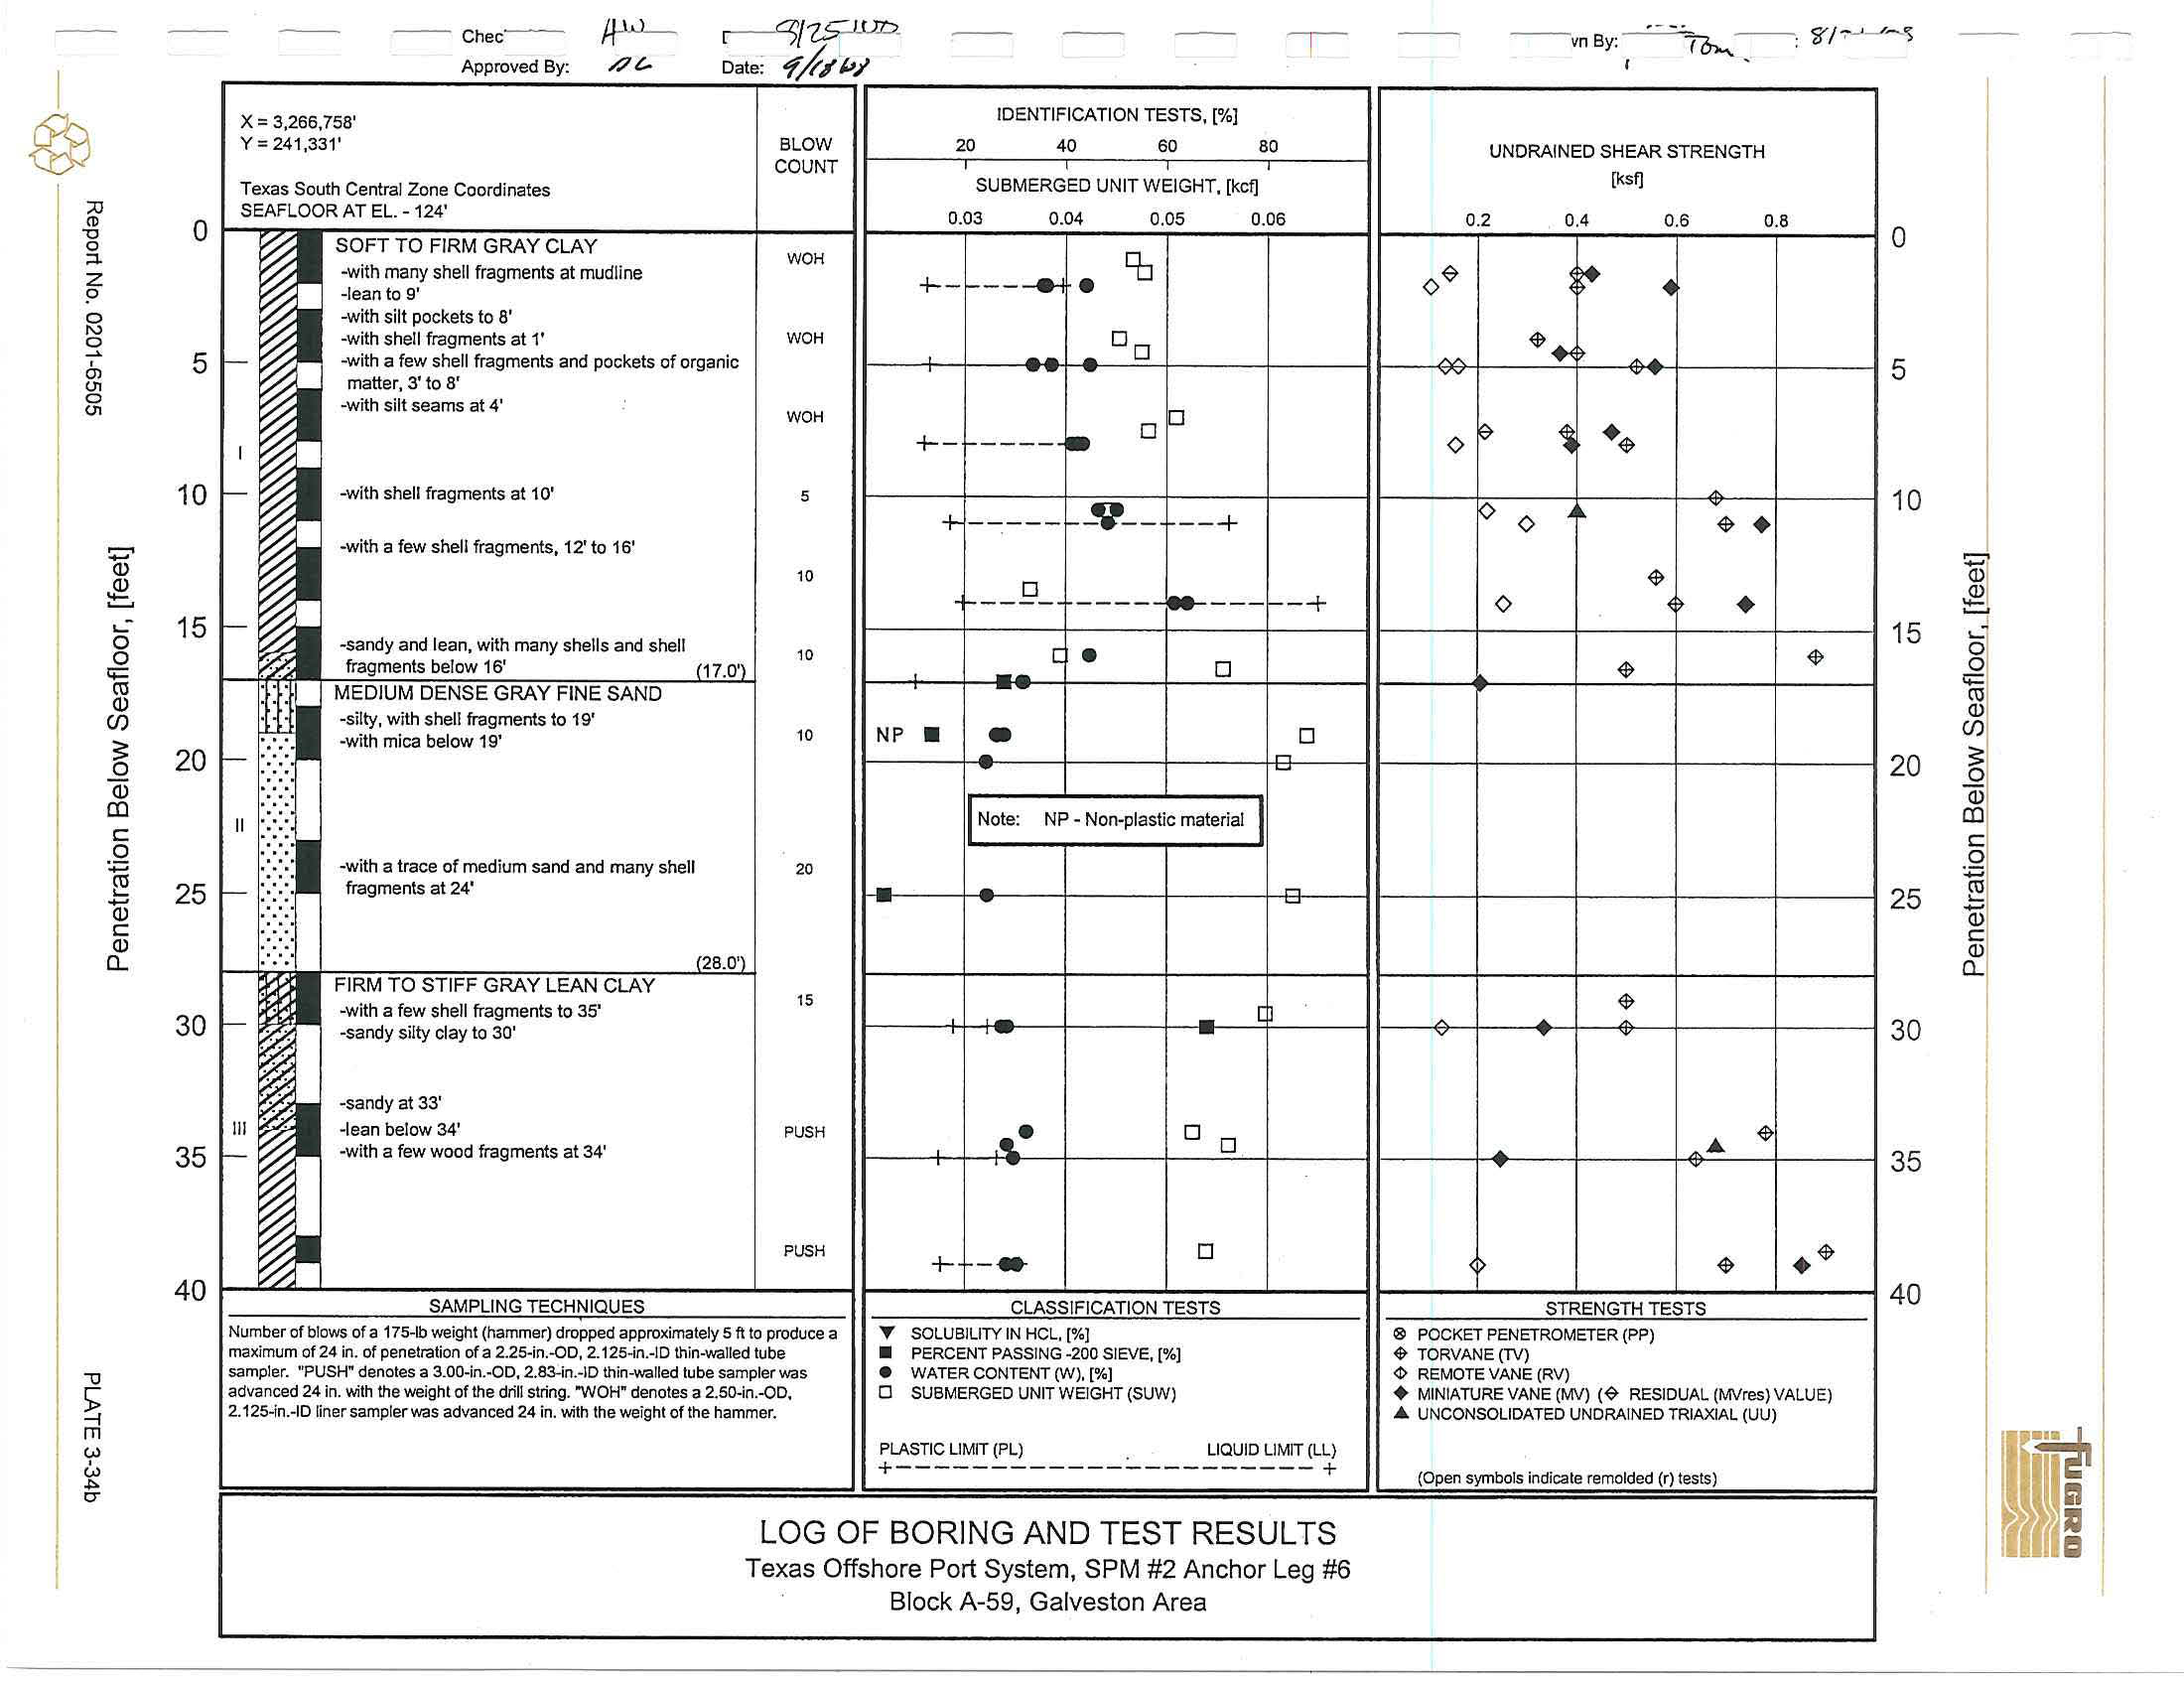
3.4 SPM #2 ANCHOR LEG #6 LOCATION
3.4.1
Introduction
The field investigation at
the location
designated as SPM #2 ANCHOR
LEG
#6
was
performed on
July 5 and
6,
2008. Soil sampling was performed to 131-ft penetration at Texas South Central Zone
Coordinates
X
::: 3,266,758
ft
and Y ::: 241,331 ft. The measured water depth was 124 ft.
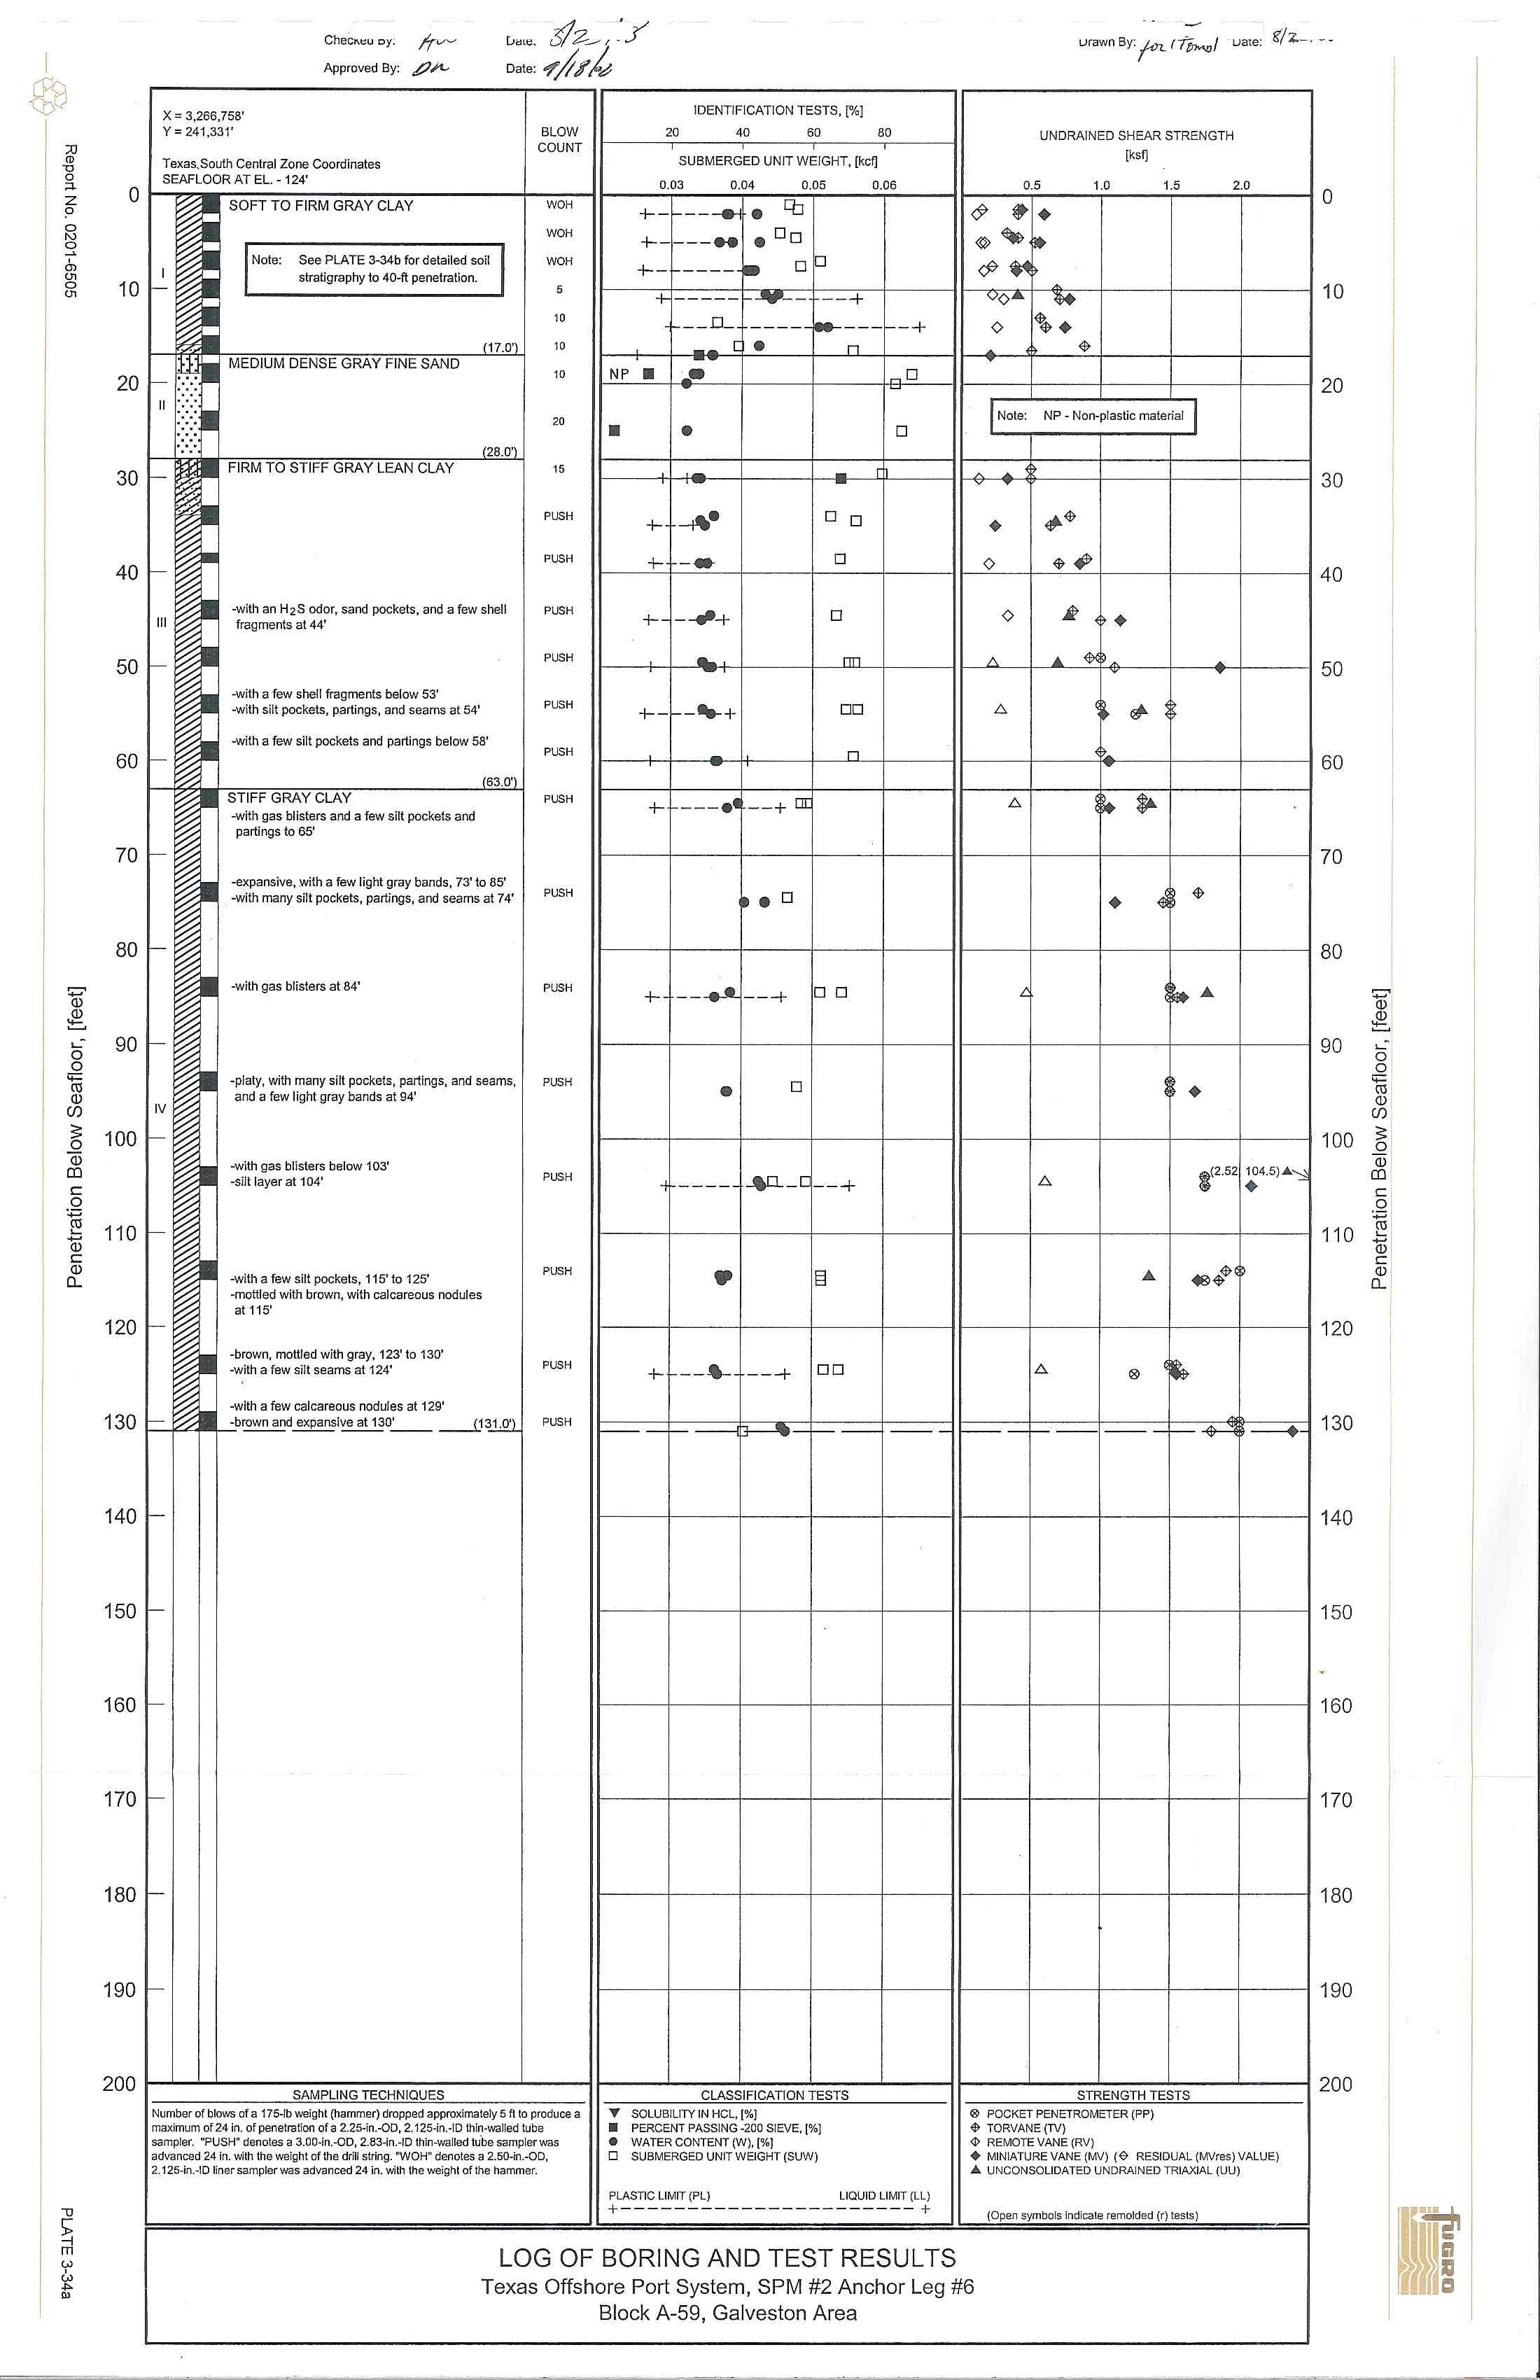
3.4.2
Soil Stratigraphy
The
soi
l
stratigraphy disclosed by
the
field and laboratory investigations is presented on the boring
log,
P
late 3-34.
The
soil
stratigraphy is based on the classification
of soil samples recovered from the
boring and observations made during drilling operations. A generalized summary
of the major soil strata is
tabulated
below
.
Penetration, ft
Stratum
From
To
Description
I
0
17
Soft to firm clay
II
17
28
Medium dense fine
sand
Ill
28
63
Firm to
stiff
l
ean
clay
IV
63
131
Stiff
clay
Detailed soil descriptions
that
in
clude
textural
variations and inclusions are
noted on the boring
log.
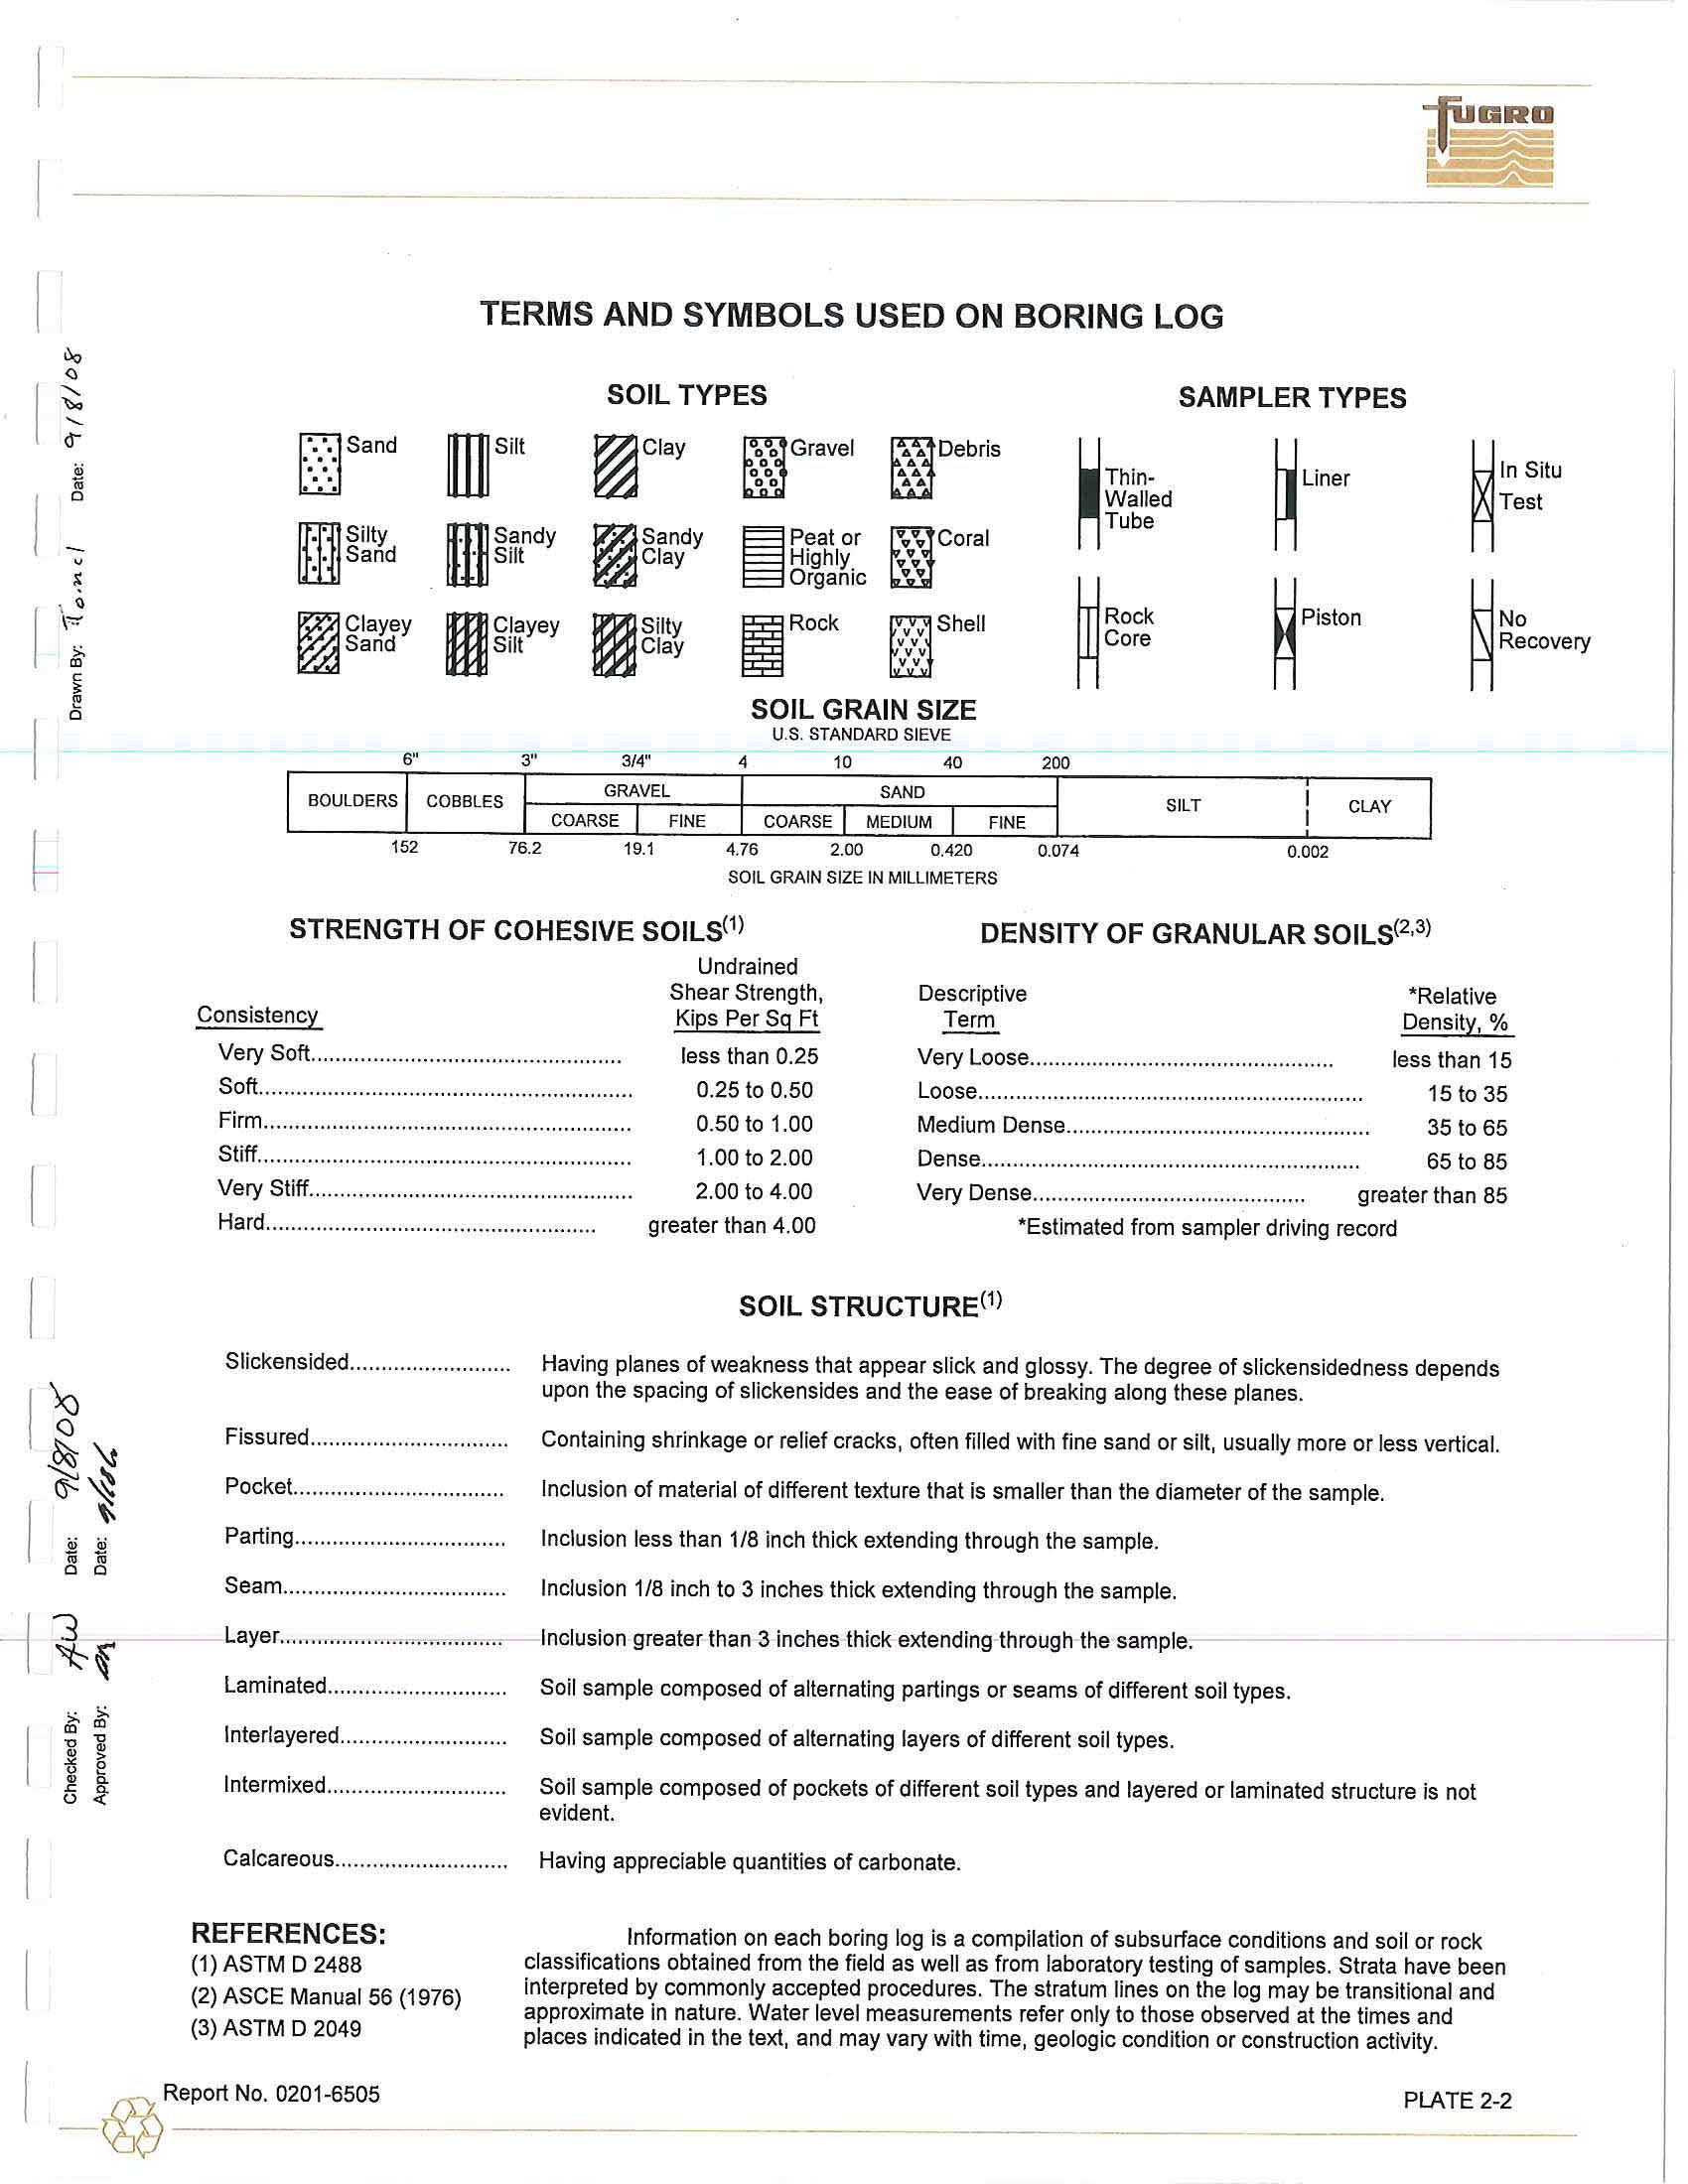
A
key
to the terms and symbols used on the boring log
i
s
presented
on
Plate 2-2. The Roman numeral
representing each stratum
is a
l
so
shown on the boring
lo
g and
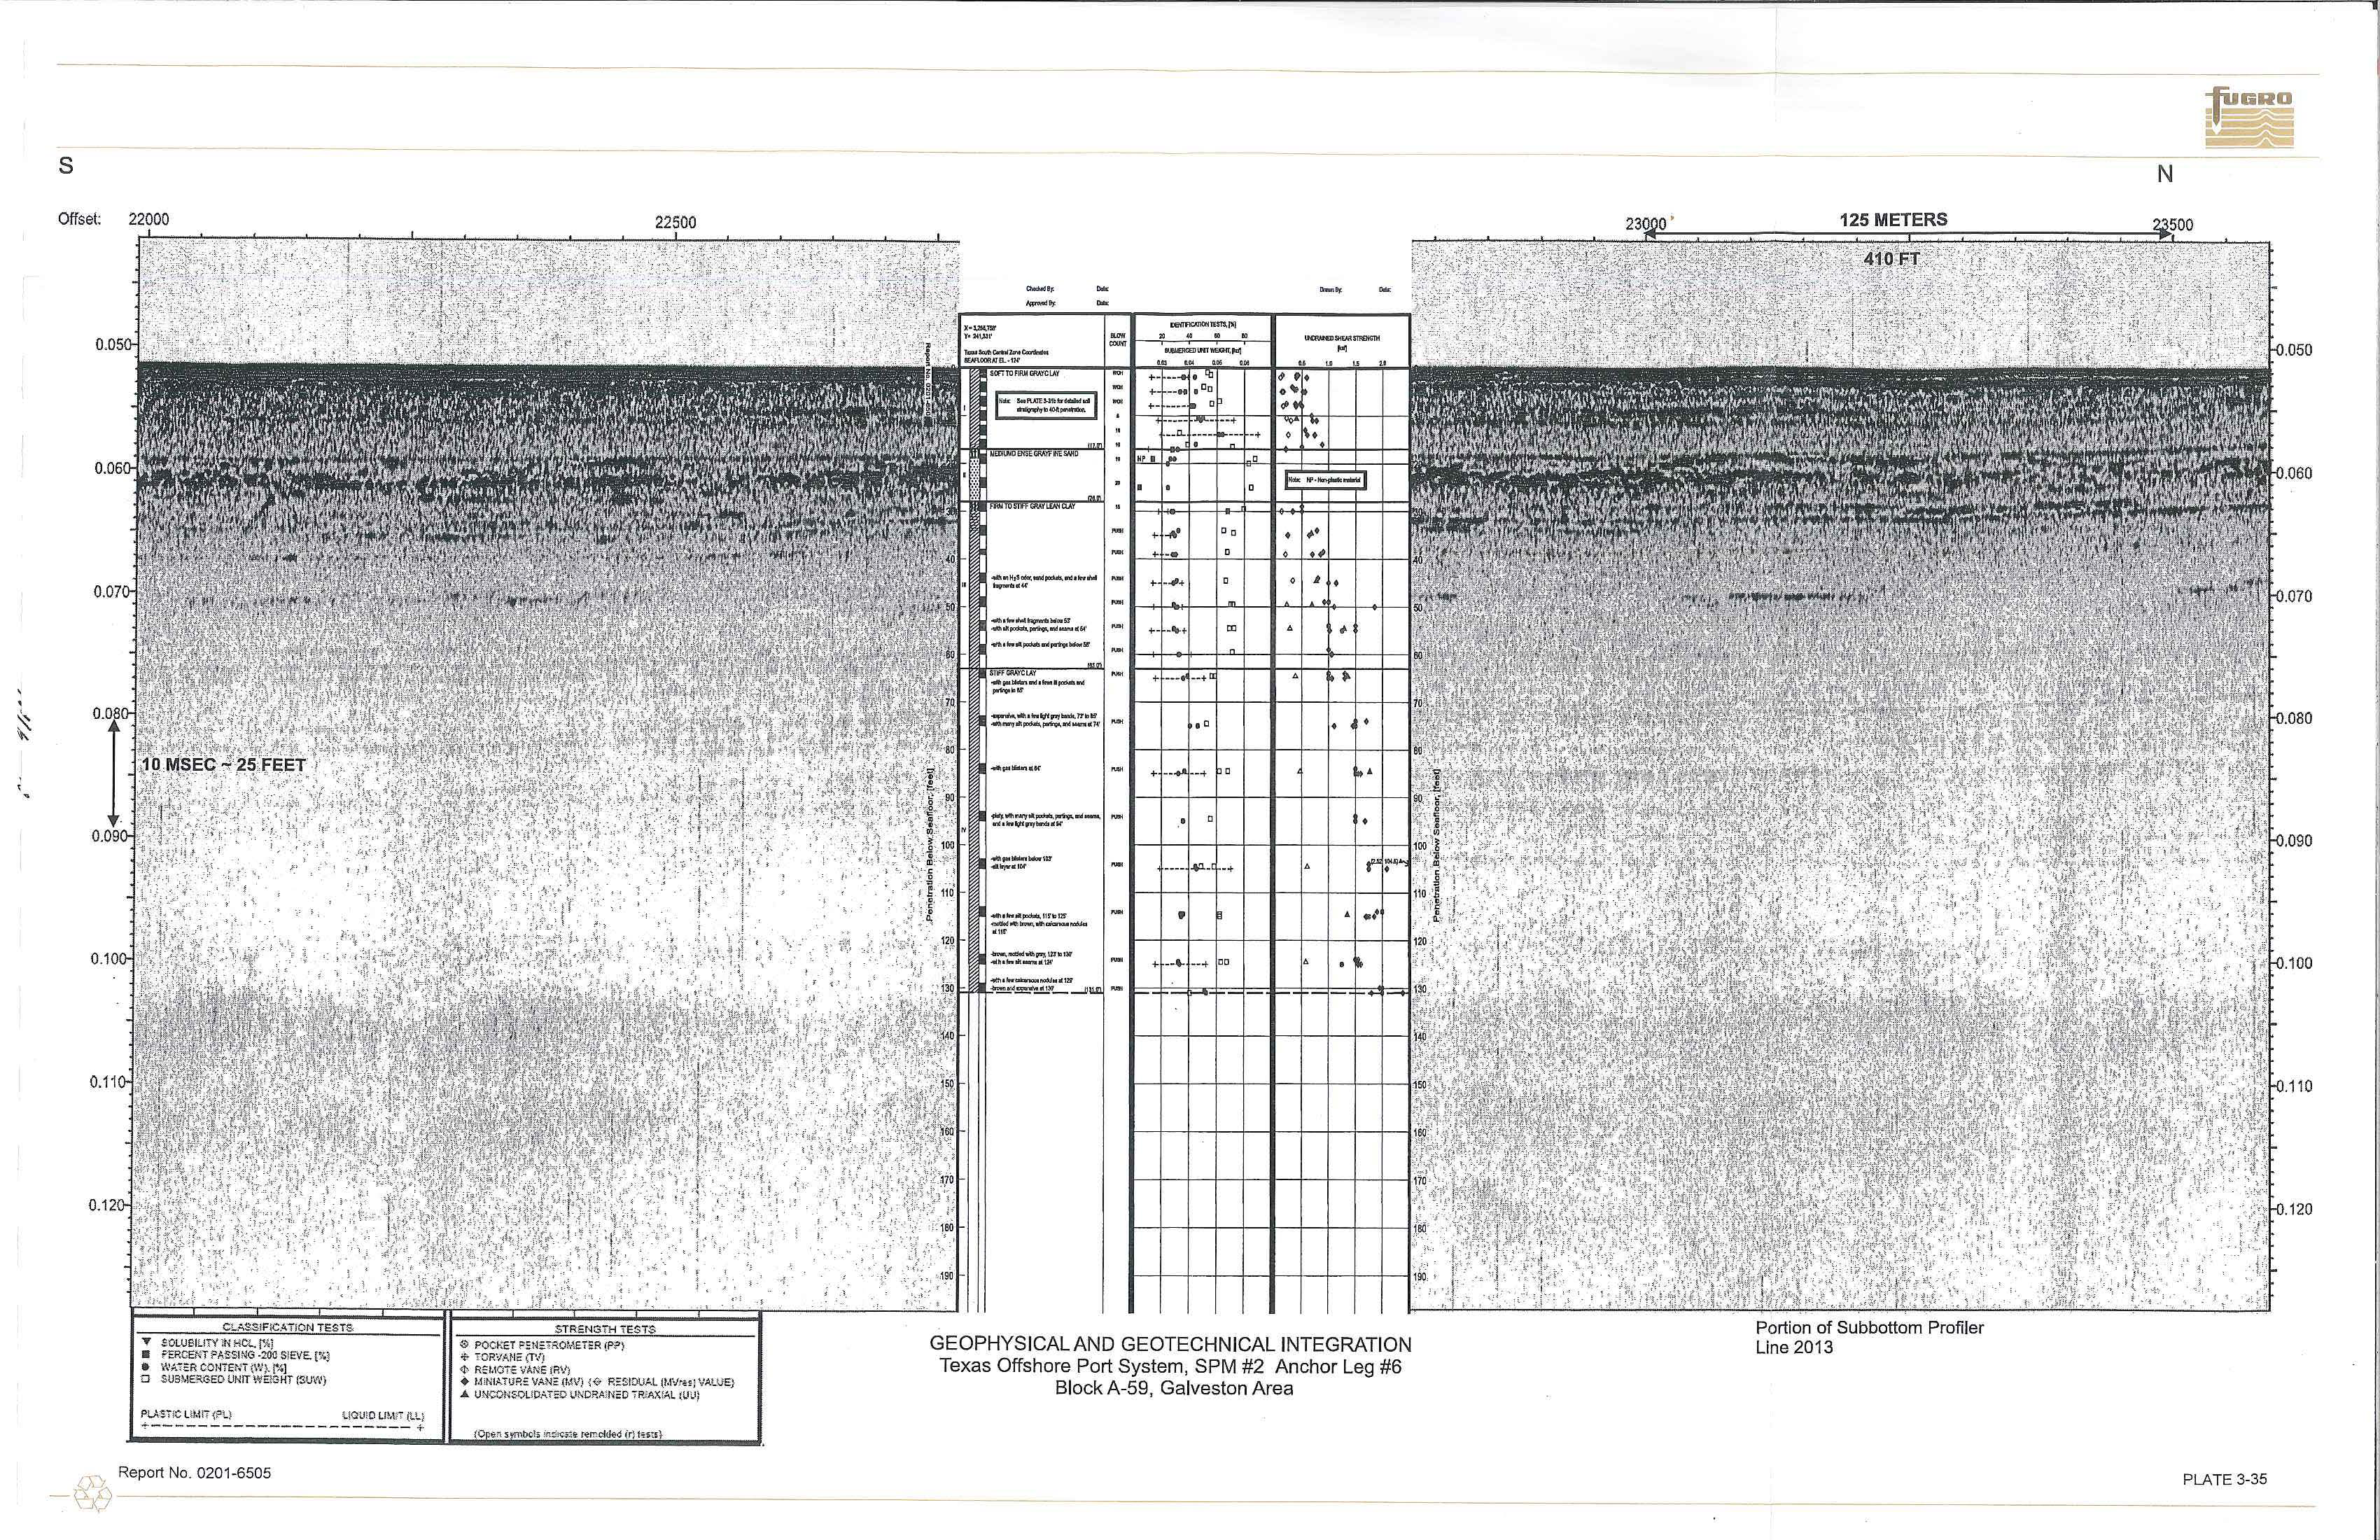
on relevant plates. The variation in soil
stratigraphy across this
site
is indicated in a
comparison (integ
ra
t
ion)
of the geophysical
and
geotechnical
so
il inform
ation presented on
Plate
3-35.
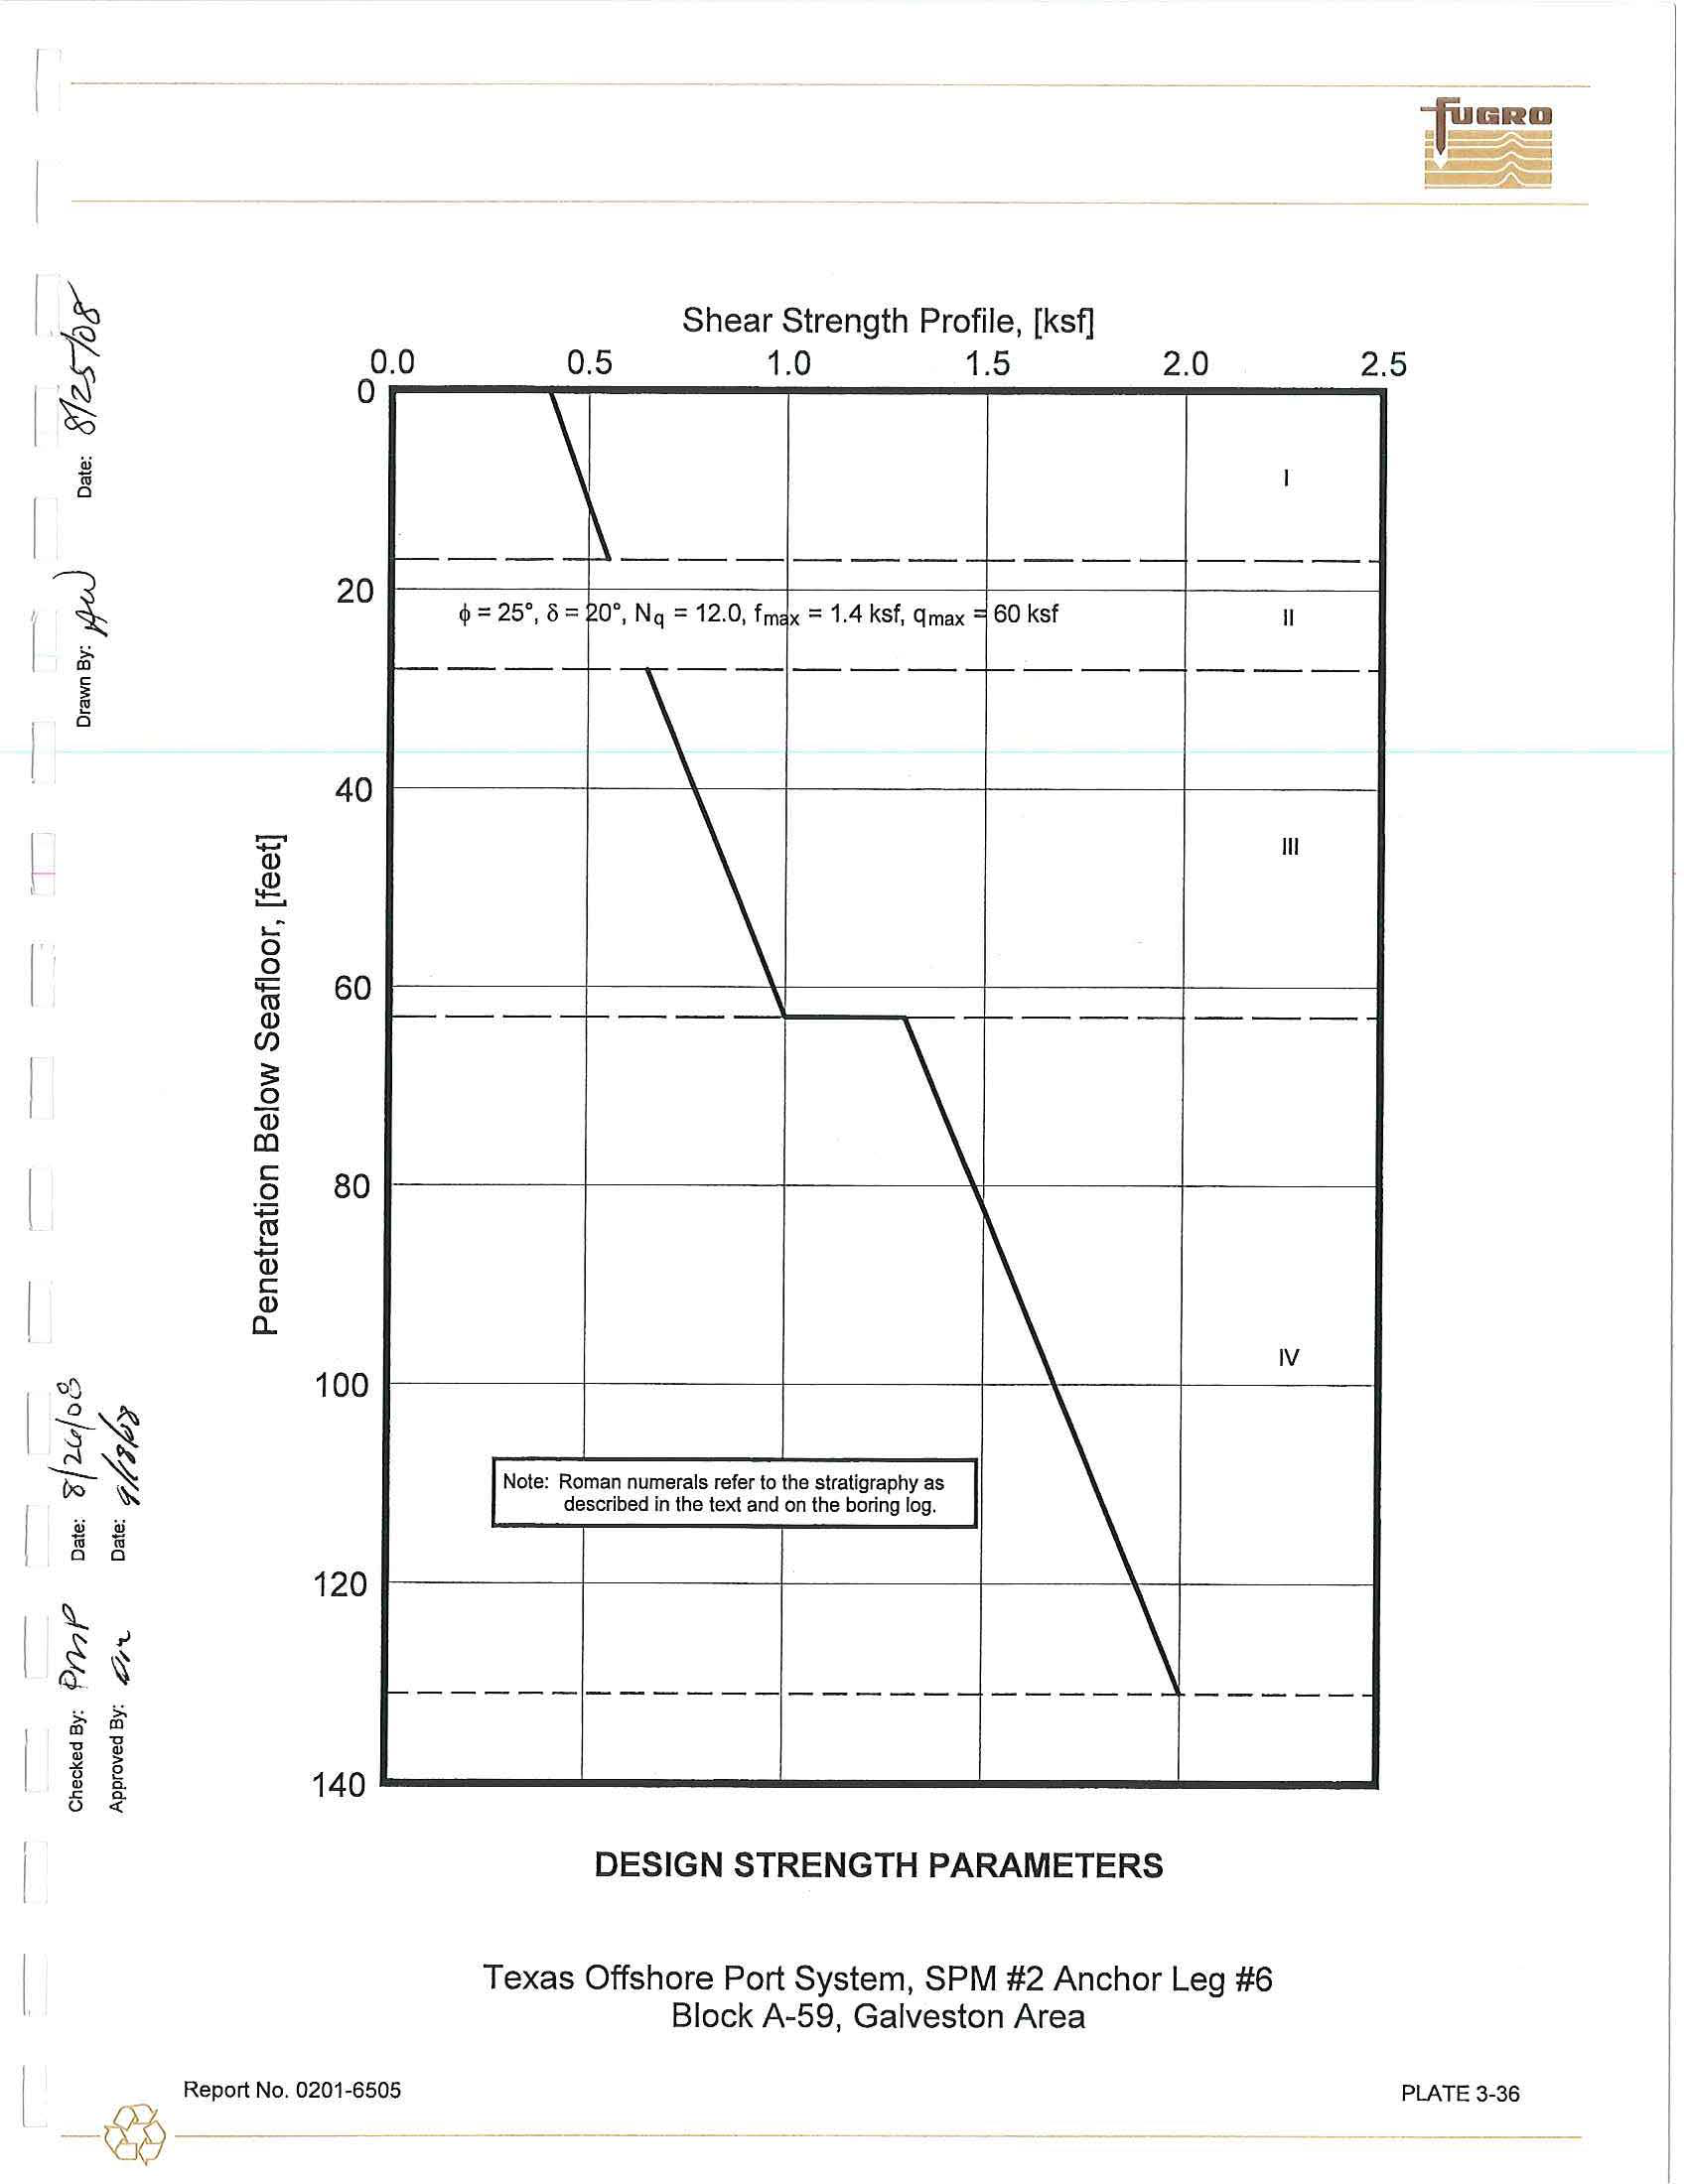
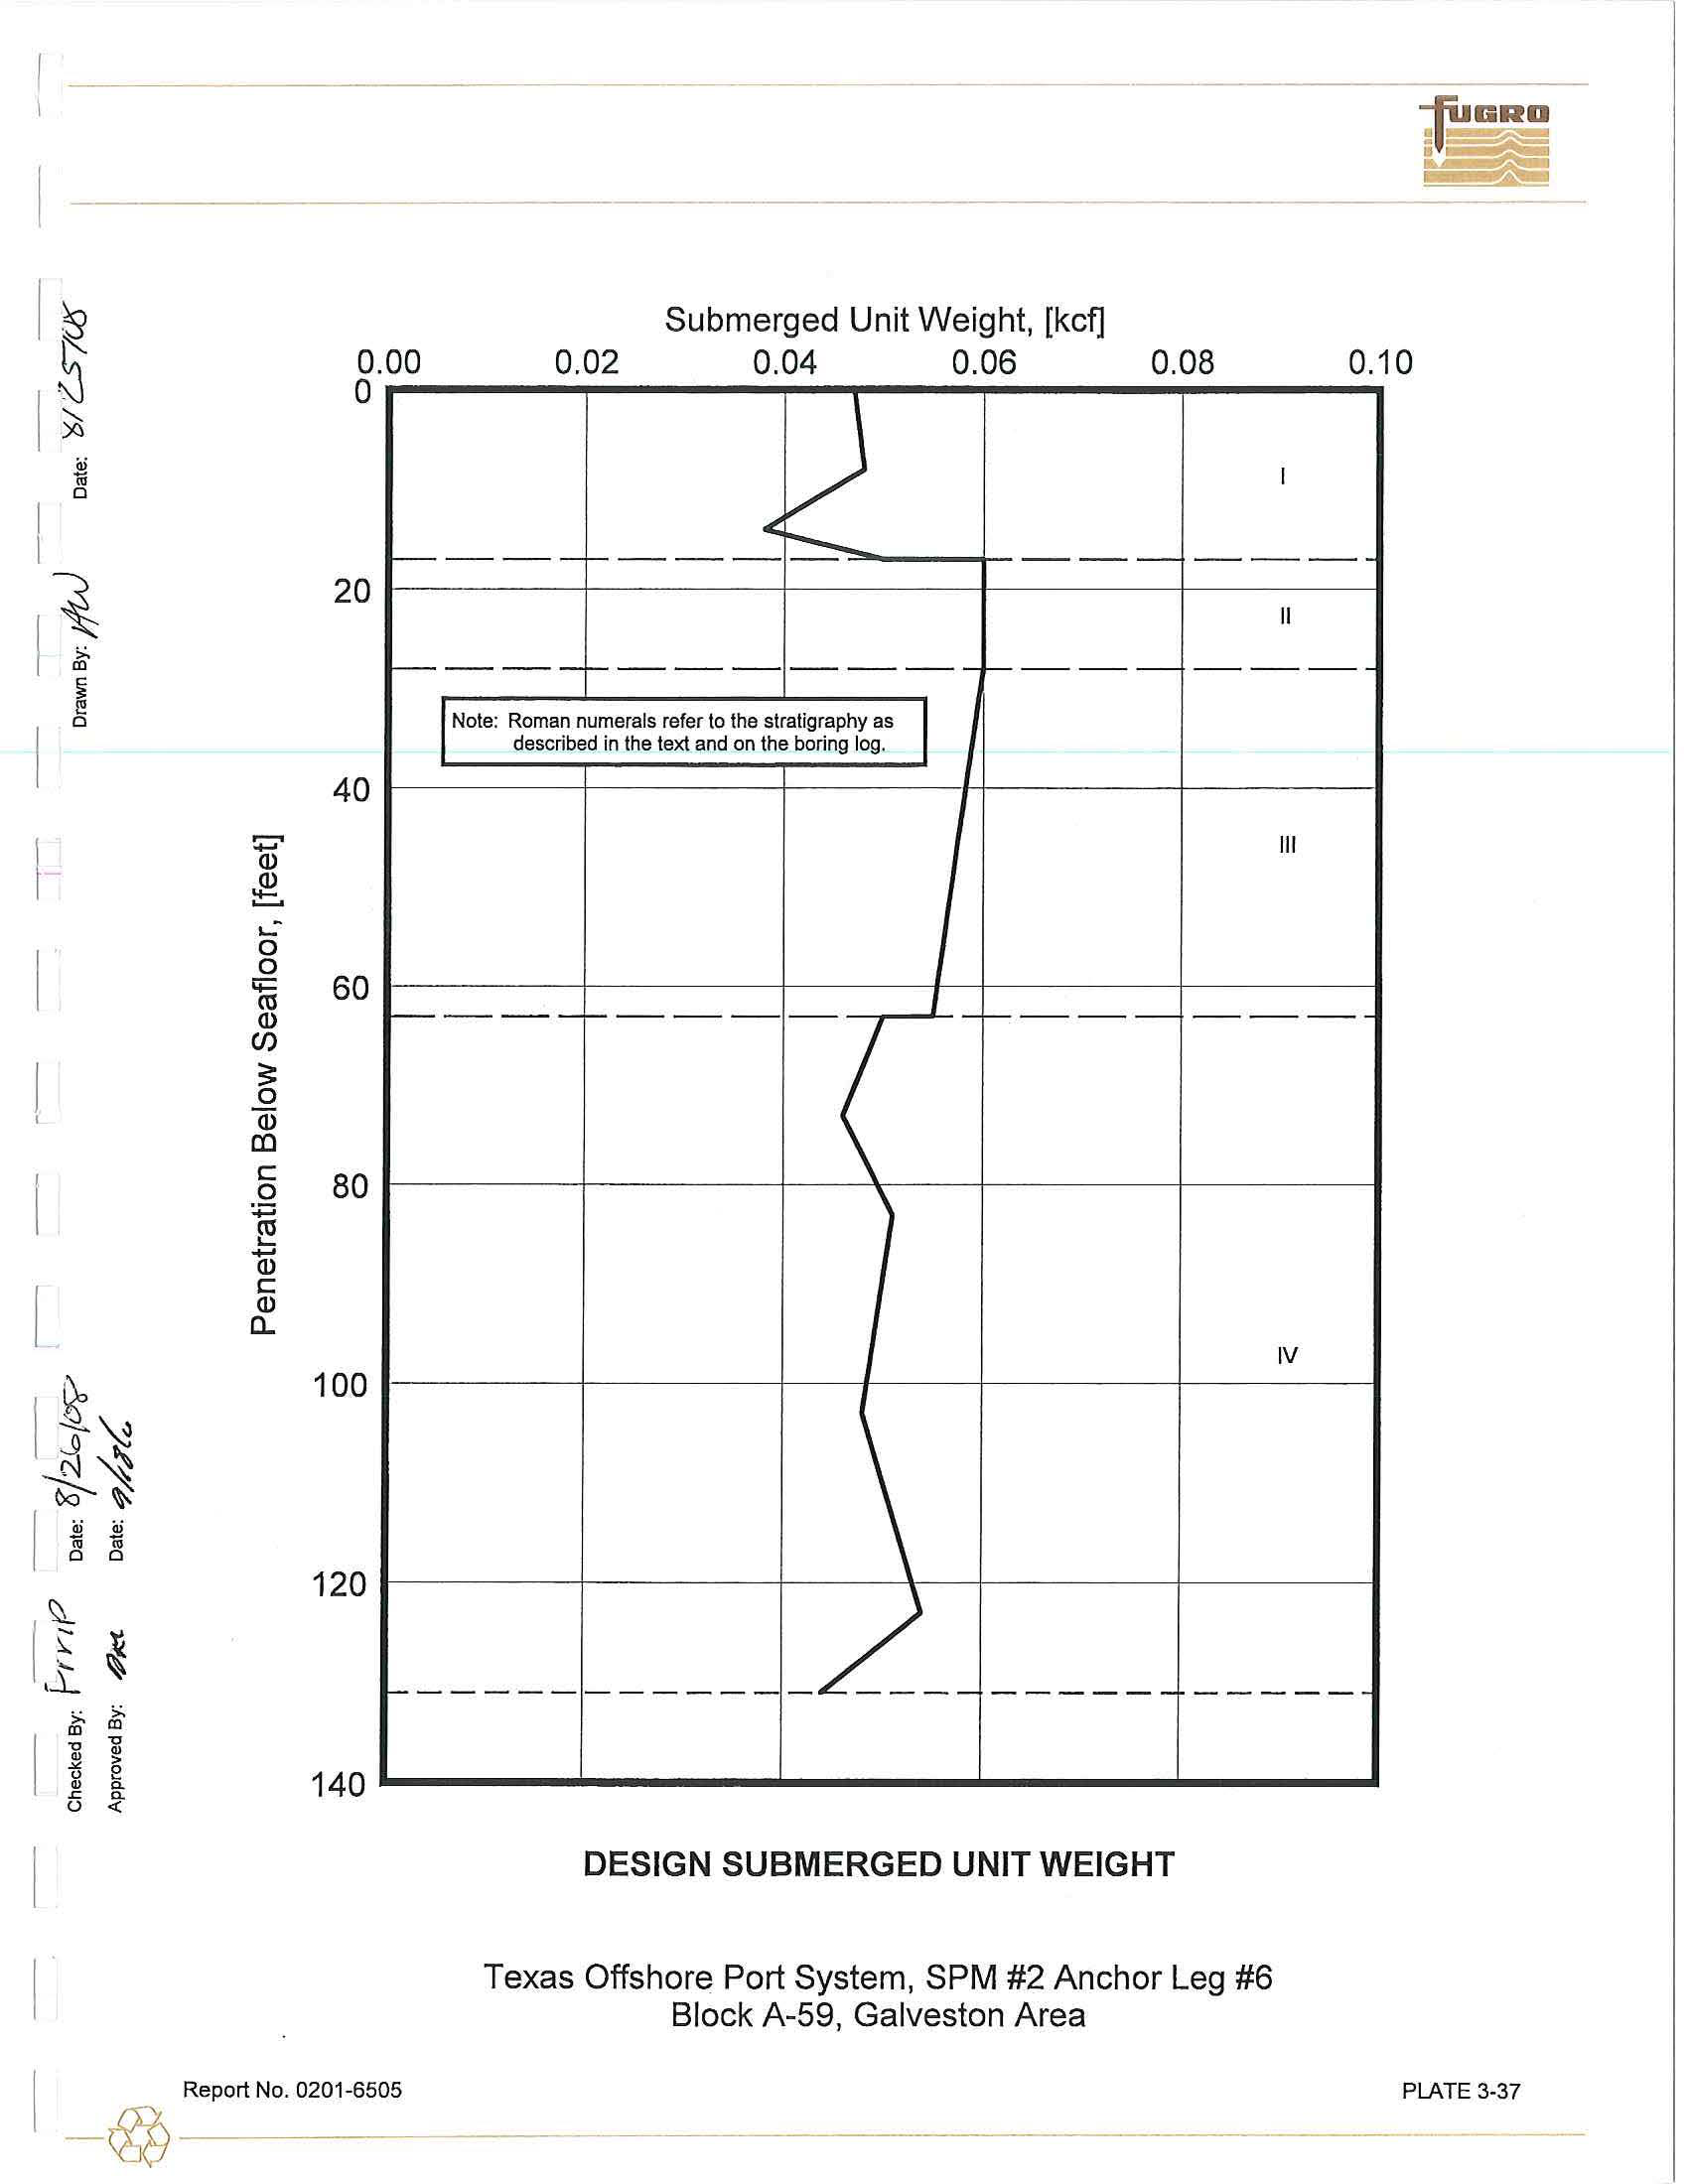
3.4.2.1
Interpretation
of Soil Properties
The shear
streng
th
and
submerged
unit weight profiles shown on Plates
3-36
and 3-37,
respectively, best represent the assembled test results plotted
on
the boring log. These
profi
le
s
were used
in the engineering
analyses.
3.4.3
Pile Design Information
The
pile design information developed for this study
inc
ludes
ultimate axial capacities, axial load-
pile movement data, and lateral soil resistance-pile deflection (p-y) characteristics. The analytical methods
used to develop this information
are
presented briefly
in Section 2.5 and in more detail in Appendix B.
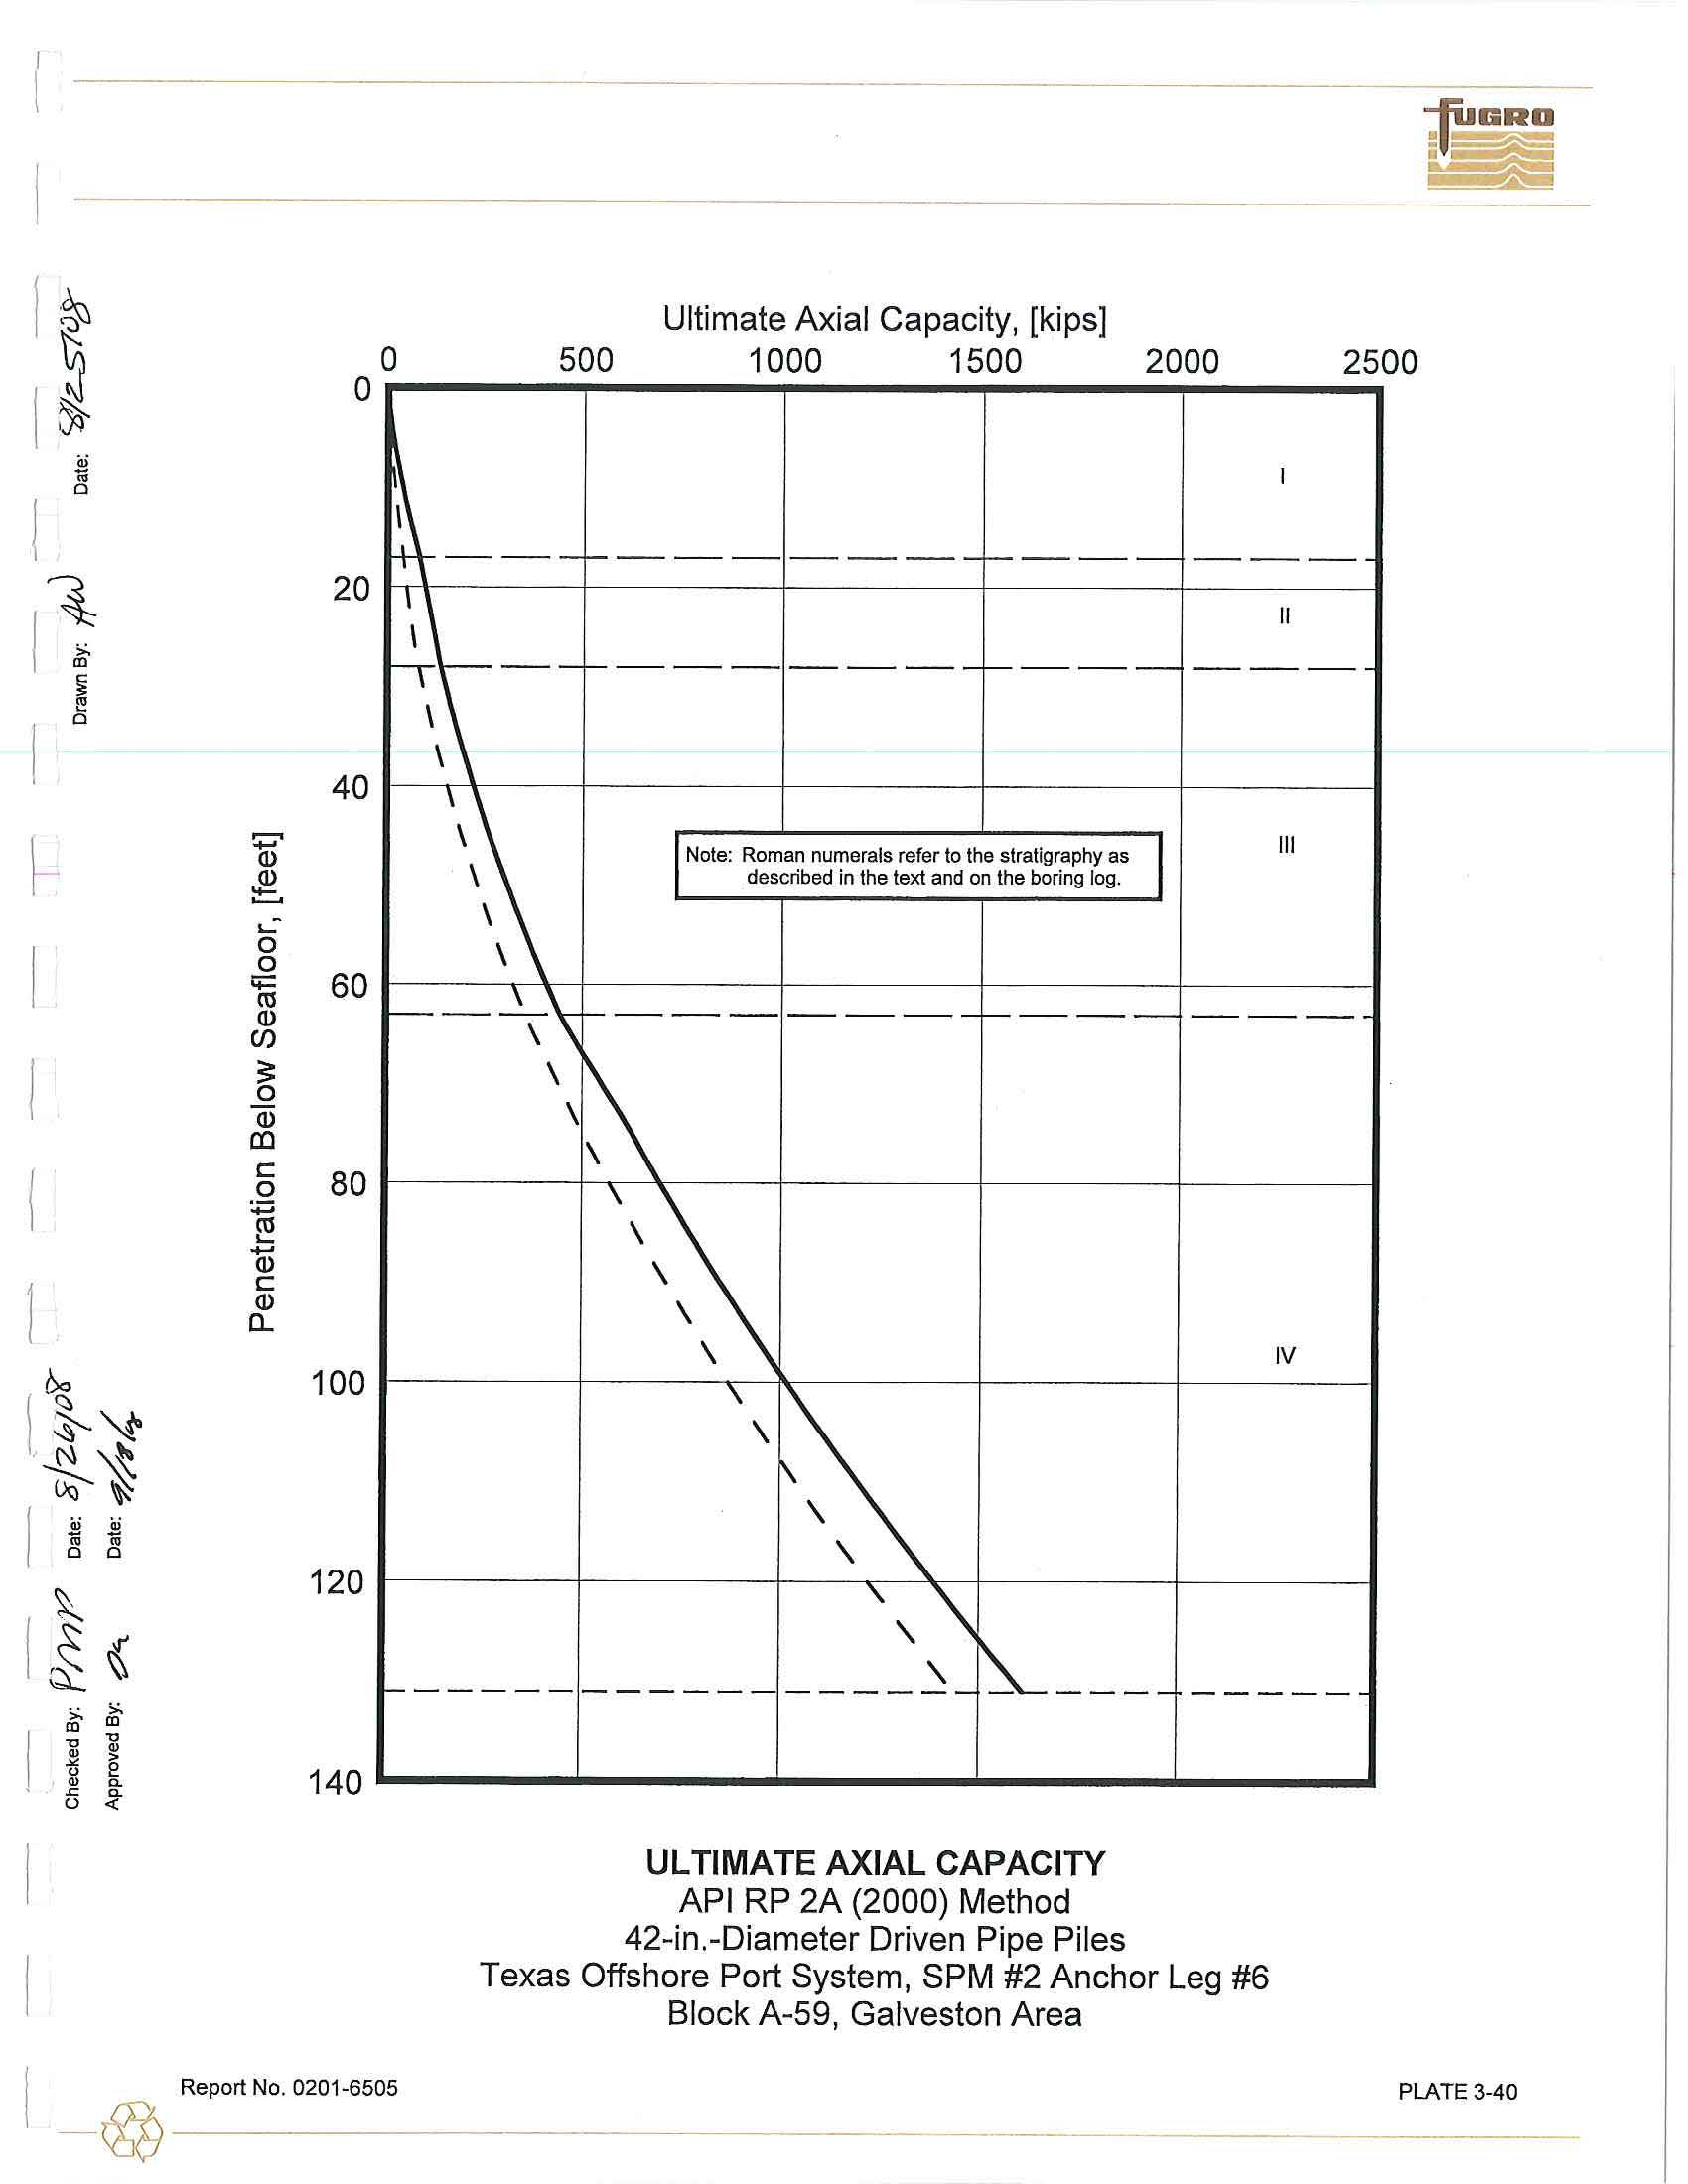
3.4.3.1 Axial Pile Design
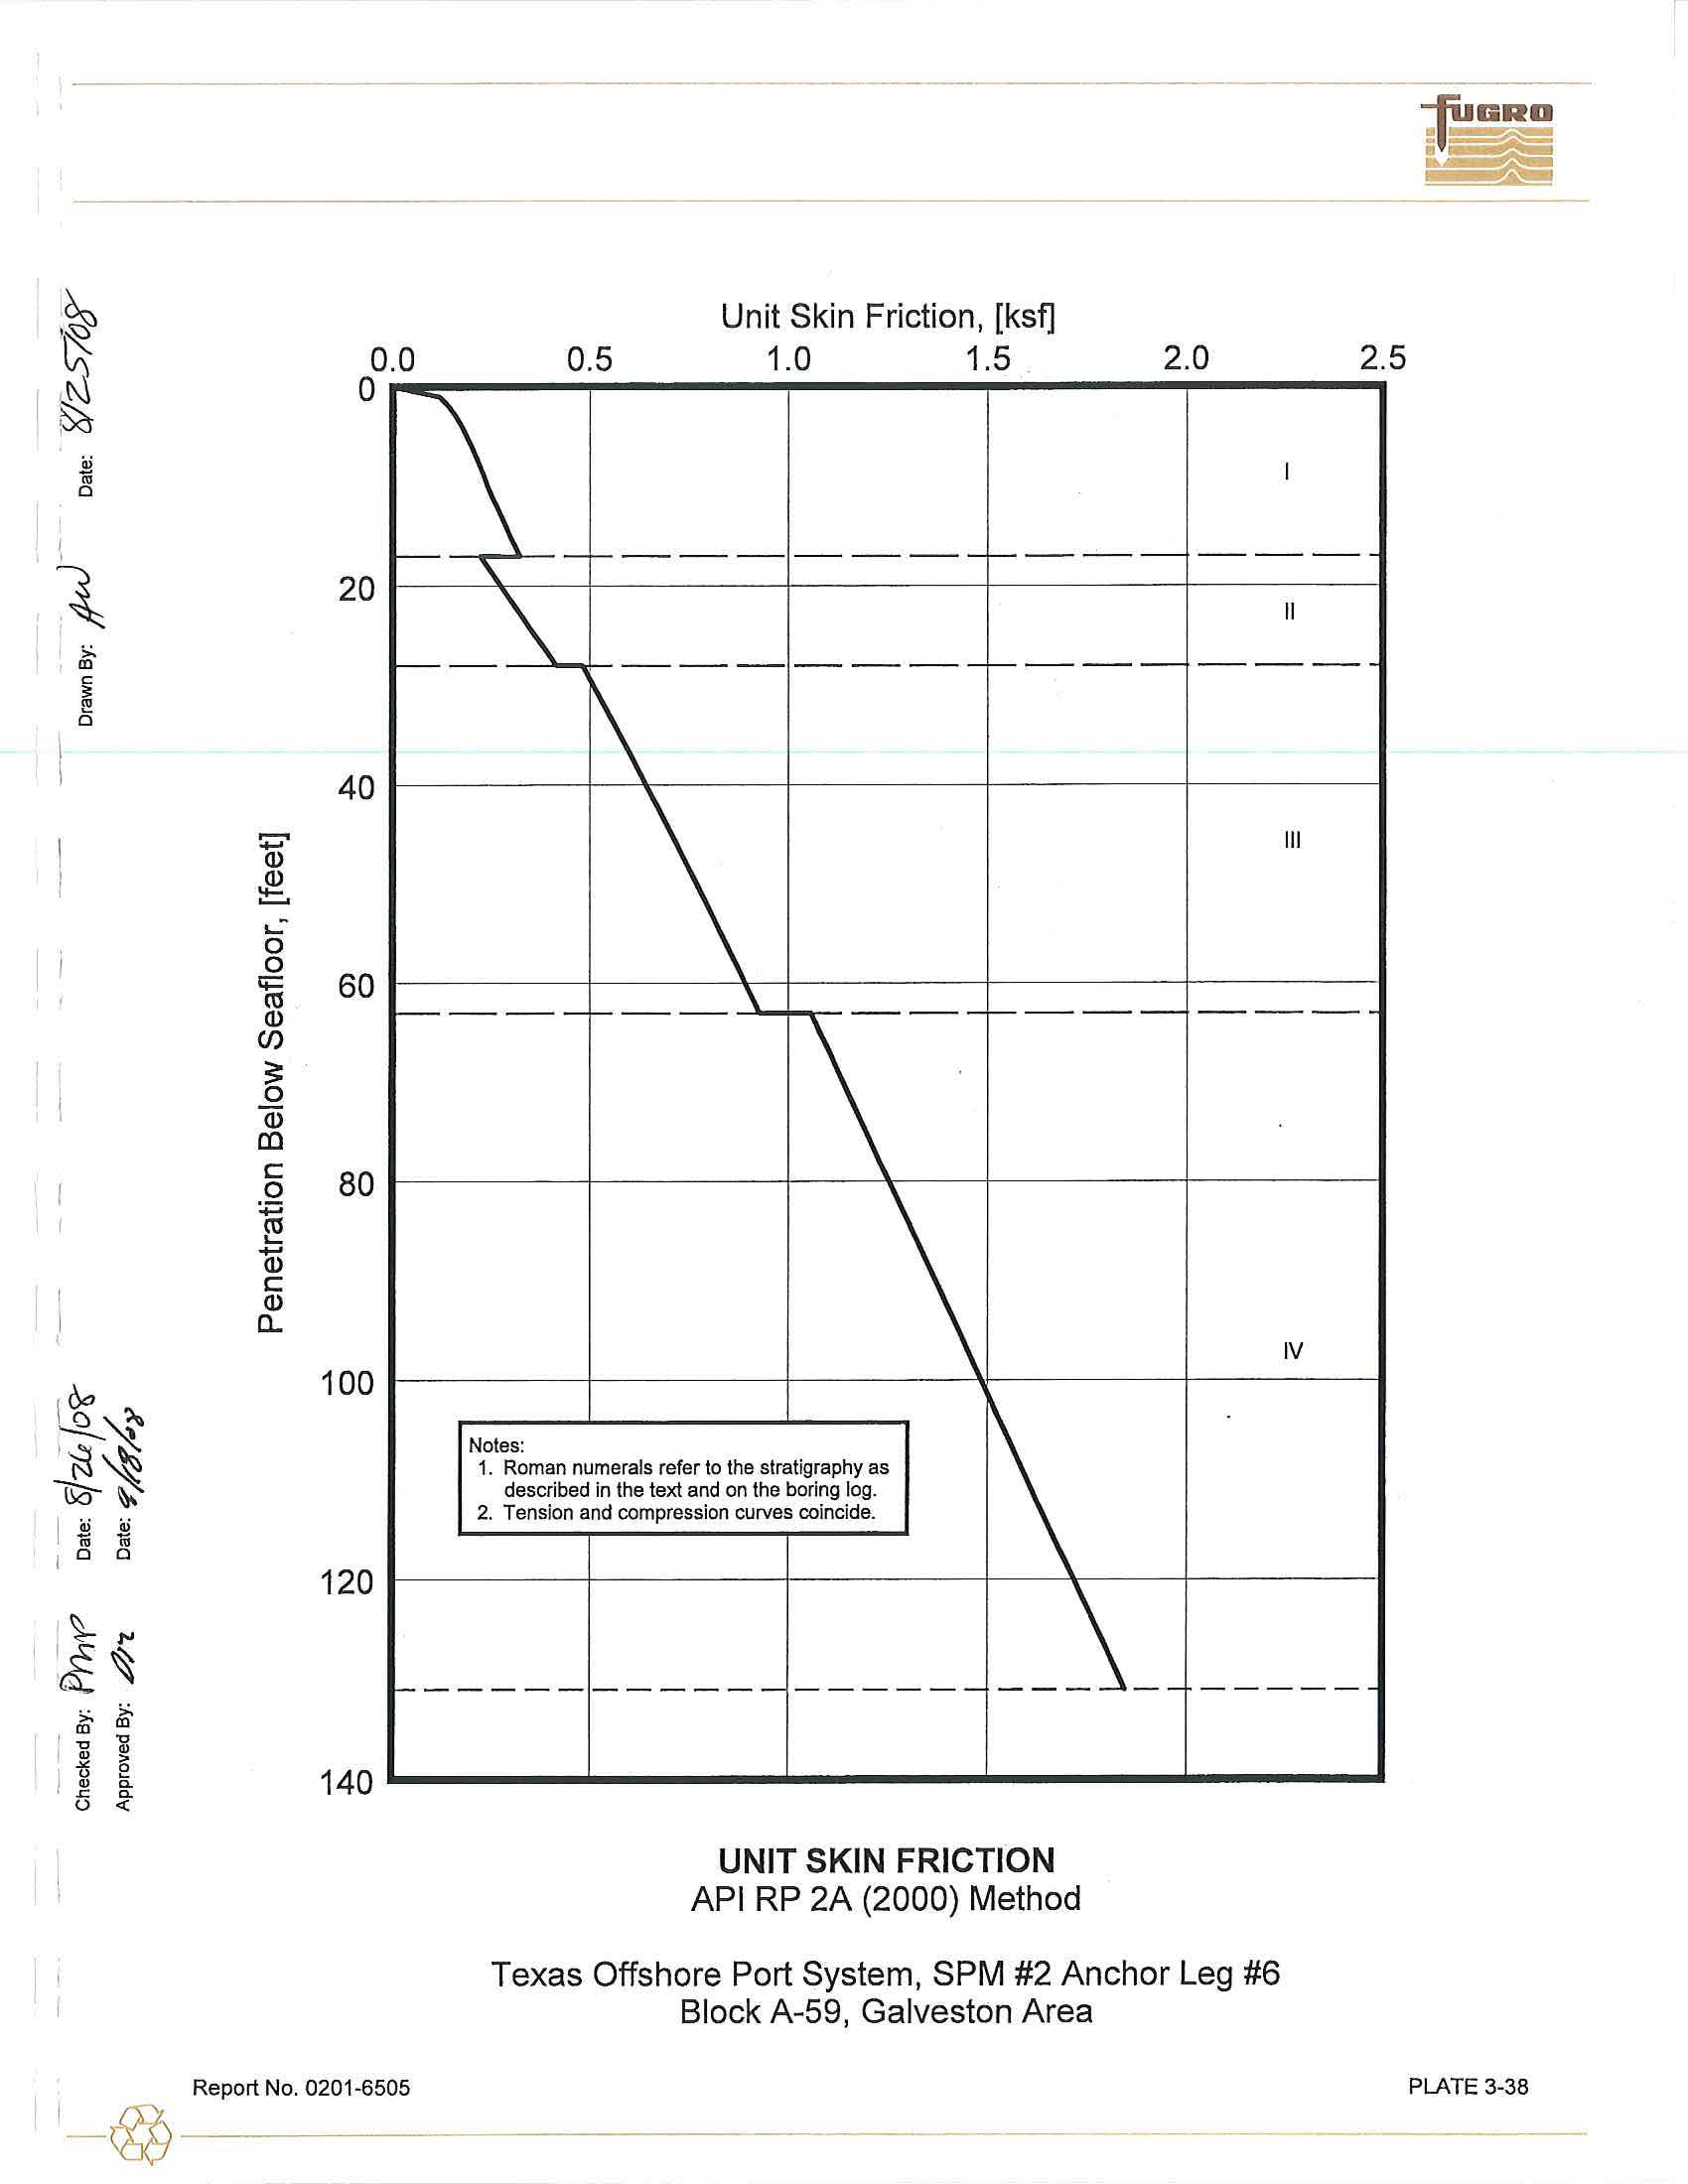
Ultimate Axial Capacity.
The unit skin friction and unit
end
bearing values plotted on Plates 3-38
and
3-39, respectively,
was
calculated using the API RP
2A methods described in Appendix B. These
values
we
re
used to
calcu
lat
e
th
e
ultimate axial compressive and tensile capacities for 42-in.-diameter pipe
piles, driven to final penetration at the boring location. Capacity curves for driven pipe piles (conductors,
caissons,
anchor
and foundation piles) are presented on Plate
3-40
.
API RP 2A recommends that pile penetrations be
selected
using appropriate factors
of safety or
pile resistance factors. These factors are discussed
in
Section
2.5.1 of this
report.
I
-
@-
R
-
ep
_
o
_
rt
_
N
_
o
_
. 0
_
2
_
01-
_ -
65
-
05
3-10
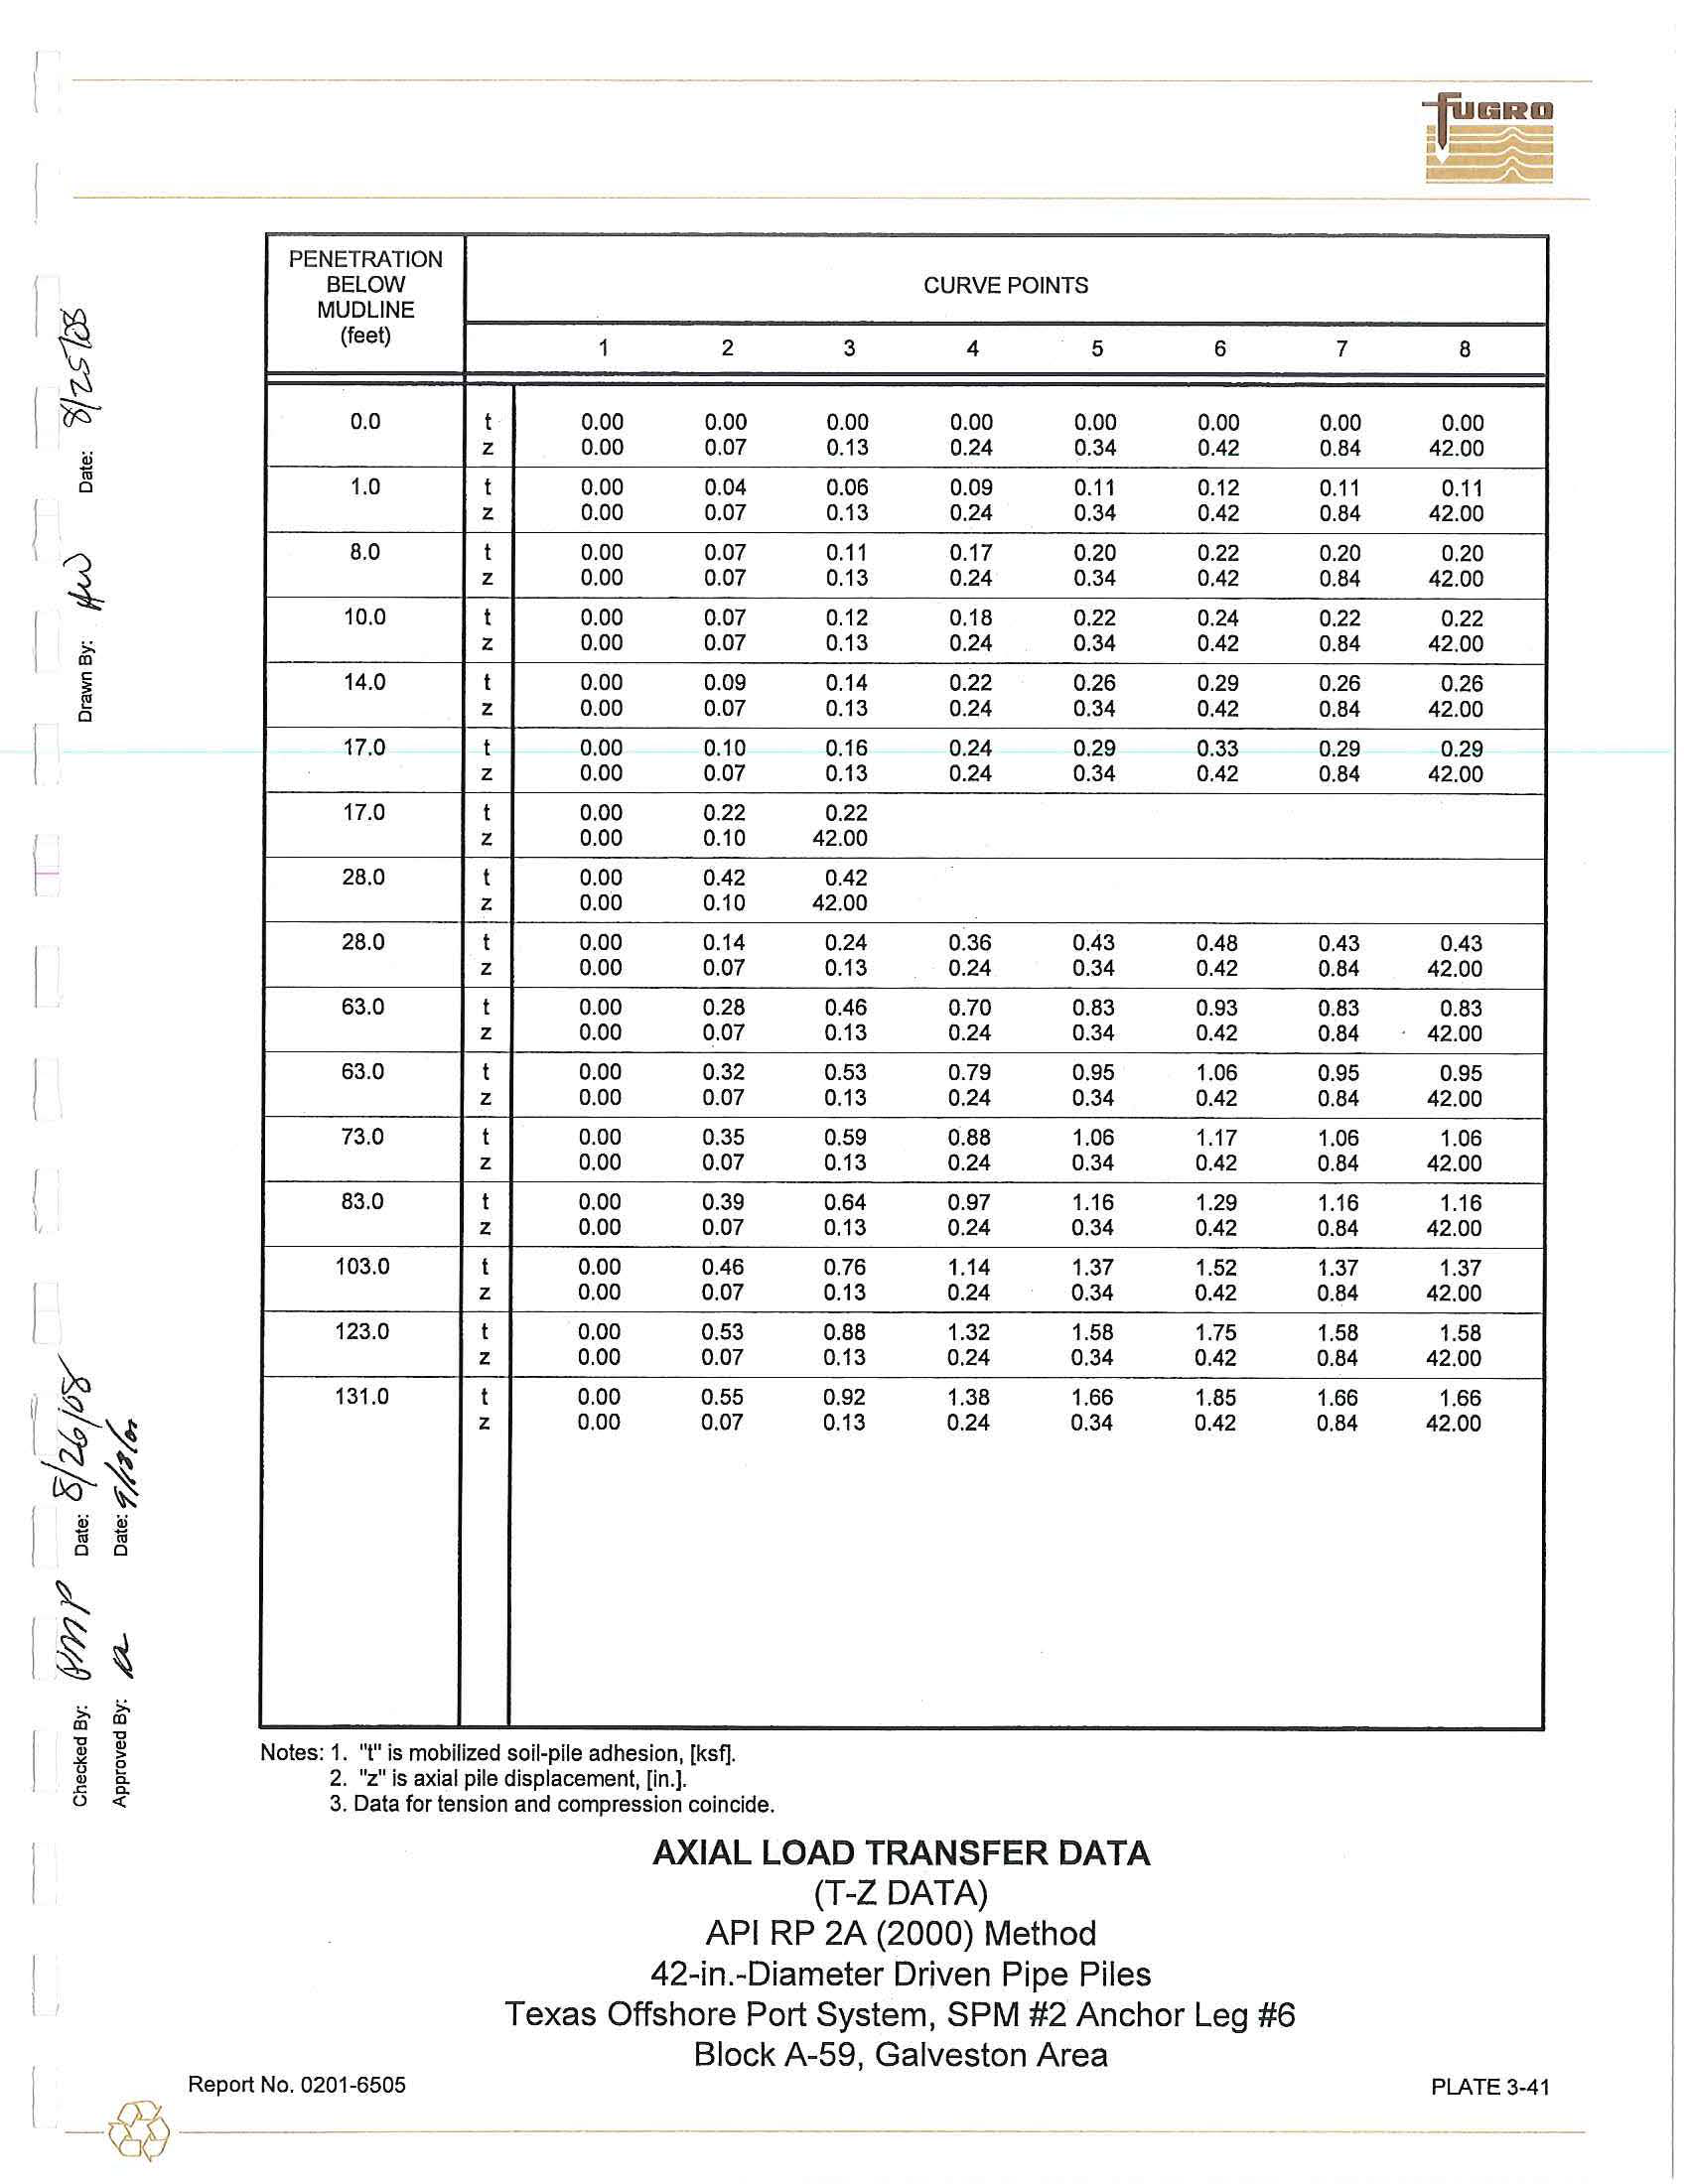
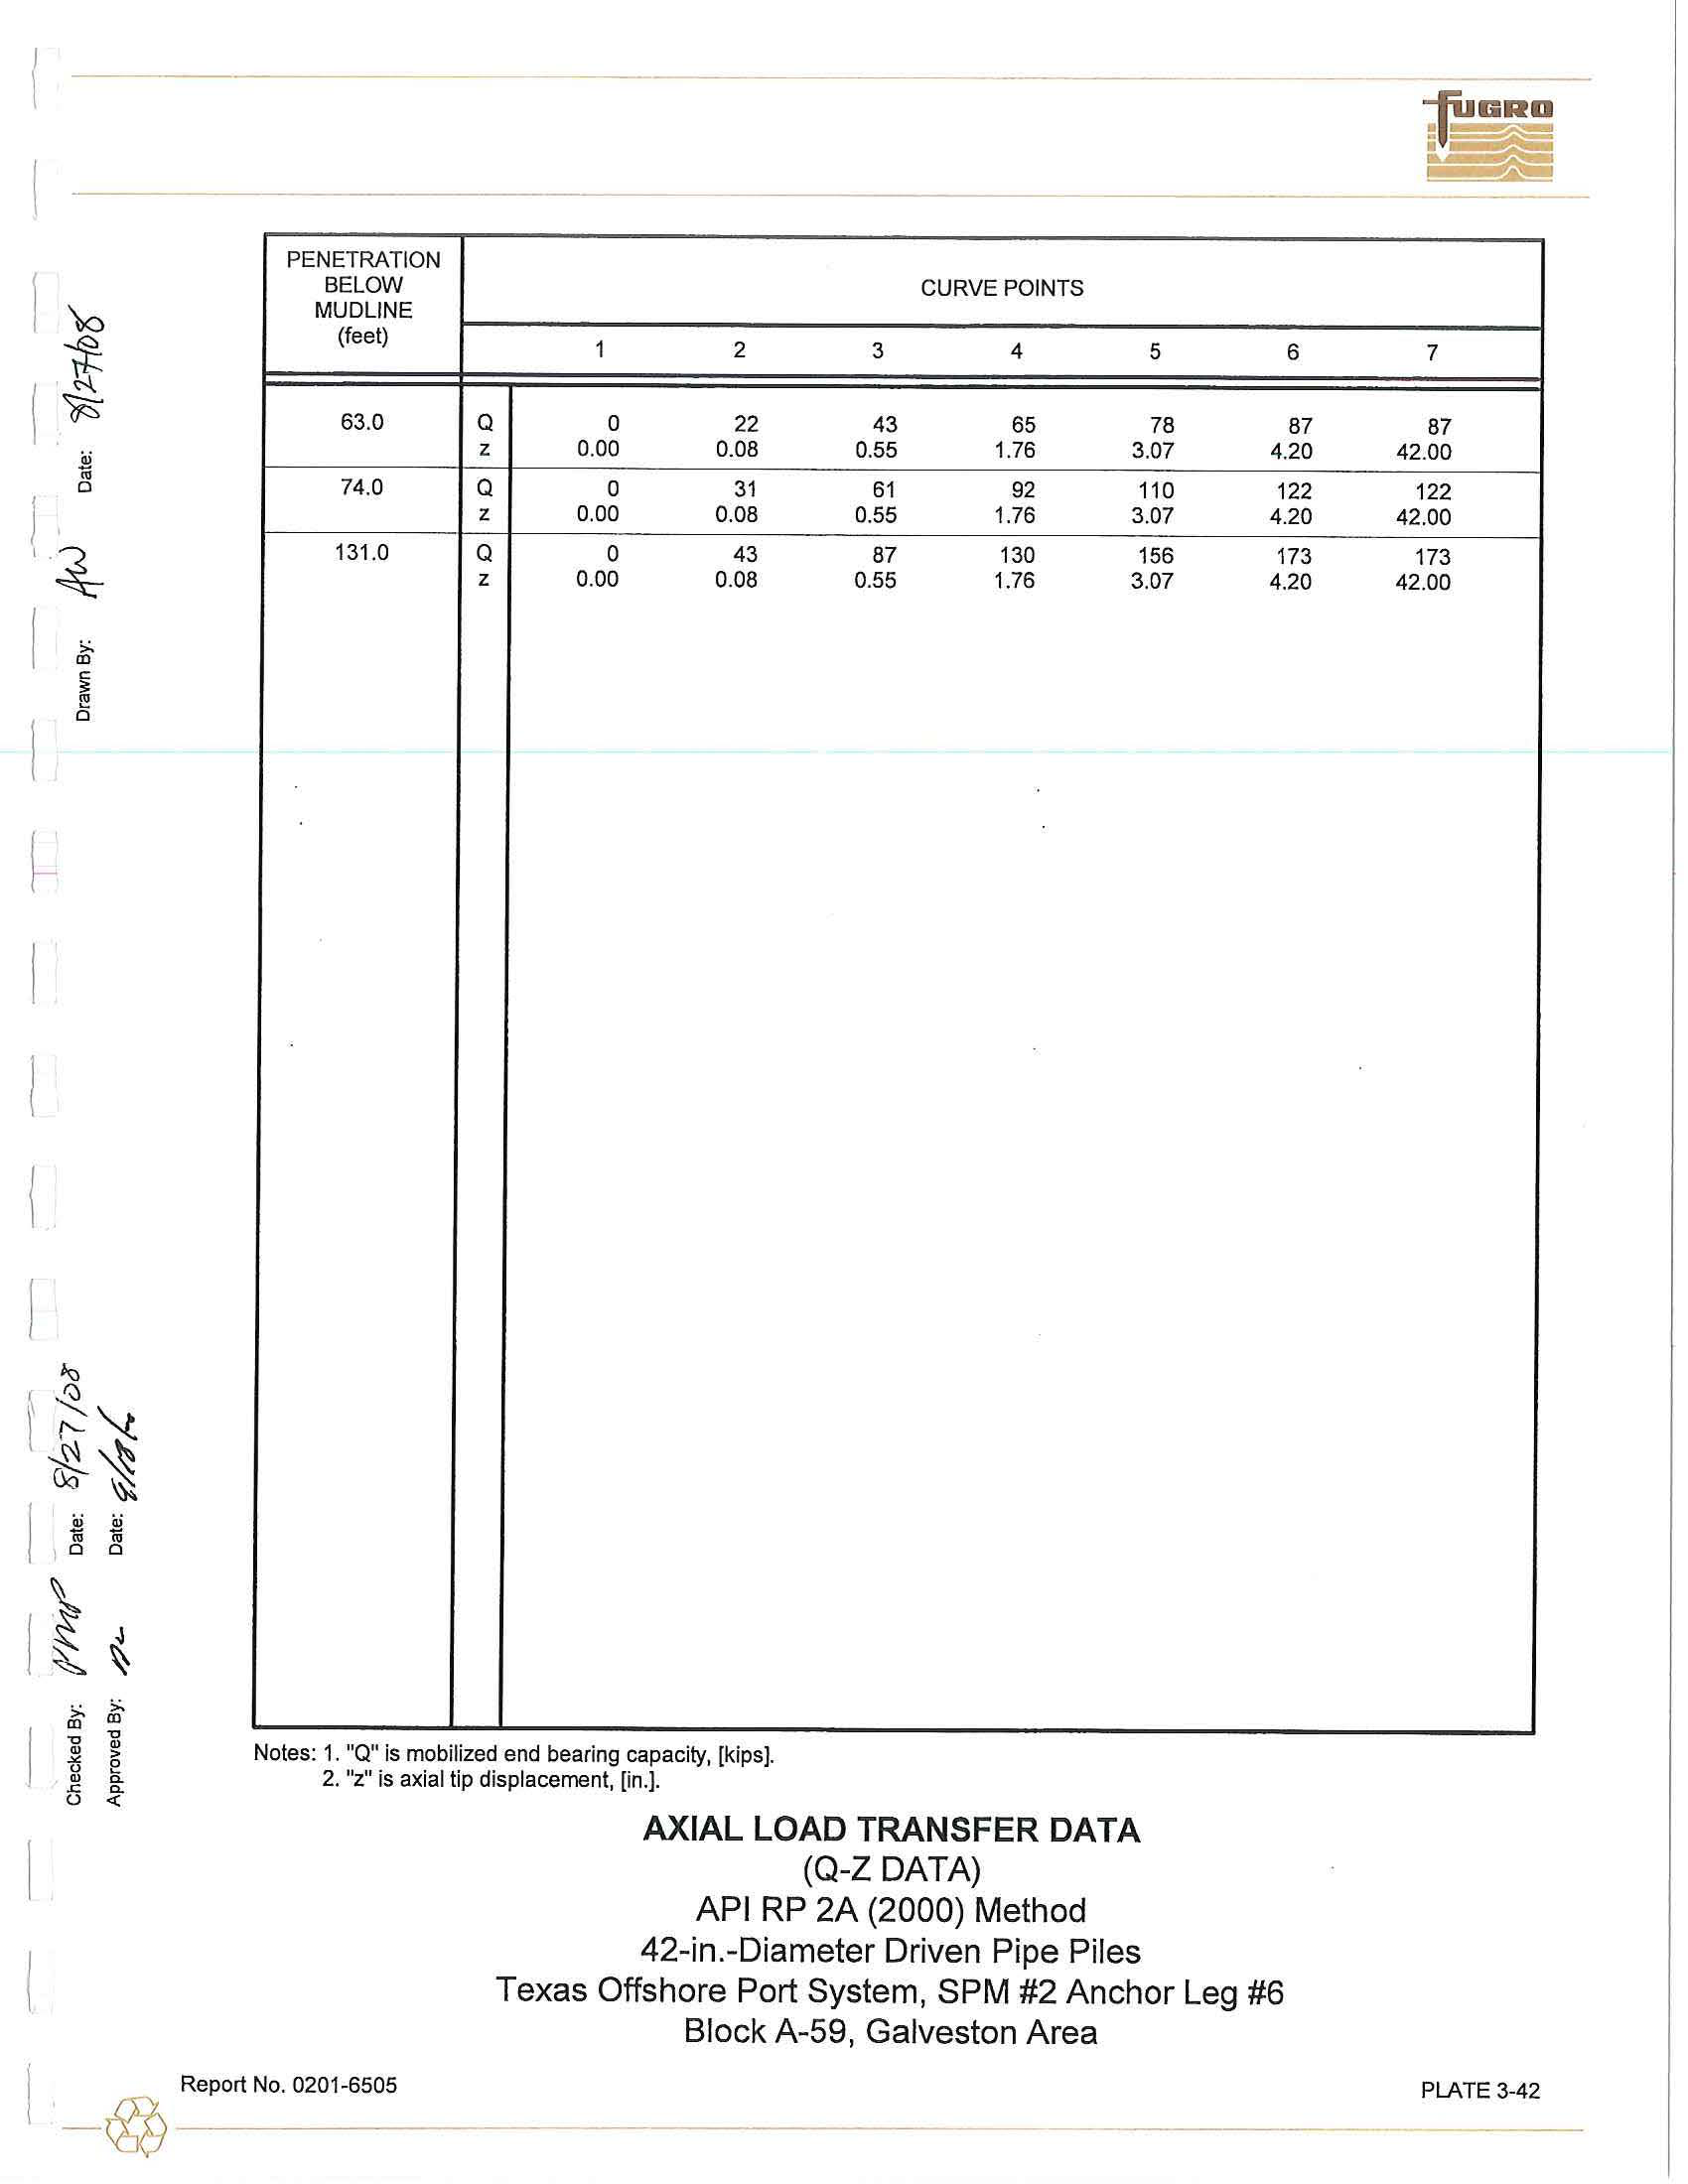
Axial Load
Transfer
Data
.
Axial
load
-
pil
e
movemen
t
analyses are usually
performed using
a
computer solution
based on methods
developed by Reese (1964)
or Matlock, et al. (1976).
P
la
tes
3-41 and
3-42
present
the
results
as side
load-side movem
en
t
(t-z) and tip
load-tip
movement (Q-z) data for
42-
i
n
.-
diameter driven
pipe
piles,
respectively.
The
Q-z
data
should be
used
for foundation
piles
and
neglected for
caissons and conductor
design.
In
developing the axial load
transfer data in the
cohesive soils, a
post-peak
adhesion
ratio
of 0
.
90
was utilized.
3.4.3.2
Lateral
Pile
Design Data
The
soil
resistanc
e-
pile deflection
(p-y) characteristics
of the
soils at
the
boring
location were
developed for individual 42-in.-diameter
driven
pipe
piles
.
These data may be used
in lateral load
analyses
of driven
piles,
conductors and caissons.
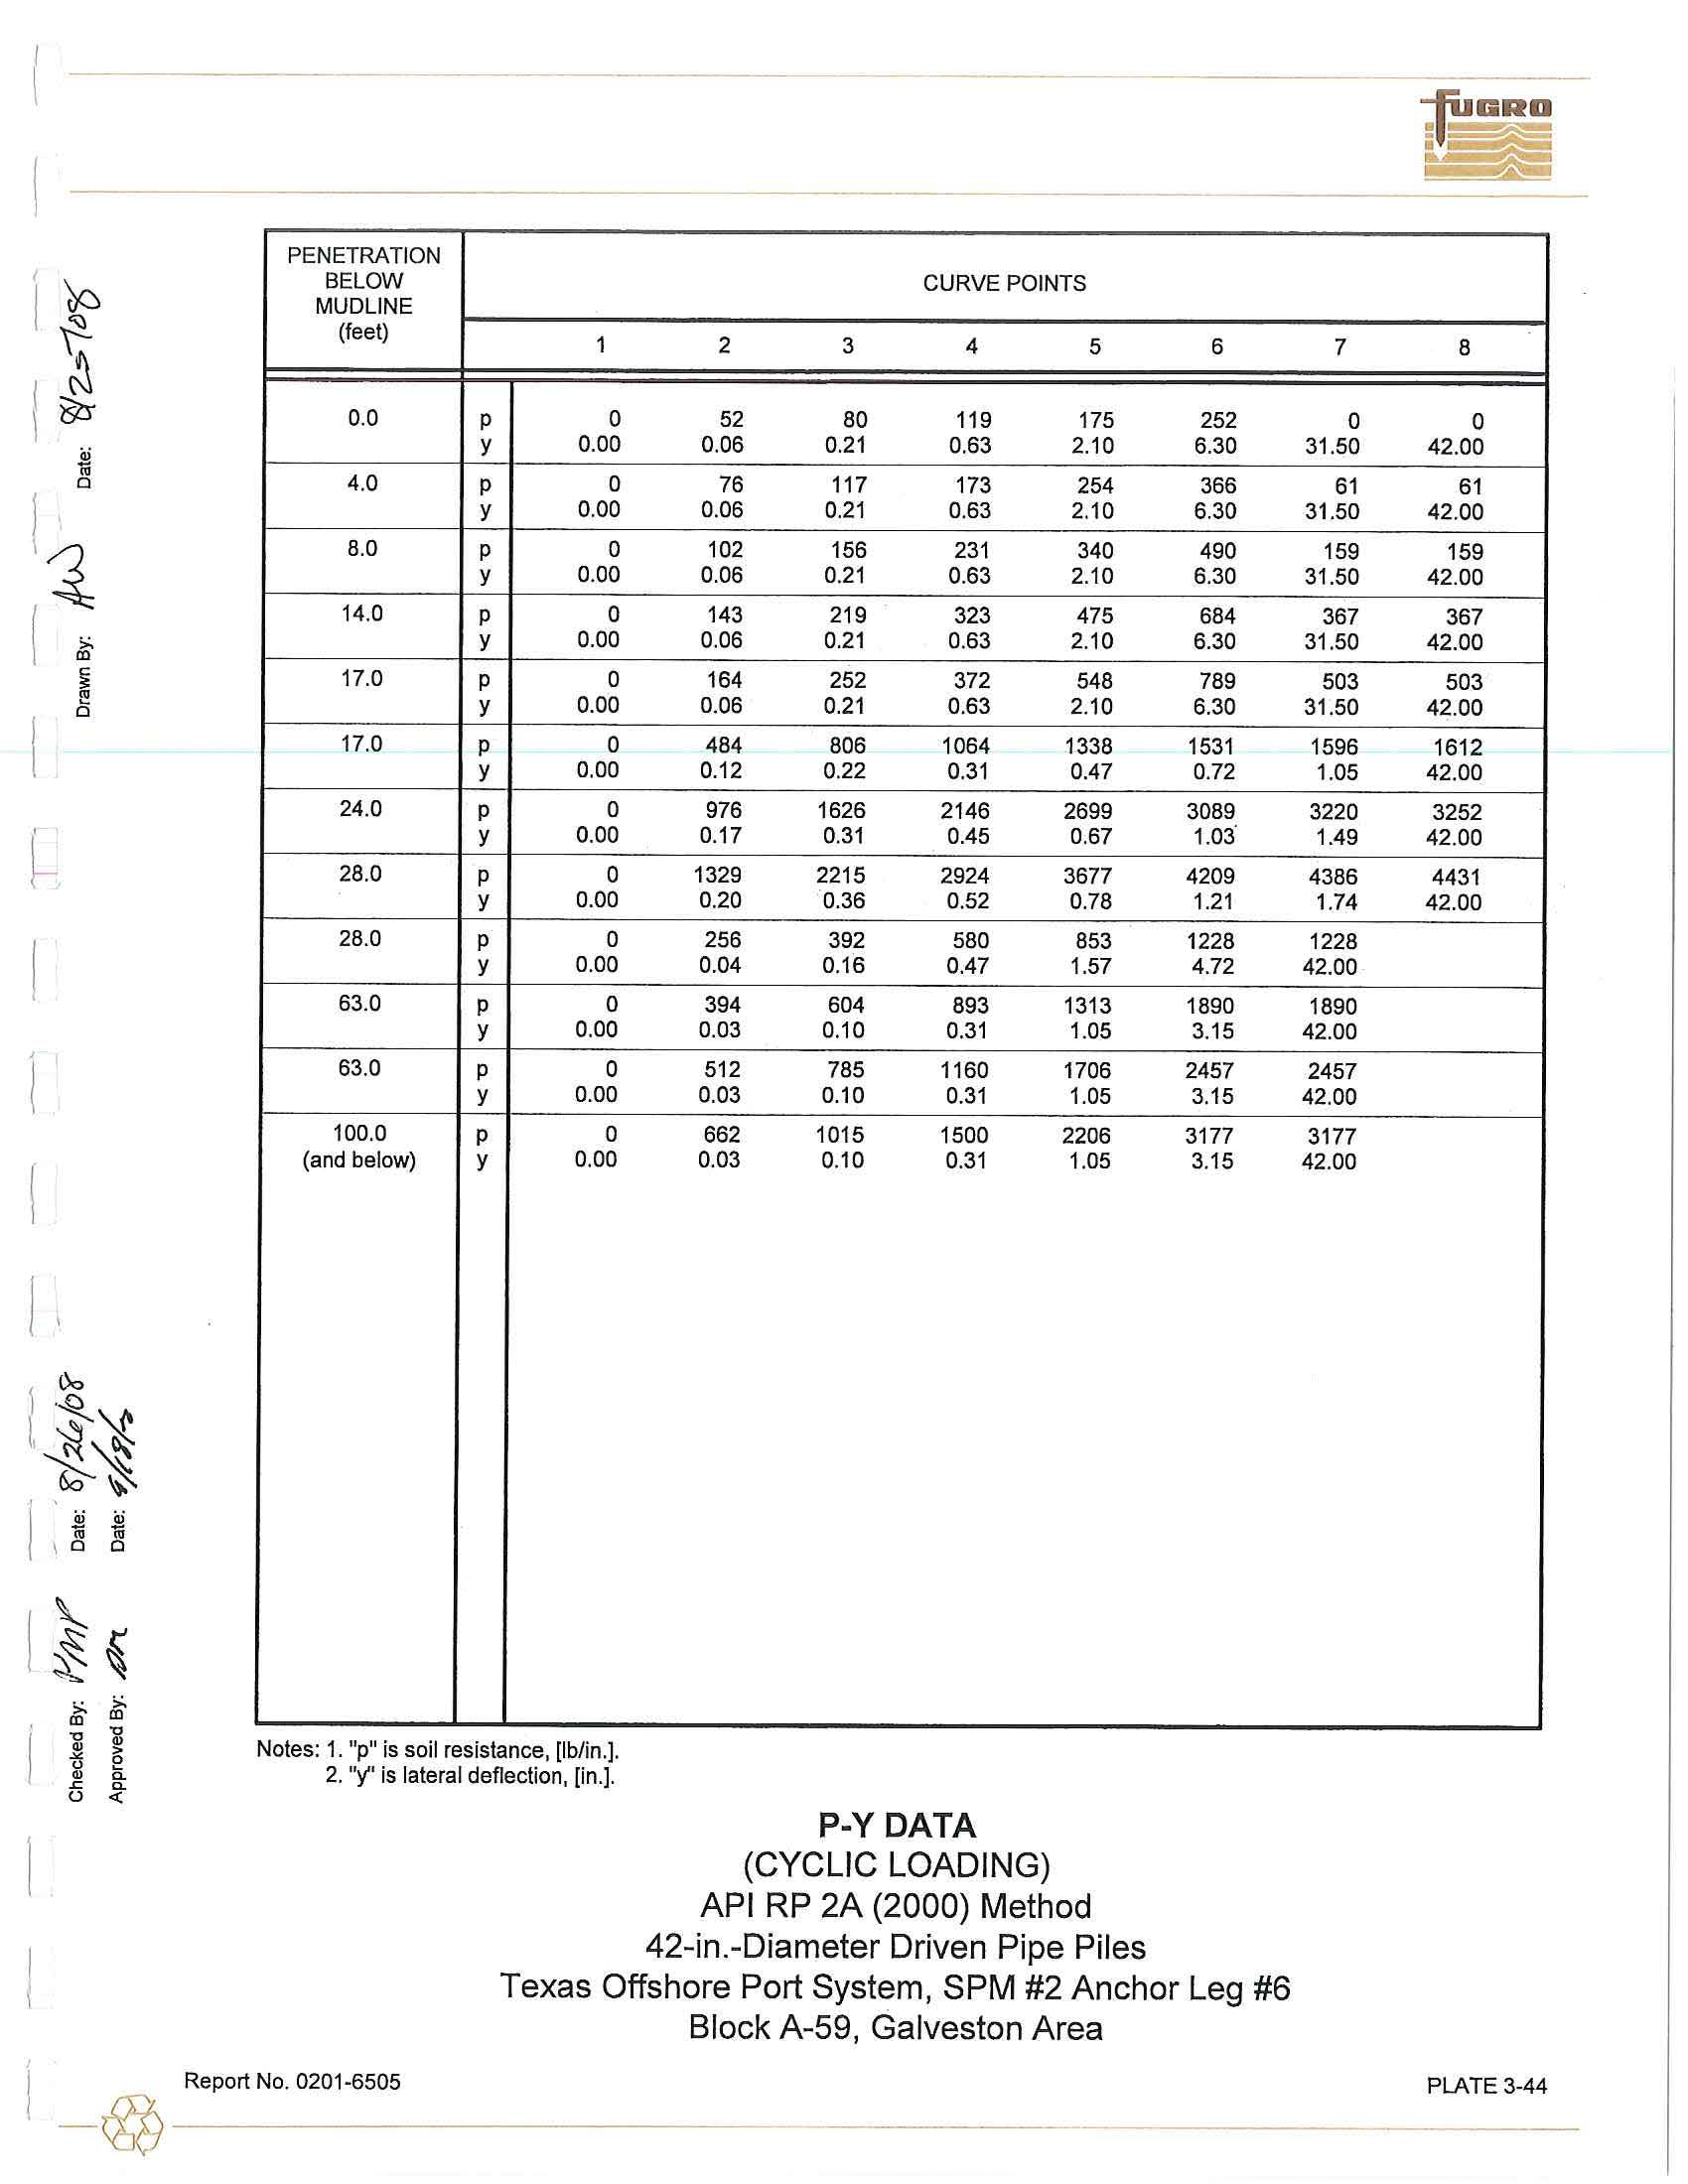
The p-y data
for cyclic
loading
were developed
to 100
-
ft
penetration
using procedures that
have been
outlined
in API RP
2A and
briefly
explained in
Appendi
x
B
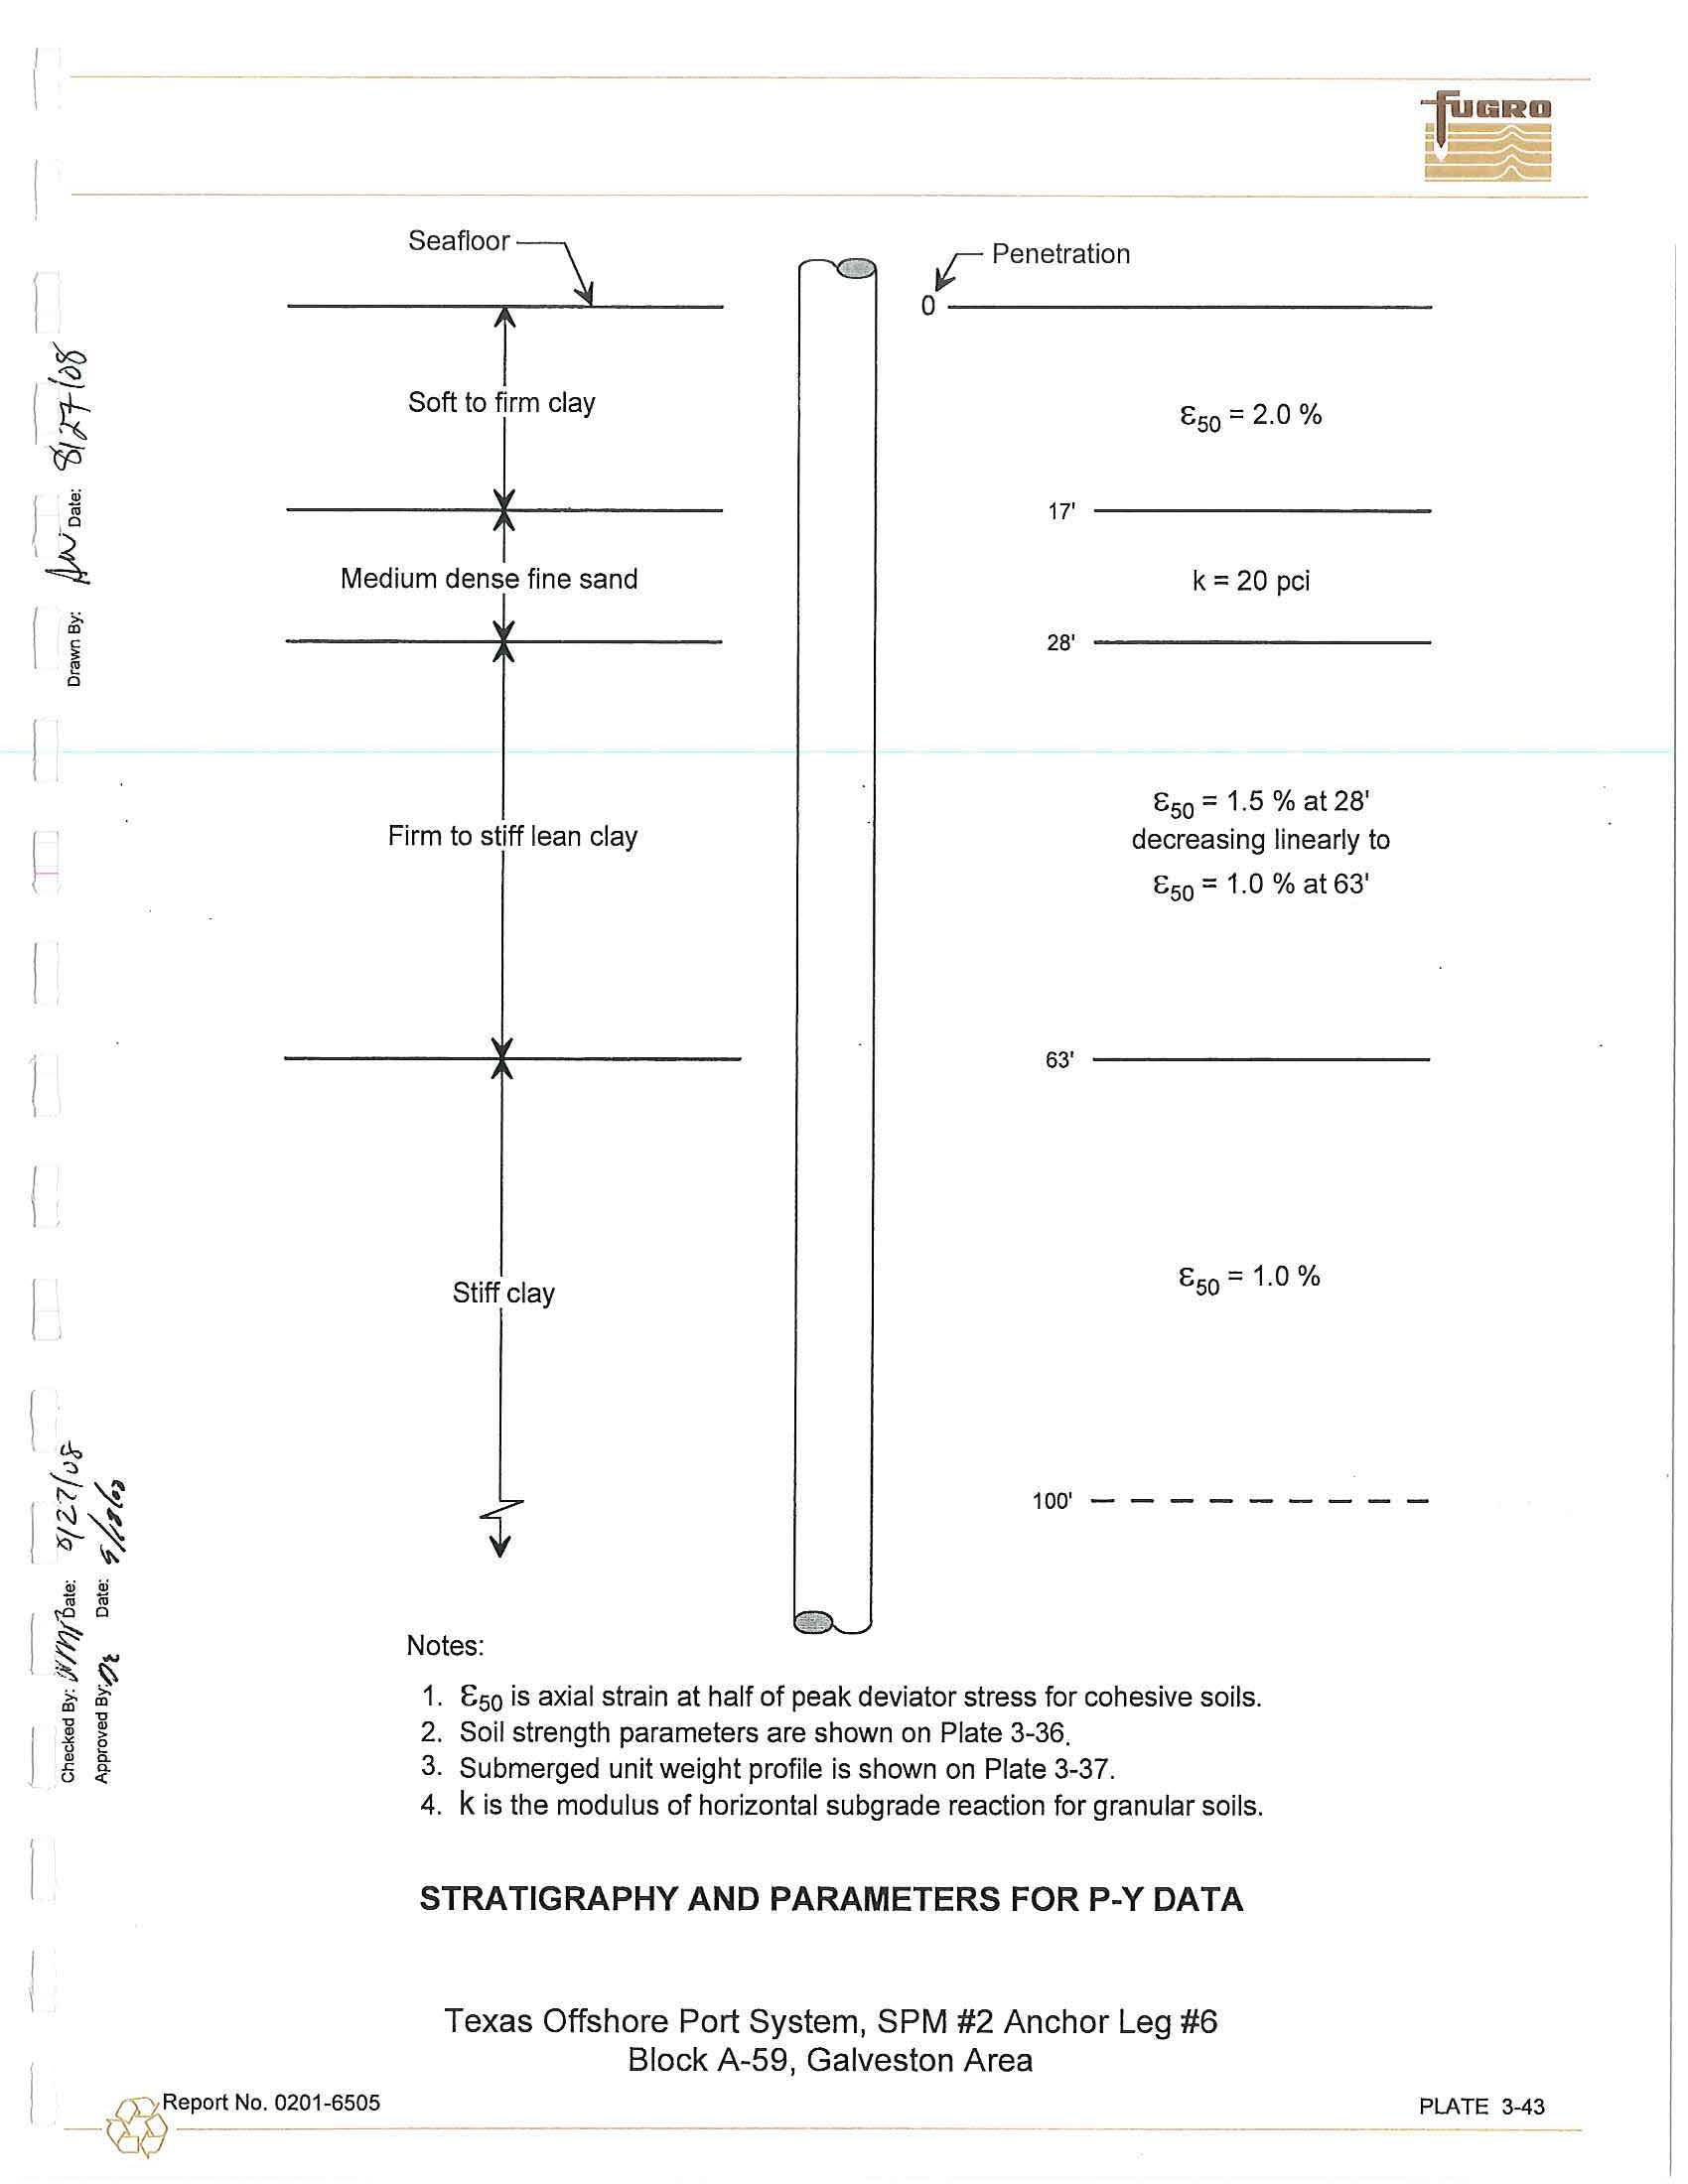
.
The
stratigraphy and parameters
used to develop
the p-y
data
are presented
on
Plate 3-43.
The p-y
data
for 42-in.-diameter driven
pipe
piles are presented on
Plate
3-44.
P-y
values
presented
at
100-ft
penetration
may be
used
for lateral load
analyses at greater
depths.
I
-
@
-
R
-
ep
_
o
_
rt
_
N
_
o
_
.
02
_ _
0
_
1-
6
-
50
_
5
__
3-11
I
@
CheCl\t:u oy.
frv
-
Approved By:
.?J.ft..-
X =
3,266,758'
IDENTIFICATION
TESTS,
[%]
Y
=
241,331'
BLOW
20
4
0
60
80
UNDRAI
N
ED SHEAR STRENGTH
::u
CD
"O
COUNT
[ksf]
Texas.South Cen
t
ra
l
Zo
n
e Coo
r
d
i
nates
SUBMERGED
UNIT WEIGHT,
[
kcf]
0
;::i.
0
z
~
SEA
FL
OOR AT EL
-
12
4
'
0
.0
3
0.04
0.05
0.06
0.5
1
.0
1
.5
2.0
I
SOFT
T
O
FI
RM GRAY C
L
AY
WOH
+--
>----e-1
Q:i
07
(t
•
•
0
0
"-)
~
Ol
0,
0
10
0,
I
WOH
+--
e
Do
@~
I*
_
_
_
..
I
I
Note:
See PLATE
3-34b
for deta
il
e
d
soil
I
WOH
•
D
b
<ft~~
I
stratig
ra
phy
t
o 40-ft
p
enetration
.
+
-
,_.
_
___
-
I
5
~
+
----
-
_
_..,.
__
--
+
V<)
A
*
10
~
I
10
>----
D-
---
--
--+
<)
~.
--
-
--
I
(17.0
'
l
10
--
[
•
n
...
ii'>
$
20
m
I
MED
IU
M
D
ENSE GRAY FINE SAND
--
...
10
NP
•
-.
~D
-
-
-
20
II
I
20
•
•
D
I
Note:
NP
-
Non
-
plast
i
c material I
...
..
(28.0'l
•
FIR
M
T
O ST
I
FF GRAY
L
EAN C
L
AY
15
-
-
r
,
A
-
-
-
...
3
0
v
...
30
..
I
PUSH
-tff,.
D
#$
+
D
•
•
PUSH
+-
--
D
<)
$
'1>
40
-
40
I
-
wi
t
h an
H
2S odor, sa
n
d pockets
.
and a few s
h
ell
PUSH
+-
-
-
--'+
D
<)
~
.~.
I
ll
fragme
n
ts at 44'
I
PUSH
..__
-
rm
/\
A
~
~
~
...
-
~
5
0
...
50
I
-
wit
h
a few shell fragments below 53'
PUS
H
-with silt pockets, pa
rti
ngs, and
seams
at
54
'
(~
+-
-
__
..._+
D
D
!:::.
fiJ;,.
I
-with a
f
ew
silt
pockets and
p
a
rti
ngs
be
l
ow
58'
PUSH
<.-
-
n
-
60
-
....
60
(63
.
0')
I
S
TIFF
GRAY CLAY
PUSH
+-
--
-.t
--
+ O[
!:::.
:~
$,t,.
-w
i
th
gas b
l
isters and a few sil
t
pockets an
d
pa
rti
ngs to 65
'
7
0
-
70
I
-expansive, with a
f
ew
li
gh
t
gray bands, 73' to 85
'
PUSH
il
$
-with
many silt pockets, partings,
and
seams at 74
'
••
D
•
80
1--
~
80
~
Q)
~
I
-
wi
th
gas bliste
r
s
at
84
'
PUSH
+-
__
....._
--+
D
D
D.
.........
~
Q)
~
..__-
90
0
0
..::
m
Q)
(/)
1--
I
-platy,
w
i
t
h
ma
n
y sil
t p
ockets, partings
,
and seams,
PUSH
D
~
and a few
I
igh
t
g
r
ay bands at 9
4'
•
~
•
I
V
90
.....:-
0
0
,.:=
m
Q)
(/)
3:
10
0
0
<ii
en
c
0
:;:::;
m
11
0
'--
a>
c
Q)
0..
-
~.
-wit
h
gas blis
t
e
r
s be
l
ow 103
'
1(2.52
104.5
).\.~
-
s
i
lt
l
ayer at 104
'
PUSH
-I
-'8-
-C:::
-
-
+
A
-----
•
-
I
-with
a
few
si
lt
pockets,
115
'
to
125'
PUSH
•
§
.....
~$$(~
100
3:
cu
0
en
c
0
:;:::;
1
1
0
cu
'--
-
Q)
c
Q)
0..
-mott
l
ed
w
i
th brown, wit
h
calca
r
eo
u
s
n
odules
at 1
1
5'
12
0
-
120
I
-
b
r
own,
m
ottled
wit
h
g
r
ay,
1
23'
t
o
130'
PUSH
(~
-
with a few sil
t
seams at
124
'
+
___.._
--
+
D
D
!:::.
®
'ii
-
w
it
h a few ca
l
ca
r
eous
n
odules at 129'
1--
-b~d expansive a
t 1
30
_
'
__
____{)
~
PUSH
h
---
-
~
~
~
-
,___
---
,------
- t----
---
~
----+
-
130
130
1
4
0
-
140
1
50
-
150
160
1--
160
1
7
0
-
170
180
-
180
190
-
190
200
SAMPLING
TE
CH
N
IQUES
CLASSIF
I
CATION TESTS
STR
E
NGTH TESTS
200
Number of
blows
ofa 175
-
lb
weight (
h
amme
r
)
dropped approximate
ly
5
ft
to
produce a
T
SOLUB
ILITY
IN
H
CL,
1
%]
®
POCKET PENETROMETER
(PP)
maximum
of 24
i
n
.
of penetration of a
2.25
-
in.-OD,
2.125-in.-lD thin-walled tube
•
PERCENT PASSING -200
S
I
EVE,
(
%]
~
TORVANE (TV}
sampler
.
"PUSH
"
denotes a
3.0
0-i
n.-OD, 2.83-in
.
-lD
thin-walled tube sample
r
was
•
WATER
CON
T
ENT
(:IV),
(
%]
<l>
REMOTE
VANE
(RV)
advanced
24 in
.
with the
weight
of the drill string
.
"WOH"
denotes
a 2.50-in.
-
OD,
D
SUBMERGED
UNIT
WE
I
GHT (SUW)
•
M
I
NIATURE VANE
(
MV) (~ RES
I
DUAL (MVres) VALUE)
2.125-in
.
-lD
l
iner
sampler
was
advanced 24
i
n
.
with
the
weight
of the
hammer.
A
UNCONSOLIDATED
UNDRAINED TRIAXI
A
L
(UU)
PLASTIC
LI
M
I
T (PL)
LI
QU
I
D LIMIT
(LL)
+
--
--
----
--------
--
-
---
+
(Open symbols indica1e remolded (r) tests)
LOG OF BO
R
ING AND TE
ST
RE
SU
LT
S
Texas O
f
fshore Po
rt
Sys
t
e
m
, SPM #2
A
nchor Leg #6
Block A
-
59, Ga
l
ves
t
o
n
A
r
ea
I
@
I
~
~
L..-
0
0
ti=
C\l
Q)
U)
a,
~
co
c
e
-
.
Q
Q)
c
(ll
0..
--
Chee
--
tf-W-
Approved
By:
# Co
--
,
nB
y:
--
-To,..,,
--
:
'if/
.,.._.
.../
~",
X
=
3,266,758'
Y
=
241,331'
Texas
South Central
Zone Coordinates
SEAFLOOR
AT
EL. -124'
BLOW
COUNT
20
IDENTIFICATION
TESTS,[%]
40
60
80
I
I
SUBMERGED
UNIT
WEIGHT,
[k
c
f]
I
•
UNDRA
IN
ED
SHEAR STRENGTH
[ksf]
0.2
0.4
0.6
0.8
<>~
~
•
O --~1
SOFT
TO
FIRM
GRAY
CLAY
~~
-
with many shell
fragments
at
mud
lin
e
~:..,
-lean to 9'
WOH
0.03
0.04
0.05
0
.
06
,..~
+-->---~.
I
-with
silt pockets to 8'
'//,
'./'
-with shell f
ragme
nts
at 1'
5
'-
~
-with
a few shell fragments and
pockets
of organic
~I
.:
i~
~::1'i~~~!~
at4.
$ ..
~
..
WO
H
~-.....
10
15
20
25
30
35
I~
-
~I
-w
i
th shell
fragments at 10'
I
1~"'....,,.,,..,
....."""
"
-s
a
ndy
and lean, with
many
shells and shell
:~1
fragments below 16'
117
.
0'l
.
m
I
-silty.
with shell
fragments
to 19.
_
-with mica
below 19'
MEDIUM
DENSE GRAY FINE SAND
~.11
,7-;
~~
..~--
t.l
I
ll~
-~
~
-with
a
trace
of medium sand
and many
shell
fragments
at 24'
FIRM TO
STIFF GRAY LEAN CLAY
-with
a
few
shell
fragments
to 35'
-sandy
silty
clay
to
30'
-sandy at 33'
-lean
below
34'
-with
a few wood fragments at
34'
(28.0
'
)
WOH
5
10
10
10
20
15
PUSH
PUSH
+-----
--.
DD
<>
~
1
.$
-
0
-~
~
<>
$
•
+- _____
,..._y__
--+
D
------ ---------->--+
•
[
.
D
--
NP•
•
D
Note
:
NP - Non-plastic material
I
-
-
[D
-
-
...•
-
D
D
-
+-
--
D
.i>
~.
40 ~.L.o::.4....J......~
~
~~~~~~~~~~__,J~~~l-~~..i.....~~-'-
~
~-'-~~......i.~~~i--~~..i.....~~....i...~~.......
~~-'-~~
......
SAMPLING
TECHNIQUES
CLASSIFICATION
TESTS
STRENGTH
TESTS
Nu
m
ber of blows of a
175-lb
weight (hammer) dropped approximately 5 fl to produce
a
Y
SOLUB
I
LITY
IN HCL,
[%]
®
POCKET
PENETROMETER (PP)
max
im
um of 24
in
.
of penetration of a 2.25-in
.-
OD, 2.125-in.-lD th
i
n
-
walled tube
•
PERCENT
PASSING -200 SIEVE,[%]
~
TORVANE (TV)
sampler.
"PUS
H"
denotes a 3.00-in.-OD.
2.83-i
n.-lD
thin-walled
tube
sampler was
e
WATER CONTENT
(:N),
[%]
<l>
REMOTE
VANE
(RV)
advanced
24
in. Y<ilh
the weight of the
drill
string
.
"WOH" denotes a 2.50-in.-OD,
0
SUBMERGED
UNIT WEIGHT
(SUW)
+ MINIATURE VANE (MV) (~ RESIDUAL
(MVres)
VALUE)
2.125-in.-lD liner
sam
pler
was advanced 24 in. Y<ith the weight
of
the hammer.
& UNCONSOLIDATED UNDRA
I
NED TRIAXIAL (
UU
)
PLASTIC LIMIT (PL)
.
LIQUID
LIMIT
(LL)
+
-
-------
-
---
---------+
LOG OF BORING AND TEST RESULTS
Texas Offshore Port System, SPM
#2 Anchor
Leg
#6
Block
A-59,
Galveston Area
(Open
symbols
i
ndicale
remolded
(
r)
tests)
0
5
10
15
25
30
35
40
~
,
~
L..
0
0
ti=
C\l
(!)
(/)
~
(!)
co
c
0
~
......
-
Q)
c
(!)
0..
I
l
it
s
Offset:
0.11
22000
,,_
j
i,~:
{
.
i
'
..
-
~
-
~
"
t
~
' .~
'.
~\i!it{\:;
.
::::
.
l
,
,
CLASSI
F
ICATION
TEST
S
T
SOLUBIL
ITY lN HCl.
r,,j
•
?ERCENT
F~S
.
SING .200
S
I
EVE.
{l,
J
u
•
SU3
'
l\!A'7CR
ME:'<.GED
CONTeta
UNIT
~.}~
WEJ.3
r~
HT
1
(
!lU
W)
PUS
Tf
C
UMIT
{
?l
}
----------------------+
t10W
O LfM
f
T
(
U
..
~
(),""";
Report No. 0201-6505
-~21
"\
.
:
~
~
,,
!
_;__
-
~\
@
POCht;T F:N:.mot\.i
,
ETi;R (P?~
'I'
IO
RVAME
(TV
)
¢
REMOTE
VANE
(
RV)
22500
+
M
l
NIATIJP.:
VAN?: (M\I)
lo&
P.aSIDUAl
(Ml/!"i VALUE
}
.&.
IJNCONSOL
I
PAT:;o
L
1
NP
RA
1
N:i0
7PJAX
f
AL
(Ll"J..
l
j
1-
'
lfFGAAYCU:
1'tl
..
blillnN1,-•fm'Ar.d
_
...
...,.....it.,INt.f'IFJ1.._71
D
.,
.....,,aft~pd'0'.'"4-•14'
....
~o41111w.\,
l,,.-
..
p:.di,o,.11S''-12S'
..._
_
_
_
•11~
«.l.
11Cdtd1'tll~U:,11
1)11
...
h
....
_....tJ4'
..iti
•
'"~""'"-•12r
~~~!<l'.F-....JJ
..
-I'
Oa
....
+-
-...#+
•
a
....
..-+
----
-40--
.
+
•
+
--
4-
---+
ca
,.
t#
~
,.
"
,.
,.
...
•..
./
<r
r/
1
~
-
b
_
t
.~
'...
.
GEOP
H
YSICAL AND GEOTECHNICAL INTEGRATION
Texas Offshore Port System, SPM #2 Anchor
L
eg #6
Block A-59
,
Galveston Area
Portion of Subbottom Profiler
Line
2013
N
I
.•
~~
~
..
,
I
..
;
..
_,"\'.
,
-'.'1'.{
"
i
':~~
Jr
llJ!
i
;L1
'
.<'
-
.
}(
,
;
:}
#'.
(t
.
;
'
i-
t
'
PLATE
3-35
.050
.060
.Q70
.080
.090
.
100
.110
.120
I
\
~
I
~
~
..
I
0
1
I
c
~
0
~
,.....,
.....
Q)
~
...:
I
0
0
c.:::
C\l
Q)
(/)
~
ca
m
0
c
0
:;::;
~
.....
Q)
c
Q)
a..
~:{
)
41
z'1:
.;
1ii
.;
1ii
D
D
~
£
,)
~
>,
>,
en
ro
..,
..,
Q)
~
;,<
e
0
Q)
a.
.c
a.
(.)
<{
I
0.0
0
20
40
60
80
100
120
140
--
S
h
ea
r
Strengt
h
Profi
l
e, [ksf]
0
.5
1
.
0
1
.
5
2
.0
------
--
---
~
= 25°,
o
=
0°, Nq =
1
2.0, fm
x
= 1.4 ks
f
,
Qma
x
60 ksf
II
--
--
---
Ill
--
--
---
IV
Note
:
Roman
numerals refer
t
o the
stratigraphy
as
des
c
ribe
d i
n
t
h
e
t
ext
and
on
the boring log
.
----------------
-----
DESIGN STRENGTH PARAMETERS
Texas Offshore Port System, SPM #2 Anchor
Leg
#6
Block A
-
59, Galveston Area
I
Report
No
.
020
1
-6505
-
@
-----
2.5
PLATE
3
-36
-
-
--------
Submerged Unit Weight
,
[kcf]
0.00
0
0.02
0.04
0
.
06
0.08
0.10
20
40
!;j"
Q)
~
....
0
-
0
Ci=
ra
60
Q)
(/)
~
0
Q)
en
c
80
:.;::::;
0
~
.....
Q)
c
a..
Q)
l
~
~
100
-tL.
J)
~
~
~
I
cu
ni
~
0
0
120
~
!
.I
~
;.:.
;.:.
CD
CD
"O
"O
Q)
Cl)
.,
e
>
0
140
Cl)
a.
.c:
0.
t)
<{
1
v
I
<
r--...
----
----
--
-
-
-
--
II
----
I
----------------
Nole
:
Roman numeral
s
re
fer
to the
stratigraphy as
described in
the
te
xt an
d on the
boring
l
og.
I
Ill
-
-
--
~---
-
j
-----
----
'
t
IV
I
\
------
------
-~--
---
--
- -----
-
DESIGN
SUBMERGED
UNIT WEIGHT
Texas Offshore Port System, SPM #2 Anchor Leg #6
Block A
-
59, Galveston Area
I
Report
No
.
0201-6
5
05
-
@
PLATE
3-37
Unit
Skin Friction,
[ksf]
0.0
0
.5
1.0
1.5
.
2.0
2.5
o
....~-----,---------.,....------~---------,...------.....
~
Q)
~
L...-
0
0
~
60
Q)
(J)
~
0
Q)
Ill
II
Ill
§ 80
--~~~
~--+-~
~
~~~-1-~--'I.---~--+~~~~~-+-~~~
~
--
:..:.
-
e!
Q)
c
Q)
[l_
Notes:
1. Roman numera
l
s refer
to the
strat
i
gra
p
hy as
des
c
ribed in
the
text
and on
th
e
boring log
.
2. Tension and
compress
ion
c
urv
es
coincide.
IV
140
._______....________________________________
_
Report
No.
0201-6505
I-
@
-
-
UNIT
SKIN FRICTION
API RP 2A (2000) Method
Texas Offshore Port System, SPM #2 Anchor
Leg
#6
Block A-59, Galveston Area
PLATE 3-38
l
;
~
I
~
0
0
~
0
1
~
20
l
i
~
~
I
0
40
,.........
+-'
Q)
~
I...-
0
0
c;::
60
m
Q)
Cl)
~
0
en
Q)
c:
0
80
:,i:j
m
I...
+-'
Q)
c:
Q)
n.
1
i~
100
.
N~
~~
1
.;
..
0
.£
0
"'
~
120
!
[
i
;..:.
;..:.
m
m
l
'O
'O
.,
~
>
0
e
.c
.,
a.
140
(.)
<I:
\
_
@
Report No
.
0201-6505
Ultimate Axial Capacity, [kips]
500
1000
1500
2000
2500
-----
---
---
-
-
------
--
Note: Roman num
e
rals refer to the strat
i
graphy as
d
esc
ribed in the text and on the boring
log.
--
\
-----
---
ULTIMATE AXIAL CAPACITY
API RP
2A (2000) Method
42-in.-Diameter Driven Pipe Piles
---
II
---
Ill
---
IV
-----
Texas Offshore Port System, SPM #2 Anchor Leg #6
Block A-59, Galveston Area
PLATE 3-40
0
t
!
1
I
t
~
0
I
\,
;;,
<D
"C
QJ
-"
0
.c
QJ
0
;;,
<D
"C
QJ
>
[
c.
~
-
--- ------ --- - --
PENETRATION
BELOW
CURVE POINTS
MUDLINE
(feet)
1
2
3
4
5
0.0
t
0.00
0.00
0.00
0.00
0.00
z
0.00
0.07
0
.
13
0
.
24
0.34
1.0
t
0
.
00
0
.
04
0.06
0.09
0.11
z
0.00
0.07
0.13
0
.
24
0.34
8.0
t
0.00
0
.
07
0
.
11
0.17
0.20
z
0.00
0.07
0.13
0.24
0.34
10
.
0
t
0.00
0.07
0.12
0.18
0.22
z
0
.
00
0
.
07
0.13
0.24
0.34
14.0
t
0
.
00
0
.
09
0.14
0.22
0.26
z
0.00
0.07
0.13
0
.
24
0
.
34
17
.
0
t
0.00
0
.
10
0.16
0
.
24
0.29
z
0
.
00
0
.
07
0.13
0.24
0.34
17.0
t
0
.
00
0
.
22
0.22
z
0.00
0.10
42
.
00
28.0
t
0.00
0.42
0.42
z
0.00
0.10
42
.
00
28.0
t
0
.
00
0.14
0
.
24
0.36
0.43
z
0.00
0.07
0.13
0.24
0.34
63.0
t
0.00
0.28
0.46
0.70
0.83
z
0.00
O.D7
0
.
13
0.24
0.34
63.0
t
0.00
0.32
0.53
0.79
0.95
z
0
.
00
0
.
07
0.13
0.24
0.34
73.0
t
0.00
0.35
0.59
0.88
1.06
z
0.00
0.07
0.13
0.24
0.34
83.0
t
0
.
00
0.39
0.64
0.97
1.16
z
0.00
0.07
0.13
0.24
0.34
103.0
t
0.00
0.46
0
.7
6
1
.
14
1.37
z
0
.
00
0.07
0.13
0.24
0.34
123.0
t
0.00
0
.
53
0.88
1.32
1.58
z
0.00
0.07
0.13
0.24
0
.
34
131.0
t
0.00
0.55
0.92
1.38
1
.6
6
z
0
.
00
0
.
07
0
.
13
0.24
0.34
Notes:
1.
"t"
is
mobilized soil-pile adhesion, [ksf].
2.
"z"
is
axial pile displacement,
[in.]
.
3.
Data for tension and compression coincide.
AXIAL LOAD TRANSFER DATA
(T-Z DATA)
API RP
2A (2000) Method
42-in.-Diameter Driven Pipe Piles
6
0
.
00
0.42
0.12
0.42
0
.
22
0.42
0.24
0.42
0.29
0.42
0.33
0.42
0.48
0.42
0.93
0.42
1.06
0.42
1.17
0.42
1.29
0.42
1.52
0.42
1.75
0.42
1.85
0.42
I
Report No.
0201-6505
-
@
-
Texas Offshore Port System, SPM #2 Anchor Leg #6
Block A-59, Galveston Area
7
8
0.00
0.00
0.84
42
.
00
0
.
11
0.11
0.84
42.00
0.20
0.20
0
.
84
42.00
0.22
0
.
22
0.84
42
.
00
0.26
0
.
26
0.84
42
.
00
0.29
0.29
0
.
84
42.00
0.43
0.43
0.84
42.00
0.83
0.83
0.84
42.00
0.95
0.95
0
.
84
42.00
1
.06
1.06
0.84
42.00
1.16
1.16
0.84
42.00
1.37
1
.
37
0.84
42.00
1.58
1.58
0.84
42
.
00
1.66
1
.6
6
0.84
42.00
PLATE
3
-41
i
l.
~
r
t
;.:.
IIl
;.:.
IIl
"O
PENETRAT
I
ON
BELOW
MUDLINE
(feet)
63.0
74
.
0
131
.
0
1
Q
0
z
0
.
00
Q
0
z
0.00
Q
0
z
0
.
00
CURVE POINTS
2
3
4
5
6
22
43
65
78
87
0.08
0
.
55
1
.
76
3
.
07
4
.
20
31
61
92
110
122
0.08
0
.
55
1.76
3
.
07
4.20
43
87
130
156
173
0.08
0
.
55
1.76
3
.
07
4
.
20
"O
C1)
x
0
C1)
.c
C1)
e
>
a.
Notes: 1.
"Q"
is mobilized
end bea
r
ing capacity
,
[kips]
.
2. "z"
i
s
axial
tip
displacement, [in.].
(.)
<(
I
Report
No.
0201-6505
-
@
--
AX
I
AL LOAD TRANSFER DATA
(Q-Z DATA)
API
RP
2A (2000) Method
42-in.-Diameter Driven Pipe
Piles
Texas
Offshore Port System,
SPM #2 Anchor
Leg #6
B
lock
A-59, Galveston Area
7
87
42
.
00
122
42.00
173
42.00
PLATE
3-42
'be)
(
1
'fls
!
l
(
>,
"'
Cl
i
e
l
~
Seafloor~
r
Penetration
i
0
Soft tor
clay
Eso
=
2.0
%
17'
Medium dense
fine
sand
k =
20 pci
28'
E
50
=
1
.
5
%
at 28'
Firm to stiff lean clay
decreasing linearly to
E
50
= 1.0
%
at 63'
63' --
-
--
----
Stiff clay
E
50
=
1.0
%
100' -
-
-
-
-
-
-
-
-
Notes:
1. E
5
o is axial strain at half of peak deviator stress for cohesive soils.
2
.
Soil strength parameters are shown on Plate 3-36.
3.
Submerged unit
weight
profile is shown on Plate
3-37.
4. k is the modulus of horizontal subgrade reaction for granular
soils.
STRATIGRAPHY
AND PARAMETERS FOR P-Y DATA
Texas Offshore Port System, SPM #2 Anchor
Leg #6
Block A-59, Galveston Area
-
@
Report
No.
0201-6505
----.---___
PLATE
3-43
a
~
L
i
(
:ii
k
l
1
\
l
I
J
;:.
m
'O
.,
.c
""
.,
0
u
;:.
m
'O
.,
>
a.
0
<(
PENETRATION
BELOW
MUDLINE
(feet)
1
0
.
0
p
0
y
0.00
4
.
0
p
0
y
0.00
8.0
p
0
y
0
.
00
14
.
0
p
0
y
0.00
17.0
p
0
y
0.00
17.0
p
0
y
0
.
00
24.0
p
0
y
0
.
00
28.0
p
0
y
0.00
28.0
p
0
y
0.00
63.0
p
0
y
0
.
00
63.0
p
0
y
0.00
100.0
p
0
(and below)
y
0.00
Notes
:
1. "p" is soil resistance, [lb/in.]
.
2.
"y''
is lateral deflection, [in.).
CURVE POINTS
2
3
4
5
52
BO
119
175
0.06
0.21
0.63
2.10
76
117
173
254
0.06
0.21
0
.
63
2
.
10
102
156
231
340
0.06
0
.
21
0.63
2
.
10
143
219
323
475
0
.
06
0.21
0
.
63
2
.
10
164
252
372
548
0.06
0.21
0.63
2.10
484
806
1064
1338
0.12
0
.
22
0
.
31
0.47
976
1626
2146
2699
0.17
0.31
0.45
0.67
1329
2215
2924
3677
0
.
20
0.36
0
.
52
0.78
256
392
580
853
0.04
0
.
16
0.47
1
.
57
394
604
893
1313
0
.
03
0
.
10
0.31
1
.
05
512
785
1160
1706
0
.
03
0.10
0.31
1.05
662
1015
1500
2206
0.03
0
.
10
0.31
1
.
05
P
-
Y
DATA
(CYCLIC LOADING)
API RP
2A (2000) Method
42-in.-Diameter Driven Pipe Piles
6
252
6.30
366
6.30
490
6.30
684
6
.
30
789
6.30
1531
0
.
72
3089
1
.
03
4209
1
.
21
1228
4.72
1890
3.15
2457
3.15
3177
3
.
15
Texas Offshore Port System, SPM #2 Anchor Leg #6
Block A-59, Galveston Area
j
-
@
-
R
-
e
-
po
_
rt
_
N
_
o
_
.
0
_
2
_
0
_
1-
-
65
_
0
_
5
--~________
7
8
0
0
31
.
50
42
.
00
61
61
31.50
42.00
159
159
31
.
50
42.00
367
367
31
.
50
42.00
503
503
31.50
42.00
1596
1612
1.05
42.00
3220
3252
1.49
42
.
00
4386
4431
1
.
74
42.00
1228
42.00
1890
42.00
2457
42
.
00
3177
42
.
00
PLATE
3-44
I
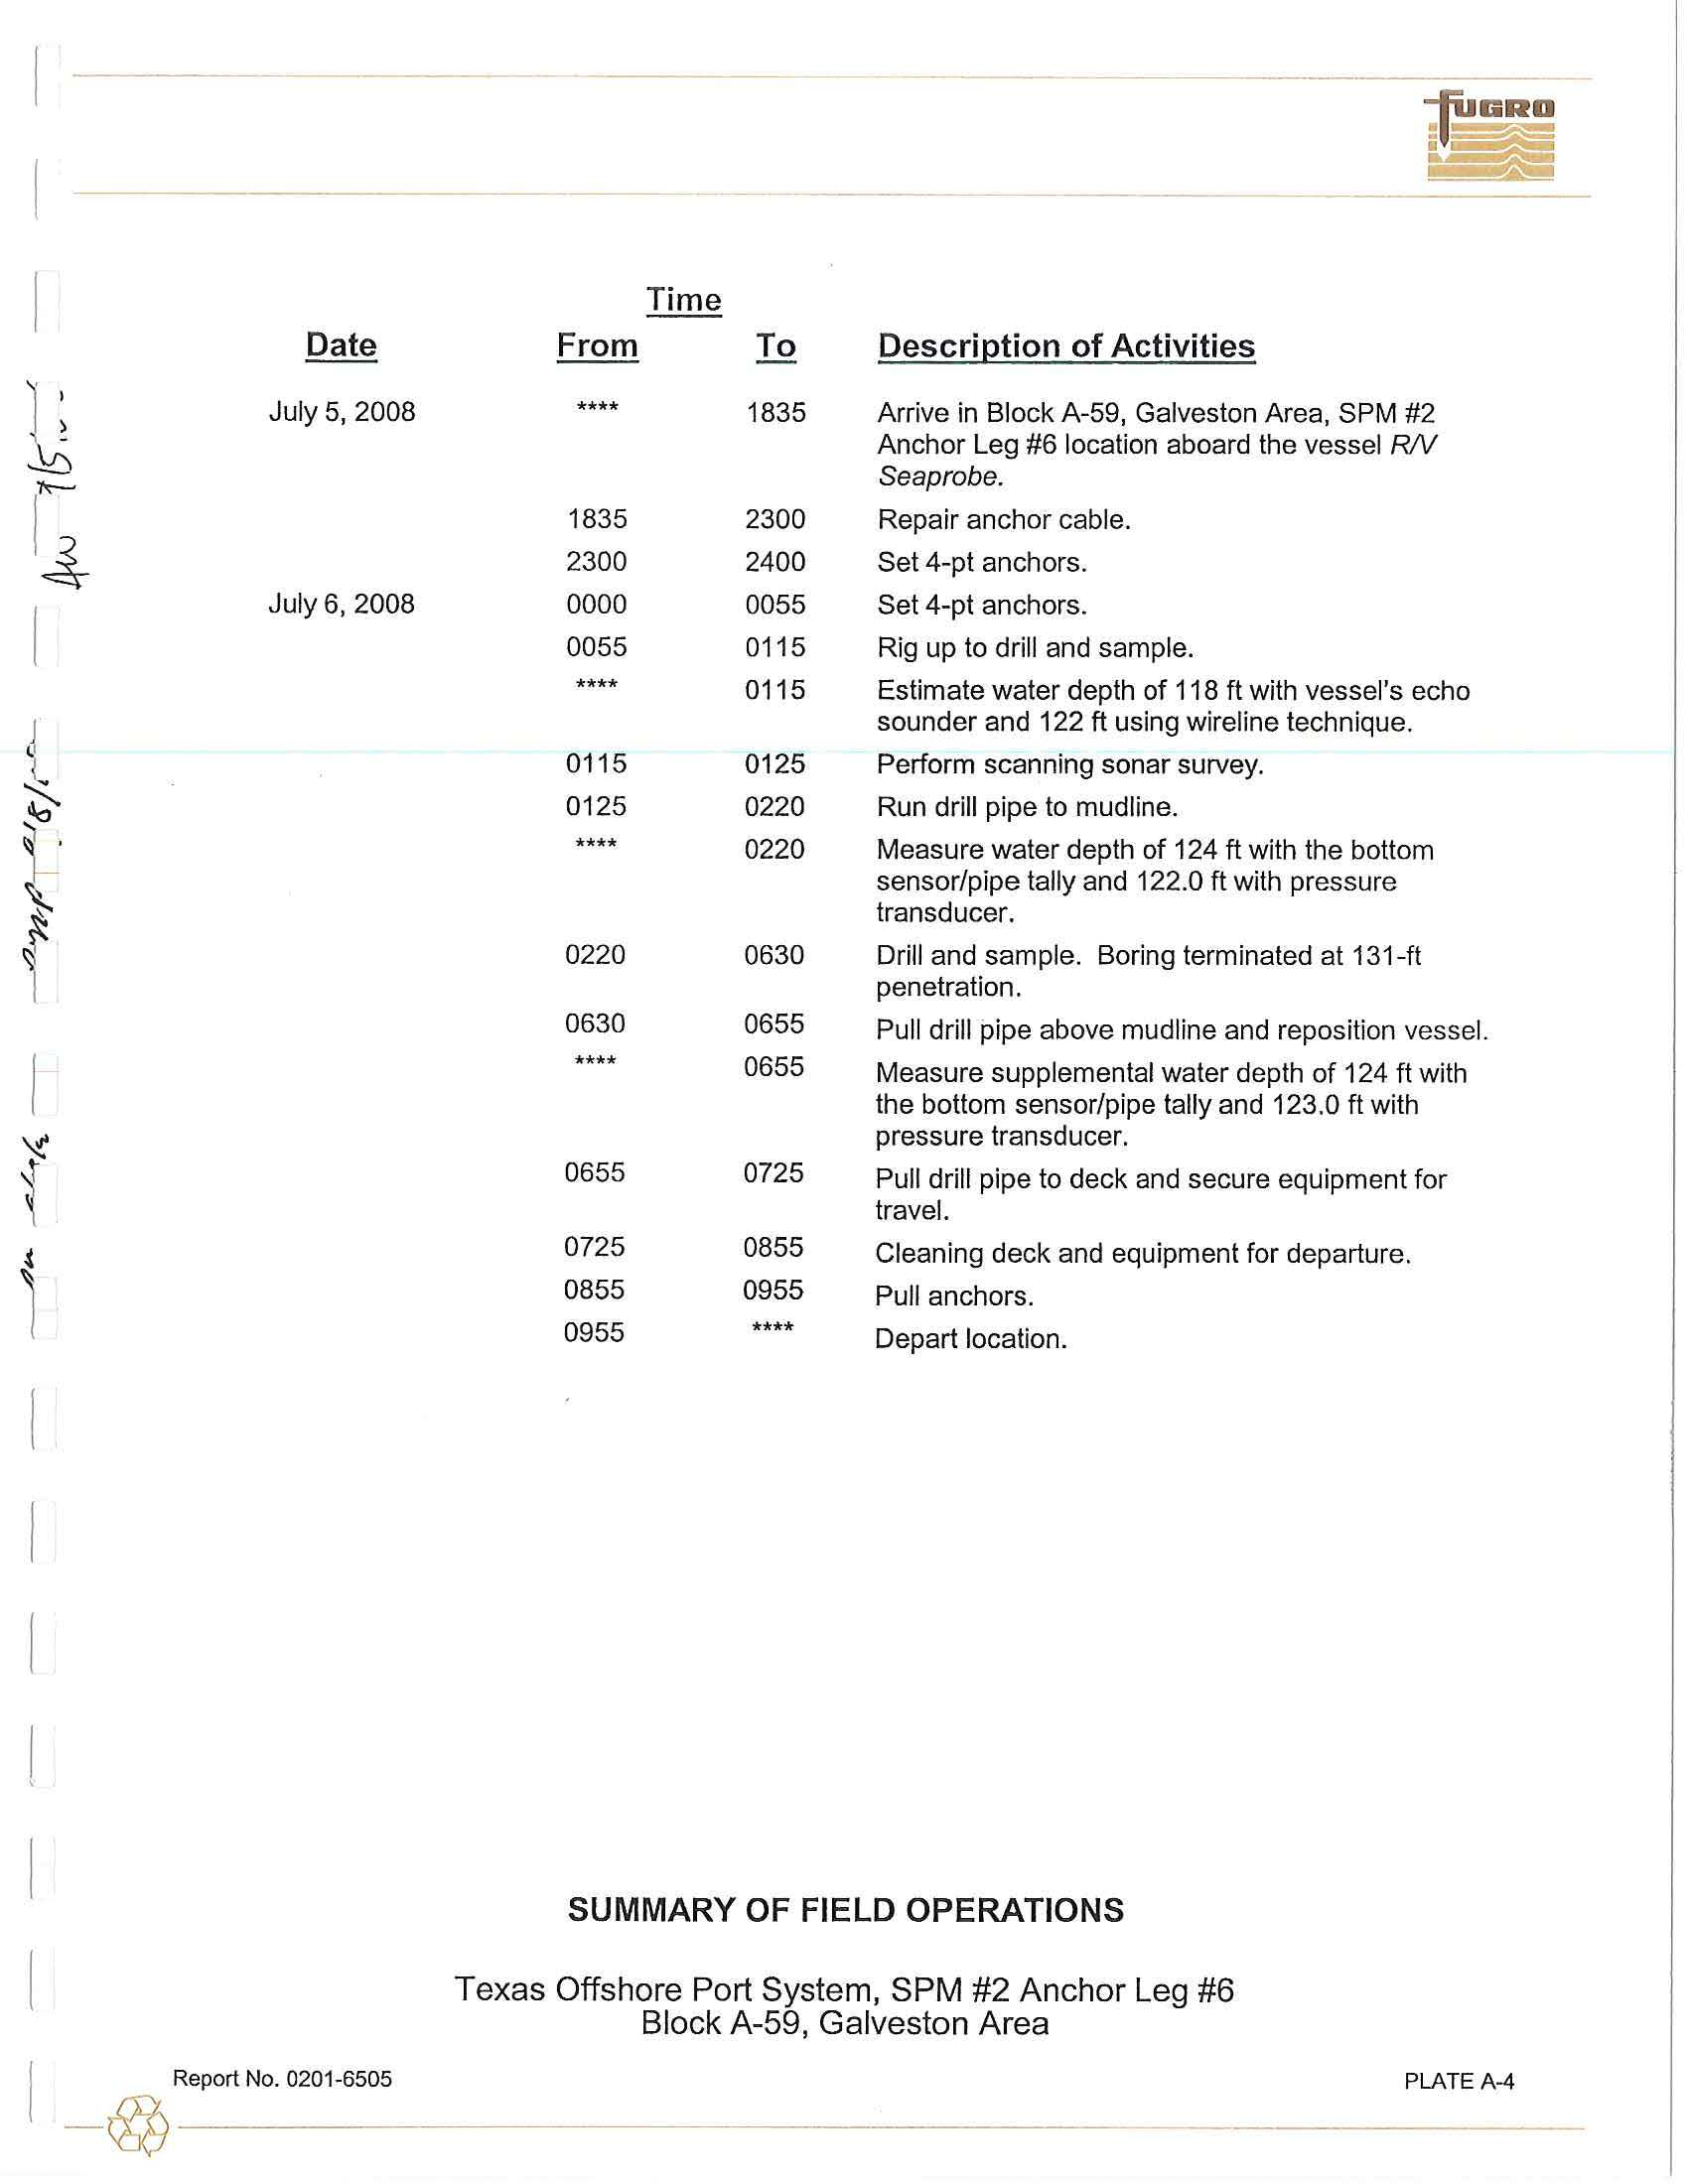
Date
l
July 5, 2008
I
~
~
[
July 6, 2008
~
~
,i.:,
\
~
~
i
t
Time
From
To
DescriQtion
of Activ
i
ties
****
1835
Arrive in
Block A-59, Galveston Area, SPM #2
Anchor Leg #6 location aboard the vessel
RN
Seaprobe
.
1835
2300
Repair anchor
cable.
2300
2400
Set 4-pt anchors
.
0000
0055
Set 4-pt anchors
.
0055
0115
Rig up to drill and sample.
****
0115
Estimate water depth of 118 ft with vessel's echo
sounder and 122 ft using wireline technique
.
0115
0125
Perform scanning sonar survey
.
0125
0220
Run drill pipe to mudline.
****
0220
Measure water depth of 124 ft with the bottom
sensor/pipe tally and 122.0
ft with pressure
transducer.
0220
0630
Drill and sample. Boring terminated at 131-ft
penetration
.
0630
0655
Pull drill pipe above mudline and reposition
vessel.
****
0655
Measure supplemental water depth of 124 ft with
the bottom sensor/pipe tally and 123
.
0 ft with
pressure transducer.
0655
0725
Pull drill pipe to
deck and secure equipment for
travel.
0725
0855
Cleaning deck and equipment for departure.
0855
0955
Pull anchors.
0955
****
Depart location.
SUMMARY OF FIELD OPERATIONS
Texas Offshore Port System, SPM #2 Anchor Leg #6
Block A-59, Galveston Area
PLATE
A-4
l
Report N
o.
0201-6505
-
@
---
I
@
:u
(1)
"Cl
0
;:::i.
z
~
0
N
~
CJ)
CJ1
0
CJ1
C
h
ecke
d
By
:
Date
:
Approved By
:
Date
:
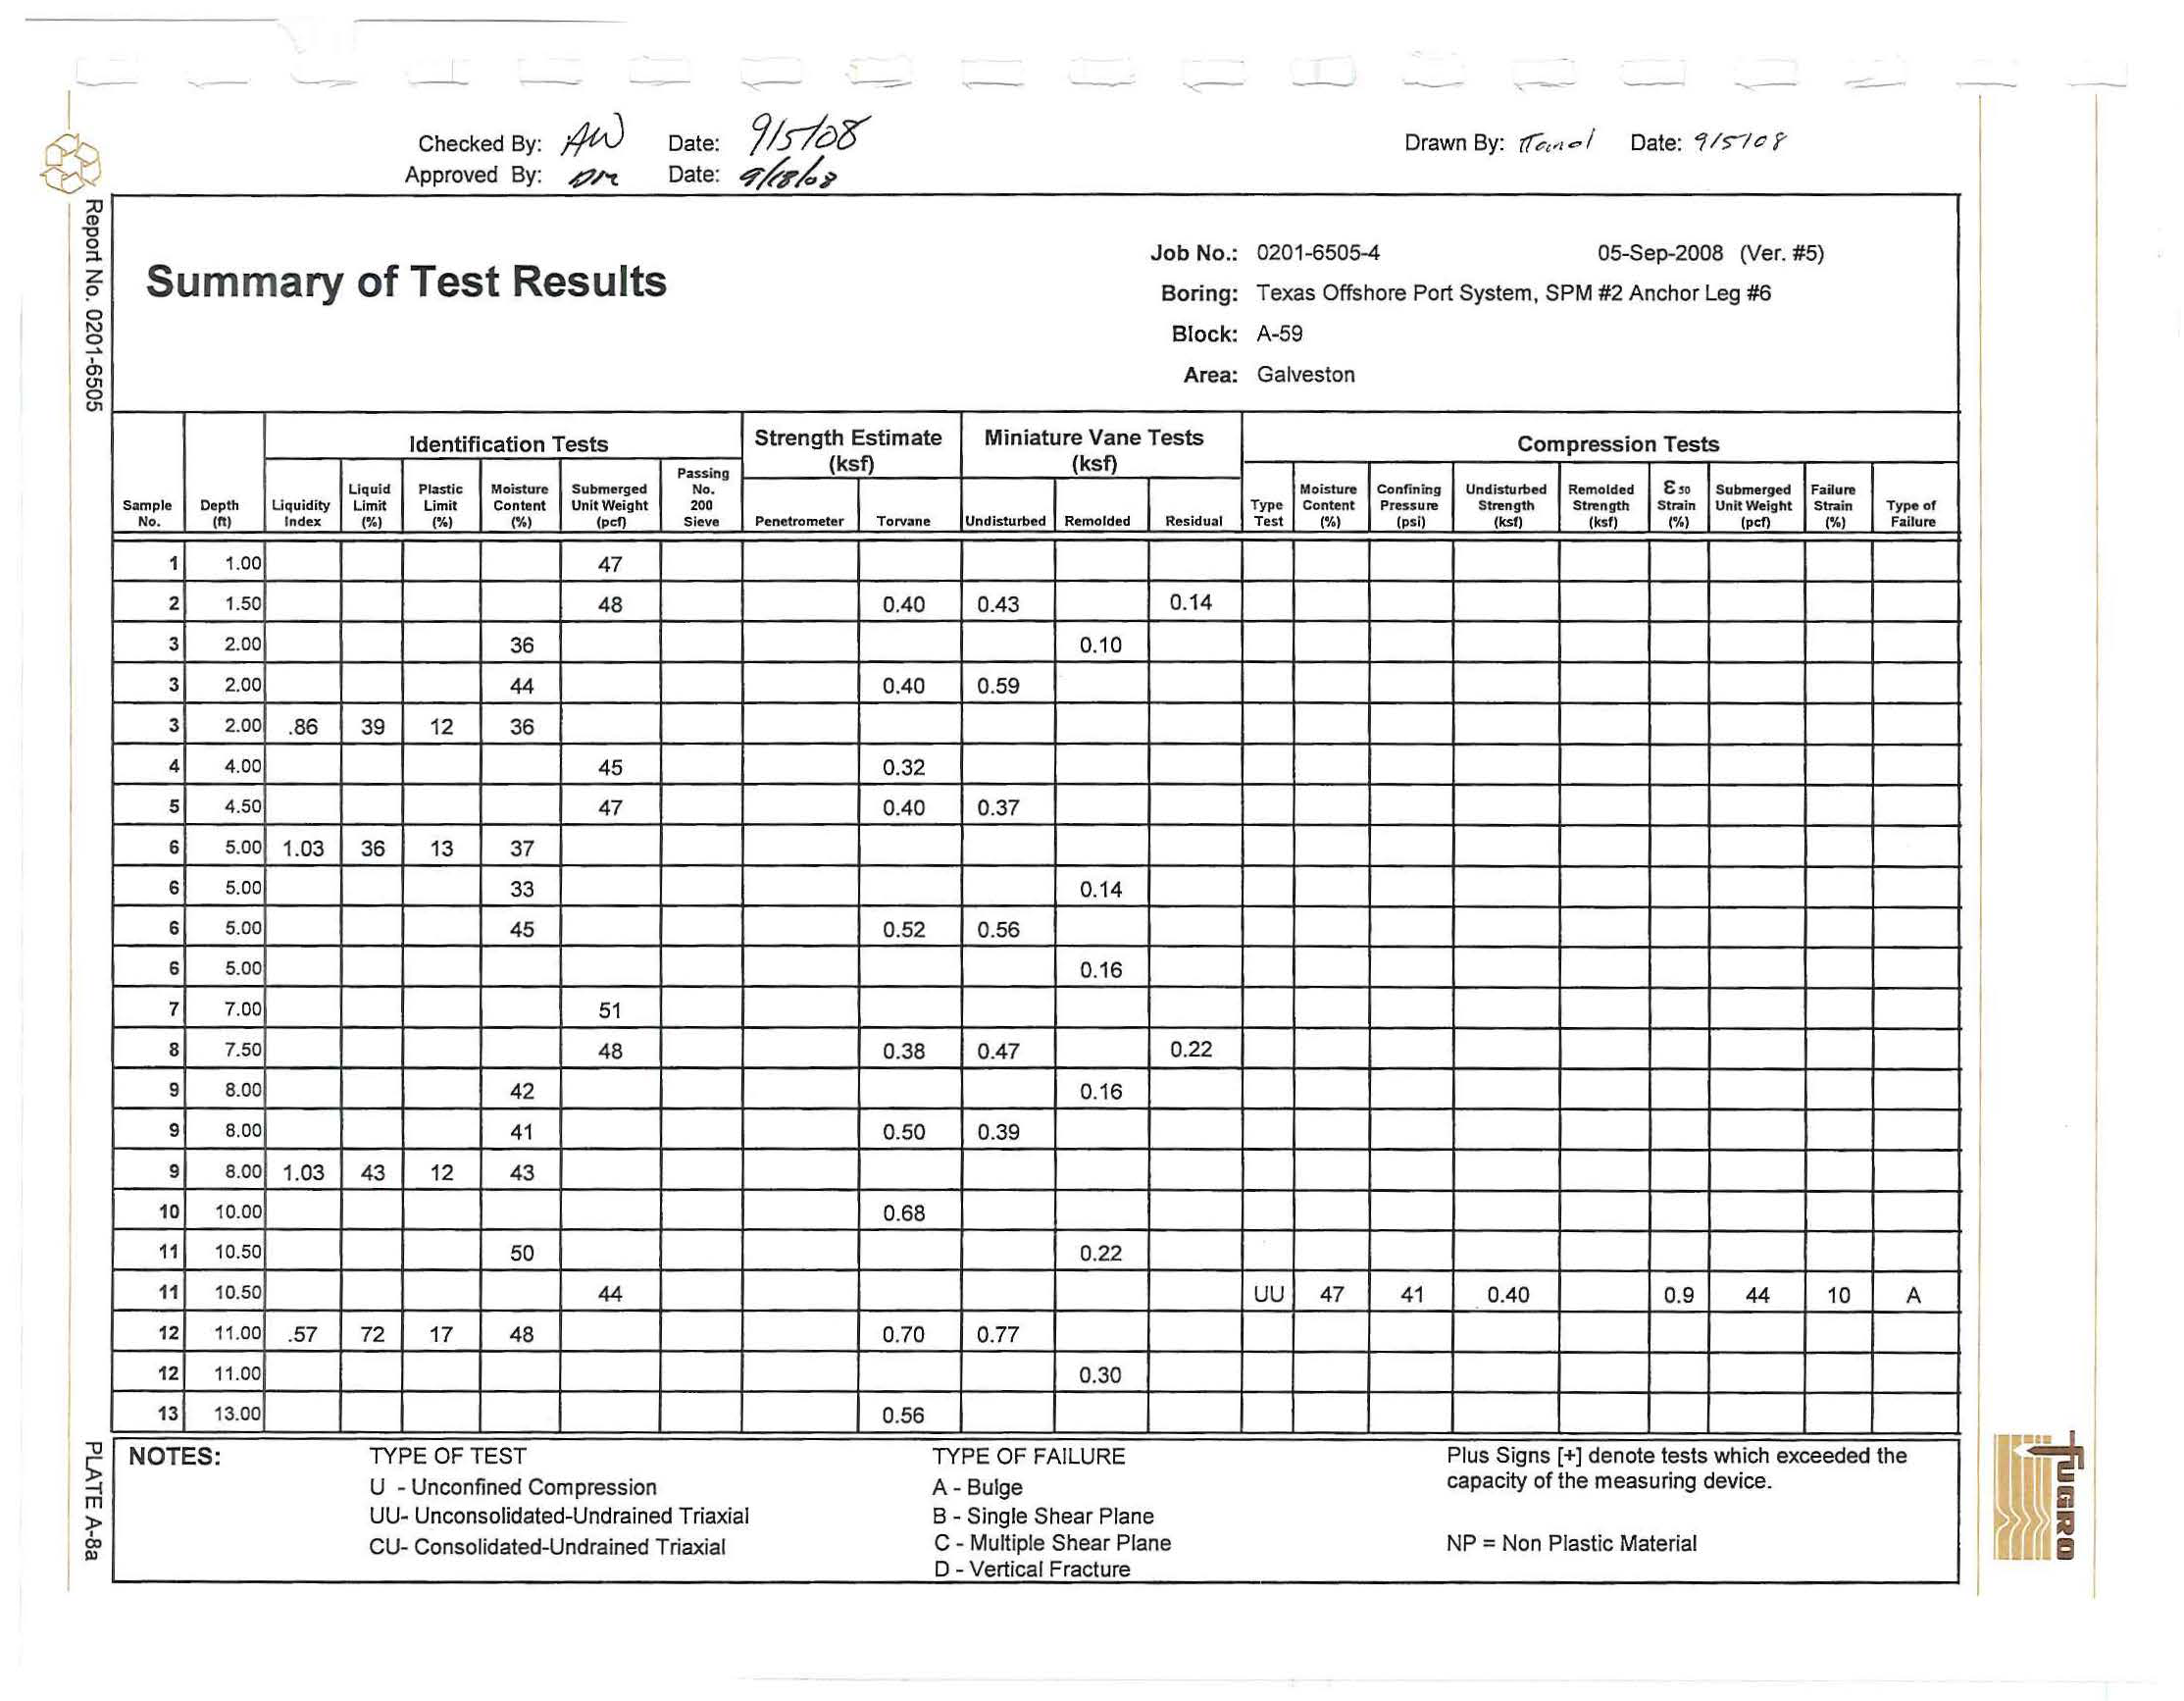
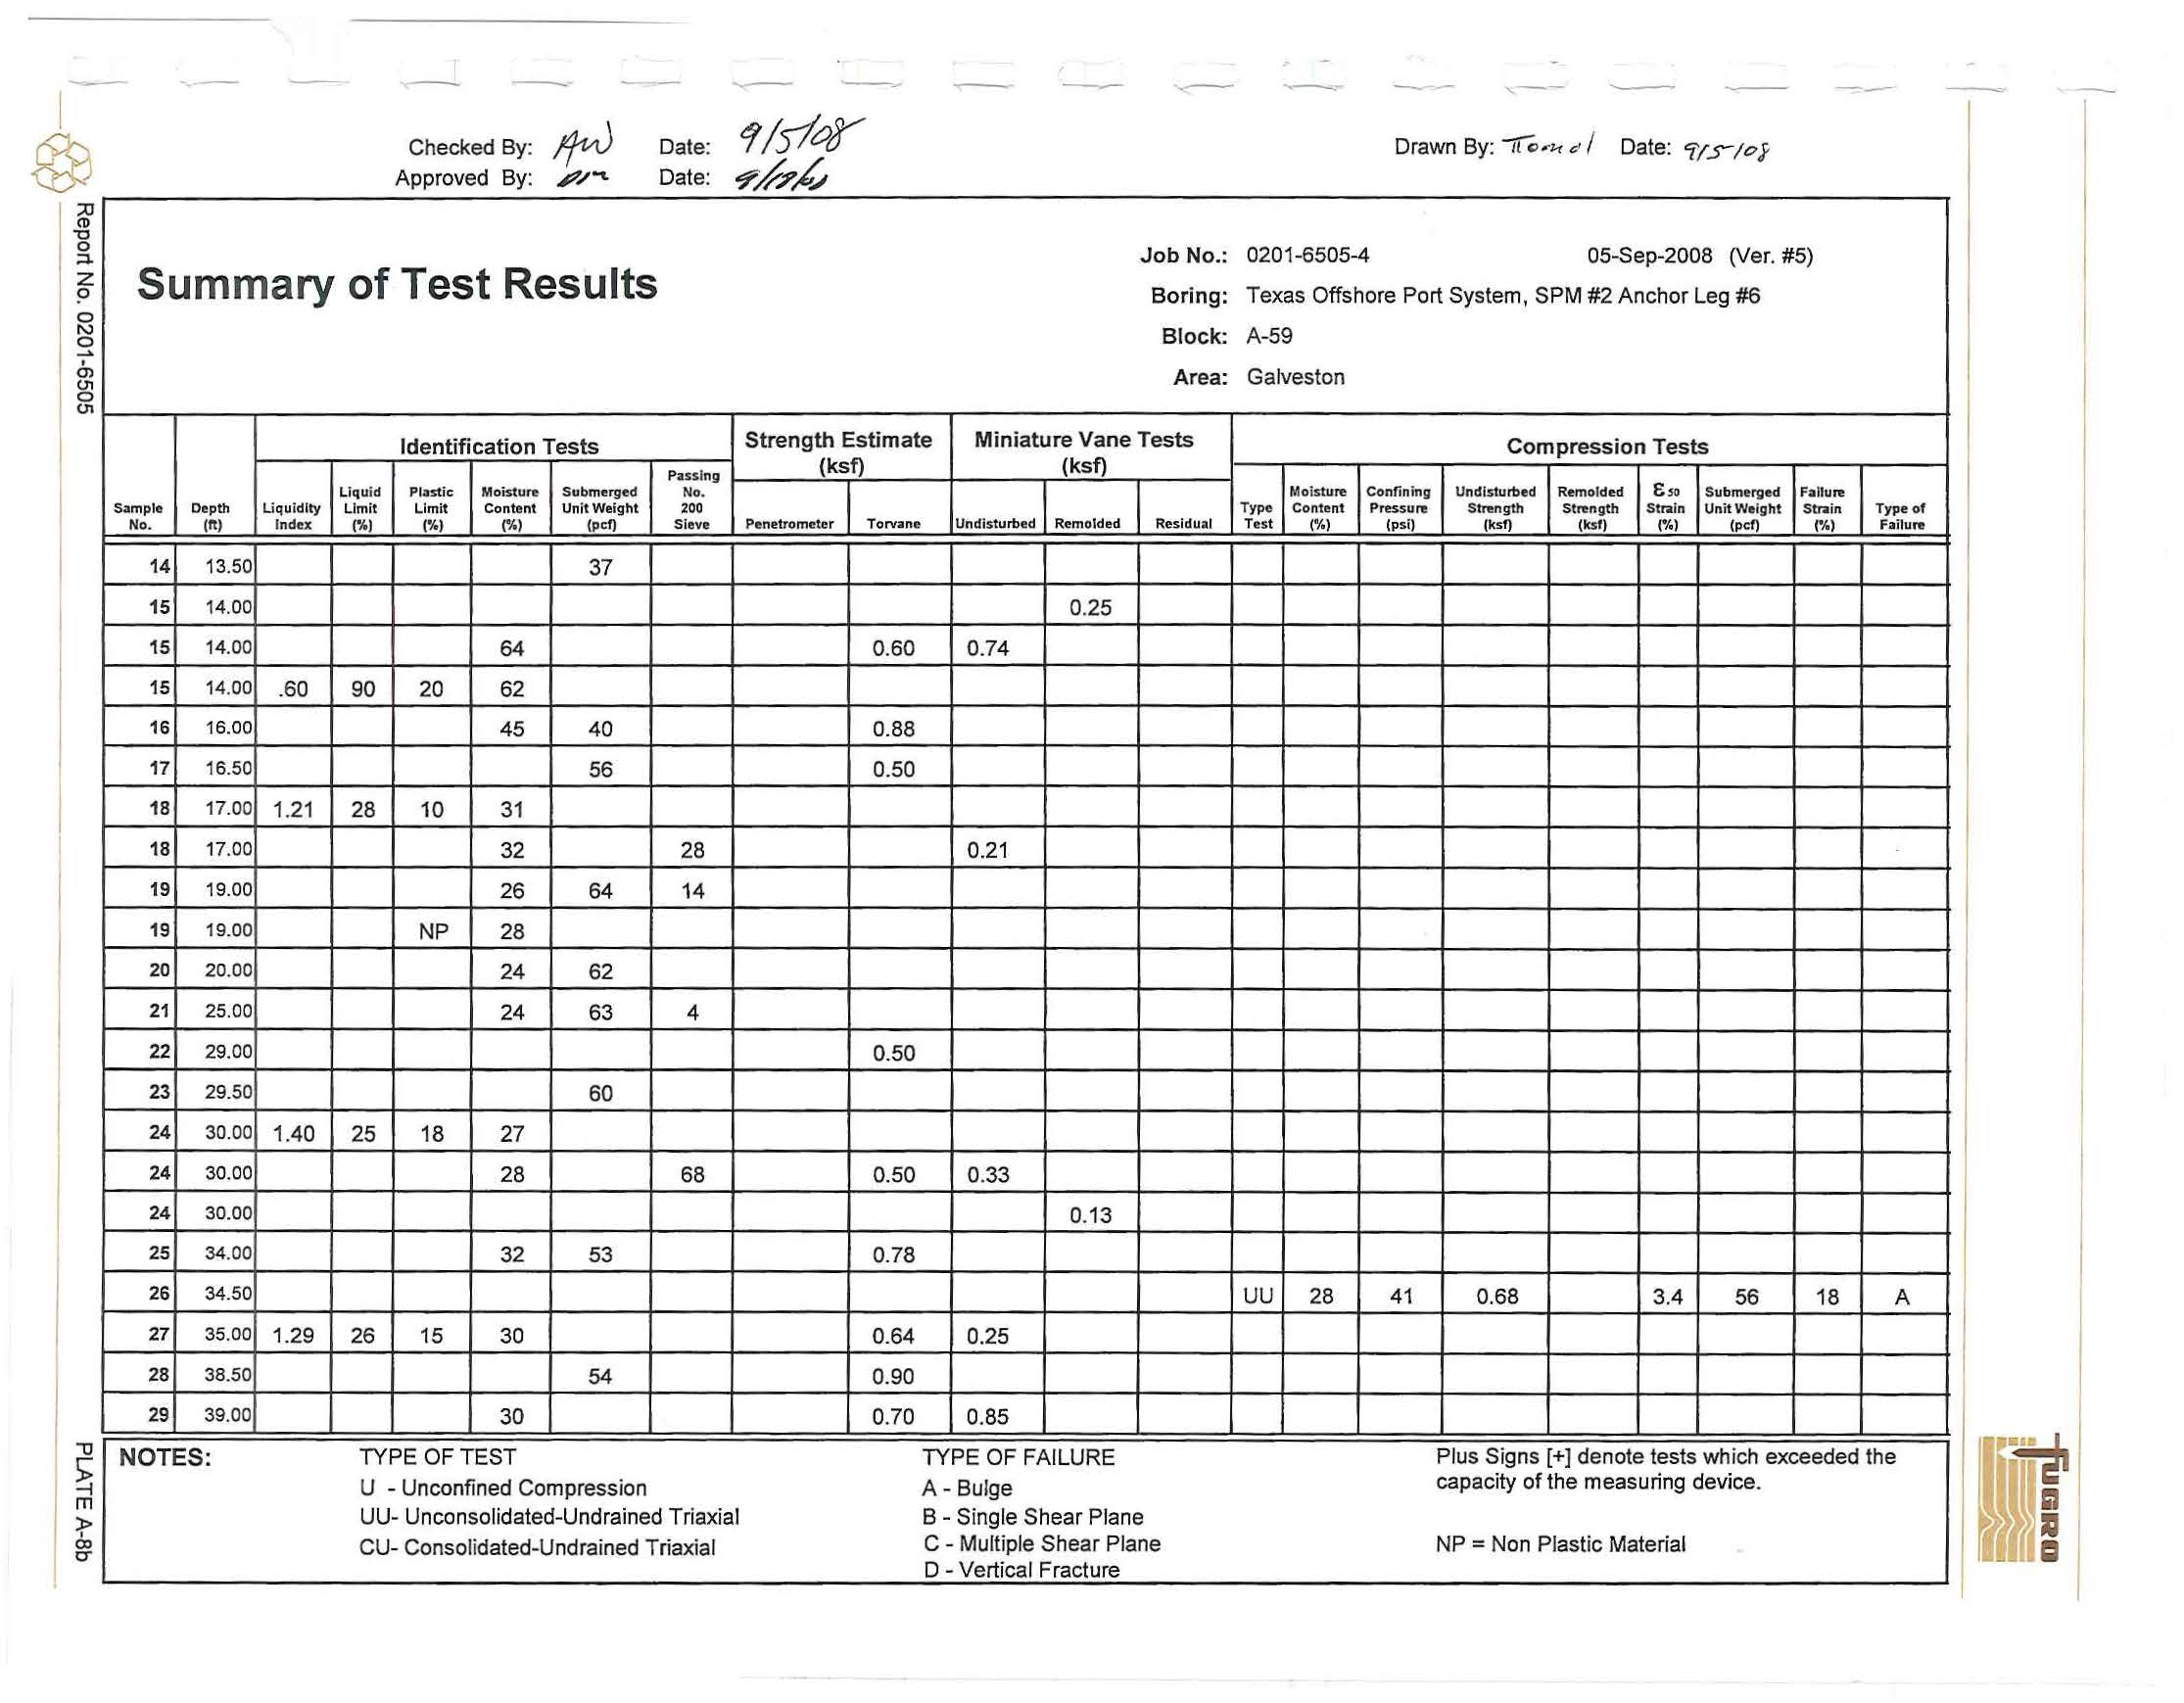
Summary of Test
Resu
lt
s
I
dentification Tests
Passing
Liqu
i
d
P~stle
Moistu
r
e
Subme
r
ged
No.
Samp
l
e
Depth
Liq
u
i
dity
Limit
Limi
t
Co
nt
e
nt
Unit Weight
200
No.
(ft>
I
ndex
(%)
(%1
rM
(pef)
Sieve
1
1.00
47
2
1.50
48
3
2.00
36
3
2.00
44
3
2.00
.
86
39
12
36
4
4.00
45
s
4.50
47
6
5.00
1.03
36
13
37
6
5.00
33
6
5.00
45
6
5.00
7
7
.00
51
8
7
.50
48
9
8.00
4
2
9
8.00
41
9
8.00
1.03
43
12
43
10
10.00
11
10.50
50
11
10.50
44
12
11
.
00
.
57
72
17
48
12
11.00
13
13.00
N
OTES
:
TYPE OFTEST
U
-
Unconfined
Compression
UU- U
n
conso
l
idated
-
Und
rain
ed
Tria
xi
al
CU
-
Consolidated-Undrained
Triaxia
l
----
Drawn By
:
rr;,,,,,
c
I
Date:
115"?0
f
Job No
.:
020
1
-6505-4
05-Sep-2008
0fer.
#5)
Boring
: Texas Offshore
Port
System, SPM
#2
Anchor
Leg
#6
Bloc
k:
A
-
59
Area:
Ga
l
veston
Strength
E
stimate
Minia
tu
re Vane T
e
sts
C
o
mpr
ession Tests
(k
s
f)
(k
sf)
Moistur9
Confining
Undisturbed
Remolded
e
,.
Submerged
Fail
u
re
Typo
Conte
nt
Pressu
~
St
~ngth
Stn!:ngth
St~
in
Unit Weight
Str.liT'I
Ty
pe of
Pe
n
etrometer
Torvane
Undi
sturbed
Remo(ded
Res
i
dua
l
T
est
(
%)
(psi)
(ksf>
(
ks
f
)
rM
(
pef)
1%1
Failure
0.40
0.43
0.14
0.10
0
.40
0
.
59
0.32
0.40
0.37
0.14
0
.5
2
0.56
0.16
0
.3
8
0.
4
7
0.22
0.16
0.50
0.39
0
.
68
0
.
22
uu
47
41
0.40
0.9
44
10
A
0
.
70
0.77
0.30
0.56
TY
PE
OF FAILURE
Plus
S
i
gns[+
]
denote tests
wh
i
ch exceeded the
A-
Bulge
capacity
of
the measuring
device
.
B
-
Single
S
hea
r
P
l
ane
C
-
Multiple Shear
Plane
N
P
=
Non
P
l
ast
ic
Materia
l
D
-
Ve
rtic
al
F
r
acture
I
@
;:o
(1)
"O
0
;:i.
z
~
0
N
~
&,
u,
0
u,
Checked By
:
!j-vt)
Approved By: ~,,
...
Date
:
Date:
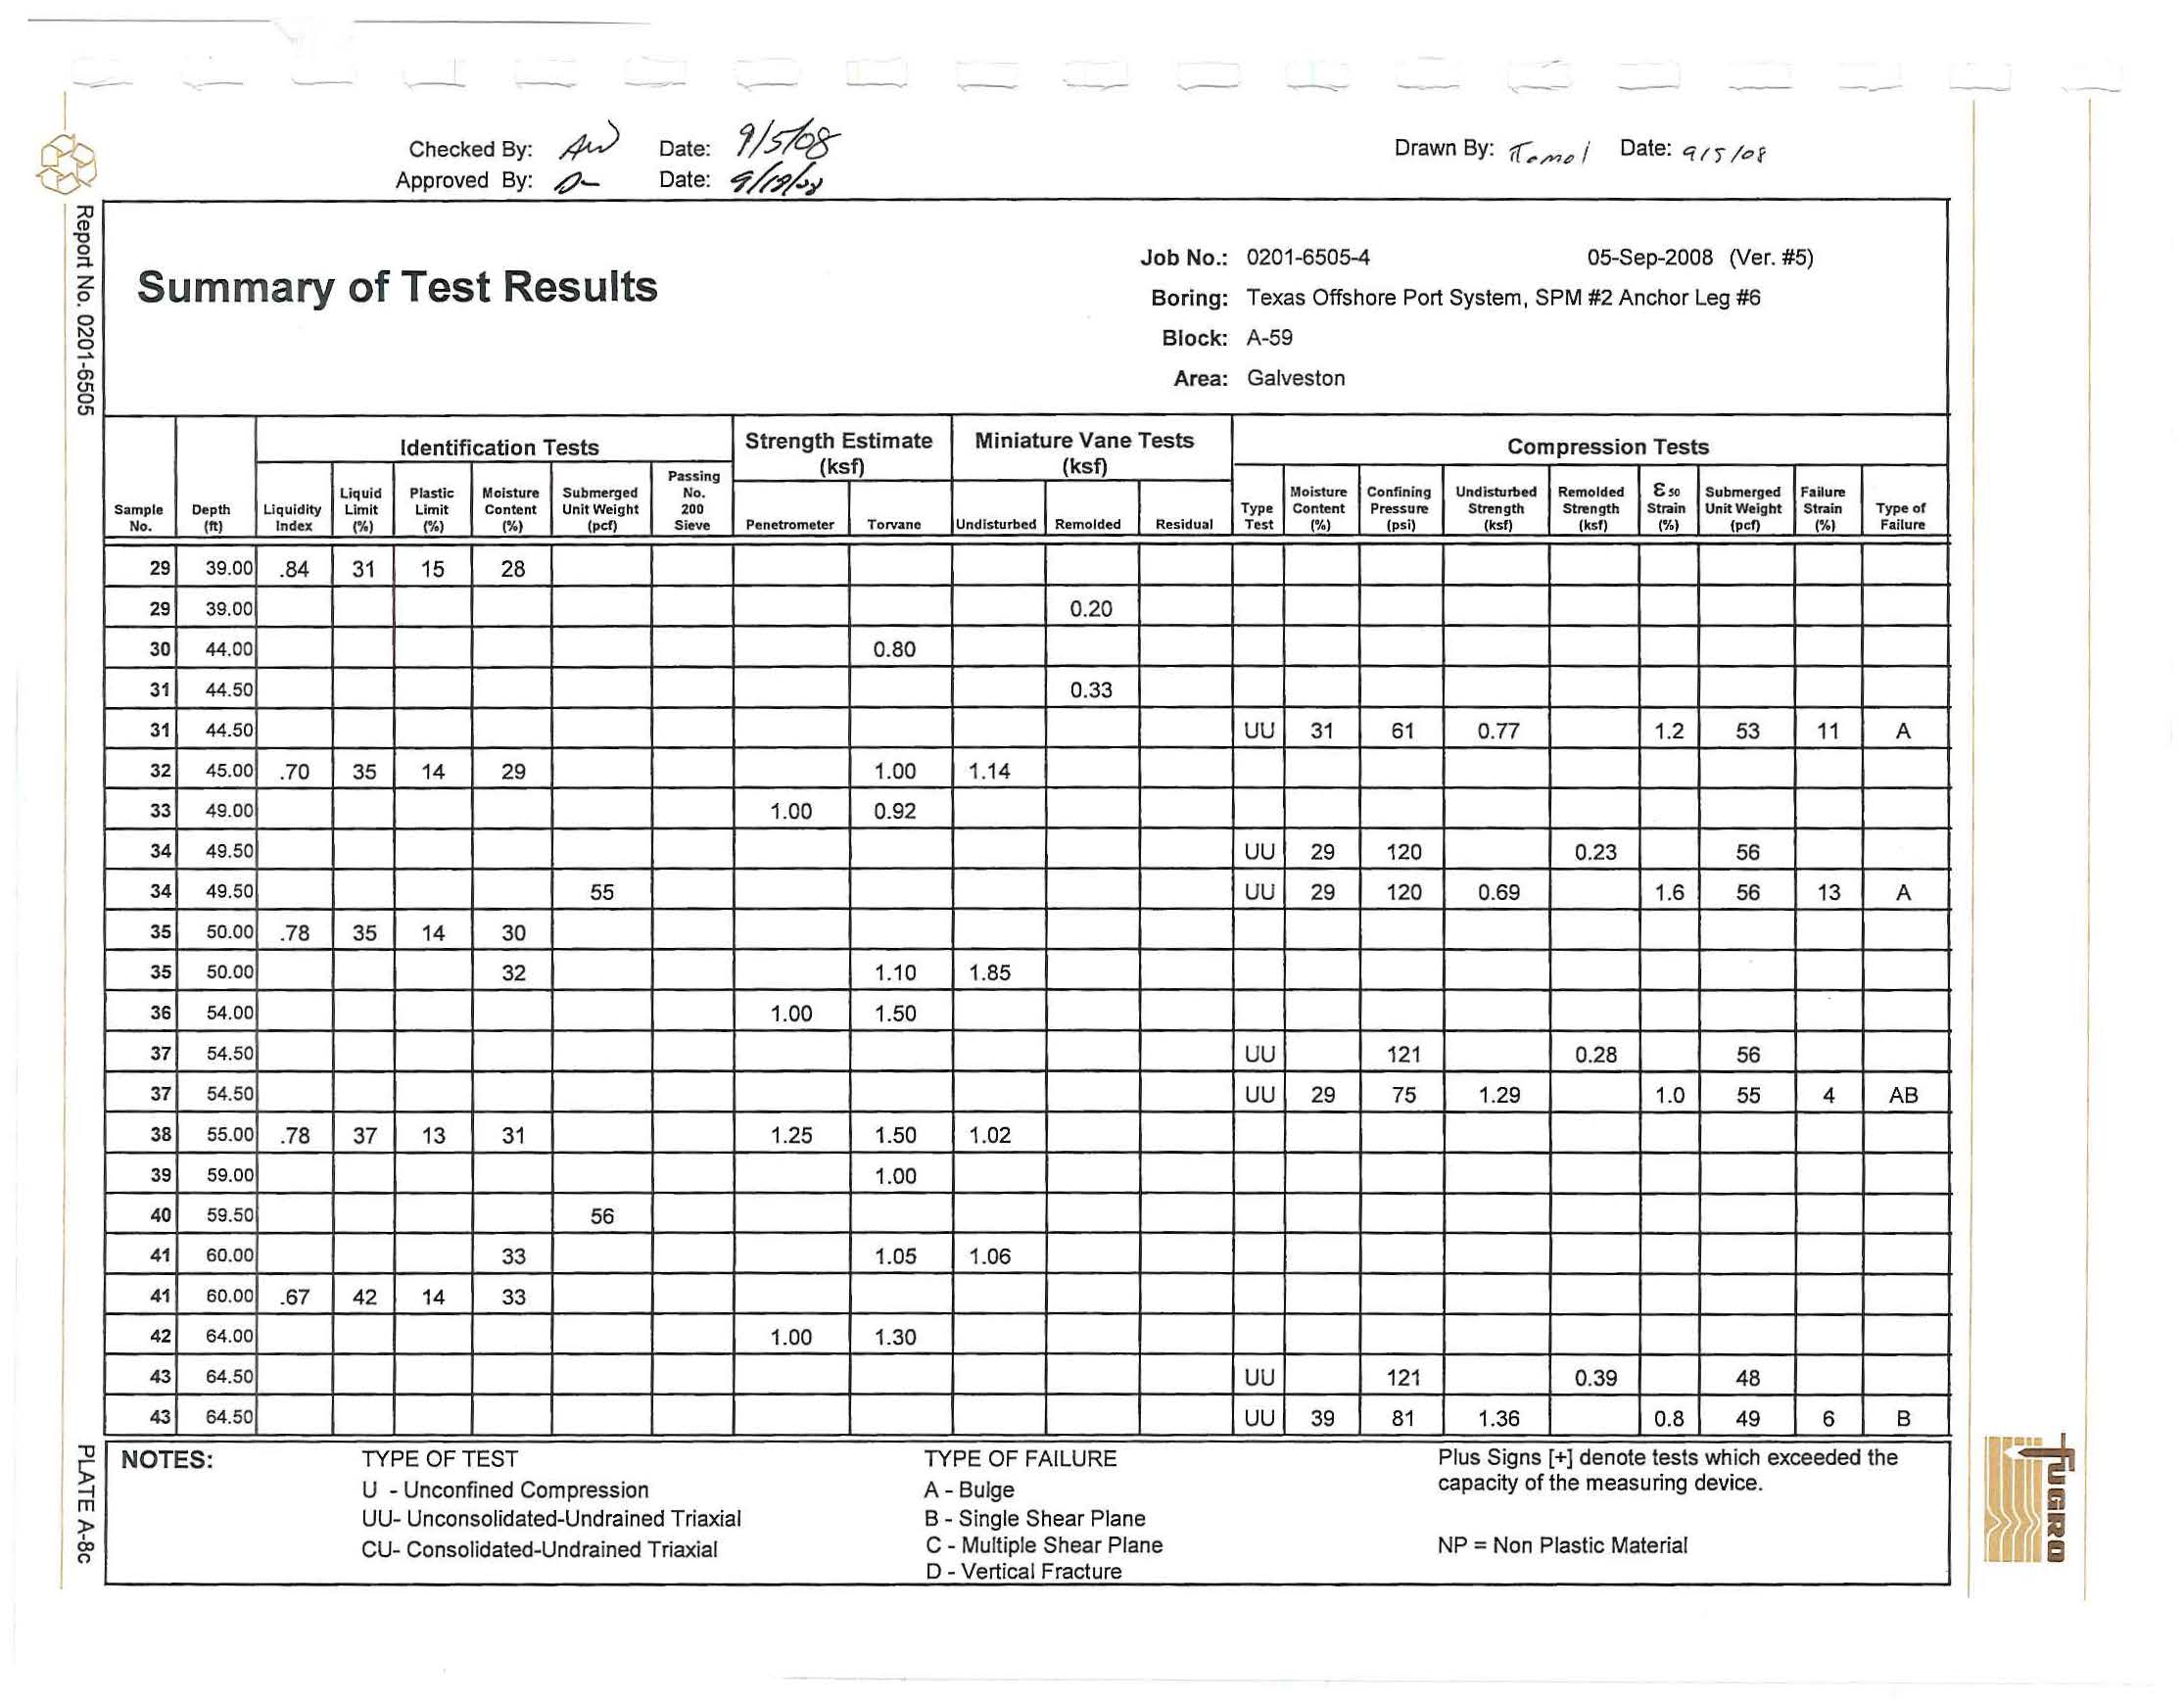
Summary of Test Results
Identification Tests
Pus
f
ng
L
iquid
Plastic
Moisture
Submerged
No
.
Sample
Depth
Liquidity
Limit
Limit
Content
Unit Weight
200
No.
{ft)
In
dex
('/,
)
(
'/,
)
('/,)
(pcO
Sieve
14
13
.5
0
37
15
14.00
15
14.00
64
15
14.00
.6
0
90
20
62
16
16.00
45
40
17
16.50
56
18
17.00
1.21
28
10
31
18
17
.
00
32
28
19
19.00
26
64
14
19
19.00
NP
28
20
20
.
00
24
62
21
25.00
24
63
4
22
29.00
23
29.50
60
24
30.00
1.40
25
18
27
24
30.00
28
68
24
30.00
25
34.00
32
53
26
34.50
27
35.00
1
.
29
26
15
30
28
38
.
50
54
29
39.00
30
NOTES
:
TYPE OFTEST
U
-
Unconfined Compression
UU
-
Unconsolidated-Undrained
Triaxia
l
CU- Consolidate
d-
Undra
ined
Triaxia
l
,
--
Drawn
By
:
f(Q.-:.,"'
I
Date:
'f(_s-/oj
Job No.:
0201-6505-4
05-Sep-2008 (Ver.
#5)
Boring:
Texas Offshore
Port
System, SPM #2 Anchor
Leg
#6
Block:
A-59
Area:
Galveston
Strength Estimate
Miniature
Vane Tests
Compression Tests
{ksf)
(ksf)
Mo
is
ture
Co
nfining
Undisturbed
Remolded
&,o
Submerged
Fa11ure
Type
Content
Pressure
Strength
Strength
Strain
Unit Weight
Strain
Type of
Penetrometer
Torvane
Undisturbed
Remolded
Residual
Test
(
'/,
)
(psi)
(ksO
{ksl)
('/,)
(Pc0
(',.)
Failure
0
.
25
0
.
60
0
.
74
0.88
0.50
0.21
0.50
0.50
0
.33
0
.
13
0.78
uu
28
41
0.68
3.4
56
18
A
0.64
0.25
0
.9
0
0
.
70
0.85
TYPE OF
FA
ILURE
Plu
s
S
ign
s
[+] denote
test
s
which exceeded the
A-
Bulge
capacity
of
the
measuring device.
B -
S
ingle
S
hear
Plane
C
- Multiple
Shear P
lan
e
NP
=
Non Plastic Material
D -Vertical Fracture
;;o
CD
"O
0
;:a.
z
?
2
~
I
~
t1l
Checked
By
:
Date
:
Approved
B
y:
Dat
e:
Summary of Test Results
I
dentification
Tests
P
assi
n
g
Liquid
Pl
ast
ic
Mois
t
ure
Submerged
No.
Sample
Depth
Li
quidity
L
imi
t
Limit
Content
Unit
Weight
200
No.
(ft)
lnde.x
r.4
J
rM
(
%
)
(p
cf)
Sieve
29
3
9
.00
.
84
31
15
28
29
39.00
30
44.00
3
1
44
.5
0
31
44.50
3
2
45.00
.70
35
14
29
33
49.00
34
49
.
50
34
49.50
5
5
35
50.00
.78
35
14
30
35
50.00
32
36
54.00
3
7
5
4
.50
37
54.50
38
55
.
00
.
78
37
13
31
39
59.00
40
59.50
56
41
6
0
.00
33
41
60.00
.67
42
14
33
42
64.00
43
64
.
50
43
64
.50
NOTE
S
:
TYPE
OF
T
EST
U
-
Unconfined
Comp
r
ession
UU
-
Unconsolidated-Undrained
Triaxia
l
C
U-
Consolidated
-Undr
a
i
ned
T
riax
ial
Job
No.:
Boring:
Block:
Area:
Strength E
stimate
Miniature Vane
Tests
(ksf)
(k
sf)
Penetrom
e
ter
To
rvano
Und
is
turbed
Remolded
Residual
0
.
20
0.80
0
.3
3
1.00
1
.
14
1.00
0
.92
1.10
1
.
85
1.00
1.50
1
.
25
1.50
1
.
02
1
.00
1
.05
1
.
06
1
.00
1
.3
0
TYPE
O
F
FAILURE
A
-
B
u
lge
B
-
S
ingl
e
S
hear
P
lan
e
C
-
Mu
l
tip
le
Shear
Plane
D - Vert
ica
l
Fract
ur
e
~
--
Drawn By
:
tf:,..,,
p
i
Date:
q
rr
/<>I'
0201
-
6505-4
05-Sep-2008 (Ver
.
#5
)
Te
xas Offs
hore
Port System, SPM #2
Anc
hor
Leg #6
A-59
Galvesto
n
Compr
essio
n Test
s
Moi
st
ure
Co
n
fining
Un
distu
rb
ed
R
e
m
olde
d
g
,.
Submerged
FaUUn!
Type
Co
ntent
Pressure
S
trength
Streng
th
Strain
Un
it
Weig
ht
Stra
in
T
ype of
Test
(%)
(psi)
(ksf)
(k
s
l)
(%)
{pcl)
rM
Failure
uu
3
1
6
1
0.77
1
.2
53
11
A
uu
29
120
0
.23
56
uu
29
1
20
0.6
9
1
.
6
56
13
A
u
u
121
0
.2
8
5
6
uu
29
75
1
.
29
1
.
0
55
4
AB
uu
1
21
0
.
39
48
uu
39
8
1
1.
36
0.8
49
6
B
P
lu
s Sig
n
s
[+]
d
en
o
te tests
which
exceede
d
the
ca
p
acity o
f
the
mea
suring
device
.
NP
=
Non
P
last
i
c Mate
r
ial
I
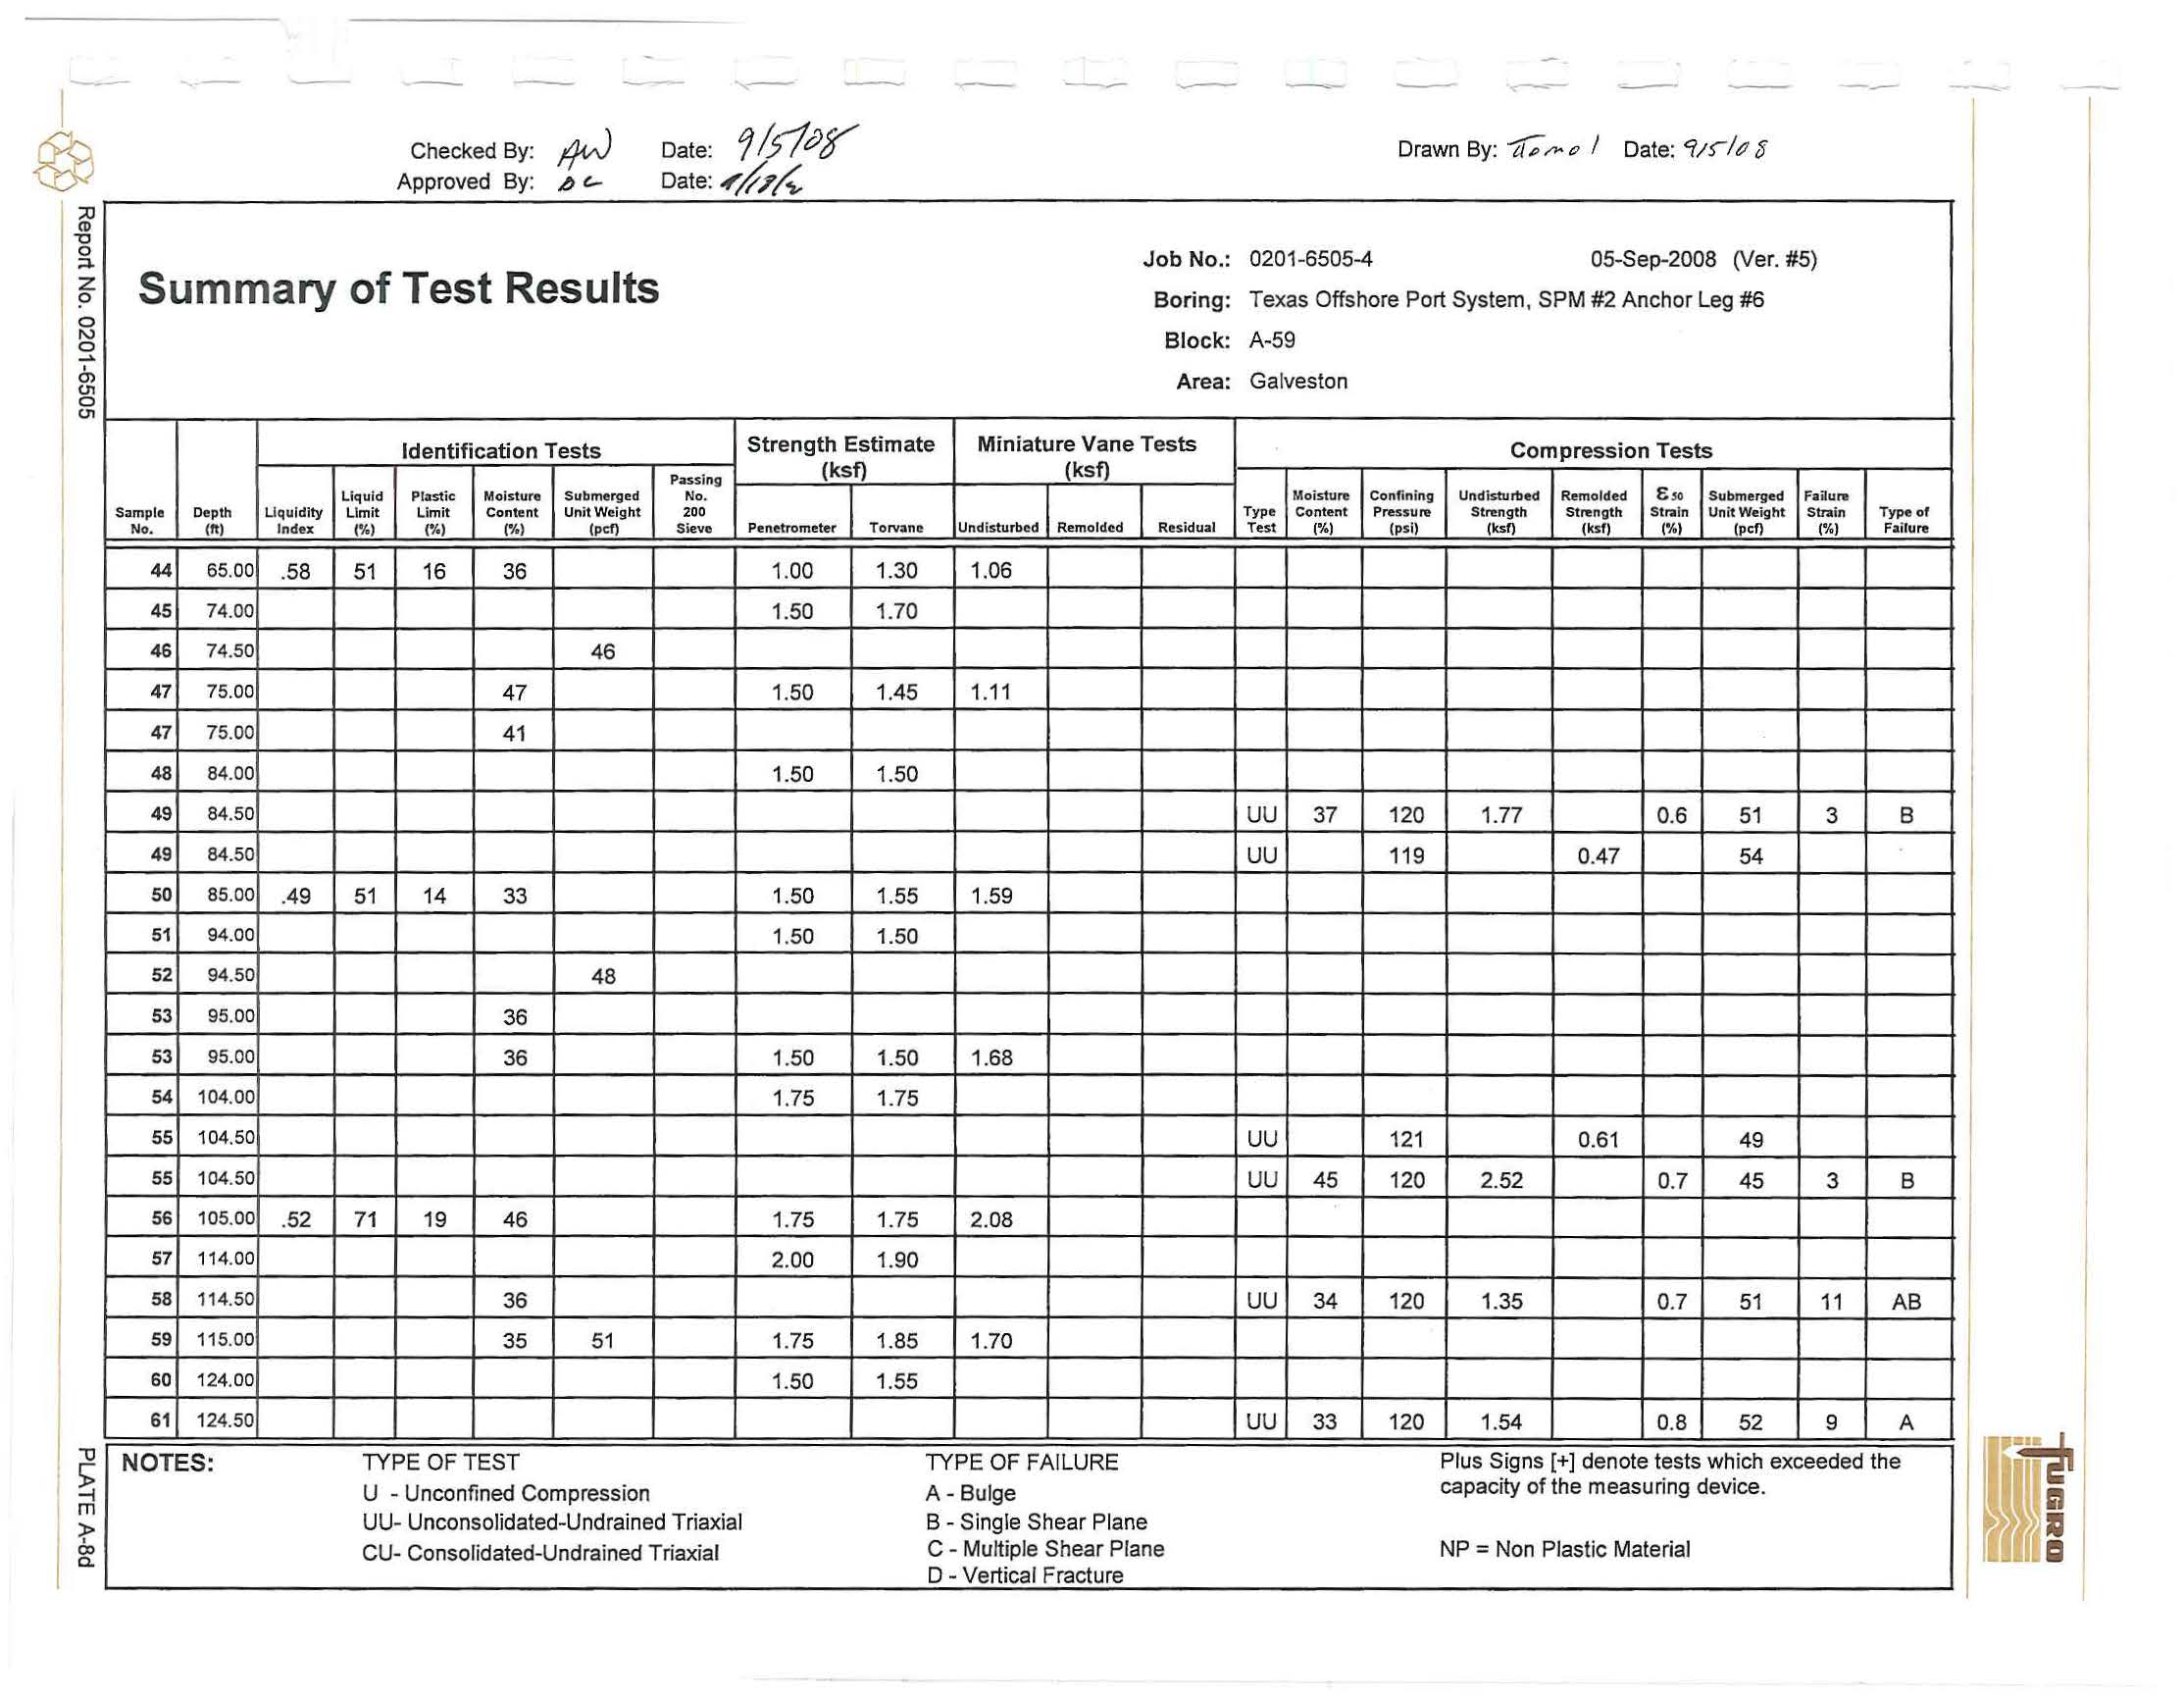
@
~
"C
0
;:i.
z
!='
0
N
~
en
c.n
0
c.n
Ch
e
cked By
:
l}vJ
Approved By
:
b
'-
Date
:
9/51i>r
Date
:
.r,hA:
Job
No.:
Summary of Test Re
s
ults
Boring:
B
lock:
Ar
ea:
Identifica
t
ion
T
e
s
t
s
S
trength
Es
timate
M
ini
atu
re V
a
n
e Tests
Passing
(ksf)
(ksf)
Liquid
Plastic
Moisture
Submerged
No.
Sample
Depth
Liquidity
Limit
L
im
i
t
Content
U
nit We
i
g
h
t
2
00
No.
(ft)
Index
l'M
l'-4)
(%)
(pcf)
Sieve
P
enetrometer
Torvane
Und
is
turbed
Re
m
oldcd
Resid
ual
44
65
.
00
.
58
51
16
36
1
.
00
1
.
30
1
.06
45
74.00
1
.
50
1.70
46
74.50
46
47
75.00
4
7
1
.
50
1
.45
1.1
1
47
75.00
41
48
84.00
1.50
1
.
50
49
84.50
49
84
.
50
50
85.00
.49
51
14
33
1.50
1.55
1.59
51
94
.
00
1
.
50
1.50
52
94.50
48
53
95.00
36
53
95.00
36
1
.
50
1.50
1.68
54
104
.
00
1
.
75
1
.
75
55
104.50
55
104
.
50
56
105
.00
.5
2
71
19
46
1
.
75
1.75
2.08
5
7
114
.
00
2.00
1.90
58
114.50
36
59
115.00
35
51
1
.
75
1.85
1
.
70
60
1
24
.
00
1.50
1
.
55
61
124
.50
N
O
TE
S
:
TYPE OFTEST
TYPE OF FA
I
LURE
U
- Unconfi
n
e
d
Comp
r
ession
A- Bulge
UU- Unconsoli
d
at
ed-
Undra
in
e
d
T
r
iaxia
l
B - Sin
g
le Shear P
l
ane
CU-
Consolidated
-
Und
r
ained
T
r
iaxial
C - Multiple Shear
P
l
ane
D
-
Ve
rt
ical
Fracture
'("
---
Dr
awn
B
y:
"1(;,,..17
I
Date
:
'11s-lt1
g
0201-6505-4
05
-
Sep-20
0
8
0/er.
#5)
Texas Offshore
Port
System, SPM
#2
Anchor
Leg #6
A
-
59
Ga
l
veston
C
o
mpr
essi
on T
ests
Mo
is
t
ure
Confin
ing
Undisturbed
Remolded
e
.,.
Submerged
Failur.
Type
Content
Pressure
Strengt
h
Streng
t
h
Stt'111n
Unit Weight
Strain
Type
or
Test
(
%)
(
psi)
(ksf)
(ks!)
(
%)
(pc!)
(
%)
F
a
il
ure
uu
37
120
1.77
0.6
51
3
B
uu
119
0
.
47
54
uu
12
1
0.61
49
uu
45
120
2.52
0
.
7
45
3
B
uu
34
120
1.35
0
.
7
51
11
AB
uu
33
120
1.54
0
.
8
52
9
A
P
l
us S
i
g
n
s
[+
)
denote tests w
h
ich
excee
d
ed t
h
e
capacity
of the
measur
i
ng de
vi
ce
.
NP
=
Non Plast
ic
Material
;a
<D
"C
0
~
z
?
0
"'
0
...
m
l
g
Checked By:
Date:
Approved By
:
Date:
Summary of Test Results
S.tmple
Depth
LlquJ
d;ty
No.
(II)
Index
61
124.50
62 125.00
.48
63 130.00
64
130.50
65
131
.0
0
NOTES:
Identification Tests
Passing
Liquid
Plastic
Mois1ure
Submerged
No.
Umlt
Ltmit
Content
Unit Weight
200
rJ.J
(%)
(
%)
(pcf)
Sieve
53
16
33
51
53
40
TYPE OFTEST
U - Unconfined
Comp
re
ssion
UU- Unconsolidated
-
Undrained Triaxial
CU-
Consolidated-Undrained
Triaxial
Job
No.:
Boring:
Block:
Area
:
Strength Estimate
Miniature Vane Tests
(ksf)
Penetrom
e
ter
Torvane
1.25
1.60
2.00
1.95
2
.
00
1
.
80
(ksf)
Undisturbed
Remolded
1
.
55
2
.
38
TYPE OF FAILURE
A-
Bulge
Residual
B
-
Single Shear Plane
C -
Multip
l
e Shea
r Pl
ane
D - Vertical Fracture
...-----
Drawn
By:
rlohl
~
I
Date:
"l/S-/of
0201-6505-4
05-Sep-2008
(I/er.
#5)
Te
xas
Offshore Port System,
SPM
#2 Anchor Leg #6
A-59
Galveston
Moistu~
Confining
TYJ1e
Content
Pressure
Test
(
%)
(psi)
uu
120
Compression
Tests
Undisturbed
Remolded
E
,o
Submerged
Failure
Stre
n
gth
Strength
Stra
i
n
Unit
Weight
Sir.I
In
T
ypeol
(ksl)
(kslJ
rM
(pcf)
(
%
)
Failure
0
.
58
54
Plus Signs
[+)
denote te
s
t
s
which
exceeded
the
capacity
of the measuring device.
NP
=
Non
Plastic
Material
@
l
;u
I
i
z
?
0
I\.)
~
a,
()1
0
()1
I-
I
(!)
~
Ill
>-
(!)
z
ci5
en
<(
a.
I-
z
UJ
(.)
0:::
a.
UJ
100
90
80
7
0
60
5
0
40
3
0
20
1
0
0
100
~
eked
b
y~
-
-
Date:
---Y-1
s1C0
-
Approved
by
:
~
Date:
,Y
/1'/
~
U.S. STANDARD
SI
E
VE
SIZ
ES
IN INCHES
U.S.
S
TAN
DARD SI
E
V
E NUMBERS
3
2
1 3/4
3/8
4
10
20
40
60
100
I
I
f
-j"--1
r--_
1
'1
:-.......
r\
I
1: ...
I
-r---
~
I
~
\
I
\
I
I
I
\
I
I
\
1
I
I
\
\
I
I
I
\ \
I
I
\
\
I
I
1
I
I
I
\
I
I
I
\
I
I
20
0
I
I
I
I
I
I
I
I
I
I
I
I
\
~
~
t
10
1