69
0
50
100
0
100
150
200
300
250
50
Depth
(cm
)
0
50
100
00
50
100
100
150
200
300
250
50
0
100
150
200
300
250
50
0
50
100
0
100
150
200
300
250
50
% Sand
% Sand
% Sand
% Sand
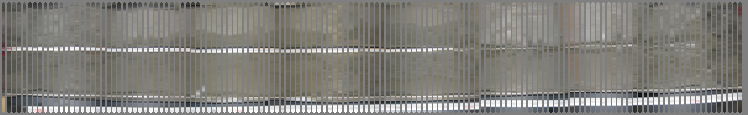
Line 13
Figure 47: Fence Profile for Line 13
70
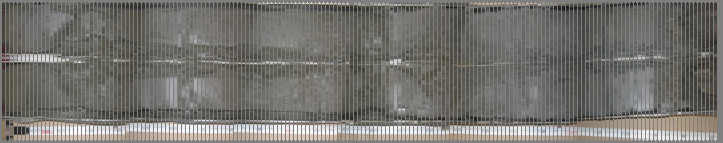
13 A
B
C
D
0cm
300cm
250cm
200cm
150cm
100cm
50cm
0cm
0cm
50cm
100cm
150cm
200cm
250cm
300cm
0cm
50cm
50cm
100cm
100cm
150cm
150cm
200cm
200cm
250cm
300cm
250cm
Figure 48: Core Photographs for Line 13
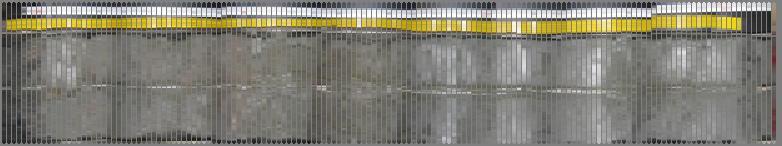
CORE 13D:
Core 13D was taken at a water depth of 9.4m (31ft) (Table 1) and had a total
length of 322cm (126.8in) (Figures 72-85). A total of 13 grain size samples were taken at
depths of 1-10cm (0.4-3.9in), 21-30 (8.3-11.8in), 51-60cm (20-23.6in), 71-80cm (28-
31.5in), 91-100cm(35.8-39.4in), 101-106cm (39.3-41.7in), 106-110cm (41.7-43.3in),
111-120cm (43.7-47.2), 161-170cm(63.3-67in), 201-210cm (78.7-82.7in), 210-220cm
(82.7-86.7in), 261-270cm (102.8-106.3in) and 311-320cm (122.4-126in). Grain size
analyses revealed that the entire length of the core contained less than 36% sand (Table
50). Sand and shell weights are shown in Table 49. Percent sand, silt and clay are shown
in Table 50. Median grain size, mean grain size, skewness and sorting index are shown
in Table 51. Graphs of the results are located in Figures 76-79.
It was determined that core 13D had approximately 0cm (0in) of sediment
contained at least 50% sand.
96
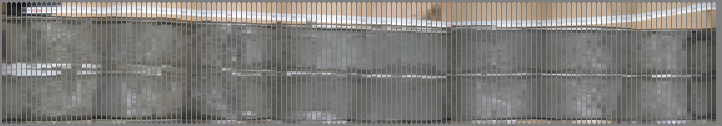
Figure 72: Core log of 13D for depths 0-150cm
Figure 73: Core log of 13D for depths 150-300cm
97
Figure 74: Core log of 13D for depths 300-322cm
Figure 75: Computerized core log for 13D
98
Core
ID
Sample
Depth
(cm)
#10/
2.0mm
Screen
Sample
Weight
(g)
#14/
1.40mm
Screen
Sample
Weight
(g)
N18/
1.00mm
Screen
Sample
Weight
(g)
#25/
710μm
Screen
Sample
Weight
(g)
#35/
500μm
Screen
Sample
Weight
(g)
#45/
355μm
Screen
Sample
Weight
(g)
#60/
250μm
Screen
Sample
Weight
(g)
#80/
180μm
Screen
Sample
Weight
(g)
#125/
125μm
Screen
Sample
Weight
(g)
#170/
90μm
Screen
Sample
Weight
(g)
#200/
75μm
Screen
Sample
Weight
(g)
#230/
63μm
Screen
Sample
Weight
(g)
13D
1-10
8.83
2.25
13D
21-30
7.30
2.86
13D
51-60
20.01
4.65
13D
71-80
11.65
5.41
13D
91-100
6.57
7.95
13D 101-106 0.06 0.04 0.06 0.04 0.02 0.02 0.07 0.24 0.86 6.60 11.23 17.42
13D
106-110
2.16
1.99
13D
111-120
3.42
5.35
13D
161-170
13.31
5.30
13D
201-210
27.08
8.59
13D
210-220
14.01
8.17
13D
261-270
4.46
4.62
13D
311-320
3.34
2.76
Table 47: RO-TAP data for core 13D
99
ASTM
Classification
coarse
sand
medium
sand
medium
sand
medium
sand
medium
sand
fine
sand
fine
sand
fine
sand
fine
sand
fine
sand
fine
sand silt
Wentworth
Classification
granule
very
coarse
sand
very
coarse
sand
coarse
sand
coarse
sand
medium
sand
fine
sand
fine
sand
fine
sand
very
fine
sand
very
fine
sand
very fine
silt
Core ID
Sample
Depth
(cm)
%
finer
than
N10/
2.0mm/
-1.0Φ
Screen
% finer
than
N14/
1.40mm
/ -0.5Φ
Screen
% finer
than
N18/
1.00mm/
0.0Φ
Screen
% finer
than
N25/
710μm
/ 0.5Φ
Screen
% finer
than
N35/
500μm/
1.0Φ
Screen
% finer
than
N45/
355μm
/ 1.5Φ
Screen
% finer
than
N60/
250μm
2.0Φ
Screen
% finer
than
N80/
180μm/
2.5 Φ
Screen
% finer
than
N125/
125μm/
3.0Φ
Screen
% finer
than
N170/
90μm /
3.5Φ
Screen
% finer
than
N200/
75μm /
4.0Φ
Screen
% finer
than
4μm/ 8Φ
Observed
Contents of
the sample
shell
only
shell
only
shell
only
shell
only
shell
only
shell
only
shell
only sand sand sand sand
silt
13D
1-10
78.9
52.7
13D
21-30
82.3
51.9
13D
51-60
64.6
35.8
13D
71-80
81.2
46.2
13D
91-100
91.8
33.3
13D
101-106
99.9
99.9
99.8 99.8 99.8 99.8 99.7 99.5
98.6 92.1 81.1
12.3
13D
106-110
94.7
50.2
13D
111-120
93.1
32.5
13D
161-170
79.2
30.2
13D
201-210
66.7
23.2
13D
210-220
78.1
28.1
13D
261-270
90.8
24.4
Table 48: Percent finer table for core 13D
100
Core ID
Sample Depth (cm)
shell weight
200+ weight
200-230 weight
sand + shell
13D 1-10
8.83
2.25
8.83
13D 21-30
7.30
2.86
7.30
13D 51-60
20.01
4.65
20.01
13D 71-80
11.65
5.41
11.65
13D 91-100
6.57
7.95
6.57
13D 101-106
0.24
19.00
17.42
19.24
13D 106-110