69
0
50
100
0
100
150
200
300
250
50
Depth
(cm
)
0
50
100
00
50
100
100
150
200
300
250
50
0
100
150
200
300
250
50
0
50
100
0
100
150
200
300
250
50
% Sand
% Sand
% Sand
% Sand
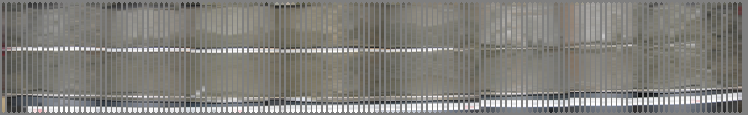
Line 13
Figure 47: Fence Profile for Line 13
70
13 A
B
C
D
0cm
300cm
250cm
200cm
150cm
100cm
50cm
0cm
0cm
50cm
100cm
150cm
200cm
250cm
300cm
0cm
50cm
50cm
100cm
100cm
150cm
150cm
200cm
200cm
250cm
300cm
250cm
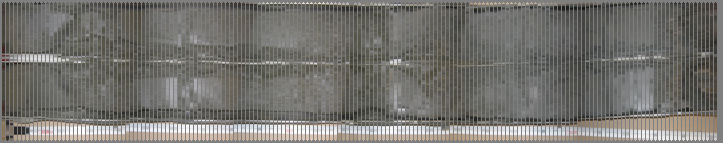
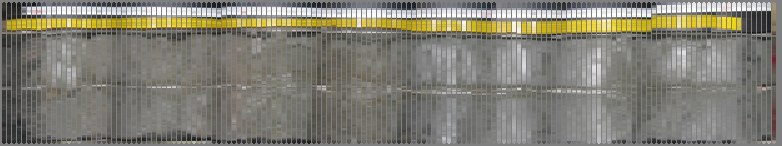
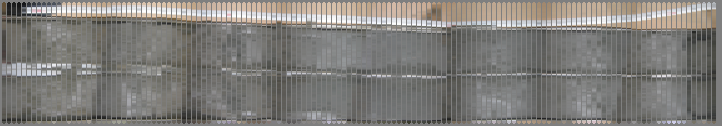
Figure 48: Core Photographs for Line 13
9
CORE 13A:
Core 13A was taken at a water depth of 4.76m (15ft) (Table1) and had a total
length of 318cm (125.2in) (Figures 49-52). A total of 11 grain size samples were taken at
depths of 1-10cm (0.4-3.9in), 31-40cm (12.2 15.7in), 91-100cm (35.8-39.4in), 141-
150cm (55.1-59.1in), 151-160cm (59.4-63in), 201-206cm (78.7-81.1in), 211-220cm
(83.1-86.6in), 244-250cm (96.1-98.4in), 251-260cm (98.8-102.4in), and 311-320cm
(122.4-126in). The top 206cm (81.1in) was observed to be sand, and contained at least
79% sand and had a mean grain size 0.093mm (3.4phi). From depths of 210cm (82.7in)
to 320cm (126in) there is a decrease and then an increase in percent sand ranging from 9
to 92% (Tables 35&36). Sand and shell weights are shown in Table 34. Percent sand, silt
and clay are shown in Table 35. Median grain size, mean grain size, skewness and
sorting index are shown in Table 36. Graphs of the results are located in Figures 53-56.
It was determined that core 13A had approximately 268cm (105.5in) of sediment
contained at least 50% sand, of which 100cm (39.4in) was located shallower than 1m
(39.4in) depth. The average grain size in the upper 1m (3.28ft) was determined to be
0.1062mm.
71
Figure 49: Core Log of 13A for depths 0-150cm
Figure 50: Core Log of 13A for depths 150-300cm
72
Figure 51: Core log of 13A for depths 300-318cm
Figure 52: Computerized core log of 13A
73
Core
ID
Sample
Depth
(cm)
#10/
2.0mm
Screen
Sample
Weight
(g)
#14/
1.40mm
Screen
Sample
Weight
(g)
#18/
1.00mm
Screen
Sample
Weight
(g)
#25/
710μm
Screen
Sample
Weight
(g)
#35/
500μm
Screen
Sample
Weight
(g)
#45/
355μm
Screen
Sample
Weight
(g)
#60/
250μm
Screen
Sample
Weight
(g)
#80/
180μm
Screen
Sample
Weight
(g)
#125/
125μm
Screen
Sample
Weight
(g)
#170/
90μm
Screen
Sample
Weight
(g)
#200/
75μm
Screen
Sample
Weight
(g)
#230/
63μm
Screen
Sample
Weight
(g)
13A 1-10
0.29
0.44
0.43 0.47 0.26 0.36 0.67 1.70 12.03 71.69 14.93 9.36
13A 31-40
3.28
2.49
1.85 1.40 0.66 0.65 1.03 2.46 22.63 90.88 9.55 7.17
13A 91-100
0.00
0.02
0.05 0.08 0.17 0.29 0.24 0.89 37.92 81.41 15.06 1.10
13A 141-150
2.28
1.55
0.91 0.57 0.34 0.38 0.71 1.80 29.51 107.13 24.14 10.17
13A 151-160
0.38
0.27
0.21 0.03 0.11 0.09 0.23 0.50 9.86 59.92 27.36 11.81
13A 201-206
0.01
0.03 0.06 0.09 0.25 0.28 0.64 11.79 82.04 15.42 7.22
13A
211-220
15.19
5.86
13A
244-250
2.08
0.39
13A
251-260
11.22
2.20
13A 261-270
0.00
0.02
0.02 0.03 0.04 0.13 0.44 1.14 20.99 121.35 16.69 7.53
13A 311-320
0.14
0.06
0.02 0.04 0.03 0.12 0.25 0.97 13.48 84.52 11.48 3.57
Table 32: RO-TAP data for core 13A
74
ASTM
Classification
coarse
sand
medium
sand
medium
sand
medium
sand
medium
sand
fine
sand
fine
sand
fine
sand
fine
sand
fine
sand
fine
sand silt
Wentworth
Classification
granule
very
coarse
sand
very
coarse
sand
coarse
sand
coarse
sand
medium
sand
fine
sand
fine
sand
fine
sand
very
fine
sand
very
fine
sand
very fine
silt
Core ID
Sample
Depth
(cm)
%
finer
than
N10/
2.0mm/
-1.0Φ
Screen
% finer
than
N14/
1.40mm
/ -0.5Φ
Screen
% finer
than
N18/
1.00mm/
0.0Φ
Screen
% finer
than
N25/
710μm
/ 0.5Φ
Screen
% finer
than
N35/
500μm/
1.0Φ
Screen
% finer
than
N45/
355μm
/ 1.5Φ
Screen
% finer
than
N60/
250μm
2.0Φ
Screen
% finer
than
N80/
180μm/
2.5 Φ
Screen
% finer
than
N125/
125μm/
3.0Φ
Screen
% finer
than
N170/
90μm /
3.5Φ
Screen
% finer
than
N200/
75μm /
4.0Φ
Screen
% finer
than
4μm/ 8Φ
Observed
Contents of
the sample
shell
only
shell
only
shell
only
shell
only
shell
only
shell
only
shell
only sand sand sand sand
silt
13A
1-10
99.8
99.4
99.0 98.6 98.4 98.1 97.5 96.1
85.8 24.9 12.2
2.3
13A
31-40
97.8
96.2
94.9 94.0 93.6 93.1 92.4 90.8
75.8 15.3
9.0
2.4
13A
91-100
100.0 100.0 100.0 99.9 99.8 99.6 99.4 98.8
72.0 14.5
3.9
1.7
13A
141-150
98.8
97.9
97.4 97.1 96.9 96.7 96.4 95.4
79.4 21.5
8.4
1.7
13A
151-160
99.7
99.5
99.3 99.3 99.2 99.1 98.9 98.5
90.6 42.4 20.3
3.4
13A
201-206
100.0 100.0 100.0 99.9 99.9 99.7 99.5 99.0
90.0 27.3 15.5
4.8
13A
211-220
72.5
31.8
13A
244-250
90.7
37.8
13A
251-260
81.4
40.9
13A
261-270
100.0 100.0 100.0 100.0 99.9 99.9 99.6 99.1
88.1 25.1 16.4
5.7
13A
311-320
99.9
99.8
99.8 99.8 99.8 99.7 99.5 98.6
87.5 17.3
7.8
2.3
Table 33: Percent Finer table for core 13A
75
Core ID
Sample Depth (cm)
shell weight
200+ weight
200-230 weight
sand + shell
13A 1-10
2.25
101.02
9.36
103.27
13A 31-40
10.33
126.55
7.17
136.88
13A
91-100
0.61
135.52
1.10
136.13
13A
141-150
6.03
163.29
10.17
169.32
13A
151-160
1.09
97.87
11.81
98.96
13A 201-206
0.44
110.17
7.22
110.61
13A
211-220
15.19
5.86
15.19
13A
244-250
2.08
0.39
2.08
13A 251-260
11.22
2.20
11.22
13A
261-270
0.24
160.61
7.53
160.85
13A
311-320
0.41
110.70
3.57
111.11
Table 34: Shell and Sand weights for core 13A