69
0
50
100
0
100
150
200
300
250
50
Depth
(cm
)
0
50
100
00
50
100
100
150
200
300
250
50
0
100
150
200
300
250
50
0
50
100
0
100
150
200
300
250
50
% Sand
% Sand
% Sand
% Sand
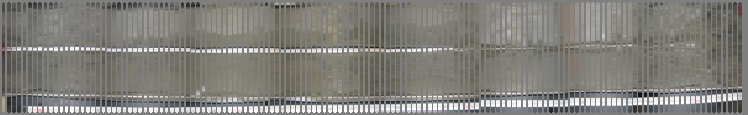
Line 13
Figure 47: Fence Profile for Line 13
70
13 A
B
C
D
0cm
300cm
250cm
200cm
150cm
100cm
50cm
0cm
0cm
50cm
100cm
150cm
200cm
250cm
300cm
0cm
50cm
50cm
100cm
100cm
150cm
150cm
200cm
200cm
250cm
300cm
250cm
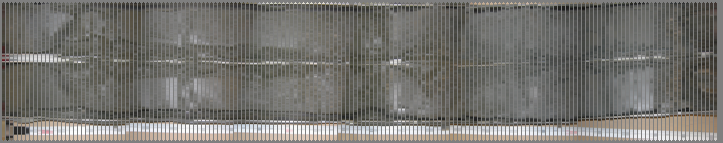
Figure 48: Core Photographs for Line 13
11
CORE 13C:
Core 13C was and taken at a water depth of 7.6m (25ft) (Table 1) and had a total
length of 318cm (125.2in) (Figures 64-67). A total of 22 grain size samples were taken at
depths of 1-10cm (0.4-3.9in) , 11-20cm (4.3- 8.3in) , 21-30cm (8.3-11.8in), 31-40cm
(12.2 15.7in), 41-50cm (16.1-19.7), 51-60cm (20-23.6in), 61-70cm (24-27.6in), 71-
80cm(28-31.5in), 81-90cm(31.9- 35.4in), 91-100cm (35.8-39.4in), 101-111cm (39.3-
43.7in), 121-130cm (47.6-51.2in), 141-150cm (55.1-59.1in), 151-160cm (59.4-63in),
171-180cm (67.3-70.9in), 201-210cm (78.7-82.7in), 241-250cm (94.8-98.4in), 251-
260cm (98.8-102.4in), 271-280cm (106.7-110.2in), 281-290cm (110.6-114.2in), 301-
310cm (118.5-122in). Core 13C contained many layers of sand, muddy sands, sandy
mud and clays. Its overall percent sand varied greatly through out the core ranging from
95 to 14% sand and had a mean grain size that varied similarly (Tables 45&46). Sand and
shell weights are shown in Table 44. Percent sand, silt and clay are shown in Table 45.
Median grain size, mean grain size, skewness and sorting index are shown in Table 46.
Graphs of the results are located in Figures 68-71.
It was determined that core 13C had approximately 165cm (65in) of sediment
contained at least 50% sand, of which 70cm (27.6in) was located shallower than 1m
(39.4) depth. The average grain size in the upper 1m (3.28ft) was determined to be
0.0480mm.
87
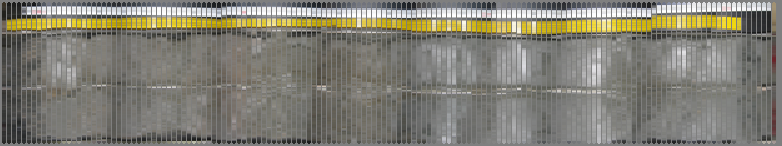
Figure 64: Core log for 13C for depths 0-150cm
Figure 65: Core log for 13C for depths 150-300cm
88
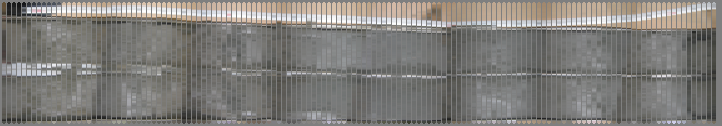
Figure 66: Core log of 13C for depths 300-318cm
Figure 67: Conputerized core log for 13C
89
Core ID
Sample
Depth
(cm)
#10/
2.0mm
Screen
Sample
Weight
(g)
#14/
1.40mm
Screen
Sample
Weight
(g)
#18/
1.00mm
Screen
Sample
Weight
(g)
#25/
710μm
Screen
Sample
Weight
(g)
#35/
500μm
Screen
Sample
Weight
(g)
#45/
355μm
Screen
Sample
Weight
(g)
#60/
250μm
Screen
Sample
Weight
(g)
#80/
180μm
Screen
Sample
Weight
(g)
#125/
125μm
Screen
Sample
Weight
(g)
#170/
90μm
Screen
Sample
Weight
(g)
#200/
75μm
Screen
Sample
Weight
(g)
#230/
63μm
Screen
Sample
Weight
(g)
13C
1-10
37.23
7.25
13C
11-20
5.53 3.83 2.26 1.46 0.73 0.45 0.89 2.70 12.15 45.94 18.60
9.21
13C
21-30
15.53
3.61
13C
31-40
37.60
4.43
13C
41-50
25.64
3.76
13C
51-60
28.91
2.39
13C
61-70
39.55
0.92
13C
71-80
0.00 0.03 0.03 0.04 0.04 0.11 0.24 0.56
8.08 44.22 18.39
2.85
13C
81-90
10.34
5.53
13C
91-100
5.74
1.55
13C
101-111
0.00 0.02 0.02 0.04 0.04 0.02 0.13 0.76 41.10 89.73 6.18
5.83
13C
121-130
0.05 0.01 0.02 0.04 0.05 0.04 0.15 0.33 61.52 17.23 4.70
0.51
13C
141-150
0.00 0.00 0.05 0.02 0.03 0.06 0.09 0.26 10.96 68.46 5.11
1.54
13C
151-160
0.00 0.03 0.02 0.04 0.01 0.02 0.09 0.26 30.78 35.79 3.85
0.76
13C
161-170
0.28 0.12 0.31 0.17 0.11 0.05 0.07 0.32 69.95 36.48 2.11
2.99
13C
171-180
23.47
4.71
13C
201-210
12.03
3.18
13C
241-250
11.18
7.97
13C
251-260
0.01 0.03 0.04 0.06 0.08 0.05 0.09 0.24
2.17 43.90 31.85 13.58
13C
271-280
22.54
6.38
13C
281-290
0.76 0.46 0.46 0.31 0.20 0.16 0.24 0.50
3.12 27.18 12.79 10.76
13C
301-310
18.38
4.76
Table 42: RO-TAP data for core 13C
90
Core ID
Sample
Depth (cm)
% finer
than
N10/
2.0mm/
-1.0Φ
Screen
% finer
than
N14/
1.40mm
/ -0.5Φ
Screen
% finer
than
N18/
1.00mm/
0.0Φ
Screen
% finer
than
N25/
710μm /
0.5Φ
Screen
% finer
than
N35/
500μm/
1.0Φ
Screen
% finer
than
N45/
355μm /
1.5Φ
Screen
% finer
than
N60/
250μm
2.0Φ
Screen
% finer
than
N80/
180μm/
2.5 Φ
Screen
% finer
than
N125/
125μm/
3.0Φ
Screen
% finer
than
N170/
90μm /
3.5Φ
Screen
% finer
than
N200/
75μm /
4.0Φ
Screen
% finer
than 4μm/
8Φ
Observed
Contents of
the sample
shell
only
shell
only
shell
only
shell
only
shell
only
shell
only
shell
only sand sand sand sand
silt
13C
1-10
30.0
13C
11-20
96.6 94.2
92.8 91.9 91.4 91.1 90.6 88.9
81.4 52.8 41.3
20.1
13C
21-30
77.9
44.1
13C
31-40
37.0
18.4
13C
41-50
55.3
26.5
13C
51-60
52.2
26.9
13C
61-70
28.2
16.7
13C
71-80
100.0 100.0
99.9 99.9 99.9 99.8 99.5 99.0
91.2 48.9 31.2
16.4
13C
81-90
79.5
36.8
13C
91-100
84.2
54.6
13C
101-111 100.0 100.0 100.0 100.0 99.9 99.9 99.9 99.5
78.8 33.7 30.6
15.7
13C
121-130
99.9 99.9
99.9 99.9 99.8 99.8 99.6 99.2
32.2 13.4
8.3
4.2
13C
141-150 100.0 100.0
99.9 99.9 99.9 99.8 99.7 99.4
87.4 12.2
6.6
2.6
13C
151-160 100.0 100.0
99.9 99.9 99.9 99.8 99.7 99.4
58.0
9.8
4.6
1.8
13C
161-170
99.8 99.7
99.5 99.4 99.3 99.2 99.2 99.0
47.9 21.3 19.7
9.0
13C
171-180
71.0
28.4
13C
201-210
76.2
30.7
13C
241-250
85.3
36.6
13C
251-260 100.0 100.0
99.9 99.9 99.8 99.8 99.7 99.5
97.7 61.6 35.3
4.9
13C
271-280
62.4
15.4
13C
281-290
99.4 99.0
98.7 98.4 98.3 98.2 98.0 97.6
95.2 73.9 63.9
21.1
13C
301-310
76.1
32.6
Table 43: Percent finer table for core 13C
91
Core ID
Sample Depth (cm)
shell weight
200+ weight
200-230 weight
sand + shell
13C 1-10
37.23
7.25
37.23
13C 11-20
14.26
80.28
9.21
94.54
13C 21-30
15.53
3.61
15.53
13C 31-40
37.60
4.43
37.60
13C 41-50
25.64
3.76
25.64
13C 51-60
28.91
2.39
28.91
13C 61-70
39.55
0.92
39.55
13C 71-80
0.25
71.49
2.85
71.74
13C 81-90
10.34
5.53
10.34
13C 91-100
5.74
1.55
5.74
13C 101-111
0.14
137.90
5.83
138.04
13C 121-130
0.21
83.93
0.51
84.14
13C 141-150
0.16
84.88
1.54
85.04
13C 151-160
0.12
70.77
0.76
70.89
13C 161-170
1.04
108.93
2.99
109.97
13C 171-180
0.00
23.47
4.71
23.47
13C 201-210
0.00
12.03
3.18
12.03
13C 241-250
0.00
11.18
7.97
11.18
13C 251-260
0.27
78.25
13.58
78.52
13C 271-280
0.00
22.54
6.38
22.54
13C 281-290
2.35
43.83
10.76
46.18
13C 301-310
0.00
18.38
4.76
18.38
Table 44: Shell and Sand Weights for core 13C
92
Core ID
sample id
mid sample
depth
% shell
% sand
%silt
%clay
total %
13C 1-10 5.5 70.0 22.4 7.7 100
13C 11-20 15.5 8.9 49.9 21.1 20.1 100
13C 21-30 25.5 22.1 33.8 44.1 100